ELE 488 Fall 2006 Image Processing and Transmission (10-17-06)
Upload
stephany-waltonCategory
view
217download
2
ELE 488 Fall 2006Image Processing and Transmission
Syllabus
1. Human Visual System 2. Image Representations (gray level, color)3. Simple Processing: point operations and filtering 4. Still Image Coding5. Resampling, Resizing, Interpolation, and Registration6. Probability Models, Quantization, Estimating Densities7. Synthesizing Pixels, Segmentation8. Radon Transform, Other imaging modes9. Video, Video Compression 10. Selected Topics: watermarking, feature description, face recognition, . . .
9/19/06
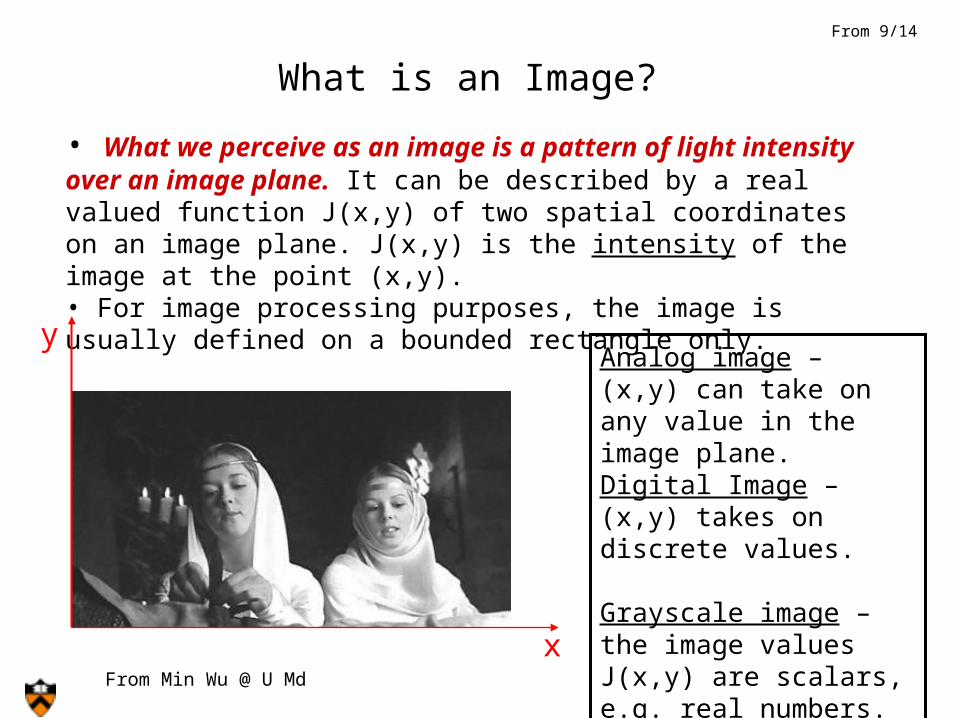
What is an Image?
• What we perceive as an image is a pattern of light intensity over an image plane. It can be described by a real valued function J(x,y) of two spatial coordinates on an image plane. J(x,y) is the intensity of the image at the point (x,y).• For image processing purposes, the image is usually defined on a bounded rectangle only.
x
yAnalog image – (x,y) can take on any value in the image plane.Digital Image – (x,y) takes on discrete values.
Grayscale image – the image values J(x,y) are scalars, e.g. real numbers. Color image – J(x,y) is a vector
From 9/14
From Min Wu @ U Md

Light – electromagnetic wave
Visible Light - wavelength between 350nm and 780nm
wavelength

Few objects are of a single colorA color is not necessarily of a single wavelength
Energy distribution of light
From Kodek

Human Vision System
• Visible spectrum• brightness• color• limit of vision• seeing imperfections• sensitivity: ~ 3photons• range : 10 order of
magnitude • (range of hearing: 7
order)
dot
dot
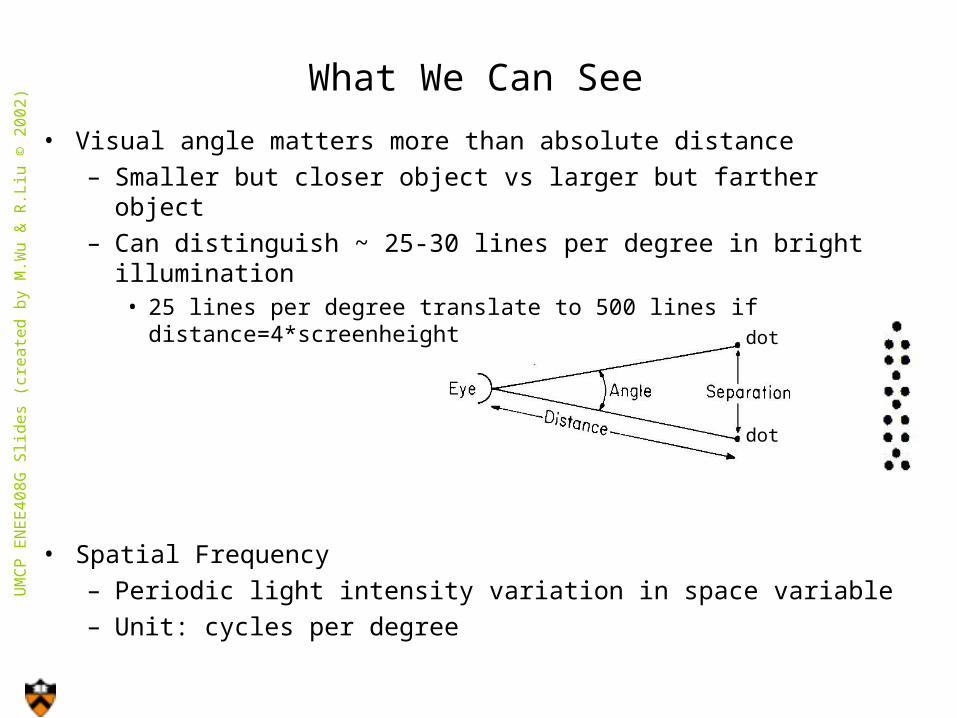
What We Can See
• Visual angle matters more than absolute distance– Smaller but closer object vs larger but farther object– Can distinguish ~ 25-30 lines per degree in bright illumination
• 25 lines per degree translate to 500 lines if distance=4*screenheight
• Spatial Frequency– Periodic light intensity variation in space variable– Unit: cycles per degreeU
MC
P E
NE
E4
08
G S
lide
s (c
rea
ted
by
M.W
u &
R.L
iu ©
20
02
)

What We Can See
Variables: frequency, contrast
From Netravali-Haskall Ch 4

What We Can See
From Netravali-Haskall Ch 4

Human EyeLIGHT
ConeRod
How Do We See – Color and Acuity
Two types of receptors~200 million Rods – brightness~ 10 million Cones – color B <10%, G ~30%, R ~60%
only 1 million ganglion cells to carry information to the brain
Neural Structure of Retina
COMPRESSIONCOMPRESSION

Two Types of Photoreceptors at Retina
~ 200 million rods - sensitive to brightness
~ 7 million cones - sensitive to color (red, green, blue)

Rela
tive S
ensi
tivit
y
Wavelength [nm]
400 500 600 7000
0.5
1.5
1.0
Spectral Response of R, G, B Cones

Two Types of Photoreceptors at Retina
• Rods– Large quantity (~ 100 million)– Provide scotopic vision (i.e., dim light vision or at low illumination)– Only extract luminance information and provide a general overall
picture• Cones
– Densely packed in fovea (center of retina)– Much fewer (~ 6.5 million) and less sensitive to light than rods– Provide photopic vision (i.e., bright light vision or at high
illumination)– Help resolve fine details as each cone is connected to its own
nerve end– Responsible for color vision
• Mesopic vision – provided at intermediate illumination by both rod and cones
UM
CP
EN
EE
63
1 S
lide
s (c
rea
ted
by
M.W
u ©
20
01
/20
04
)

Brightness Discrimination
I = luminance (light intensity) of screen
Δ Ic = increment illumination discriminable 50% of time
Weber’s Law: Δ Ic / I = constant ≈ 0.02
Brightness and Intensity
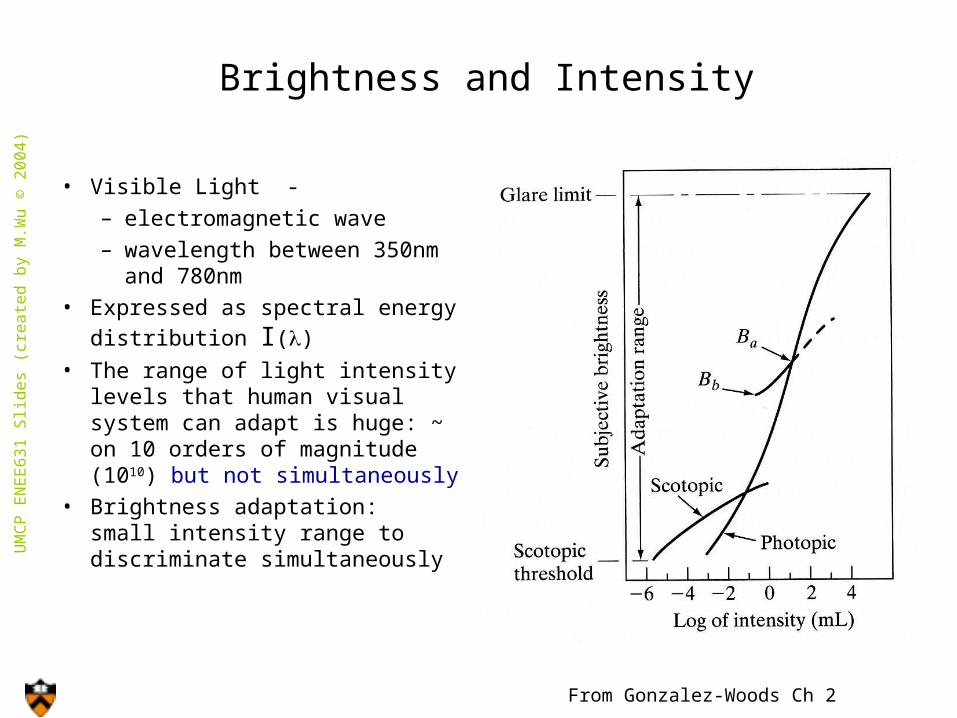
• Visible Light - – electromagnetic wave– wavelength between 350nm
and 780nm • Expressed as spectral energy
distribution I()
• The range of light intensity levels that human visual system can adapt is huge: ~ on 10 orders of magnitude (1010) but not simultaneously
• Brightness adaptation: small intensity range to discriminate simultaneously
UM
CP
EN
EE
63
1 S
lide
s (c
rea
ted
by
M.W
u ©
20
04
)
From Gonzalez-Woods Ch 2

Luminance vs. Brightness
• Luminance (or intensity)– Independent of the luminance of surroundings
I(x,y,) -- spatial light distributionV() -- relative luminous efficiency func. of visual system ~ bell shape
(different for scotopic and photopic vision)• Brightness
– Perceived luminance– Depends on surrounding luminance
Same lum. Different brightness
Different lum.
Similar brightness
UM
CP
EN
EE
63
1 S
lide
s (c
rea
ted
by
M.W
u ©
20
01
/20
04
)

Mach Bands
• Visual system tends to undershoot or overshoot around the boundary of regions of different intensities
Demonstrates the perceived brightness is not a simple function of light intensity
Figure is from slides at Gonzalez/ Woods DIP book website (Chapter 2)
UM
CP
EN
EE
63
1 S
lide
s (c
rea
ted
by
M.W
u ©
20
04
)
From Gonzalez-Woods Ch 2
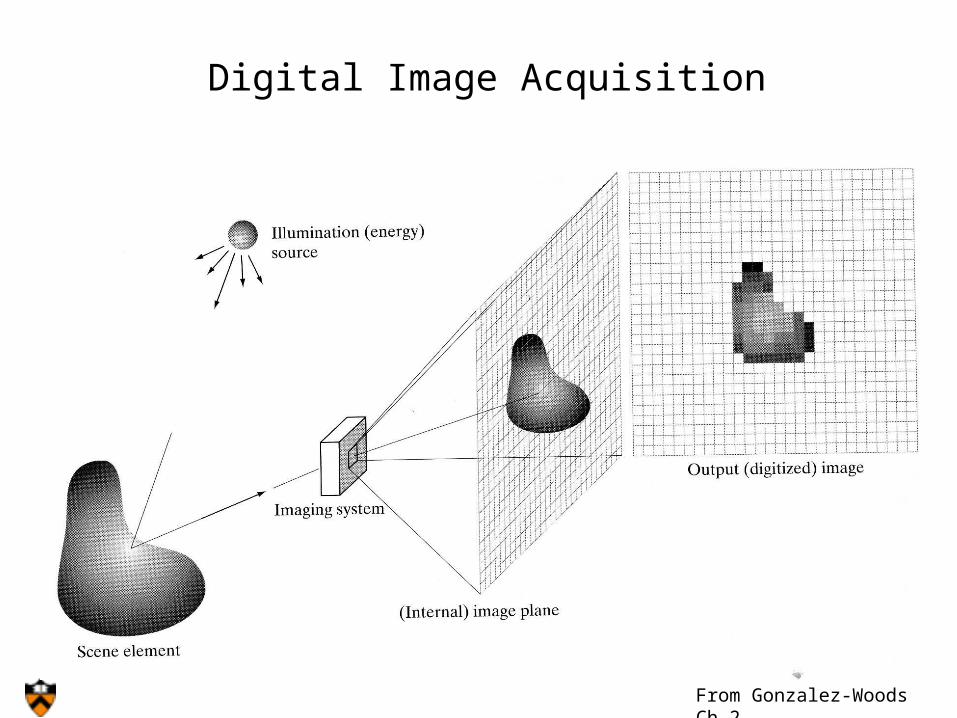
Digital Image Acquisition
From Gonzalez-Woods Ch 2

Scanning, Sampling and Quantization
From Gonzalez-Woods Ch 2

Analog and Digital Images
From Gonzalez-Woods Ch 2

Color of Light
• Perceived color depends on spectral content – e.g., 700nm ~ red.
• A color is not necessarily of a single wavelength • A color is defined by its spectral distribution C()• “spectral color” – a light with very narrow bandwidth
• A light with equal energy in all visible bands appears white
“Spectrum” from http://www.physics.sfasu.edu/astro/color.html
UM
CP
EN
EE
40
8G
Slid
es
(cre
ate
d b
y M
.Wu
& R
.Liu
© 2
00
2)

Perceptual Attributes of Color
• Brightness – perceived luminance• Chrominance
– Hue• specifies color tone (redness,
greenness, etc.)• depends on peak wavelength
– Saturation• describes how pure the color is• depends on spread (bandwidth)
of light spectrum • reflects how much white light is
added
• RGB HSV Conversion ~ nonlinear
http://www.mathworks.com/access/helpdesk/help/toolbox/images/color10.shtml
UM
CP
EN
EE
40
8G
Slid
es
(cre
ate
d b
y M
.Wu
& R
.Liu
© 2
00
2)

RGB Primaries and Color Representation
– Use red, green, blue light to represent visible colors
– The contribution from each primary is normalized to [0, 1]
left figure from B.Liu lecture notes @ Princeton, right figure from slides at Gonzalez/ Woods DIP book website
UM
CP
EN
EE
40
8G
Slid
es
(cre
ate
d b
y M
.Wu
& R
.Liu
© 2
00
2)

Absorption of Light by R/G/B Cones
Figure is from slides at Gonzalez/ Woods DIP book website (Chapter 6)
UM
CP
EN
EE
63
1 S
lide
s (c
rea
ted
by
M.W
u ©
20
04
)

Representation by Three Primary Colors
• Any color can be reproduced by mixing an appropriate set of three primary colors (Thomas Young, 1802)
• A color is defined by its spectral distribution C()• Three types of cones
– Response Si() has peaks around 450nm (blue), 550nm (green), 620nm (yellow-orange)
– Color sensation depends on the spectral response {1(C),
2(C), 3(C) } rather than the complete light spectrum C()
S1() C() d
S2() C() d
S3() C() d
C()
color light
1(C)
2(C)
3(C)
Identically perceived colors if i (C1) = i (C2)
UM
CP
EN
EE
63
1 S
lide
s (c
rea
ted
by
M.W
u ©
20
01
/20
04
)
From M Wu @ U Md

Example: Seeing Yellow Without Yellow
mix green and red light to obtain perception of yellow, without shining a single yellow photon
520nm 630nm570nm
=
UM
CP
EN
EE
40
8G
/63
1 S
lide
s (c
rea
ted
by
M.W
u &
R.L
iu ©
20
02
/20
04
)
“Seeing Yellow” figure from B.Liu lecture notes @ Princeton; R/G/B cone response from slides at Gonzalez/ Woods DIP book website

Color Matching and Reproduction
• Given three ‘primary’ colors with Pk (), k=1,2,3
• Mixture of three primaries: C = Sum( k Pk () )
• To match a given color C1
– adjust k such that i (C1) = i (C), i = 1,2,3.
• Tristimulus values: Tk (C)
– Tk (C) = k / wk
wk – the amount of kth primary to match the reference white
• Chromaticity: tk = Tk / (T1+T2+T3)
– t1+t2+t3 = 1
– visualize (t1, t2 ) to obtain chromaticity diagram
UM
CP
EN
EE
63
1 S
lide
s (c
rea
ted
by
M.W
u ©
20
01
)

Other Color Coordinates
• CIE XYZ system
x = X / (X + Y + Z),
y = Y / (X + Y + Z),
z = Z / (X + Y + Z),
x + y + z = 1
• Color gamut of 3 primaries
– Colors on line C1 and C2 can be produced by linear mixture of the
two– Colors inside the triangle gamut
can be reproduced by three
primaries
http://www.cs.rit.edu/~ncs/color/t_chroma.html
UM
CP
EN
EE
63
1/4
08
G S
lide
s (c
rea
ted
by
M.W
u &
R.L
iu ©
20
01
/20
02
)

Color Coordinates
• RGB of CIE• XYZ of CIE• RGB of NTSC• YIQ of NTSC• YUV (YCbCr)• CMY
UM
CP
EN
EE
63
1 S
lide
s (c
rea
ted
by
M.W
u ©
20
01
)

Color Coordinate for Printing
• Primary colors for pigment– Defined as one that subtracts/absorbs a
primary color of light & reflects the other two
• CMY – Cyan, Magenta, Yellow – Complementary to RGB– Proper mix of them produces black
UM
CP
EN
EE
40
8G
/63
1 S
lide
s (c
rea
ted
by
M.W
u &
R.L
iu ©
20
02
/20
04
)
Gonzalez – Woods Fig 6.4

Color Components
HSV
YUV
RGB
UM
CP
EN
EE
40
8G
Slid
es
(cre
ate
d b
y M
.Wu
& R
.Liu
© 2
00
2)
From M Wu @ U Md

• Read: Gonzalez-Woods– Chapter 2– Sections 6.1 and 6.2
• Watch for assignments on Blackboard