
EJTIR - d1rkab7tlqy5f1.cloudfront.net faculteit/Afdelingen... · using Factor Analysis (FA) ......
19
EJTIR Issue 2014(4), 2014 pp. 375-393 ISSN: 1567-7141 tlo.tbm.tudelft.nl/ejtir Improving service quality in highway passenger transportation: a case study using quality function deployment Fatma Pakdil 1 , Department of Industrial Engineering, School of Engineering, Başkent University, Turkey Feride Bahar Kurtulmuşoğlu 2 Department of Management, School Faculty of Economics and Administrative Sciences, Başkent University, Turkey The highly competitive market conditions in the passenger transportation industry pressure service provider firms to adopt an attitude of customer-oriented service quality. Even though the service quality of passenger transportation has been a concern in the literature, how the service quality of highway passenger transportation systems could be improved using a systematic approach has not been investigated. Using Quality Function Deployment (QFD), this is the first attempt to improve the quality of highway passenger transportation services. The analysis reveals that the passengers’ most important expectations are employees’ empathetic approach toward customers, technical specifications of buses, error-free services, and competent employees. Additionally, the most important technical requirements are employee-oriented technical requirements, technical specifications of buses, and error-free services in highway passenger transportation. Keywords: quality function deployment, highway passenger transportation, servqual. 1. Introduction The passenger transportation industry is a large contributor to economic value all over the world within various transportation branches such as airlines, maritime, and ground transportation (The European Commission Passenger Transport Statistics Report, 2012). In the passenger transportation industry, service quality is an aspect influencing travel user choices, defined as customer perception of how well a service meets or exceeds expectations (Czepiel 1990, Parasuraman et al, 1988). Increasing quality is likely to be employed as a competitive advantage in services industry. Even though railway and airline transportation branches have been investigated several times in the literature in terms of improving service quality (Bowen and Headley, 2000; Elliott and Roach, 1993; Truitt and Haynes, 1994; Agarwal, 2008), highway passenger transportation services were not examined comprehensively in the same manner. 1 A: Başkent University Bağlıca Kampusu Eskisehir Yolu, Ankara, Turkey, T: +90-312-2466666 E: [email protected] 2 A: Başkent University Bağlıca Kampusu Eskisehir Yolu, Ankara, Turkey T: +90-312-2466666 E: [email protected]
Transcript of EJTIR - d1rkab7tlqy5f1.cloudfront.net faculteit/Afdelingen... · using Factor Analysis (FA) ......
EJTIR Issue 2014(4), 2014
pp. 375-393 ISSN: 1567-7141
tlo.tbm.tudelft.nl/ejtir
Improving service quality in highway passenger transportation:
a case study using quality function deployment
Fatma Pakdil1 , Department of Industrial Engineering, School of Engineering, Başkent University, Turkey
Feride Bahar Kurtulmuşoğlu2
Department of Management, School Faculty of Economics and Administrative Sciences, Başkent University, Turkey
The highly competitive market conditions in the passenger transportation industry pressure service provider firms to adopt an attitude of customer-oriented service quality. Even though the service quality of passenger transportation has been a concern in the literature, how the service quality of highway passenger transportation systems could be improved using a systematic approach has not been investigated. Using Quality Function Deployment (QFD), this is the first attempt to improve the quality of highway passenger transportation services. The analysis reveals that the passengers’ most important expectations are employees’ empathetic approach toward customers, technical specifications of buses, error-free services, and competent employees. Additionally, the most important technical requirements are employee-oriented technical requirements, technical specifications of buses, and error-free services in highway passenger transportation.
Keywords: quality function deployment, highway passenger transportation, servqual.
1. Introduction The passenger transportation industry is a large contributor to economic value all over the world within various transportation branches such as airlines, maritime, and ground transportation (The European Commission Passenger Transport Statistics Report, 2012). In the passenger transportation industry, service quality is an aspect influencing travel user choices, defined as customer perception of how well a service meets or exceeds expectations (Czepiel 1990, Parasuraman et al, 1988). Increasing quality is likely to be employed as a competitive advantage in services industry. Even though railway and airline transportation branches have been investigated several times in the literature in terms of improving service quality (Bowen and Headley, 2000; Elliott and Roach, 1993; Truitt and Haynes, 1994; Agarwal, 2008), highway passenger transportation services were not examined comprehensively in the same manner.
1 A: Başkent University Bağlıca Kampusu Eskisehir Yolu, Ankara, Turkey, T: +90-312-2466666 E: [email protected] 2 A: Başkent University Bağlıca Kampusu Eskisehir Yolu, Ankara, Turkey T: +90-312-2466666 E: [email protected]
EJTIR 14(4), 2014, pp.375-393 376 Pakdil and Kurtulmuşoğlu Improving service quality in highway passenger transportation: a case study using quality function deployment Therefore, the measurement of service quality is a challenging research theme for both service providers and regulatory agencies (Hensher et al 2003). Researchers investigated the service quality of various types of passenger transportation using several approaches. For example, Cavana, Corbett, and Lo (2007) employed SERVQUAL to evaluate rail service quality in New Zealand. Tripp and Drea (2002) and Nathanail (2008) investigated the perceptions of customers using railroad services. Fick and Ritchie (1991) used SERVQUAL to measure service quality in the travel and tourism industry. Tyrinopoulos and Antoniou (2008), Stradling et al. (2007), Beirão and Cabral (2007), Hu and Jen (2006), Cunningham et al. (1997), Friman (2004), Eboli and Mazzulla (2007) and Pakdil and Aydın (2007) evaluated service quality in various types of passenger transportation. In the literature, service quality is measured primarily from the customer’s perspective since customers are the sole judges of service quality (Zeithaml et al., 1990, Ona et al, 2012). However, the use of a more objective measurement provided by the firm can be useful in improving comprehensive service quality. Therefore, the combination of both types of service quality measures could provide a useful and reliable measurement tool. In the literature, there are particular studies employing both viewpoints to assessing service quality in the passenger transportation industry (Tyrinopoulos and Aifadopoulou, 2008, Eboli and Mazzulla, 2011, Nathanail, 2008). Quality Function Deployment (QFD) is a methodology employing both customers’ and service providers’ viewpoints to design service processes. Although QFD was applied in various types of transportation services, none of them employed QFD in highway passenger transportation services. QFD is a valuable approach as it enables an examination of all of the potential bottlenecks and root causes of service quality issues. According to Gryna (2001), “organizations realized that QFD helps achieve significantly better designs than traditional practices and QFD creates information-intensive atmosphere where communication increases and ideas are exchanged freely” (p. 336). Bicknell and Bicknell (1995) define QFD as “a systematic approach mapping the customers’ needs into definable and measurable product and process parameters, using matrices and other quantitative and qualitative techniques” (p. 28). This paper presents a case study using QFD methodology (c.f. Akao, 1990; Re Velle et al., 1998; Bicknell and Bicknell, 1995) to identify customers’ needs and expectations and to improve service quality in passenger transportation industry, as a strategy to promote competitive advantage in highway passenger transportation. It is a case study of a national highway passenger transportation firm in Europe. This study reports the first attempt of how QFD could be implemented for improving the service quality of highway passenger transportation services. As a starting point in this study, current passenger needs and expectations were obtained using a SERVQUAL scale, a model for evaluating customer expectations and perceptions (Parasuraman et al., 1988). Focus group studies were performed and previous company research results about customer needs, expectations, and complaints were examined. All findings were categorized using Factor Analysis (FA) prior to QFD operations. After this examination, derived customer needs and expectations were implemented in the House of Quality (HOQ) and relatively more important needs, expectations, and technical requirements were generated through HOQ. The following section provides a brief overview of the development of QFD. Next, the case study using QFD in the highway passenger transportation industry is introduced. After analyzing the results, the conclusion, the limitations of the case study and suggestions for future research are presented.
EJTIR 14(4), 2014, pp.375-393 377 Pakdil and Kurtulmuşoğlu Improving service quality in highway passenger transportation: a case study using quality function deployment 2. A brief overview of QFD QFD was developed by Yoji Akao in the 1960s and introduced in the 1970s at the Kobe Shipyard of Mitsubishi Heavy Industries Ltd (Akao, 1990). It has been used by major automobile companies such as Toyota Motor Co., General Motors, Ford Motor Co. and their suppliers, as well as other global manufacturers such as Hewlett-Packard and Texas-Instruments during 1980s. Despite the fact that QFD was originally developed by manufacturing firms, QFD can be applied in non-manufacturing firms as well (Ansari & Modarress, 1994). Due to its effectiveness in product and service development and quality management, many QFD applications and studies have been reported in the literature and practices (Chan & Wu, 2002). Re Velle et al (1998) identified QFD as a structured and disciplined process providing a means to identify and to carry the voice of the customer through each stage of product or service development and implementation. Akao (1990) defined QFD as “a method for developing a design quality aimed at satisfying the customer and then translating the customer’s demands into design targets and major quality assurance points to be used throughout the production phase” (p. 3). QFD also utilizes interdisciplinary teamwork in the planning and designing of new or improved products or services (Shillito, 1994). Gryna (2001) stated that “QFD uses a series of interlocking matrixes that translates customers’ needs into product and process characteristics” (p. 336). The flow of QFD is structured in HOQ, converting customer expectations into engineering requirements (Gérson, 2007). The construction of HOQ is performed using six steps: 1) Determining customer needs and expectations; 2) building planning matrix; 3) converting customer needs and expectations into technical requirements; 4) creating relationship matrix; 5) constructing technical correlation matrix; and 6) employing customer evaluations. In the customer needs and expectations section, the firm should hear the voice of their customer. In the planning matrix, relatively more important customer needs and expectations are identified. Afterwards, customer needs and expectations are translated into technical requirements in the design process. After a relationship matrix is constructed to show the relationships between technical requirements and customer expectations, the correlations in the technical correlation matrix and with the relationships matrix are identified using the roof of the HOQ. Using a comparative view of all competitors, the final step is to determine how good the firm is at meeting each customer expectation. 3. A case study using QFD in highway passenger transportation industry
This section depicts how QFD was employed in highway passenger transportation services through a case study. In the following subsections, a description of the implementation of each step of QFD is outlined. The firm selected in the case study is a leading passenger transportation firm, listed in the first three firms in the nation in the number of passengers transported annually. The primary service provided by the firm is intercity passenger transportation using highways. In addition, inner-bus service such as food and beverage services, TV, and internet access are provided by the firm during travel. The firm operates 25 routes with 150 employees and has been in the highway passenger transportation market for 32 years. The competition in the oligopoly market is intense; executives of the firm aim to differentiate their service from their rivals by service improvements, presenting a high-quality service and high price with a strong brand name and product differentiation. For those reasons, the executives need tools and methods with a high potential for discovering bottlenecks and service quality issues in the firm.

EJTIR 14(4), 2014, pp.375-393 378 Pakdil and Kurtulmuşoğlu Improving service quality in highway passenger transportation: a case study using quality function deployment 3.1. Determining customer needs and expectations “A thorough and accurate understanding of customer demands and expectations is the key to possessing a strong competitive advantage in the market place” (Pakdil et al., 2012, p. 1). Therefore, “the main and critical step of QFD method is the identification of the customer expectations” (Bevilacqua et al., 2006, p. 78). Understanding exactly what customers expect is the most crucial step in defining and delivering high-quality service (Zeithaml et al., 1990; 1996), i.e., the customer is the key to defining quality (Hansen, 1990). For this reason, to have a competitive advantage in service, firms should be able to hear the voice of their customer more accurately and earlier than their rivals in the market. To identify customer needs and expectations, three main tools were implemented. First, a focus group session was formed, and customer needs and expectations were derived from focus group manuscripts. Second, the firm documented customer requests and complaints reported by past customers and classified the information, which was used to infer customers’ needs and expectations. Third, a survey was distributed to current customers to identify needs and expectations. Information coming from these three sources was incorporated into HOQ in planning matrix. Ultimately, the repetitive items converged into one unique item. Forming focus group studies “Focus groups are a powerful research tool for collecting qualitative information across many contexts. Information from focus groups also complements quantitative research by illuminating existing data or by generating ideas for new inquiry” (Huston & Hobson, 2008, p. 186). Focus groups offer an opportunity to obtain significant insight regarding the experiences, observations and opinions of group members (Massey, 2011). Focus groups are structured interviews of groups of people intended to develop qualitative information and are performed within structured or semi-structured meeting bases (Huston & Hobson, 2008). Focus groups were used as far back as the 1940s, but they were not used routinely for research until the late 1960s (Easton et al., 2003). The focus group literature emphasizes on the importance of homogeneity and appropriateness of the participants. Morgan (1993) and Cameron (2005) state that the purpose and scale of the research, the heterogeneity of the participants, and reaching the saturation point are mediating factors for determining the number of focus groups. With this in mind, we developed one focus group using seven participants, recruited from undergraduate students who travelled with the firm at least once in the last three months. Their average age was 22 years and the average class standing was a senior. Fifty-seven percent of the participants were female. The undergraduate students were intentionally selected as the sample in the focus group since the ratio of the students was relatively higher than the other customer segments in firm. There are two important root causes for this fact. The first is the limited budgets of the undergraduate students. Second, the unexpected or unplanned travel needs emerging among them seems higher than the other travelers in this firms’ passenger transportation segments. Customer needs and expectations about the firm’s services derived from focus group were utilized in two ways. First, they were directly transferred to planning matrix. Second, they were utilized to develop a questionnaire that was used to identify detailed customer needs and expectations.
Determining customers’ needs and expectations To identify recent customer needs and expectations, a survey was administered to volunteer customers during a highway transportation process of the firm. The questionnaire included items from the SERVQUAL scale, the firm’s data including previous customer requests and complaints reported by past customers, and other items derived from the focus group in this study. The previously validated SERVQUAL scale (Zeithaml et al., 1990) included five main quality

EJTIR 14(4), 2014, pp.375-393 379 Pakdil and Kurtulmuşoğlu Improving service quality in highway passenger transportation: a case study using quality function deployment dimensions to measure service quality; tangibles, reliability, responsiveness, assurance, and empathy as given in Table 1. Table 1. The SERVQUAL dimensions Dimension Description Tangibles Physical facilities, equipment, and appearance of the
personnel Reliability Ability to perform the promised service dependably and
accurately Responsiveness Willingness to help customers and provide prompt service Assurance Knowledge and courtesy of employees and their ability to
inspire trust and confidence Empathy Caring, individualized attention the firm provides its
customers SERVQUAL assumes that quality is a subjective customer evaluation, since service is an experience (Parasuraman et al., 1988; Gronroos, 1990). Therefore, customers’ perceptions are utilized to be a better measure than other performance measures (Akan, 1995). SERVQUAL has a structure comparing customer expectations and perceptions. The questionnaire used in this study had a two-part structure with 38 customer need and expectation items. The first part was designed to determine passengers’ expectations about highway passenger transportation services from the firm, while the second part was designed to measure their perceptions of the same firm. While working on customer need and expectation items, the whole service delivery process were considered pre-service, service, and post-service sections. The 38 items were grouped into three categories: 1) ticketing and reservation process (12 items); 2) transportation process (23 items); and 3) post-transportation process (3 items). Both passenger expectations and perceptions were rated using five-point Likert scale. Perceptions were rated from 1=strongly disagree to 5=strongly agree and expectations were rated from 1=unimportant to 5=very important. SERVQUAL presents general quality dimensions for service industries but, it doesn’t include specific dimensions for each service type. Therefore, the 38-item questionnaire used here was built using SERVQUAL scale, firm database and focus group findings. The sample was taken from current customers who traveled two different routes offered by the firm. Preferred routes were intentionally selected in this study, choosing those with the highest and most consistent volumes. The sample size of 370 was selected to represent the population, which included more than 10 thousand customers annually, giving a 95% confidence level and a 5% error margin (DeVaus, 2000). The pencil and paper survey was conducted for two weeks with 500 passengers during the travelling period. Passengers answered the questionnaires within the last hour of the bus travelling time. The actual response rate was 57%, and the survey was answered by 285 respondents. In terms of demographics, 39% of the sample were between the ages of 21 and 30, 50.2% were male, and 44.2% had an undergraduate degree. For the rival analysis in QFD, 45 passengers from 285 respondents, who had experience with a rival of the firm and simultaneously were travelling the preferred routes, answered the same questionnaire. Similarly, of the passengers of the rival firm, 40.9% were between the ages of 21 and 30, 62.2% were male, and 50% had an undergraduate degree. Reliability analysis was performed to ascertain internal consistency. Cronbach’s Alpha was 0.933 for expectation-related items among recent customers and 0.946 among the rival firm’s customers. Cronbach alpha criterion of 0.7 (Nunnally, 1978) was satisfied in this study.

EJTIR 14(4), 2014, pp.375-393 380 Pakdil and Kurtulmuşoğlu Improving service quality in highway passenger transportation: a case study using quality function deployment To categorize customer needs and expectations, FA was performed on the expectation items. Gryna (2001, p. 336) states that “even with simple products, the number of customer requirements and design requirements can become large, and then the number of relationships to investigate becomes unwieldy”. Gryna suggests using FA, referring to Shin and Kim’s (1997) study that utilizes FA in QFD process. FA is a statistical technique applied to a single set of variables when the researcher is interested in discovering which variables in the set form coherent subsets that are relatively independent of one another (Tabachnick & Fidell, 2001), and it allows a reduction of a large number of observed variables to a smaller number of factors (Gryna, 2001). FA was performed on this sample to eliminate less important or statistically non-significant customer needs and expectations and to categorize important and statistically significant customer needs and expectations. Exploratory FA was done with quartimax rotation through Principal Components Analysis (PCA) on each three categories, which were 1) ticketing and reservation process (12 items), 2) transportation process (23 items), and 3) post-transportation process (3 items). Kaiser-Meyer-Olkin score was 0.903. As seen in Table 2, ticketing and reservation process was divided into two factors: tangibles/responsiveness and accessibility/Internet services. Transportation process was reduced to four factors, which were employees/reliable service, features of buses, rest house/service on the bus, and competency/responsiveness of employees. Post-transportation process was left as a unique factor after FA results. Factor loads and internal consistency coefficients are given in Table 2. The interrelationships between SERVQUAL dimensions and factors are given in Table 3. On one hand, each customer need and expectation was evaluated in HOQ to concentrate on particular customer needs and expectations. On the other hand, each customer need and expectation was utilized under the categories derived from FA to give systematic viewpoint to the decision makers. As well as the advantages of using unique customer needs and expectations, it is better be use categorized needs and expectations to see the broader structure of the customer needs and expectations.
3.2. Building the planning matrix Further steps in QFD required a group of variables within the planning matrix to be calculated in HOQ to determine the most important customer needs and expectations. These variables are the importance rate, the customer rate (current and rival firms), the quality plan score, the rate of level up, the priority factor, the absolute weight, and the relative weight. The planning matrix was constructed by a team including academic moderators from academia and expert members from various functions within the firm.
The importance rates for each customer need and expectation in HOQ were derived from the same survey given above. In the survey, the same sample rated the customer needs and expectations using a Likert scale based on a level of importance (1=unimportant to 5=important). For each customer expectation, mean values were calculated on the basis of scores given by 285 respondents. As shown in Table 4, the importance rates scattered between the visual characteristics of ticketing area with 3.74 as the lowest rate and lost personal belongings services with 4.49 as the highest rate.
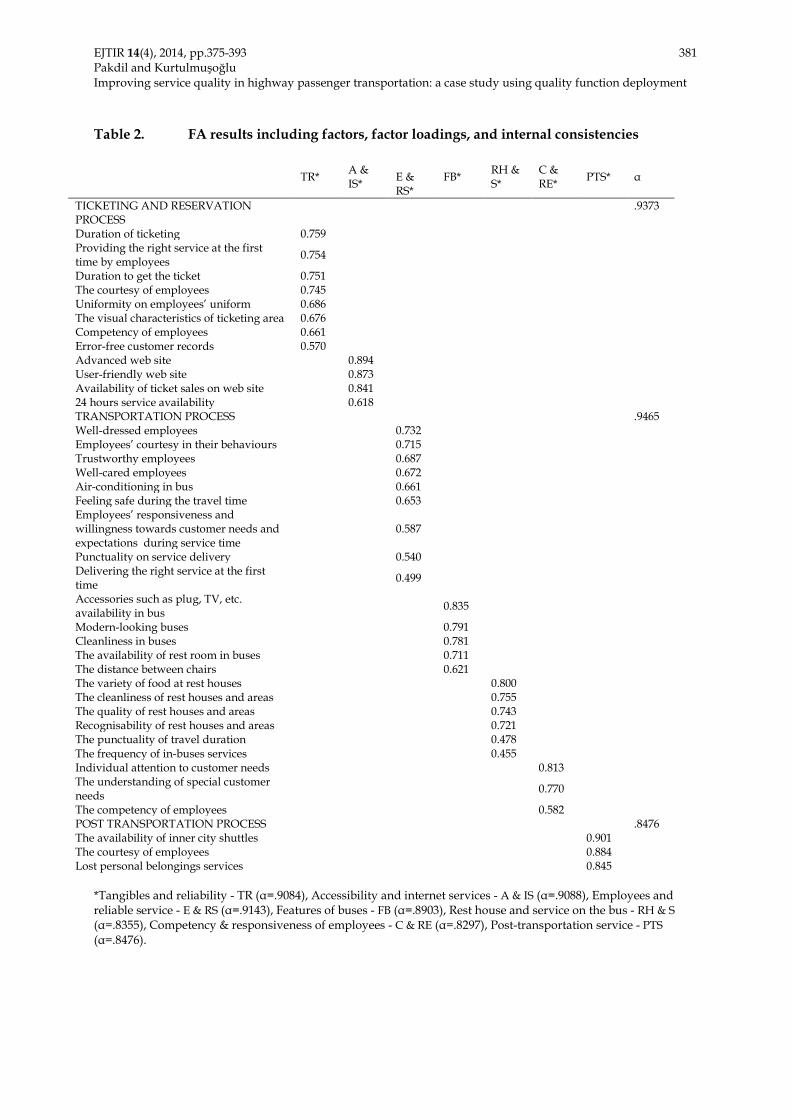
EJTIR 14(4), 2014, pp.375-393 381 Pakdil and Kurtulmuşoğlu Improving service quality in highway passenger transportation: a case study using quality function deployment Table 2. FA results including factors, factor loadings, and internal consistencies
TR* A &
IS*
E & RS*
FB* RH &
S* C & RE*
PTS*
α
TICKETING AND RESERVATION PROCESS .9373
Duration of ticketing 0.759 Providing the right service at the first time by employees 0.754
Duration to get the ticket 0.751 The courtesy of employees 0.745 Uniformity on employees’ uniform 0.686 The visual characteristics of ticketing area 0.676 Competency of employees 0.661 Error-free customer records 0.570 Advanced web site 0.894 User-friendly web site 0.873 Availability of ticket sales on web site 0.841 24 hours service availability 0.618 TRANSPORTATION PROCESS .9465 Well-dressed employees 0.732 Employees’ courtesy in their behaviours 0.715 Trustworthy employees 0.687 Well-cared employees 0.672 Air-conditioning in bus 0.661 Feeling safe during the travel time 0.653 Employees’ responsiveness and willingness towards customer needs and expectations during service time
0.587
Punctuality on service delivery 0.540 Delivering the right service at the first time 0.499
Accessories such as plug, TV, etc. availability in bus 0.835
Modern-looking buses 0.791 Cleanliness in buses 0.781 The availability of rest room in buses 0.711 The distance between chairs 0.621 The variety of food at rest houses 0.800 The cleanliness of rest houses and areas 0.755 The quality of rest houses and areas 0.743 Recognisability of rest houses and areas 0.721 The punctuality of travel duration 0.478 The frequency of in-buses services 0.455 Individual attention to customer needs 0.813 The understanding of special customer needs 0.770
The competency of employees 0.582 POST TRANSPORTATION PROCESS .8476 The availability of inner city shuttles 0.901 The courtesy of employees 0.884 Lost personal belongings services 0.845
*Tangibles and reliability - TR (α=.9084), Accessibility and internet services - A & IS (α=.9088), Employees and reliable service - E & RS (α=.9143), Features of buses - FB (α=.8903), Rest house and service on the bus - RH & S (α=.8355), Competency & responsiveness of employees - C & RE (α=.8297), Post-transportation service - PTS (α=.8476).

EJTIR 14(4), 2014, pp.375-393 382 Pakdil and Kurtulmuşoğlu Improving service quality in highway passenger transportation: a case study using quality function deployment Table 3. The interrelations between SERVQUAL dimensions and factors
SERVQUAL DIMENSIONS Factors Tangibles Reliability Responsiveness Assurance Empathy Tangibles and Reliability
Accessibility and Internet services
Employees and reliable service
Features of buses
Rest house and service on the bus
Competency and responsiveness of employees
Post-transportation service
To calculate the customer rates of planning matrix, both current customer satisfaction and the competitors’ customer satisfaction levels were computed on the basis of the gap scores in SERVQUAL within the same sample. In this step, for each customer need, the gap scores were calculated as the mathematical difference between perception and expectation score given by each customer, where i is the item of customer needs and expectations and m is the number of customer. Then, mean values for each expectation were calculated as given in Formula 1. Customer rates are given in Table 4 in planning matrix.
𝑀𝑀𝑀𝑀𝑀𝑀𝑀𝑀 𝑣𝑣𝑀𝑀𝑣𝑣𝑣𝑣𝑀𝑀𝑖𝑖 = ∑ (𝑃𝑃𝑃𝑃𝑃𝑃𝑃𝑃𝑃𝑃𝑃𝑃𝑃𝑃𝑖𝑖𝑃𝑃𝑃𝑃𝑖𝑖−𝐸𝐸𝐸𝐸𝑃𝑃𝑃𝑃𝑃𝑃𝑃𝑃𝐸𝐸𝑃𝑃𝑖𝑖𝑃𝑃𝑃𝑃𝑖𝑖)𝑚𝑚
𝑖𝑖=1𝑚𝑚
(1)
For the quality plan scores, the customer rates, namely gap scores in SERVQUAL, emerged from current customer expectations, and perceptions were taken into consideration. The team members managing QFD studies in the firm assigned quality plan scores and took into account their views about the quality targets. Furthermore, the mission, goals, and strategic priorities of the firm as well as the features of the target market were reflected in the quality plan scores in HOQ. A 5-point Likert scale was utilized to score the quality plan points in HOQ (1= unimportant to 5=very important). In the next step in planning matrix, rate of level up scores were calculated as given in Formula 2.
iii CRQPRL ÷= , i=1,2,…., n (2) where n is the number of customer expectation, RLi is the rate of level up, QPi is the quality plan score, and CRi is the current customer rate. Rate of level up values indicate where customer needs and expectations need to be improved in the view of customers. This calculation showed where the firm was relatively unsuccessful in meeting the customer expectations (Pakdil et al., 2012).

EJTIR 14(4), 2014, pp.375-393 383 Pakdil and Kurtulmuşoğlu Improving service quality in highway passenger transportation: a case study using quality function deployment Table 4. Planning Matrix
Factors CUSTOMER NEEDS AND
EXPECTATIONS
Impo
rtan
ce
Rate
Cus
tom
er
rate
-firm
Cus
tom
er
rate
-riv
al
Qua
lity
plan
Ra
te o
f le
vel u
p
Prio
rity
fa
ctor
Abs
olut
e w
eigh
t
Rela
tive
wei
ght
TICKETING AND RESERVATION PROCESS
Tangibles and Reliability
Duration of ticketing 3,81 4,1 4,07 4 0,976 1 3,717 2% Providing the right service at the first time by employees 4,10 4,08 4,09 4 0,980 1,2 4,824 2% Duration to get the ticket 3,89 4,03 4,21 4 0,993 1 3,861 2% The courtesy of employees 4,31 4,05 4 5 1,235 1,5 7,982 3% Uniformity on employees’ uniform 3,9 4,06 4,11 5 1,231 1,2 5,764 3% The visual characteristics of ticketing area 3,74 3,91 3,87 5 1,278 1,2 5,740 3% Competency of employees 4,13 4 3,96 5 1,250 1,5 7,744 3% Error-free customer records 4,22 4,06 4 5 1,231 1,2 6,236 3%
Accessibility and Internet services
Advanced web site 4,01 4,03 3,5 4 0,993 1 3,980 2% User-friendly web site 4,04 4,09 3,82 3 0,733 1,2 3,556 2% Availability of ticket sales on web site 4,08 4 4 5 1,25 1,5 7,650 3% 24 hours service availability 4,07 3,99 4 5 1,253 1,5 7,650 3%
TRANSPORTATION PROCESS Employees and reliable service
Well-dressed employees 4,24 4,19 4,16 4 0,955 1,2 4,857 2% Employees’ courtesy in their behaviours 4,4 4,13 4,16 5 1,210 1,5 7,990 4% Trustworthy employees 4,27 3,98 4,24 5 1,256 1,5 8,046 4% Well-cared employees 4,23 4,1 4,16 5 1,220 1,2 6,190 3% Air-conditioning in bus 4,37 4,01 3,87 4 0,998 1,2 5,230 2% Feeling safe during the travel time 4,27 4,05 4,2 4 0,988 1,5 6,326 3% Employees’ responsiveness and willingness towards customer needs and expectations during service time 4,2 3,97 4,11 5 1,260 1,5 7,934 3% Punctuality on service delivery 4,33 4,05 4,26 5 1,235 1,2 6,415 3% Delivering the right service at the first time 4,22 4,1 4,24 5 1,220 1,2 6,176 3%
Features of buses
Accessories such as plug, TV, etc. availability in bus 4,21 4,07 3,98 5 1,229 1,5 7,758 3% Modern-looking buses 4,18 4,03 3,98 4 0,993 1,5 6,223 3% Cleanliness in buses 4,28 4,04 4 5 1,238 1,5 7,945 3% The availability of rest room in buses 3,86 3,79 3,98 4 1,055 1,5 6,110 3% The distance between chairs 4,19 3,79 3,62 4 1,055 1,2 5,306 2%
Rest house and service on the bus
The variety of food at rest houses 4,03 3,89 3,06 3 0,771 1 3,108 1% The cleanliness of rest houses and areas 4,37 4,04 2,98 5 1,238 1,2 6,490 3% The quality of rest houses and areas 4,35 4,08 3,09 5 1,226 1,2 6,397 3% Recognisability of rest houses and areas 4,13 4,02 3,19 4 0,995 1 4,109 2% The punctuality of travel duration 4,40 4,15 4,22 5 1,205 1,2 6,361 3% The frequency of in-bus services 4,01 4,01 4,09 4 0,998 1,2 4,800 2%
Competency and responsiveness of employees
Individual attention to customer needs 3,77 3,87 4,04 5 1,292 1,2 5,845 3% The understanding of special customer needs 3,96 3,86 3,91 5 1,295 1 5,130 2% The competency of employees 4,23 4,03 4,16 5 1,241 1,5 7,872 3%
POST-TRANSPORTATION PROCESS Post-transportation service
The availability of inner city shuttles 4,31 3,64 3,86 3 0,824 1 3,552 2% The courtesy of employees
4,41 4,06 4,05 5 1,231 1,5 8,147 4% Lost personal belongings services 4,49 4,11 3,93 4 0,973 1,2 5,244 2%

EJTIR 14(4), 2014, pp.375-393 384 Pakdil and Kurtulmuşoğlu Improving service quality in highway passenger transportation: a case study using quality function deployment Priority factors refer to whether any improvement is possible in the total sales if the firm better meets customer expectations (Akao, 1990). Since the decision makers were in a proper position to evaluate which customer expectations had a higher probability of increasing the firm sales, priority factors for each customer expectation were assigned by the decision makers using QFD methodology. Points were assigned to determine improvement possibilities: 1 point for no improvement possibility in the sales, 1.2 points for medium improvement possibility, and 1.5 points for strong improvement possibility (Akao, 1990). Table 4 reveals that 14 out of 38 customer needs and expectations were assigned the maximum 1.5 points, based on three customer needs and expectations categories. The ticketing and reservation process was assigned a 1.5 priority score in 1) the courtesy of employees, 2) the competency of employees, 3) the availability of ticket sales on web site, and 4) the 24 hours service availability. The transportation process was prioritized with 1.5 points by the QFD team for 1) employees’ courtesy in their behaviors, 2) trustworthy employees, 3) feeling safe during the travel time, 4) employees’ responsiveness and willingness towards customer needs and expectations during service time, 5) accessories such as plug, TV, etc. availability in buses, 6) modern-looking buses, 7) cleanliness in bus, 8) the availability of rest room in bus, and 9) the competency of employees. In the post-transportation process, the only customer need and expectation assigned with 1.5 points was the courtesy of employees. As the conclusive step in planning matrix, absolute weights and relative weights for each customer expectation item were computed through Formula 3 and 4.
iiii PFRLIRAW ××= i=1,2,…., n (3)
∑=
÷=n
iii AWAWRW1i
i=1,2,…., n (4)
where n is the number of customer expectation, AWi is the absolute weight, IRi is the importance rate score, RLi is the rate of level up, PFi is the priority factor score, and RWi is the relative weight. According to relative weights, the most critical customer expectations in highway passenger transportation in this study were 1) employees’ courtesy in their behaviors (4%), 2) trustworthy employees (4%) in transportation process and 3) the courtesy of employees (4%) in post-transportation process. 3.3. Converting customer needs and expectations into technical requirements QFD is a pro-active “customer-driven planning process” (Chan & Wu, 2002). Hauser and Clausing (1988) stated that QFD increases customer satisfaction by making sure that customer demands are brought into the product development process. To provide increasing customer satisfaction, customer needs and expectations should be transferred into the technical language of the firm. This step is also called the voice of engineering in QFD. While customer needs and expectations indicate what should be produced and done (what to do), technical requirements enlighten how to meet those needs and expectations (how to do) (Büyüközkan & Berkol, 2011). In another words, to achieve the ‘‘whats’’ in QFD, a set of ‘‘hows’’ is generated and added into the columns of HOQ (Utne, 2009). Utne (2009) stated that “going from stakeholder requirements to technical specifications involves transformation of qualitative requirements to quantitative and measurable characteristics” (p. 727). Technical requirements are engineering characteristics that will affect one or more of the customer requirements (Büyüközkan & Berkol, 2011). Twenty-one technical requirements were identified during brainstorming sessions performed by team members managing QFD studies in the firm. Considering each customer need and expectation, team members answered the questions of “how to meet and exceed each customer
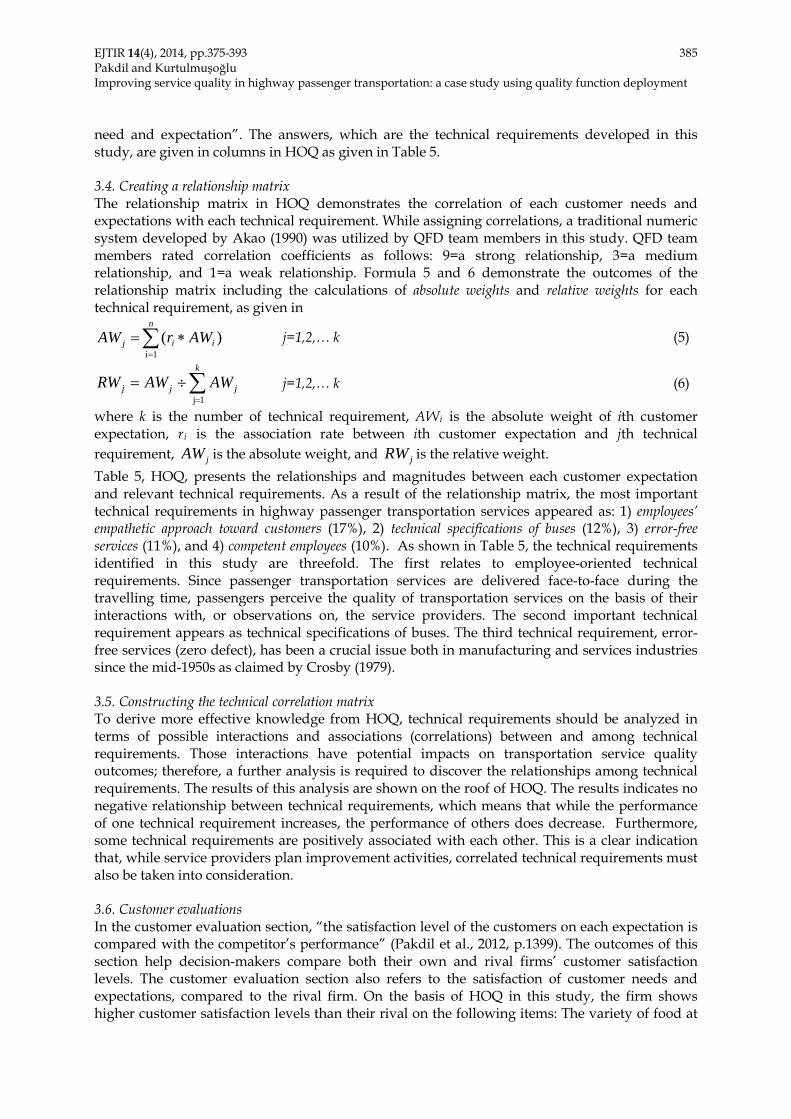
EJTIR 14(4), 2014, pp.375-393 385 Pakdil and Kurtulmuşoğlu Improving service quality in highway passenger transportation: a case study using quality function deployment need and expectation”. The answers, which are the technical requirements developed in this study, are given in columns in HOQ as given in Table 5. 3.4. Creating a relationship matrix The relationship matrix in HOQ demonstrates the correlation of each customer needs and expectations with each technical requirement. While assigning correlations, a traditional numeric system developed by Akao (1990) was utilized by QFD team members in this study. QFD team members rated correlation coefficients as follows: 9=a strong relationship, 3=a medium relationship, and 1=a weak relationship. Formula 5 and 6 demonstrate the outcomes of the relationship matrix including the calculations of absolute weights and relative weights for each technical requirement, as given in
)( 1i∑=
∗=n
iij AWrAW j=1,2,… k (5)
∑=
÷=k
jjj AWAWRW1j
j=1,2,… k (6)
where k is the number of technical requirement, AWi is the absolute weight of ith customer expectation, ri is the association rate between ith customer expectation and jth technical requirement, jAW is the absolute weight, and jRW is the relative weight. Table 5, HOQ, presents the relationships and magnitudes between each customer expectation and relevant technical requirements. As a result of the relationship matrix, the most important technical requirements in highway passenger transportation services appeared as: 1) employees’ empathetic approach toward customers (17%), 2) technical specifications of buses (12%), 3) error-free services (11%), and 4) competent employees (10%). As shown in Table 5, the technical requirements identified in this study are threefold. The first relates to employee-oriented technical requirements. Since passenger transportation services are delivered face-to-face during the travelling time, passengers perceive the quality of transportation services on the basis of their interactions with, or observations on, the service providers. The second important technical requirement appears as technical specifications of buses. The third technical requirement, error-free services (zero defect), has been a crucial issue both in manufacturing and services industries since the mid-1950s as claimed by Crosby (1979). 3.5. Constructing the technical correlation matrix To derive more effective knowledge from HOQ, technical requirements should be analyzed in terms of possible interactions and associations (correlations) between and among technical requirements. Those interactions have potential impacts on transportation service quality outcomes; therefore, a further analysis is required to discover the relationships among technical requirements. The results of this analysis are shown on the roof of HOQ. The results indicates no negative relationship between technical requirements, which means that while the performance of one technical requirement increases, the performance of others does decrease. Furthermore, some technical requirements are positively associated with each other. This is a clear indication that, while service providers plan improvement activities, correlated technical requirements must also be taken into consideration. 3.6. Customer evaluations In the customer evaluation section, “the satisfaction level of the customers on each expectation is compared with the competitor’s performance” (Pakdil et al., 2012, p.1399). The outcomes of this section help decision-makers compare both their own and rival firms’ customer satisfaction levels. The customer evaluation section also refers to the satisfaction of customer needs and expectations, compared to the rival firm. On the basis of HOQ in this study, the firm shows higher customer satisfaction levels than their rival on the following items: The variety of food at
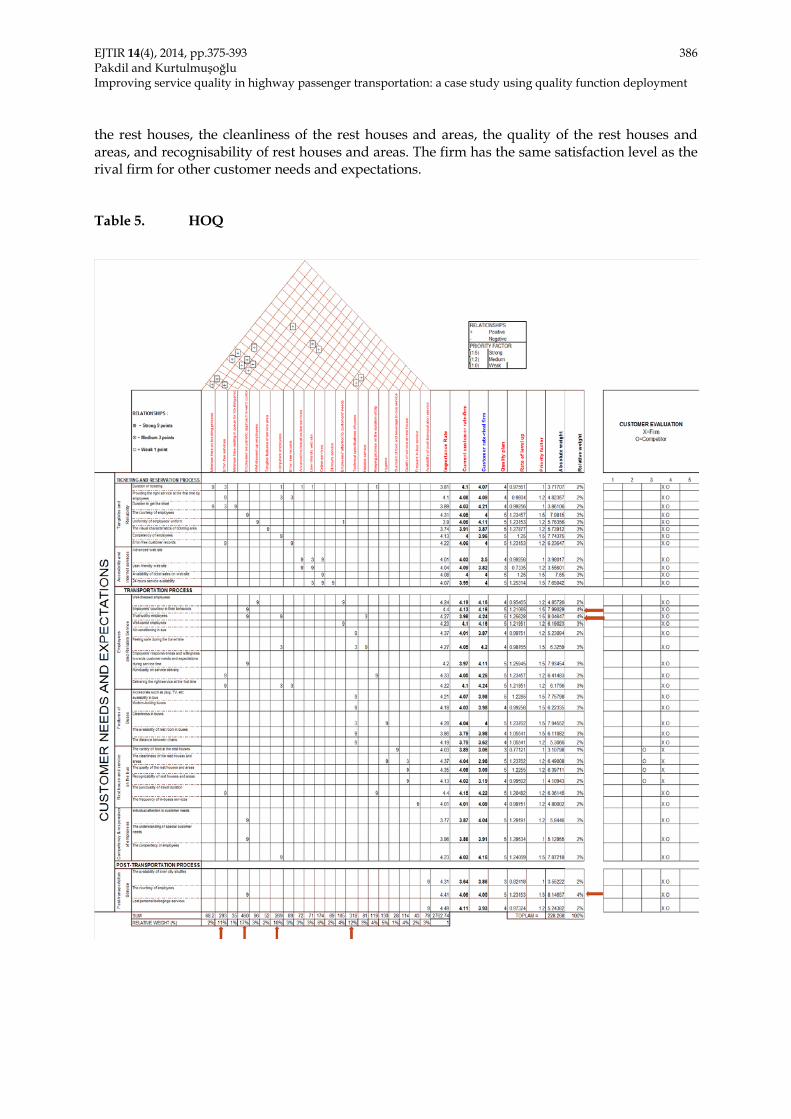
EJTIR 14(4), 2014, pp.375-393 386 Pakdil and Kurtulmuşoğlu Improving service quality in highway passenger transportation: a case study using quality function deployment the rest houses, the cleanliness of the rest houses and areas, the quality of the rest houses and areas, and recognisability of rest houses and areas. The firm has the same satisfaction level as the rival firm for other customer needs and expectations. Table 5. HOQ
EJTIR 14(4), 2014, pp.375-393 387 Pakdil and Kurtulmuşoğlu Improving service quality in highway passenger transportation: a case study using quality function deployment 4. Analysis of the results Employee-oriented needs and expectations are the most important phenomena, demonstrated in the service quality literature (Rosander, 1989). This study reveals from the HOQ that the most critical customer expectations in highway passenger transportation were employees’ courtesy in their behaviors and trustworthy employees in transportation process as well as the courtesy of employees in post-transportation process. It is remarkable that the most important customer needs and expectations are directly related to the customer perceptions of employees’ competency and courtesy. As mentioned in the service quality literature (Rosander, 1989), some technical requirements, such as service time and waiting time for ticketing process are time-based performance characteristics. Additionally, some technical requirements, such as employees’ technical competencies and employees’ behavior toward customers, are employee-based performance characteristics. The important technical requirements in this study are divided into two main performance characteristics: time-based and employee-based performance characteristics. As shown in Table 5, three primary technical requirements were identified in this study. The first is associated with employee-oriented technical requirements. Similarly, Agarwal (2008) found that employee behavior has a maximum effect on satisfaction level of customers on transportation services. While Gautam (2010) stated that being satisfied with the crew was an effective variable on passenger transportation services, Disney (1998) and Friman and Edvardsson (2003) identified the positive effects of employee-related behaviors on passengers’ perceptional quality. The second important technical requirement is the technical bus specifications. As mentioned in Paquette et al. (2009), the fact that technical specifications are among the most important requirements gives an important message to the managers and decision-makers. Huang et al’s (2006) study focuses on these two technical requirements. The third technical requirement, error-free services, is a key determinant of the service quality. Just as interaction with employees is important for higher quality, the technology and quality utilized transportation services should be perceived as a competitive advantage in the passenger transportation industry. Along with the technical and technological advancements in bus manufacturing, this technical requirement makes sense from the customer perspective. This study has some common findings with previous studies. Similar to Eboli and Mazzulla’s (2012a) research, this study reveals that passenger transportation services have a structure that differentiates technical requirements into two branches. The first branch describes the tangible features of the transportation services (error free service and the specifications of the buses) while the second one emphasizes subjective features less easily measurable (competency of employees and empathy of employees). Vanniarajan and Stephen (2008) discovered that empathy is one of the determinants of service quality in transportation services, which was also found in this study. Cirillo et al. (2011) and Vanniarajan and Stephen (2008) also emphasized the competency of employees and the specifications of the buses in the transportation services, similar findings to this study. In another similarity with the previous studies, Nathanail’s (2008) study took into consideration the itinerary accuracy needed for the technical requirement of error free service, as we also found in this study. Although this study resulted in similar findings given in previous studies, there are also some differences. For example, reliability is one of the most important dimensions in service quality
EJTIR 14(4), 2014, pp.375-393 388 Pakdil and Kurtulmuşoğlu Improving service quality in highway passenger transportation: a case study using quality function deployment (Parasuraman et al. 1988, Cirillo et al., 2011; Eboli and Mazzulla, 2010; El-Geneidy et al., 2007). However, reliability was a relatively lower important technical requirement in our study. The environmental impact of the transportation services was not examined in this study, whereas previous studies emphasized the importance of environmental issues (Eboli and Mazzulla, 2010). Frequency of runs and cleanliness have been found to affect service quality in the literature (Eboli and Mazzulla, 2012; Cirillo et al., 2011; Ona et al, 2012; Tyrinopoulos and Antoniou, 2008; Hensher, et al 2003). However, these do not have significant impact of relative weights in our study. According to the results, there is no negative relationship among the various technical requirements. In fact, some technical requirements are positively correlated with each other. For example, “technical specifications of buses” and “reliable service” are positively correlated requirements. Similarly, “technical specifications of buses” and “keeping promise on the duration of trip” are the other positively related technical requirements. Those associations should be paid attention while re-designing the service delivery processes in the firm.
5. Conclusion and discussion Acquiring new customers and retaining existing customers have long been important considerations in gaining competitive advantage. Zeithaml et al. (1996) suggested that increasing customer retention is a major key in generating profits. Eboli and Mazzulla (2012) stated that it is important to provide high quality customized services to retain customers and attract new users. When service quality considered an important factor for creating differentiation in a service industry, the importance of determining the level of service quality provided to customers is emphasized. Increasing service quality is difficult for service firms, compared to those producing goods, because services are intangible, heterogeneous, perishable, and inseparable (Hoffman & Bateson, 2006). Estimating service quality provides service firms with information that allows them to create knowledge that their marketing operations can use appropriately. Among the various types of services, transportation is the largest and fastest growing commercial enterprise globally. The highly competitive market conditions in passenger transportation industry pressure service provider firms to deliver high-quality services and to adopt an attitude promoting service quality. However, service provider firms must first understand customer needs and expectations. They must focus on also delivering the most convenient service to meet customer needs and expectations. Passenger perception of service quality plays a key role in transportation industry. To help passenger transportation firms better understand how the customer views their services relative to their competitors, a heavily customer-driven design of service quality using QFD has been presented in this study. In accordance with the QFD methodology as given in the literature, this study also employed decision-maker contributions to improve service quality. Decision-makers have expert knowledge and experience to enable them to determine which technical requirements should be implemented and how they are associated with each other. To improve customer perceptions of highway passenger transportation services, this paper employs QFD to integrate the voice of consumers and the technical language of highway passenger transportation into HOQ. The analysis in this study shows the factors that are the most important in satisfying consumer voice: “employees’ empathetic approach toward customers”, “technical specifications of buses”, “error-free services”, and “competent employees”. Additionally, the most important technical
EJTIR 14(4), 2014, pp.375-393 389 Pakdil and Kurtulmuşoğlu Improving service quality in highway passenger transportation: a case study using quality function deployment requirements are “employee-oriented technical requirements”, “technical specifications of buses”, and “error-free services”. The QFD methodology we used combines the passengers’ perceptions and transportation service providers’ technical knowledge to improve service quality of the transportation processes. This approach provides a more comprehensive and effective design process to assess and eventually increase the service quality. Additionally, QFD methodology allows decision makers to identify the critical aspects of the customer needs and expectations as well as technical requirements. This approach enables better allocation of resources to deliver higher quality transportation services and to design a greater range of measures to improve service quality. 6. The limitations of the case study and suggestion for future research Some limitations exist, which gives an opportunity for future research to expand on this study. For instance, the sample size of this research and the single focus group employed in the study were restricted by the research time and budget. To improve the representativeness of the sample, future research should increase the sample size. Moreover, this research only interviewed regular passengers, and their requirements may be different to non-regular passengers’ opinions due to their higher familiarity with the passenger transportation services. In addition, the decision to choose bus travel over other forms of travel is an important issue in the transportation industry and needs further study. It was not considered the use of university students for our sample to be a limitation, as the methodology used in this study is generalizable and transferable to other samples. It was thought that the passengers’ educational level was important, affecting both expectations and perceptions for various dimensions. In further research, the sampling profile can be rearranged in a way to eliminate possible bias in terms of educational level. It may be beneficial to discover the differences between QFD methodology along with its outcomes and routine service design approaches utilized by passenger transportation firms. The entire QFD process and its outcomes could be analyzed in terms of various stakeholders of passenger transportation firms. Zak (2011) stated that several stakeholders have competing (contrasting) interests in passenger transportation processes, and the analysis of how QFD methodology may incorporate simultaneously various stakeholders’ interests in one setting would be interesting and exciting. Another opportunity for future research is to apply the survey procedure in various cultures and nations, which would provide a comparison among different cultural profiles in terms of needs and expectations of passengers in a wider manner. Also, there may be significant differences in service expectations among passengers of different ethnic groups or nationalities as well as among passengers with different reasons for travel. Understanding the relationship between highway transportation service quality and profitability is important. However, it is perhaps more useful managerially to identify specific drivers of highway transportation service quality that most relate to the passengers as appropriate marketing strategies can then be formulated.

EJTIR 14(4), 2014, pp.375-393 390 Pakdil and Kurtulmuşoğlu Improving service quality in highway passenger transportation: a case study using quality function deployment References
Agarwal, R. (2008). Public transportation and customer satisfaction: the case of Indian railways. Global Business Review, 9(2), 257-272. Akan, P. (1995). Dimensions of Service Quality: Expectations of Turkish Consumers from Services. Bogazici University Press, Istanbul. Akao, Y. (1990). Quality Function Deployment, Integrating Customer Requirements into Product Design. Productivity Press, New York. Ansari, A. and Modarress, B. (1994). Quality function deployment: the role of suppliers. Journal of Supply Chain Management, 30(4), 27-35. Beirão, G. and Sarsfield‐Cabral, J. A. (2007). Understanding attitudes towards public transport and private car: a qualitative study. Transport Policy, 14(6), 478–489. Bevilacqua, M., Ciarapica, F.E., and Giacchetta G. (2006). A fuzzy-QFD approach to supplier selection. Journal of Purchasing and Supply Management, 12(1), 14-27. Bicknell, B.A. and Bicknell, K.D. (1995). The Road Map to Repeatable Success Using QFD to Implement Change. CRC Press, Boca Raton. Bowen, B. and Headley, D. (2000). Air Travel Consumer Report: The Airline Quality Rating 2000. US Department of Transportation, Washington, DC. Büyüközkan, G. and Berkoll, Ç. (2011). Designing a sustainable supply chain using an integrated analytic network process and goal programming approach in quality function deployment. Expert Systems with Applications, 38 (11), 13731-13748. Cameron J. (2005). Focusing on the focus group. In: Hay I. (ed) Qualitative Research Methods in Human Geography. Oxford University Press, Melbourne. Cavana, R. Y., Corbett, L. M. and Lo, Y.L. (2007). Developing zones of tolerance for managing passenger rail service quality. International Journal of Quality & Reliability Management, 24 (1), 7-31. Chan, L.K. and Wu, M.L. (2002). Quality function deployment: a literature review. European Journal of Operational Research, 143, 463–497. Cirillo, C., Eboli, L. and Mazzulla, G. (2011). On the asymmetric user perception of transit service quality. International Journal of Sustainable Transportation, 5, 216-232. Crosby, P.B. (1979). Quality is Free: The Art of Making Quality Certain. McGraw Hill Custom Publishing, New York. Cunningham, L. F., Young, C. E. and Lee, M. (1997). Developing customer‐based measures of overall transportation service quality in Colorado: quantitative and qualitative approaches. Journal of Public Transportation, 1(4), 1–21. Czepiel, J. A. (1990). Service encounters and service relationships: Implications for research. Journal of Business Research, 20, 13-21. DeVaus, D.A., (2000). Surveys in Social Research. Routledge, London.
EJTIR 14(4), 2014, pp.375-393 391 Pakdil and Kurtulmuşoğlu Improving service quality in highway passenger transportation: a case study using quality function deployment Disney, J. (1998). Competing through quality in transport services. Managing Service Quality, 8 (2), 112-118. Easton, G. Easton, A. and Belch, M. (2003). An experimental investigation of electronic focus groups. Information & Management, 40 (8), 717-727. Eboli, L. and Mazzulla, G. (2007). Service quality attributes affecting customer satisfaction for bus transit. Journal of Public Transportation, 10(3), 21–34. Eboli, L. and Mazzulla, G. (2010). How to capture the passengers’ point of view on a transit service through rating and choice options. Transport Reviews 30 (4), 435-450. Eboli, L. and Mazzulla, G. (2011). A methodology for evaluating transit service quality based on subjective and objective measures from the passenger’s point of view. Transport Policy 18 (1), 172-181. Eboli, L. and Mazzulla, G. (2012). A structural equation modelling for analysing passengers’ perceptions about railway services. Procedia - Social and Behavioral Sciences, 54, 96 – 106. Eboli, L. and Mazzulla, G. (2012a). Performance indicators for an objective measure of public transport service quality. European Transport, 51 (3), 1-21. El-Geneidy, A., Horning, J. and Krizek, K.J. (2007). Using Archived ITS Data to Improve Transit Performance and Management. Minnesota Department of Transportation Research Services Section. Minnesota. Elliott, K.M. and Roach, D.W. (1993). Service quality in the airline industry: are carriers getting an unbiased evaluation from consumers?. Journal of Professional Services Marketing, 9, 71–82. European Commission of Passenger Transport Statistics http:// epp. eurostat. ec. europa.eu /statistics _explained /index.php/Passenger_transport_statistics, retrieved 21.11.12. Fick, G. R. and Ritchie, J. R. B. (1991). Measuring service quality in the travel and tourism industry. Journal of Travel Research, Fall, 2–9. Friman, M. (2004). Implementing quality improvements in public transport. Journal of Public Transportation, 7(4), 49–65. Friman, M. and Edvardsson, B. (2003). A content analysis of complaints and compliments. Managing Service Quality, 13 (1), 20-26. Gautam, P. (2010). Passengers' satisfaction with their travel: a comparative study between the srtu and private sector bus operators in Nagaland. Advances in Management, 3 (1), 26-35. Gérson, T. (2007). Integrating the Kano model and QFD for designing new products. Total Quality Management & Business Excellence, 18, 599-612. Gronroos, C. (1990). Service Management and Marketing: Managing the Moments-of-Truth in Service Competition. Lexington Books, Lexington, MA. Gryna, F.M. (2001) Quality Planning and Analysis: From Product Development Through Use. McGraw-Hill International Edition, New York. Hansen, B. G. (1990). An Analysis of Factors Influencing Quality Perceptions and Purchase of Office Furniture (Ph.D. Dissertation), Virginia Polytechnic Institute and State University, Blacksburg, VA.
EJTIR 14(4), 2014, pp.375-393 392 Pakdil and Kurtulmuşoğlu Improving service quality in highway passenger transportation: a case study using quality function deployment Hauser, J. R. and Clausing, D. (1988). The house of quality. Harvard Business Review, 66(5/6), 63–73. Hensher, D.A., Stopher, P. And Bullock, P. (2003). Service quality––developing a service quality index in the provision of commercial bus contracts. Transportation Research Part A, 37, 499–517. Hoffman, K.D. and Bateson, J.E.G. (2006). Service Marketing. South-Western, USA. Hu, K. C. and Jen, W. (2006). Passengers’ perceived service quality of city buses in Taipei: scale development and measurement. Transport Reviews, 26(5), 645–662. Huang, Y. C., Wu, C. H. and Hsu, J. C. J. (2006). Using importance-performance analysis in evaluating Taiwan medium and long distance national highway passenger transportation highway quality. Journal of American Academy of Business. March, 8 (2), 98-104. Huston, Sally A. and Hobson, Eric H. (2008). Using focus groups to inform pharmacy research. Research in Social and Administrative Pharmacy, 4 (3), 186-205. Massey, O.T. (2011). A proposed model for the analysis and interpretation of focus groups in evaluation research. Evaluation and Program Planning, 34 (1), 21-28. Morgan DL. (1993). Successful Focus Groups: Advancing the State of the Art. Newbury Park: Sage Publications. Nunnally, Jum C. (1978). Psychometric Theory. McGraw Hill, New York. Nathanail, E. (2008). Measuring the quality of service for passengers on the Hellenic Railways. Transportation Research Part A: Policy and Practice. 42(1), 48–66. de Oña, J., de Oña, R. and Calvo, F. J. (2012). A classification tree approach to identify key factors of transit service quality. Expert Systems with Applications, 39(12), 11164-11171. Pakdil, F. and Aydin, Ö. (2007). Expectations and perceptions in airline services: an analysis using weighted SERVQUAL scores. Journal of Air Transport Management, 13 (4), 229-237. Pakdil, F., Işın, F.B. and Genç, H. (2012). A quality function deployment application using qualitative and quantitative analysis in after sales services. Total Quality Management & Business Excellence, 23 (12), 1397-1411. Paquette, J., Cordeau, J.F. and Laporte, G. (2009). Quality of service in dial-a-ride operations. Computers & Industrial Engineering, 56 (4), 1721-1734. Parasuraman, A., Zeithaml, V. and Berry, L. (1988). SERVQUAL: a multiple item scale for measuring consumer perceptions of service quality. Journal of Retailing, 64, 12–40. Re Velle, J.B., Moran, J.W. and Cox, C.A. (1998). The QFD Handbook. John Wiley & Sons, NY. Rosander, A.C. (1989). The Quest for Quality in Services. Quality Press, Milwaukee. Shillito, M.L. (1994). Advanced QFD Linking Technology to Market and Company Needs. John Wiley & Sons, New York. Shin, J-S. and Kim, K-J. (1997). Restructuring a house of quality using factor analysis. Quality Engineering. 9(4), 739-746.
EJTIR 14(4), 2014, pp.375-393 393 Pakdil and Kurtulmuşoğlu Improving service quality in highway passenger transportation: a case study using quality function deployment Stradling, S., Carreno, M., Rye, T. and Noble, A. (2007). Passenger perceptions and the ideal urban bus journey experience. Transport Policy, 14(4), 283–292. Tabachnick, B.G. and Fidell, L.S. (2001). Using Multivariate Statistics. Pearson, New York. Tripp, C. and Drea, J. T. (2002). Selecting and promoting service encounter elements in passenger rail transport. Journal of Services Marketing, 15(5), 432–442. Truitt, L.J. and Haynes, R., (1994). Evaluating Service quality and productivity in the regional airline industry. Transportation Journal, 33, 21–32. Tyrinopoulos, Y. and Antoniou, C. (2008). Public transit user satisfaction: variability and policy implications. Transport Policy, 15(4), 260–272. Utne, I. B. (2009). Improving the environmental performance of the fishing fleet by use of quality function deployment (QFD). Journal of Cleaner Production, 17 (8), 724-731. Vanniarajan, T., and Stephen, A. (2008). Railqual and passenger satisfaction: an empirical study in southern railways. Asia Pacific Business Review, IV(1), January-March, 64-75. Zak, J. (2011). The methodology of multiple criteria decision making/aiding in public transportation. Journal of Advanced Transportation, 45, 1-20. Zeithaml, V.A., Parasuraman, A. and Berry, L.L. (1990). Developing Quality Service: Balancing Customer Perceptions and Expectations. The Free Press, New York. Zeithaml, V.A., Berry, L. and Parasuraman, A. (1996). The behavioral consequences of service quality. Journal of Marketing, 60, 31–52.