EIZO Corporation and Subsidiaries 2 - EIZO Corporation and Subsidiaries Consolidated Balance Sheet...
30
for the Year Ended March 31, 2017 and Independent Auditor's Report EIZO Corporation and Subsidiaries
Transcript of EIZO Corporation and Subsidiaries 2 - EIZO Corporation and Subsidiaries Consolidated Balance Sheet...

for the Year Ended March 31, 2017 and Independent Auditor's Report
EIZO Corporation and Subsidiaries

- 2 -
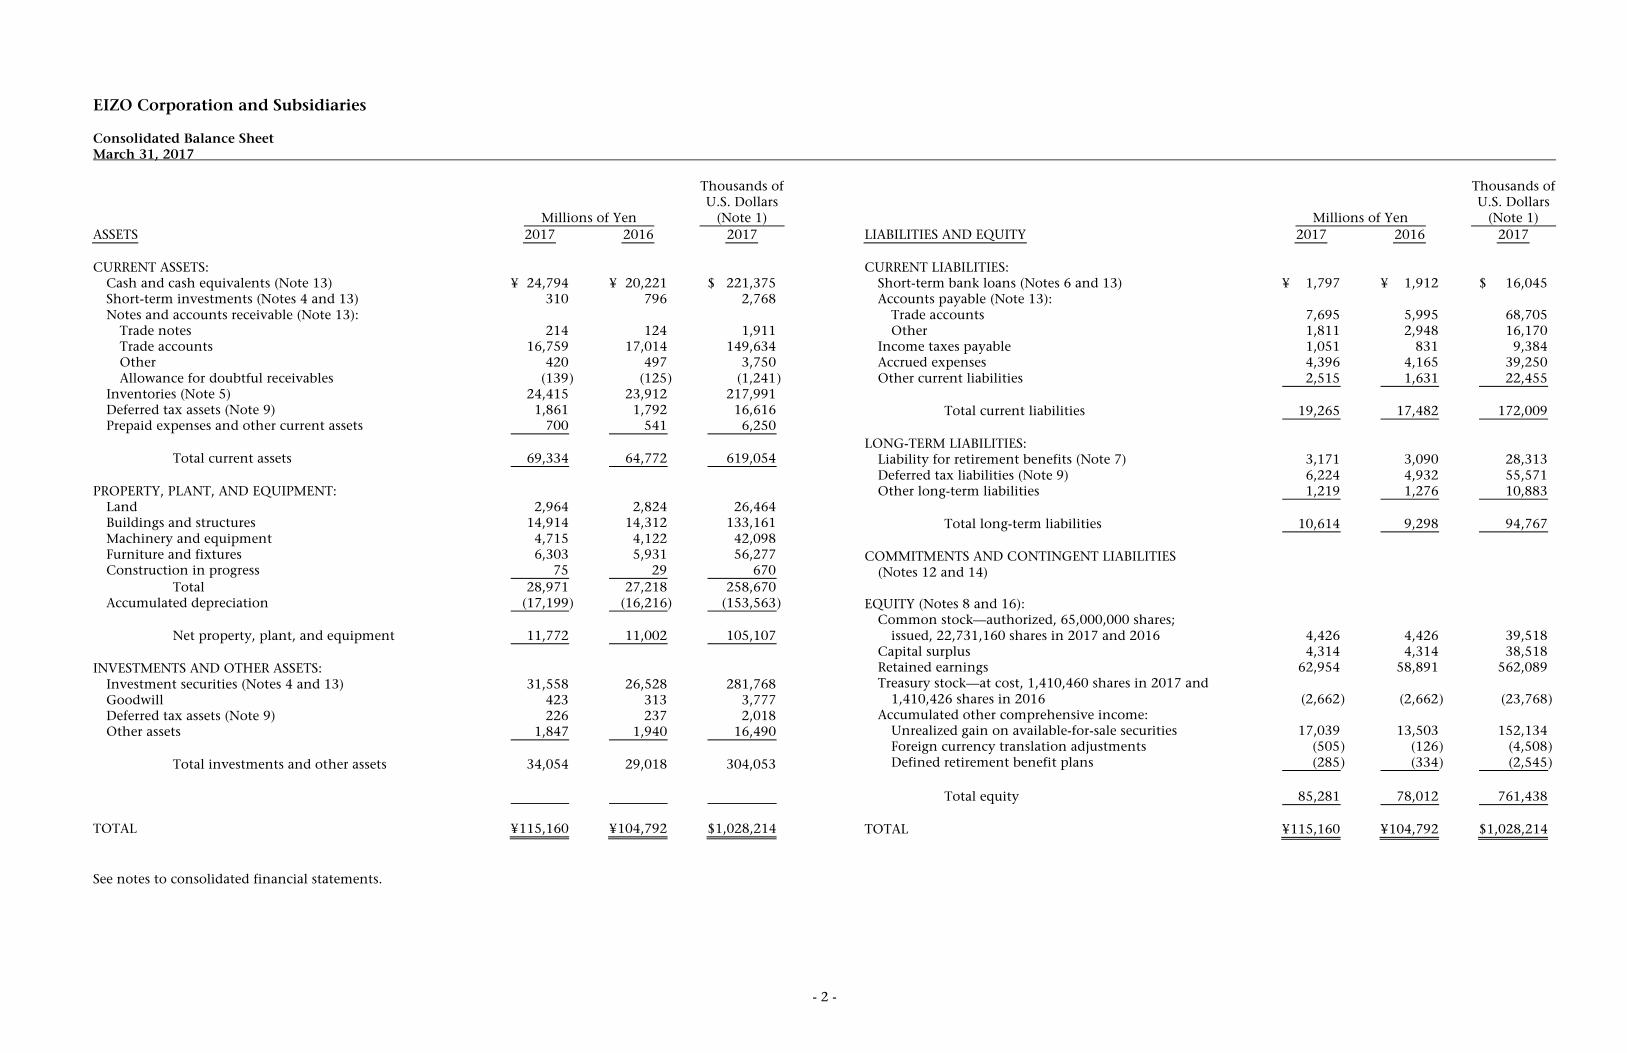
EIZO Corporation and Subsidiaries Consolidated Balance Sheet March 31, 2017
Millions of Yen
Thousands of U.S. Dollars
(Note 1) ASSETS 2017 2016 2017 CURRENT ASSETS: Cash and cash equivalents (Note 13) ¥ 24,794 ¥ 20,221 $ 221,375 Short-term investments (Notes 4 and 13) 310 796 2,768 Notes and accounts receivable (Note 13): Trade notes 214 124 1,911 Trade accounts 16,759 17,014 149,634 Other 420 497 3,750 Allowance for doubtful receivables (139 ) (125 ) (1,241 ) Inventories (Note 5) 24,415 23,912 217,991 Deferred tax assets (Note 9) 1,861 1,792 16,616 Prepaid expenses and other current assets 700 541 6,250 Total current assets 69,334 64,772 619,054 PROPERTY, PLANT, AND EQUIPMENT: Land 2,964 2,824 26,464 Buildings and structures 14,914 14,312 133,161 Machinery and equipment 4,715 4,122 42,098 Furniture and fixtures 6,303 5,931 56,277 Construction in progress 75 29 670 Total 28,971 27,218 258,670 Accumulated depreciation (17,199 ) (16,216 ) (153,563 ) Net property, plant, and equipment 11,772 11,002 105,107 INVESTMENTS AND OTHER ASSETS: Investment securities (Notes 4 and 13) 31,558 26,528 281,768 Goodwill 423 313 3,777 Deferred tax assets (Note 9) 226 237 2,018 Other assets 1,847 1,940 16,490 Total investments and other assets 34,054 29,018 304,053 TOTAL ¥ 115,160 ¥ 104,792 $1,028,214 See notes to consolidated financial statements.
Millions of Yen
Thousands of U.S. Dollars
(Note 1) LIABILITIES AND EQUITY 2017 2016 2017 CURRENT LIABILITIES: Short-term bank loans (Notes 6 and 13) ¥ 1,797 ¥ 1,912 $ 16,045 Accounts payable (Note 13): Trade accounts 7,695 5,995 68,705 Other 1,811 2,948 16,170 Income taxes payable 1,051 831 9,384 Accrued expenses 4,396 4,165 39,250 Other current liabilities 2,515 1,631 22,455 Total current liabilities 19,265 17,482 172,009 LONG-TERM LIABILITIES: Liability for retirement benefits (Note 7) 3,171 3,090 28,313 Deferred tax liabilities (Note 9) 6,224 4,932 55,571 Other long-term liabilities 1,219 1,276 10,883 Total long-term liabilities 10,614 9,298 94,767 COMMITMENTS AND CONTINGENT LIABILITIES (Notes 12 and 14) EQUITY (Notes 8 and 16): Common stock—authorized, 65,000,000 shares; issued, 22,731,160 shares in 2017 and 2016 4,426 4,426 39,518 Capital surplus 4,314 4,314 38,518 Retained earnings 62,954 58,891 562,089 Treasury stock—at cost, 1,410,460 shares in 2017 and 1,410,426 shares in 2016 (2,662 ) (2,662 ) (23,768 ) Accumulated other comprehensive income: Unrealized gain on available-for-sale securities 17,039 13,503 152,134 Foreign currency translation adjustments (505 ) (126 ) (4,508 ) Defined retirement benefit plans (285 ) (334 ) (2,545 ) Total equity 85,281 78,012 761,438 TOTAL ¥ 115,160 ¥ 104,792 $1,028,214

- 3 -
EIZO Corporation and Subsidiaries Consolidated Statement of Income Year Ended March 31, 2017
Millions of Yen
Thousands of U.S. Dollars
(Note 1) 2017 2016 2017 NET SALES ¥ 78,284 ¥ 74,879 $ 698,964 COST OF SALES 53,921 52,884 481,437 Gross profit 24,363 21,995 217,527 SELLING, GENERAL AND ADMINISTRATIVE EXPENSES (Notes 10 and 11) 17,330 16,914 154,732 Operating income 7,033 5,081 62,795 OTHER INCOME (EXPENSES): Interest and dividend income 497 465 4,438 Interest expense (1 ) (2 ) (9 ) Foreign exchange loss—net (482 ) (264 ) (4,304 ) Gain on sales of securities (Note 4) 11 432 98 Loss on impairment of long-lived assets (59 ) Other—net 48 (14 ) 428 Other income—net 73 558 651 INCOME BEFORE INCOME TAXES 7,106 5,639 63,446 INCOME TAXES (Note 9): Current 1,518 1,426 13,554 Deferred (73 ) 11 (653 ) Total income taxes 1,445 1,437 12,901 NET INCOME 5,661 4,202 50,545 NET INCOME ATTRIBUTABLE TO OWNERS OF THE PARENT ¥ 5,661 ¥ 4,202 $ 50,545 Yen U.S. Dollars PER SHARE OF COMMON STOCK (Note 2.q): Basic net income ¥ 265.54 ¥ 197.10 $2.37 Cash dividends applicable to the year 75.00 65.00 0.67 See notes to consolidated financial statements.
- 4 -
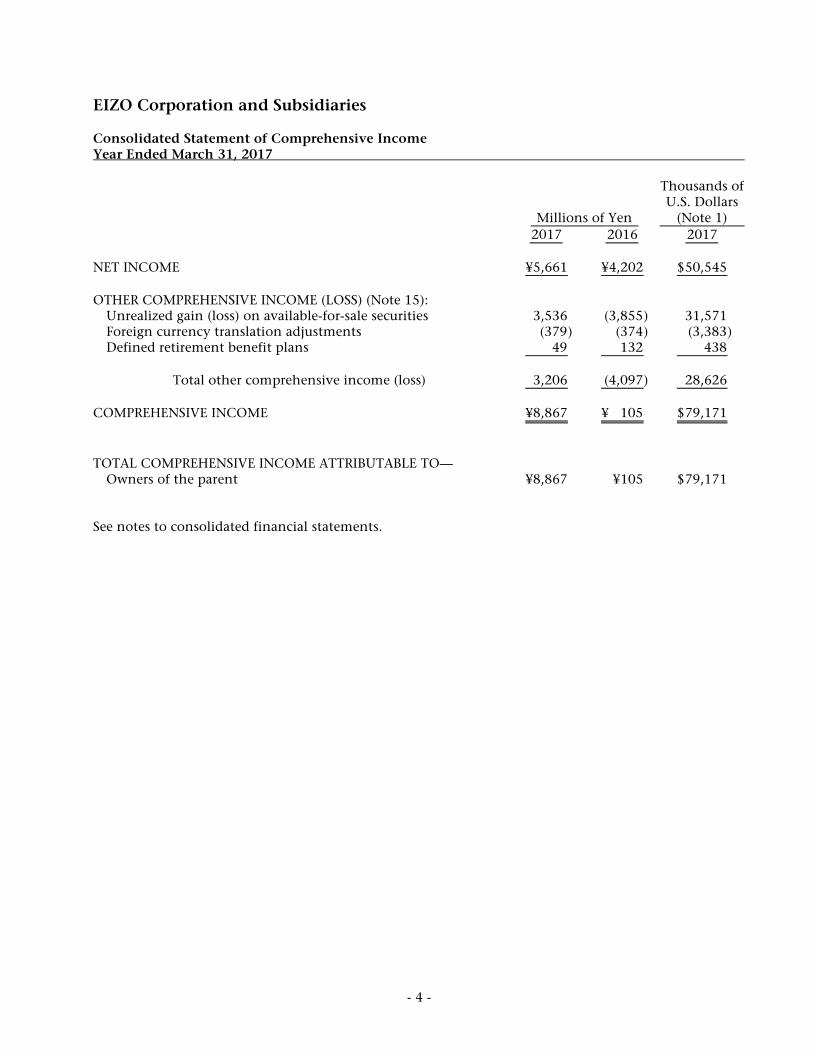
EIZO Corporation and Subsidiaries Consolidated Statement of Comprehensive Income Year Ended March 31, 2017
Millions of Yen
Thousands of U.S. Dollars
(Note 1) 2017 2016 2017 NET INCOME ¥5,661 ¥4,202 $ 50,545 OTHER COMPREHENSIVE INCOME (LOSS) (Note 15): Unrealized gain (loss) on available-for-sale securities 3,536 (3,855 ) 31,571 Foreign currency translation adjustments (379 ) (374 ) (3,383 ) Defined retirement benefit plans 49 132 438 Total other comprehensive income (loss) 3,206 (4,097 ) 28,626 COMPREHENSIVE INCOME ¥8,867 ¥ 105 $ 79,171 TOTAL COMPREHENSIVE INCOME ATTRIBUTABLE TO— Owners of the parent ¥8,867 ¥105 $ 79,171 See notes to consolidated financial statements.

- 5 -
EIZO Corporation and Subsidiaries Consolidated Statement of Changes in Equity Year Ended March 31, 2017 Thousands Millions of Yen Number of Accumulated Other Comprehensive Income
Shares of Common
Stock Outstanding
Common Stock
Capital Surplus
Retained Earnings
Treasury Stock
Unrealized Gain on
Available-for- Sale Securities
Foreign Currency
Translation Adjustments
Defined Retirement
Benefit Plans
Total Equity
BALANCE, APRIL 1, 2015 21,321 ¥4,426 ¥4,314 ¥ 56,075 ¥ (2,661 ) ¥ 17,358 ¥ 248 ¥ (466 ) ¥ 79,294 Net income 4,202 4,202 Cash dividends, ¥65 per share (1,386 ) (1,386 ) Purchase of treasury stock (1 ) (1 ) Net decrease in unrealized gain on available-for-sale securities (3,855 ) (3,855 ) Net change in foreign currency translation adjustments (374 ) (374 ) Net change in defined retirement benefit plans 132 132 BALANCE, MARCH 31, 2016 21,321 4,426 4,314 58,891 (2,662 ) 13,503 (126 ) (334 ) 78,012 Net income 5,661 5,661 Cash dividends, ¥75 per share (1,598 ) (1,598 ) Purchase of treasury stock Net increase in unrealized gain on available-for-sale securities 3,536 3,536 Net change in foreign currency translation adjustments (379 ) (379 ) Net change in defined retirement benefit plans 49 49 BALANCE, MARCH 31, 2017 21,321 ¥4,426 ¥4,314 ¥ 62,954 ¥ (2,662 ) ¥ 17,039 ¥ (505 ) ¥ (285 ) ¥ 85,281
Thousands of U.S. Dollars (Note 1) Accumulated Other Comprehensive Income
Common
Stock Capital Surplus
Retained Earnings
Treasury Stock
Unrealized Gain on
Available-for- Sale Securities
Foreign Currency
Translation Adjustments
Defined Retirement
Benefit Plans
Total Equity
BALANCE, MARCH 31, 2016 $ 39,518 $ 38,518 $ 525,813 $ (23,768 ) $ 120,563 $ (1,125 ) $ (2,983 ) $ 696,536 Net income 50,545 50,545 Cash dividends, $0.67 per share (14,269 ) (14,269 ) Purchase of treasury stock Net increase in unrealized gain on available-for-sale securities 31,571 31,571 Net change in foreign currency translation adjustments (3,383 ) (3,383 ) Net change in defined retirement benefit plans 438 438 BALANCE, MARCH 31, 2017 $ 39,518 $ 38,518 $ 562,089 $ (23,768 ) $ 152,134 $ (4,508 ) $ (2,545 ) $ 761,438 See notes to consolidated financial statements.

- 6 - (Continued)
EIZO Corporation and Subsidiaries Consolidated Statement of Cash Flows Year Ended March 31, 2017
Millions of Yen
Thousands of U.S. Dollars
(Note 1) 2017 2016 2017 OPERATING ACTIVITIES: Income before income taxes ¥ 7,106 ¥5,639 $ 63,446 Adjustments for: Income taxes—paid (1,341 ) (1,263 ) (11,973 ) Depreciation and amortization 2,094 1,843 18,696 Amortization of goodwill 274 205 2,446 Provision of allowance for doubtful receivables 16 (30 ) 143 Foreign exchange loss—net 129 94 1,152 Gain on sales of securities (11 ) (432 ) (98 ) Loss on impairment of long-lived assets 59 Changes in assets and liabilities: Decrease in notes and accounts receivable 11 346 98 (Increase) decrease in inventories (732 ) 782 (6,536 ) Increase (decrease) in accounts payable 1,788 (304 ) 15,964 Increase in accrued expenses 279 273 2,491 Increase in liability for retirement benefits 143 146 1,277 Other—net 778 (585 ) 6,948 Total adjustments 3,428 1,134 30,608 Net cash provided by operating activities 10,534 6,773 94,054 INVESTING ACTIVITIES: Purchases of property, plant, and equipment (3,028 ) (2,733 ) (27,036 ) Purchases of software and other long-lived assets (367 ) (465 ) (3,277 ) Proceeds from sales of short-term investments and investment securities 512 2,244 4,571 Purchases of short-term investments and investment securities (34 ) (1,959 ) (304 ) Payment for acquisition of business (1,251 ) (11,170 ) Decrease (increase) in other assets 10 (120 ) 91 Net cash used in investing activities (4,158 ) (3,033 ) (37,125 ) FINANCING ACTIVITIES: Purchase of treasury stock (1 ) Dividends paid (1,599 ) (1,385 ) (14,277 ) Net cash used in financing activities (1,599 ) (1,386 ) (14,277 ) FOREIGN CURRENCY TRANSLATION ADJUSTMENT ON CASH AND CASH EQUIVALENTS (204 ) (156 ) (1,822 ) NET INCREASE IN CASH AND CASH EQUIVALENTS—(Forward) ¥ 4,573 ¥2,198 $ 40,830
- 7 - (Concluded)
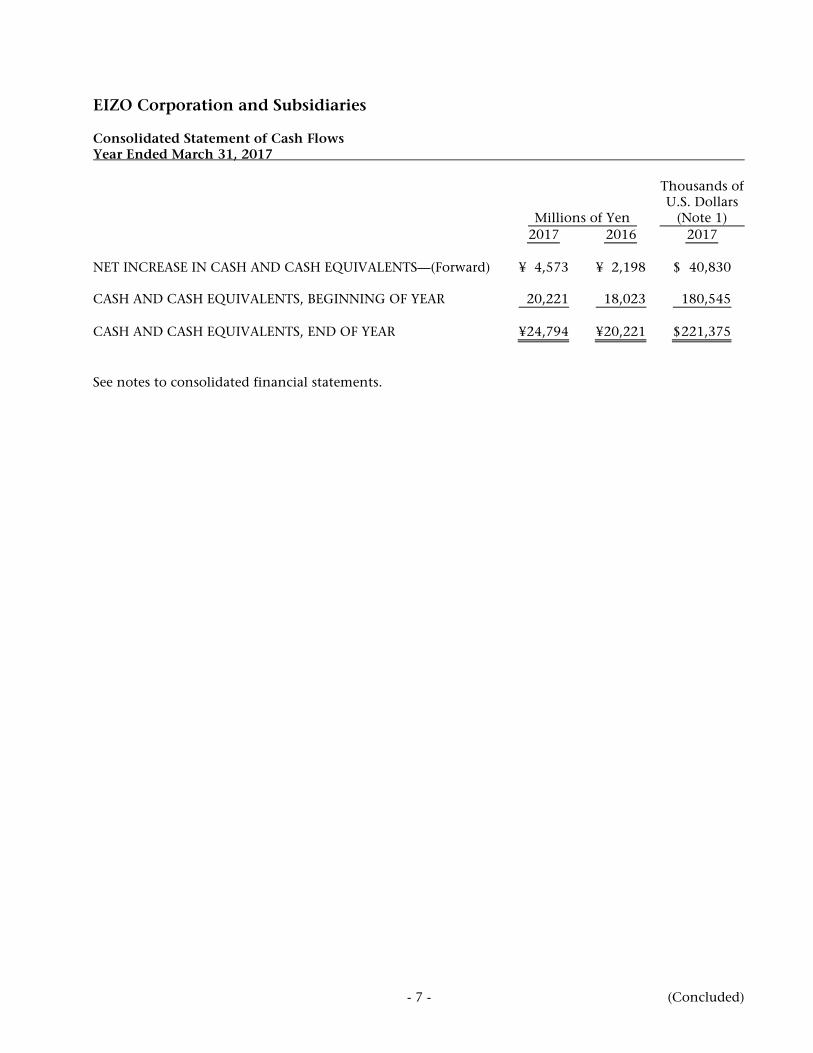
EIZO Corporation and Subsidiaries Consolidated Statement of Cash Flows Year Ended March 31, 2017
Millions of Yen
Thousands of U.S. Dollars
(Note 1) 2017 2016 2017 NET INCREASE IN CASH AND CASH EQUIVALENTS—(Forward) ¥ 4,573 ¥ 2,198 $ 40,830 CASH AND CASH EQUIVALENTS, BEGINNING OF YEAR 20,221 18,023 180,545 CASH AND CASH EQUIVALENTS, END OF YEAR ¥ 24,794 ¥ 20,221 $ 221,375 See notes to consolidated financial statements.

- 8 -
EIZO Corporation and Subsidiaries Notes to Consolidated Financial Statements Year Ended March 31, 2017 1. BASIS OF PRESENTATION OF CONSOLIDATED FINANCIAL STATEMENTS
The accompanying consolidated financial statements have been prepared in accordance with the provisions set forth in the Japanese Financial Instruments and Exchange Act and its related accounting regulations and in accordance with accounting principles generally accepted in Japan ("Japanese GAAP"), which are different in certain respects as to the application and disclosure requirements of International Financial Reporting Standards. In preparing these consolidated financial statements, certain reclassifications and rearrangements have been made to the consolidated financial statements issued domestically in order to present them in a form that is more familiar to readers outside Japan. In addition, certain reclassifications have been made in the 2016 consolidated financial statements to conform to the classifications used in 2017. The consolidated financial statements are stated in Japanese yen, the currency of the country in which EIZO Corporation (the "Company") is incorporated and operates. The translations of Japanese yen amounts into U.S. dollar amounts are included solely for the convenience of readers outside Japan and have been made at the rate of ¥112 to $1, the approximate rate of exchange at March 31, 2017. Such translations should not be construed as representations that the Japanese yen amounts could be converted into U.S. dollars at that or any other rate.
2. SUMMARY OF SIGNIFICANT ACCOUNTING POLICIES
a. Consolidation—The consolidated financial statements as of March 31, 2017, include the accounts of the Company and its 16 (16 in 2016) subsidiaries (together, the "Group"). Under the control concept, those companies in which the Company, directly or indirectly, is able to exercise control over operations are fully consolidated. All significant intercompany balances and transactions have been eliminated in consolidation. All material unrealized profit included in assets resulting from transactions within the Group is also eliminated.
b. Unification of Accounting Policies Applied to Foreign Subsidiaries for the Consolidated
Financial Statements—Under Accounting Standards Board of Japan ("ASBJ") Practical Issues Task Force ("PITF") No. 18, "Practical Solution on Unification of Accounting Policies Applied to Foreign Subsidiaries for the Consolidated Financial Statements," the accounting policies and procedures applied to a parent company and its subsidiaries for similar transactions and events under similar circumstances should in principle be unified for the preparation of the consolidated financial statements. However, financial statements prepared by foreign subsidiaries in accordance with either International Financial Reporting Standards or generally accepted accounting principles in the United States of America (Financial Accounting Standards Board Accounting Standards Codification) tentatively may be used for the consolidation process, except for the following items that should be adjusted in the consolidation process so that net income is accounted for in accordance with Japanese GAAP, unless they are not material: (a) amortization of goodwill; (b) scheduled amortization of actuarial gain or loss of pensions that has been recorded in equity through other comprehensive income; (c) expensing capitalized development costs of research and
- 9 -
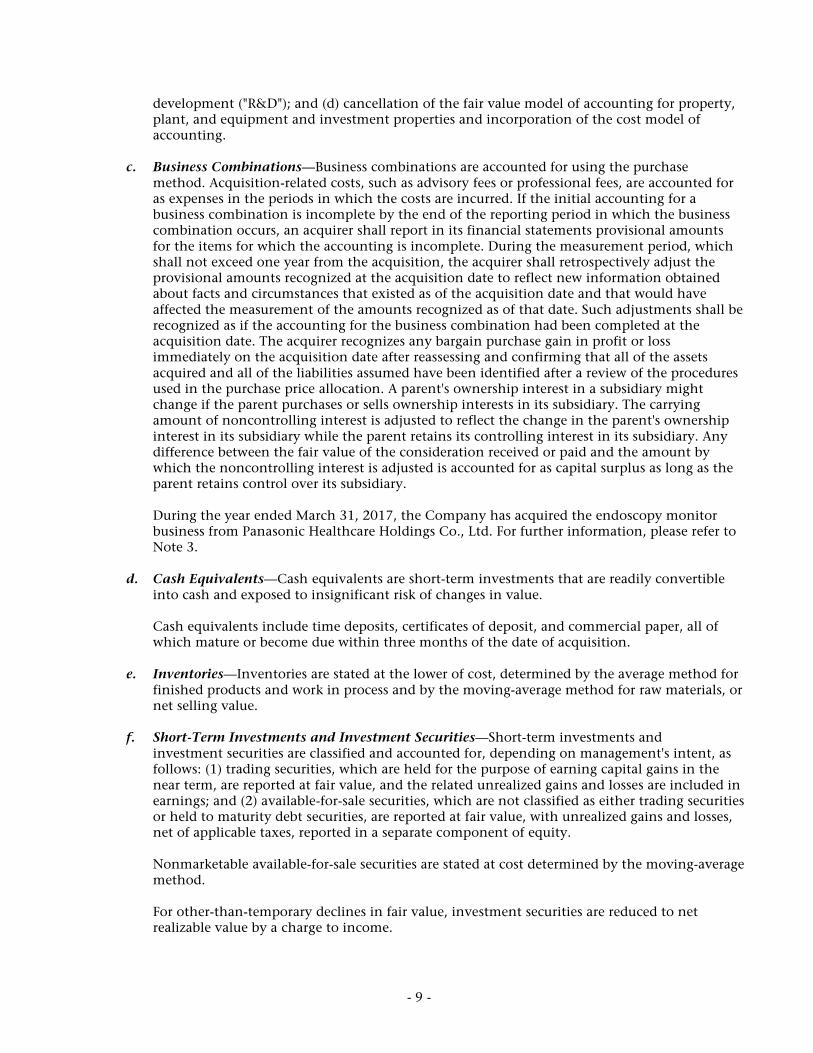
development ("R&D"); and (d) cancellation of the fair value model of accounting for property, plant, and equipment and investment properties and incorporation of the cost model of accounting.
c. Business Combinations—Business combinations are accounted for using the purchase
method. Acquisition-related costs, such as advisory fees or professional fees, are accounted for as expenses in the periods in which the costs are incurred. If the initial accounting for a business combination is incomplete by the end of the reporting period in which the business combination occurs, an acquirer shall report in its financial statements provisional amounts for the items for which the accounting is incomplete. During the measurement period, which shall not exceed one year from the acquisition, the acquirer shall retrospectively adjust the provisional amounts recognized at the acquisition date to reflect new information obtained about facts and circumstances that existed as of the acquisition date and that would have affected the measurement of the amounts recognized as of that date. Such adjustments shall be recognized as if the accounting for the business combination had been completed at the acquisition date. The acquirer recognizes any bargain purchase gain in profit or loss immediately on the acquisition date after reassessing and confirming that all of the assets acquired and all of the liabilities assumed have been identified after a review of the procedures used in the purchase price allocation. A parent's ownership interest in a subsidiary might change if the parent purchases or sells ownership interests in its subsidiary. The carrying amount of noncontrolling interest is adjusted to reflect the change in the parent's ownership interest in its subsidiary while the parent retains its controlling interest in its subsidiary. Any difference between the fair value of the consideration received or paid and the amount by which the noncontrolling interest is adjusted is accounted for as capital surplus as long as the parent retains control over its subsidiary. During the year ended March 31, 2017, the Company has acquired the endoscopy monitor business from Panasonic Healthcare Holdings Co., Ltd. For further information, please refer to Note 3.
d. Cash Equivalents—Cash equivalents are short-term investments that are readily convertible
into cash and exposed to insignificant risk of changes in value. Cash equivalents include time deposits, certificates of deposit, and commercial paper, all of which mature or become due within three months of the date of acquisition.
e. Inventories—Inventories are stated at the lower of cost, determined by the average method for
finished products and work in process and by the moving-average method for raw materials, or net selling value.
f. Short-Term Investments and Investment Securities—Short-term investments and
investment securities are classified and accounted for, depending on management's intent, as follows: (1) trading securities, which are held for the purpose of earning capital gains in the near term, are reported at fair value, and the related unrealized gains and losses are included in earnings; and (2) available-for-sale securities, which are not classified as either trading securities or held to maturity debt securities, are reported at fair value, with unrealized gains and losses, net of applicable taxes, reported in a separate component of equity. Nonmarketable available-for-sale securities are stated at cost determined by the moving-average method. For other-than-temporary declines in fair value, investment securities are reduced to net realizable value by a charge to income.

- 10 -
g. Property, Plant, and Equipment—Property, plant, and equipment are stated at cost. Depreciation of property, plant, and equipment of the Company and its domestic subsidiaries is computed substantially by the declining-balance method at rates based on the estimated useful lives of the assets, while the straight-line method is applied to buildings of the Company and its domestic subsidiaries acquired after April 1, 1998, buildings improvements and structures acquired on or after April 1, 2016, and all property, plant, and equipment of foreign subsidiaries. The range of useful lives is principally from 15 to 50 years for buildings and structures, from 7 to 10 years for machinery and equipment, and from 2 to 6 years for furniture and fixtures. Pursuant to an amendment to the Corporate Tax Act, the Company and its Japanese subsidiaries adopted ASBJ PITF No. 32, "Practical Solution on a change in depreciation method due to Tax Reform 2016" and changed the depreciation method for building improvements and structures acquired on or after April 1, 2016, from the declining-balance method to the straight-line method. The effect of this change is immaterial on profit and loss for the year ended March 31, 2017.
h. Goodwill—Goodwill is amortized over 10 years or less by the straight-line method. Immaterial
goodwill may be charged entirely to income at acquisition. Amortization of goodwill is ¥274 million ($2,446 thousand) and ¥205 million for the years ended March 31, 2017 and 2016, respectively.
i. Long-Lived Assets—The Group reviews its long-lived assets for impairment whenever events or
changes in circumstances indicate the carrying amount of an asset or asset group may not be recoverable. An impairment loss is recognized if the carrying amount of an asset or asset group exceeds the sum of the undiscounted future cash flows expected to result from the continued use and eventual disposition of the asset or asset group. The impairment loss would be measured as the amount by which the carrying amount of the asset exceeds its recoverable amount, which is the higher of the discounted cash flows from the continued use and eventual disposition of the asset or the net selling price at disposition.
j. Retirement and Pension Plans—The Company and certain of its domestic subsidiaries have a
defined contribution pension plan and unfunded retirement benefit plans. Other domestic subsidiaries have a defined benefit pension plan and unfunded retirement benefit plans. Certain foreign subsidiaries have either a defined contribution plan or defined benefit plan. Additionally, the Company or its subsidiaries may add premium severance pay. The Company accounts for the liability for retirement benefits based on the projected benefit obligations and plan assets at the balance sheet date. The projected benefit obligations are attributed to periods on a straight-line basis. Actuarial gains and losses and past service costs that are yet to be recognized in profit or loss are recognized within equity (accumulated other comprehensive income), after adjusting for tax effects and are recognized in profit or loss over five years, no longer than the expected average remaining service period of the employees. The discount rate is determined using a single weighted-average discount rate reflecting the estimated timing and amount of benefit payment. Retirement benefits to directors and Audit & Supervisory Board members are recorded at the amount that would be required if the directors and Audit & Supervisory Board members retired at the consolidated balance sheet date. In June 2004, the retirement benefit system was abolished and the amount required to be paid at the time of the abolishment will be paid to directors and Audit & Supervisory Board members upon their retirement.
k. R&D Costs—R&D costs are charged to income as incurred.

- 11 -
l. Software Development Contracts—Revenue from sales of customized software and costs of development of the customized software should be recognized by the percentage-of-completion method if the outcome of a development contract can be estimated reliably. When total revenue, total costs, and the stage of completion of the contract at the consolidated balance sheet date can be reliably measured, the outcome of a development contract can be estimated reliably. If the outcome of a development contract cannot be reliably estimated, the completed contract method should be applied. When it is probable that the total costs will exceed total revenue, an estimated loss on the contract should be immediately recognized by providing for a loss on development contracts.
m. Income Taxes—The provision for income taxes is computed based on the pretax income
included in the consolidated statement of income. The asset and liability approach is used to recognize deferred tax assets and liabilities for the expected future tax consequences of temporary differences between the carrying amounts and the tax bases of assets and liabilities. Deferred taxes are measured by applying currently enacted tax laws to the temporary differences. The Company applied ASBJ Guidance No. 26, "Guidance on Recoverability of Deferred Tax Assets," effective April 1, 2016. There was no impact from this for the year ended March 31, 2017. The Group files a tax return under the consolidated corporate tax system in Japan, which allows companies to base tax payments on the combined profits or losses of the parent company and its wholly owned domestic subsidiaries.
n. Foreign Currency Transactions—All short-term and long-term monetary receivables and
payables denominated in foreign currencies are translated into Japanese yen at the exchange rates at the consolidated balance sheet date. The foreign exchange gains and losses from translation are recognized in the consolidated statement of income to the extent that they are not hedged by forward exchange contracts.
o. Foreign Currency Financial Statements—The balance sheet accounts of the foreign
subsidiaries are translated into Japanese yen at the current exchange rate as of the balance sheet date, except for equity, which is translated at the historical rate. Differences arising from such translation were shown as "Foreign currency translation adjustments" under accumulated other comprehensive income as a separate component of equity. Revenue and expense accounts of foreign subsidiaries are translated into Japanese yen at the average exchange rate.
p. Derivatives—The Group uses derivative financial instruments to manage its exposures to
fluctuations in foreign currency exchange rates. Foreign exchange forward contracts are utilized by the Group to reduce foreign currency exchange rate risks. The Group does not enter into derivatives for trading or speculative purposes. Derivative financial instruments are classified and accounted for as follows: all derivatives are recognized as either assets or liabilities and measured at fair value with gains or losses on derivative transactions recognized in the consolidated statement of income.
q. Per Share Information—Basic net income per share is computed by dividing net income
attributable to common shareholders by the weighted-average number of common shares outstanding for the period.

- 12 -
Cash dividends per share shown in the consolidated statement of income are presented on an accrual basis, and include interim dividends paid and year-end dividends to be approved after the consolidated balance sheet date. Diluted net income per share of common stock is not disclosed herein because the Company has not issued any securities that are potentially dilutive for the years ended March 31, 2017 and 2016.
3. BUSINESS COMBINATION
Year Ended March 31, 2017 (Business Combination by Acquisition)
a. Outline of the business combination
(1) Name of the acquired company and its business outline
Name of the acquired company: Panasonic Healthcare Holdings Co., Ltd. Business outline: Operating room and endoscopy monitor business
(2) Major reasons for the business combination
Panasonic Healthcare Holdings Co., Ltd. has been developing its endoscopy monitor business. The Company has built strong partnerships globally with manufacturers of endoscopy monitors and other medical equipment and its products are in wide use in operating rooms around the world. By this acquisition, the Company can provide a complete lineup of endoscopy monitors, including 3D and 4K monitors. In addition, integrating the technologies of the Company and the acquired business gives the Company a significant competitive advantage in product development for accelerating the growth of its healthcare business.
(3) Date of business combination
July 31, 2016
(4) Legal form of business combination
Acquisition of business
b. The period for which the operations of the acquired company are included in the consolidated
financial statements The operations of the acquired business for the eight months from July 31, 2016 to March 31, 2017, were included in the consolidated statement of income for the year ended March 31, 2017.
c. Acquisition cost of the acquired company and related details of each class of consideration
Millions of Yen Thousands of U.S. Dollars
Consideration for acquisition—Cash ¥1,251 $ 11,170 Acquisition cost ¥1,251 $ 11,170

- 13 -
d. Amount of goodwill incurred, reasons for the goodwill incurred, and the method and period of amortization
(1) Amount of goodwill incurred
¥404 million ($3,607 thousand)
(2) Reasons for the goodwill incurred
Goodwill is incurred from expected excess earnings power in the future arising from further business development.
(3) Method and period of amortization
The goodwill incurred from this acquisition is amortized on a straight-line basis over three years.
e. The assets acquired and the liabilities assumed at the acquisition date are as follows:
Millions of Yen Thousands of U.S. Dollars
Current assets ¥ 405 $ 3,616 Noncurrent assets 931 8,313 Total assets acquired 1,336 11,929 Current liabilities 8 71 Noncurrent liabilities 77 688 Total liabilities assumed 85 759 Net assets acquired ¥1,251 $ 11,170
4. SHORT-TERM INVESTMENTS AND INVESTMENT SECURITIES
Short-term investments and investment securities as of March 31, 2017 and 2016, consisted of the following:
Millions of Yen Thousands of U.S. Dollars
2017 2016 2017
Short-term investments— Trust fund investments ¥ 310 ¥ 796 $ 2,768 Total ¥ 310 ¥ 796 $ 2,768 Investment securities: Marketable equity securities ¥ 31,406 ¥ 26,483 $ 280,411 Nonmarketable equity securities 149 41 1,330 Others 3 4 27 Total ¥ 31,558 ¥ 26,528 $ 281,768
- 14 -
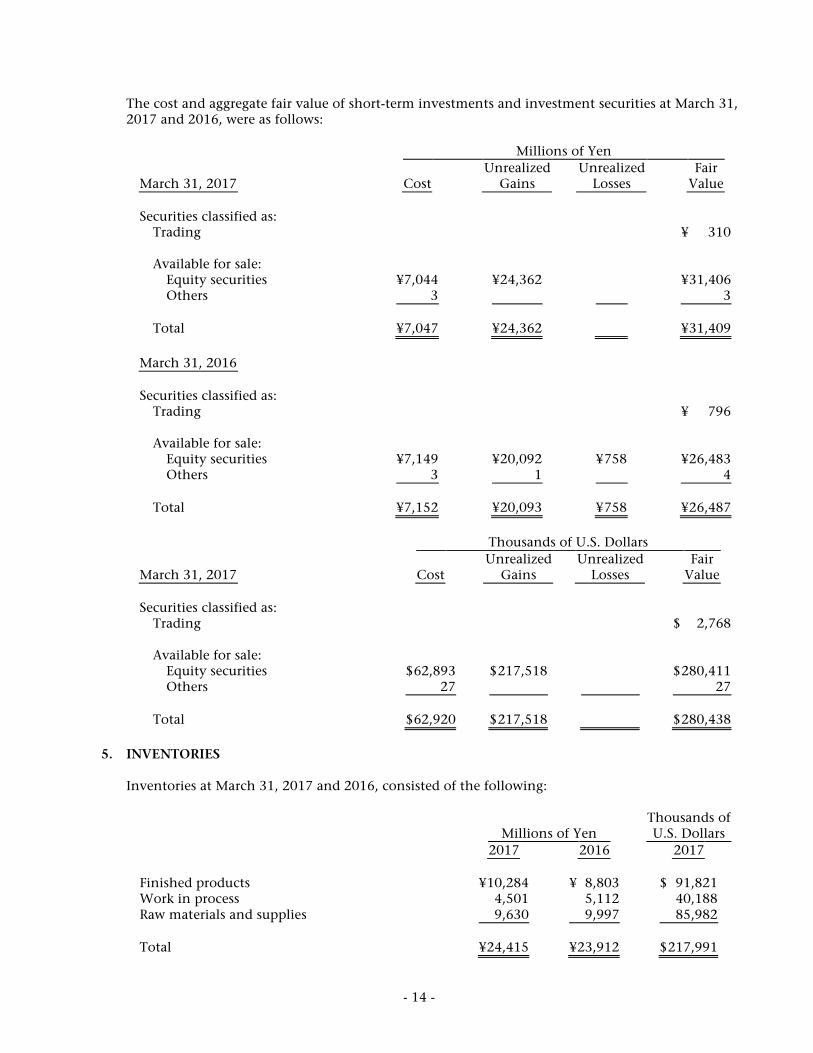
The cost and aggregate fair value of short-term investments and investment securities at March 31, 2017 and 2016, were as follows:
Millions of Yen
March 31, 2017 Cost Unrealized
Gains Unrealized
Losses Fair
Value
Securities classified as: Trading ¥ 310 Available for sale: Equity securities ¥7,044 ¥ 24,362 ¥ 31,406 Others 3 3 Total ¥7,047 ¥ 24,362 ¥ 31,409
March 31, 2016
Securities classified as: Trading ¥ 796 Available for sale: Equity securities ¥7,149 ¥ 20,092 ¥ 758 ¥ 26,483 Others 3 1 4 Total ¥7,152 ¥ 20,093 ¥ 758 ¥ 26,487
Thousands of U.S. Dollars
March 31, 2017 Cost Unrealized
Gains Unrealized
Losses Fair
Value
Securities classified as: Trading $ 2,768 Available for sale: Equity securities $ 62,893 $ 217,518 $ 280,411 Others 27 27 Total $ 62,920 $ 217,518 $ 280,438
5. INVENTORIES
Inventories at March 31, 2017 and 2016, consisted of the following:
Millions of Yen Thousands of U.S. Dollars
2017 2016 2017
Finished products ¥ 10,284 ¥ 8,803 $ 91,821 Work in process 4,501 5,112 40,188 Raw materials and supplies 9,630 9,997 85,982 Total ¥ 24,415 ¥ 23,912 $ 217,991

- 15 -
6. SHORT-TERM BANK LOANS Short-term bank loans at March 31, 2017 and 2016, consisted of notes to banks. The weighted-average annual interest rate applicable to the short-term bank loans was 0.07% and 0.07% at March 31, 2017 and 2016, respectively.
7. RETIREMENT AND PENSION PLANS
The Company and certain of its subsidiaries have severance payment plans for employees, directors, and Audit & Supervisory Board members. Under most circumstances, employees terminating their employment are entitled to retirement benefits determined based on the rate of pay at the time of termination, years of service, and certain other factors. Such retirement benefits are given in the form of a lump-sum severance payment from the Company or from certain subsidiaries and annuity payments from the Company, certain subsidiaries, or a trustee. Employees of the Company or certain subsidiaries are entitled to larger payments if the termination is involuntary, by retirement at the mandatory retirement age, by death, or by voluntary retirement at certain specific ages prior to the mandatory retirement age.
(1) The changes in defined benefit obligation for the years ended March 31, 2017 and 2016, were
as follows:
Millions of Yen Thousands of U.S. Dollars
2017 2016 2017
Balance at beginning of year ¥3,937 ¥3,945 $ 35,152 Current service cost 229 203 2,045 Interest cost 18 22 161 Actuarial losses (gains) 68 (36 ) 607 Benefits paid (178 ) (168 ) (1,589 ) Others (80 ) (29 ) (715 ) Balance at end of year ¥3,994 ¥3,937 $ 35,661
(2) The changes in plan assets for the years ended March 31, 2017 and 2016, were as follows:
Millions of Yen Thousands of U.S. Dollars
2017 2016 2017
Balance at beginning of year ¥ 949 ¥ 961 $8,473 Expected return on plan assets 27 24 241 Actuarial gains (losses) 4 (43 ) 36 Contributions from the employer 43 49 384 Benefits paid (78 ) (39 ) (696 ) Others (21 ) (3 ) (188 ) Balance at end of year ¥ 924 ¥ 949 $8,250
- 16 -
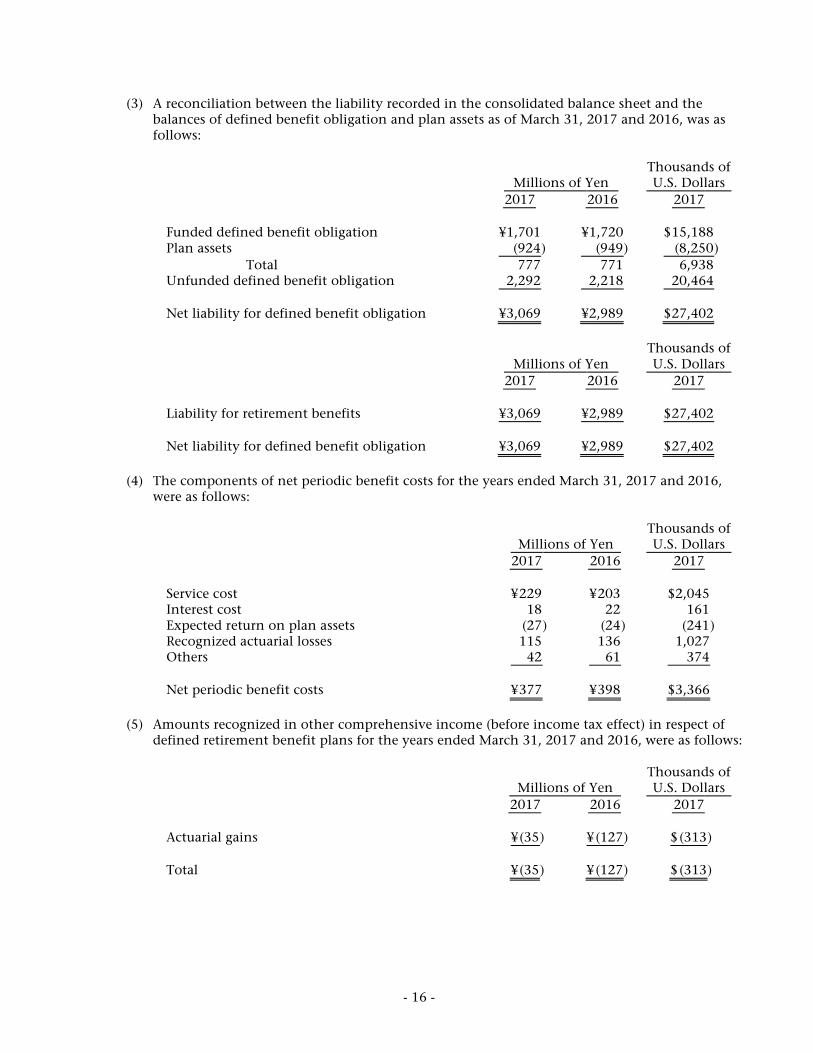
(3) A reconciliation between the liability recorded in the consolidated balance sheet and the balances of defined benefit obligation and plan assets as of March 31, 2017 and 2016, was as follows:
Millions of Yen Thousands of U.S. Dollars
2017 2016 2017
Funded defined benefit obligation ¥1,701 ¥1,720 $ 15,188 Plan assets (924 ) (949 ) (8,250 ) Total 777 771 6,938 Unfunded defined benefit obligation 2,292 2,218 20,464 Net liability for defined benefit obligation ¥3,069 ¥2,989 $ 27,402
Millions of Yen Thousands of U.S. Dollars
2017 2016 2017
Liability for retirement benefits ¥3,069 ¥2,989 $ 27,402 Net liability for defined benefit obligation ¥3,069 ¥2,989 $ 27,402
(4) The components of net periodic benefit costs for the years ended March 31, 2017 and 2016,
were as follows:
Millions of Yen Thousands of U.S. Dollars
2017 2016 2017
Service cost ¥ 229 ¥ 203 $2,045 Interest cost 18 22 161 Expected return on plan assets (27 ) (24 ) (241 ) Recognized actuarial losses 115 136 1,027 Others 42 61 374 Net periodic benefit costs ¥ 377 ¥ 398 $3,366
(5) Amounts recognized in other comprehensive income (before income tax effect) in respect of
defined retirement benefit plans for the years ended March 31, 2017 and 2016, were as follows:
Millions of Yen Thousands of U.S. Dollars
2017 2016 2017
Actuarial gains ¥ (35 ) ¥ (127 ) $ (313 ) Total ¥ (35 ) ¥ (127 ) $ (313 )

- 17 -
(6) Amounts recognized in accumulated other comprehensive income (before income tax effect) in respect of defined retirement benefit plans as of March 31, 2017 and 2016, were as follows:
Millions of Yen Thousands of U.S. Dollars
2017 2016 2017
Unrecognized actuarial losses ¥ 328 ¥ 362 $2,929 Total ¥ 328 ¥ 362 $2,929
(7) Plan assets
a. Components of plan assets Plan assets as of March 31, 2017 and 2016, consisted of the following:
2017 2016
Debt investments 52 % 53 % Equity investments 15 16 Cash and cash equivalents 4 2 Others 29 29 Total 100 % 100 %
b. Method of determining the expected rate of return on plan assets
The expected rate of return on plan assets is determined considering the long-term rates of return which are expected currently and in the future from the various components of the plan assets.
(8) Assumptions used for the years ended March 31, 2017 and 2016, are set forth as follows:
2017 2016
Discount rate 0.2%–1.6% 0.1%–1.6% Expected rate of return on plan assets 5.3% 4.5%
The expected raise rate is based on the index of the raise calculated by age as of March 31,
2013. (9) Defined contribution plan
The required contribution amounts of the Group for the years ended March 31, 2017 and 2016, were ¥221 million ($1,973 thousand) and ¥215 million, respectively.
The liability for retirement benefits at March 31, 2017 and 2016, for directors and Audit &
Supervisory Board members was ¥102 million ($911 thousand) and ¥102 million, respectively.

- 18 -
8. EQUITY Japanese companies are subject to the Companies Act of Japan (the "Companies Act"). The significant provisions in the Companies Act that affect financial and accounting matters are summarized below:
a. Dividends
Under the Companies Act, companies can pay dividends at any time during the fiscal year in addition to the year-end dividend upon resolution at the shareholders' meeting. Additionally, for companies that meet certain criteria, including (1) having a board of directors, (2) having independent auditors, (3) having an Audit & Supervisory Board, and (4) the term of service of the directors being prescribed as one year rather than the normal two-year term by its articles of incorporation, the board of directors may declare dividends (except for dividends-in-kind) at any time during the fiscal year if the company has prescribed so in its articles of incorporation. With respect to the third condition above, the board of directors of companies with an audit and supervisory committee (as implemented under the Companies Act effective May 1, 2015) may also declare dividends at any time because such companies, by their nature, meet the criteria under the Companies Act. The Company is organized as a company with an audit and supervisory committee, effective June 23, 2016. The Company meets all the above criteria, and accordingly, the board of directors may declare dividends (except for dividends-in-kind) at any time during the fiscal year. The Companies Act permits companies to distribute dividends-in-kind (noncash assets) to shareholders subject to certain limitations and additional requirements. Semiannual interim dividends may also be paid once a year upon resolution by the board of directors if the articles of incorporation of the company so stipulate. The Companies Act provides certain limitations on the amounts available for dividends or the purchase of treasury stock. The limitation is defined as the amount available for distribution to the shareholders, but the amount of net assets after dividends must be maintained at no less than ¥3 million.
b. Increases/Decreases and Transfer of Common Stock, Reserve, and Surplus
The Companies Act requires that an amount equal to 10% of dividends must be appropriated as a legal reserve (a component of retained earnings) or as additional paid-in capital (a component of capital surplus), depending on the equity account charged upon the payment of such dividends, until the aggregate amount of the legal reserve and additional paid-in capital equals 25% of the common stock. Under the Companies Act, the total amount of additional paid-in capital and legal reserve may be reversed without limitation. The Companies Act also provides that common stock, legal reserve, additional paid-in capital, other capital surplus, and retained earnings can be transferred among the accounts within equity under certain conditions upon resolution of the shareholders.
c. Treasury Stock and Treasury Stock Acquisition Rights
The Companies Act also provides for companies to purchase treasury stock and dispose of such treasury stock by resolution of the board of directors. The amount of treasury stock purchased cannot exceed the amount available for distribution to the shareholders which is determined by a specific formula.
- 19 -
Under the Companies Act, stock acquisition rights are presented as a separate component of equity. The Companies Act also provides that companies can purchase both treasury stock acquisition rights and treasury stock. Such treasury stock acquisition rights are presented as a separate component of equity or deducted directly from stock acquisition rights.
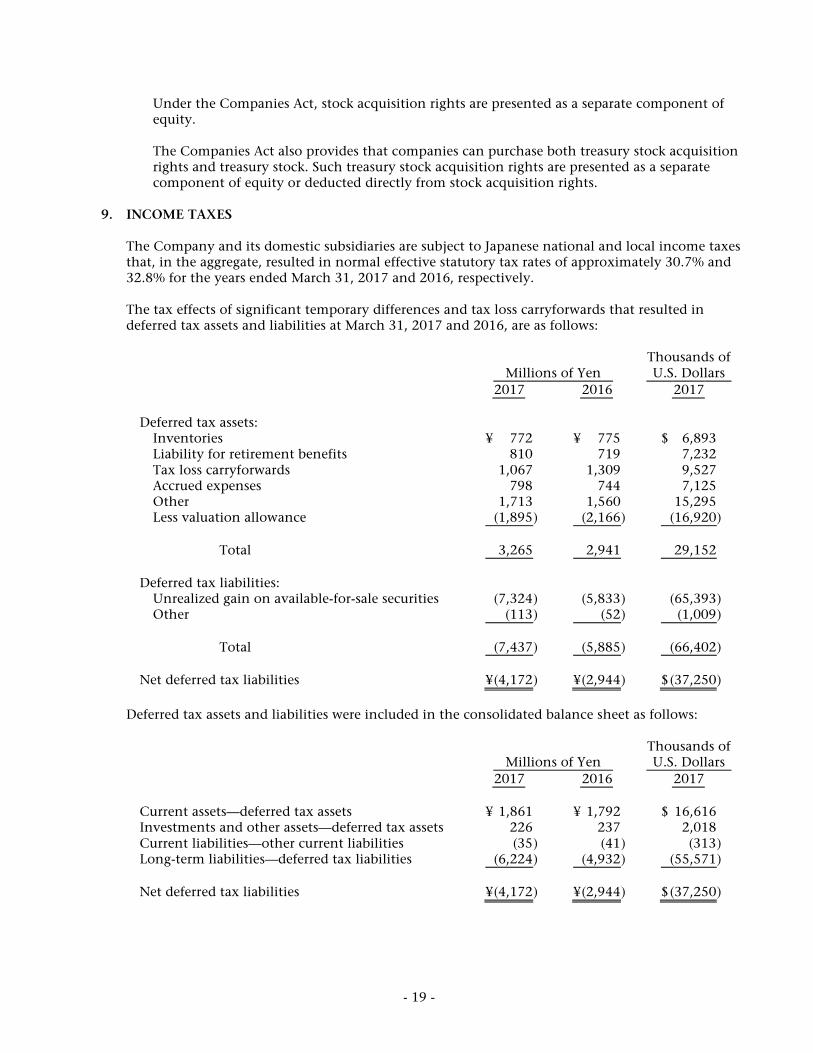
9. INCOME TAXES
The Company and its domestic subsidiaries are subject to Japanese national and local income taxes that, in the aggregate, resulted in normal effective statutory tax rates of approximately 30.7% and 32.8% for the years ended March 31, 2017 and 2016, respectively. The tax effects of significant temporary differences and tax loss carryforwards that resulted in deferred tax assets and liabilities at March 31, 2017 and 2016, are as follows:
Millions of Yen Thousands of U.S. Dollars
2017 2016 2017
Deferred tax assets: Inventories ¥ 772 ¥ 775 $ 6,893 Liability for retirement benefits 810 719 7,232 Tax loss carryforwards 1,067 1,309 9,527 Accrued expenses 798 744 7,125 Other 1,713 1,560 15,295 Less valuation allowance (1,895 ) (2,166 ) (16,920 ) Total 3,265 2,941 29,152 Deferred tax liabilities: Unrealized gain on available-for-sale securities (7,324 ) (5,833 ) (65,393 ) Other (113 ) (52 ) (1,009 ) Total (7,437 ) (5,885 ) (66,402 ) Net deferred tax liabilities ¥ (4,172 ) ¥ (2,944 ) $ (37,250 )
Deferred tax assets and liabilities were included in the consolidated balance sheet as follows:
Millions of Yen Thousands of U.S. Dollars
2017 2016 2017
Current assets—deferred tax assets ¥ 1,861 ¥ 1,792 $ 16,616 Investments and other assets—deferred tax assets 226 237 2,018 Current liabilities—other current liabilities (35 ) (41 ) (313 ) Long-term liabilities—deferred tax liabilities (6,224 ) (4,932 ) (55,571 ) Net deferred tax liabilities ¥ (4,172 ) ¥ (2,944 ) $ (37,250 )
- 20 -
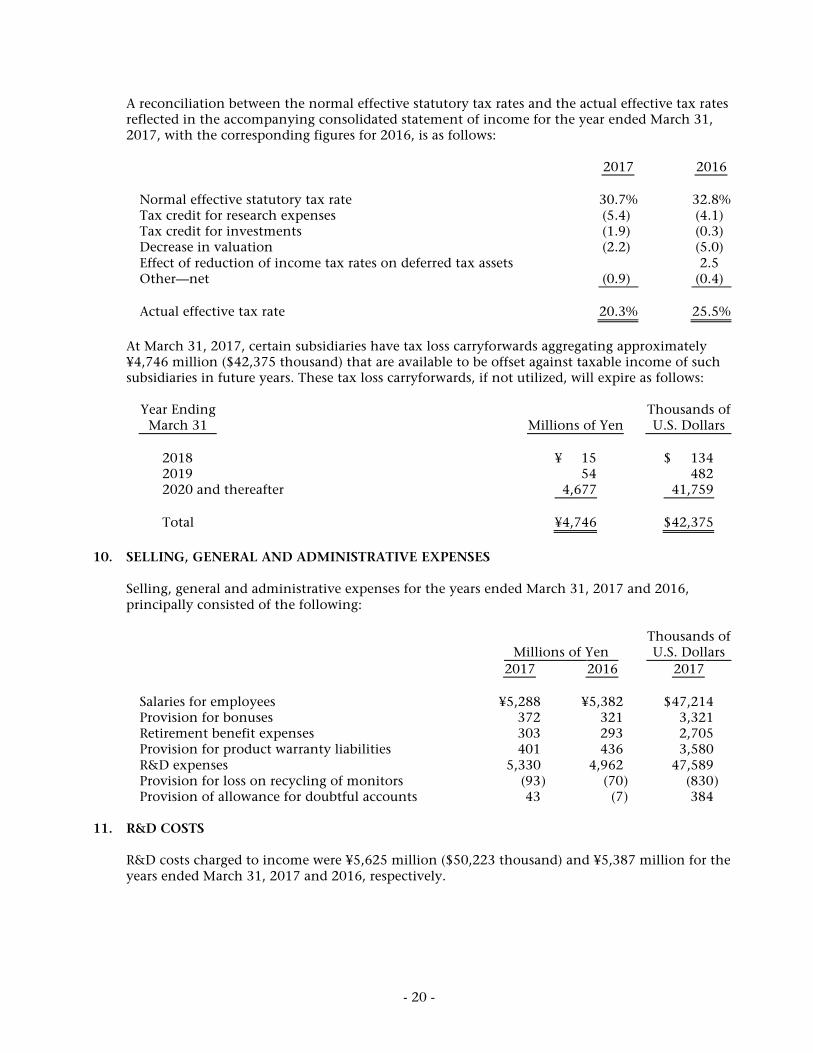
A reconciliation between the normal effective statutory tax rates and the actual effective tax rates reflected in the accompanying consolidated statement of income for the year ended March 31, 2017, with the corresponding figures for 2016, is as follows:
2017 2016
Normal effective statutory tax rate 30.7% 32.8% Tax credit for research expenses (5.4) (4.1) Tax credit for investments (1.9) (0.3) Decrease in valuation (2.2) (5.0) Effect of reduction of income tax rates on deferred tax assets 2.5 Other—net (0.9) (0.4) Actual effective tax rate 20.3% 25.5%
At March 31, 2017, certain subsidiaries have tax loss carryforwards aggregating approximately
¥4,746 million ($42,375 thousand) that are available to be offset against taxable income of such subsidiaries in future years. These tax loss carryforwards, if not utilized, will expire as follows:
Year Ending
March 31 Millions of Yen Thousands of U.S. Dollars
2018 ¥ 15 $ 134 2019 54 482 2020 and thereafter 4,677 41,759 Total ¥4,746 $ 42,375
10. SELLING, GENERAL AND ADMINISTRATIVE EXPENSES
Selling, general and administrative expenses for the years ended March 31, 2017 and 2016, principally consisted of the following:
Millions of Yen Thousands of U.S. Dollars
2017 2016 2017
Salaries for employees ¥5,288 ¥5,382 $ 47,214 Provision for bonuses 372 321 3,321 Retirement benefit expenses 303 293 2,705 Provision for product warranty liabilities 401 436 3,580 R&D expenses 5,330 4,962 47,589 Provision for loss on recycling of monitors (93 ) (70 ) (830 ) Provision of allowance for doubtful accounts 43 (7 ) 384
11. R&D COSTS
R&D costs charged to income were ¥5,625 million ($50,223 thousand) and ¥5,387 million for the years ended March 31, 2017 and 2016, respectively.

- 21 -
12. LEASES The minimum rental commitments under noncancelable operating leases at March 31, 2017 and 2016, were as follows:
Millions of Yen Thousands of U.S. Dollars
2017 2016 2017
Due within one year ¥ 250 ¥ 238 $2,232 Due after one year 488 350 4,357 Total ¥ 738 ¥ 588 $6,589
13. FINANCIAL INSTRUMENTS AND RELATED DISCLOSURES
(1) Group Policy for Financial Instruments The Group uses financial instruments based on its capital expenditure plan. Cash surpluses, if any, are invested in low-risk financial assets. Derivatives are not used, for speculative purposes, but to manage exposure to financial risks as described in (2) below.
(2) Nature and Extent of Risks Arising from Financial Instruments
Receivables such as trade notes and trade accounts are exposed to customer credit risk. Although receivables in foreign currencies are exposed to the risk of fluctuation in foreign currency exchange rates, the position, net of payables in foreign currencies, is hedged by using forward foreign currency contracts. Short-term investment and investment securities, mainly equity instruments of customers and suppliers of the Group, debt securities and funds in trust are exposed to credit risk and the risk of fluctuation in market price and interest rate. All payment terms of payables, such as trade accounts, are within one year. Although payables in foreign currencies are exposed to the risk of fluctuation in foreign currency exchange rates, those risks are netted against the balance of receivables denominated in the same foreign currency, as noted above. Short-term bank loans are used to hedge the exchange risk for nontrade receivables denominated in foreign currency. The payment term is within three months after the consolidated balance sheet date. The loans are traded in foreign currency and have variable interest rates. Thus, they are exposed to the market risk of fluctuation in exchange rate and interest rates. Derivatives mainly include forward foreign currency contracts that are used to manage exposure to risk of changes in foreign currency exchange rates of receivables and payables. Please see Note 14 for more details about derivatives.

- 22 -
(3) Risk Management for Financial Instruments Credit risk management Credit risk is the risk of economic loss arising from a counterparty's failure to repay or service debt according to the contractual terms. The Group manages its credit risk from receivables on the basis of internal guidelines, which include monitoring of payment terms and balances of major customers by each business administration department to identify the default risk of customers at an early stage. With respect to debt securities, the Group manages its exposure to credit risk by limiting its funding to high credit rating bonds in accordance with in its internal guidelines. Please see Note 14 for information about derivatives. The maximum credit risk exposure of financial assets is limited to their carrying amounts as of March 31, 2017. Market risk management (foreign exchange rate risk and interest rate risk) Foreign currency trade receivables, payables and short-term bank loans are exposed to fluctuations in foreign currency exchange rates. Such foreign exchange rate risk is hedged occasionally by forward foreign currency contracts. Marketable and investment securities are managed by monitoring the market values and financial position of issuers on a regular basis. The basic policies regarding derivative transactions have been approved by the Chief Financial Officer based on internal guidelines that prescribe the authority and the limit for each transaction by the corporate treasury department. Reconciliation of the transactions and balances with customers is made and the transaction data is reported to the Chief Financial Officer on a monthly basis. Liquidity risk management Liquidity risk comprises the risk that the Group cannot meet its contractual obligations in full on maturity dates. The Group manages its liquidity risk by holding an adequate volume of liquid assets along with adequate financial planning by the corporate treasury department.
(4) Concentration of Credit Risk
As of March 31, 2017, 13.3% of total receivables are from specific major customers of the Group.
(5) Fair Values of Financial Instruments
Fair values of financial instruments are based on quoted prices in active markets. If quoted prices are not available, other rational valuation techniques are used instead.

- 23 -
(a) Fair value of financial instruments
Millions of Yen
March 31, 2017 Carrying Amount Fair Value
Unrealized Gain/Loss
Cash and cash equivalents ¥ 24,794 ¥ 24,794 Notes and accounts receivable 17,393 Allowance for doubtful receivables (139 ) Notes and accounts receivable (net) 17,254 17,254 Short-term investments and investment securities 31,718 31,718 Total ¥ 73,766 ¥ 73,766 Accounts payable ¥ 9,506 ¥ 9,506 Short-term bank loans 1,797 1,797 Total ¥ 11,303 ¥ 11,303 Derivatives ¥ 18 ¥ 18
March 31, 2016
Cash and cash equivalents ¥ 20,221 ¥ 20,221 Notes and accounts receivable 17,635 Allowance for doubtful receivables (125 ) Notes and accounts receivable (net) 17,510 17,510 Short-term investments and investment securities 27,283 27,283 Total ¥ 65,014 ¥ 65,014 Accounts payable ¥ 8,943 ¥ 8,943 Short-term bank loans 1,912 1,912 Total ¥ 10,855 ¥ 10,855 Derivatives ¥ 4 ¥ 4
- 24 -
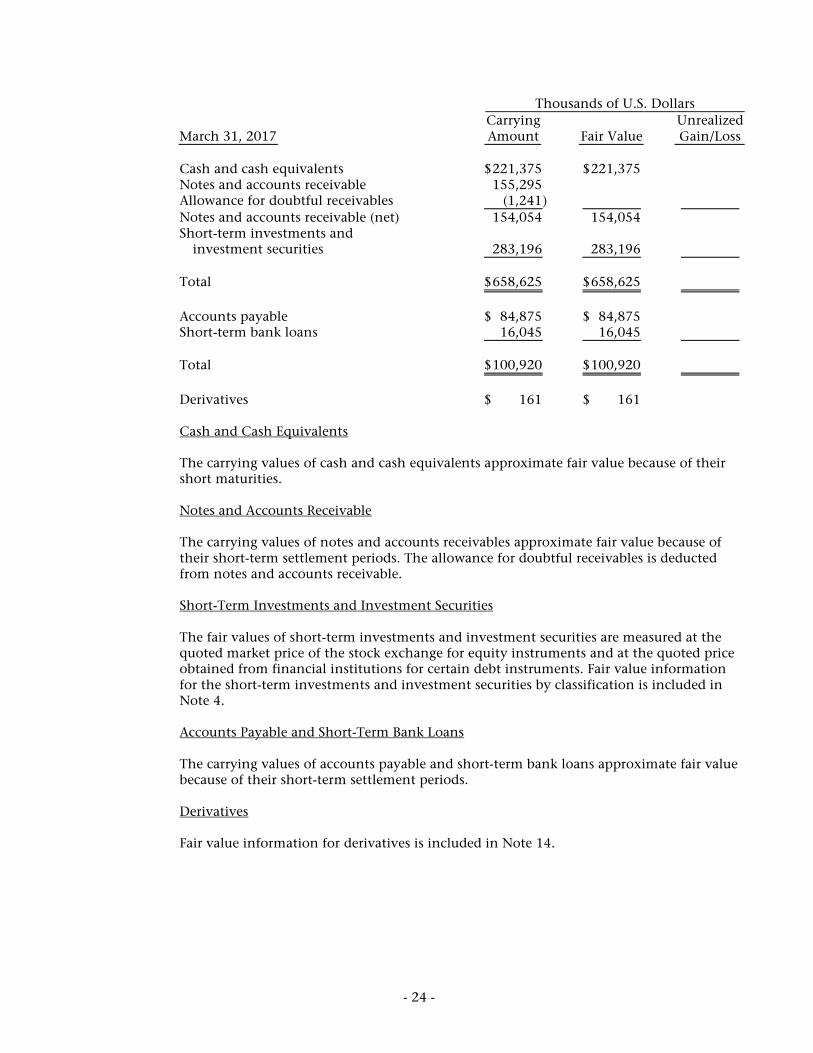
Thousands of U.S. Dollars
March 31, 2017 Carrying Amount Fair Value
Unrealized Gain/Loss
Cash and cash equivalents $ 221,375 $ 221,375 Notes and accounts receivable 155,295 Allowance for doubtful receivables (1,241 ) Notes and accounts receivable (net) 154,054 154,054 Short-term investments and investment securities 283,196 283,196 Total $ 658,625 $ 658,625 Accounts payable $ 84,875 $ 84,875 Short-term bank loans 16,045 16,045 Total $ 100,920 $ 100,920 Derivatives $ 161 $ 161
Cash and Cash Equivalents
The carrying values of cash and cash equivalents approximate fair value because of their short maturities. Notes and Accounts Receivable The carrying values of notes and accounts receivables approximate fair value because of their short-term settlement periods. The allowance for doubtful receivables is deducted from notes and accounts receivable. Short-Term Investments and Investment Securities The fair values of short-term investments and investment securities are measured at the quoted market price of the stock exchange for equity instruments and at the quoted price obtained from financial institutions for certain debt instruments. Fair value information for the short-term investments and investment securities by classification is included in Note 4. Accounts Payable and Short-Term Bank Loans The carrying values of accounts payable and short-term bank loans approximate fair value because of their short-term settlement periods. Derivatives Fair value information for derivatives is included in Note 14.

- 25 -
(b) Carrying amount of financial instruments whose fair value cannot be reliably determined
Millions of Yen Thousands of U.S. Dollars
2017 2016 2017
Investments in equity instruments that do not have a quoted market price in an active market ¥ 149 ¥ 41 $1,330
(6) Maturity Analysis for Financial Assets and Securities with Contractual Maturities
Millions of Yen
March 31, 2017
Due in 1 Year or Less
Due after 1 Year
through 5 Years
Due after 5 Years through 10 Years
Due after 10 Years
Cash and cash equivalents ¥ 24,791 Receivables 17,393 Total ¥ 42,184
March 31, 2016
Cash and cash equivalents ¥ 20,218 Receivables 17,635 Total ¥ 37,853
Thousands of U.S. Dollars
March 31, 2017
Due in 1 Year or Less
Due after 1 Year
through 5 Years
Due after 5 Years through 10 Years
Due after 10 Years
Cash and cash equivalents $ 221,348 Receivables 155,295 Total $ 376,643

- 26 -
14. DERIVATIVES The Group enters into derivative contracts, including foreign currency forward contracts, to hedge foreign exchange rate risk associated with certain assets and liabilities denominated in foreign currencies. All derivative transactions are entered into to hedge foreign currency exposures incorporated within the Group's business. Accordingly, market risk in these derivatives is basically offset by opposite movements in the value of hedged assets or liabilities. Because the counterparties to these derivatives are limited to major international financial institutions, the Group does not anticipate any losses arising from credit risk. Derivative transactions entered into by the Group have been made in accordance with internal policies that regulate the authorization and credit limit amount. Derivative Transactions to Which Hedge Accounting Is Not Applied Derivative transactions to which hedge accounting is not applied at March 31, 2017 and 2016, were as follows:
Millions of Yen
March 31, 2017 Contract Amount
Contract Amount Due after
1 Year Fair
Value Unrealized Gain/Loss
Foreign currency forward contracts— Selling Euro ¥1,491 ¥ 18 ¥ 18
March 31, 2016
Foreign currency forward contracts: Selling Euro ¥438 ¥ 10 ¥ 10 Buying U.S. dollar 175 (6 ) (6 )
Thousands of U.S. Dollars
March 31, 2017 Contract Amount
Contract Amount Due after
1 Year Fair
Value Unrealized Gain/Loss
Foreign currency forward contracts— Selling Euro $ 13,313 $ 161 $ 161
The fair value of derivative transactions is measured at the quoted price obtained from financial
institutions.
- 27 -
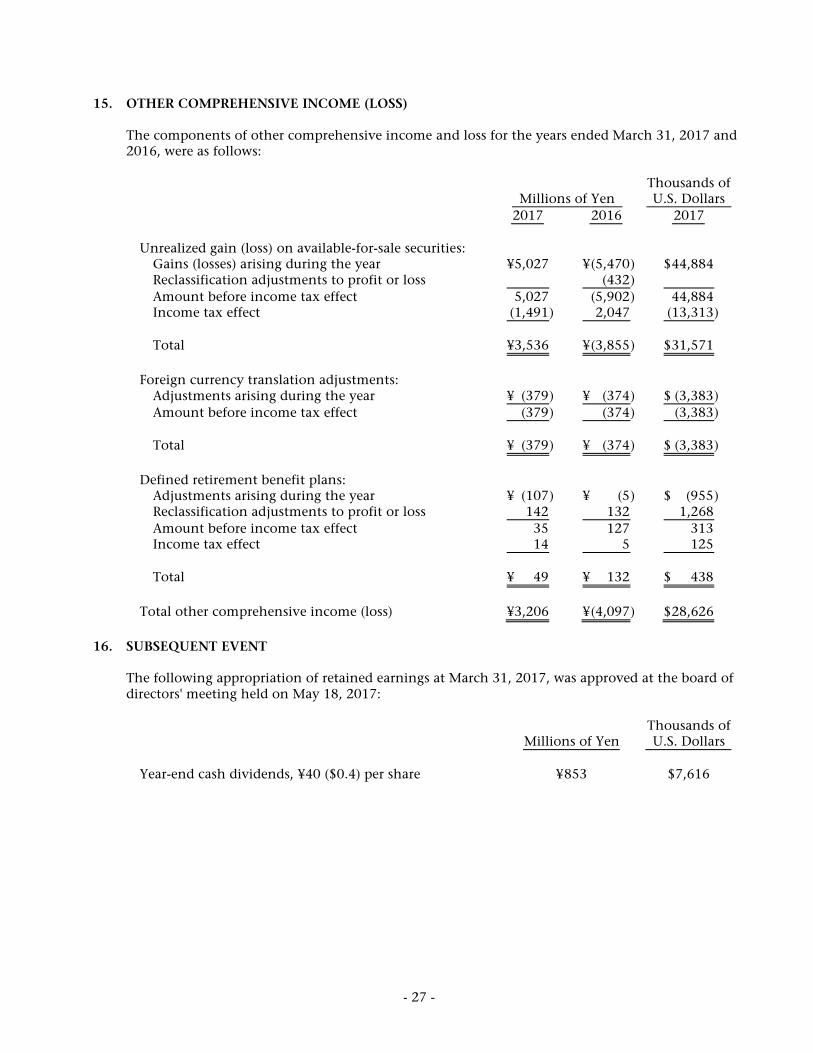
15. OTHER COMPREHENSIVE INCOME (LOSS) The components of other comprehensive income and loss for the years ended March 31, 2017 and 2016, were as follows:
Millions of Yen Thousands of U.S. Dollars
2017 2016 2017
Unrealized gain (loss) on available-for-sale securities: Gains (losses) arising during the year ¥5,027 ¥ (5,470 ) $ 44,884 Reclassification adjustments to profit or loss (432 ) Amount before income tax effect 5,027 (5,902 ) 44,884 Income tax effect (1,491 ) 2,047 (13,313 ) Total ¥3,536 ¥ (3,855 ) $ 31,571 Foreign currency translation adjustments: Adjustments arising during the year ¥ (379 ) ¥ (374 ) $ (3,383 ) Amount before income tax effect (379 ) (374 ) (3,383 ) Total ¥ (379 ) ¥ (374 ) $ (3,383 ) Defined retirement benefit plans: Adjustments arising during the year ¥ (107 ) ¥ (5 ) $ (955 ) Reclassification adjustments to profit or loss 142 132 1,268 Amount before income tax effect 35 127 313 Income tax effect 14 5 125 Total ¥ 49 ¥ 132 $ 438 Total other comprehensive income (loss) ¥3,206 ¥ (4,097 ) $ 28,626
16. SUBSEQUENT EVENT
The following appropriation of retained earnings at March 31, 2017, was approved at the board of directors' meeting held on May 18, 2017:
Millions of Yen Thousands of U.S. Dollars
Year-end cash dividends, ¥40 ($0.4) per share ¥ 853 $7,616

- 28 -
17. SEGMENT INFORMATION Under ASBJ Statement No. 17, "Accounting Standard for Segment Information Disclosures," and ASBJ Guidance No. 20, "Guidance on Accounting Standard for Segment Information Disclosures," an entity is required to report financial and descriptive information about its reportable segments. Reportable segments are operating segments or aggregations of operating segments that meet specified criteria. Operating segments are components of an entity about which separate financial information is available, and such information is evaluated regularly by the chief operating decision-maker in deciding how to allocate resources and in assessing performance. Generally, segment information is required to be reported on the same basis as is used internally for evaluating operating segment performance and deciding how to allocate resources to operating segments.
(1) Description of Reportable Segments
The Group is primarily engaged in the manufacture, development, and sale of visual display systems and related products. The Group consists of this single industry, and therefore, it is not required to disclose separate financial information by segment.
(2) Information about Products and Services
Millions of Yen 2017
Visual Display
Systems Amusement
Monitors Other Total
Sales to external customers ¥ 55,348 ¥ 18,409 ¥4,527 ¥ 78,284
Millions of Yen 2016
Visual Display
Systems Amusement
Monitors Other Total
Sales to external customers ¥ 54,626 ¥ 15,279 ¥4,974 ¥ 74,879
Thousands of U.S. Dollars 2017
Visual Display
Systems Amusement
Monitors Other Total
Sales to external customers $ 494,179 $ 164,366 $ 40,419 $ 698,964
(3) Information about Geographical Areas
(a) Sales
Millions of Yen 2017
Japan Europe North
America Other Total
¥ 44,123 ¥ 25,699 ¥5,322 ¥3,140 ¥ 78,284
- 29 -
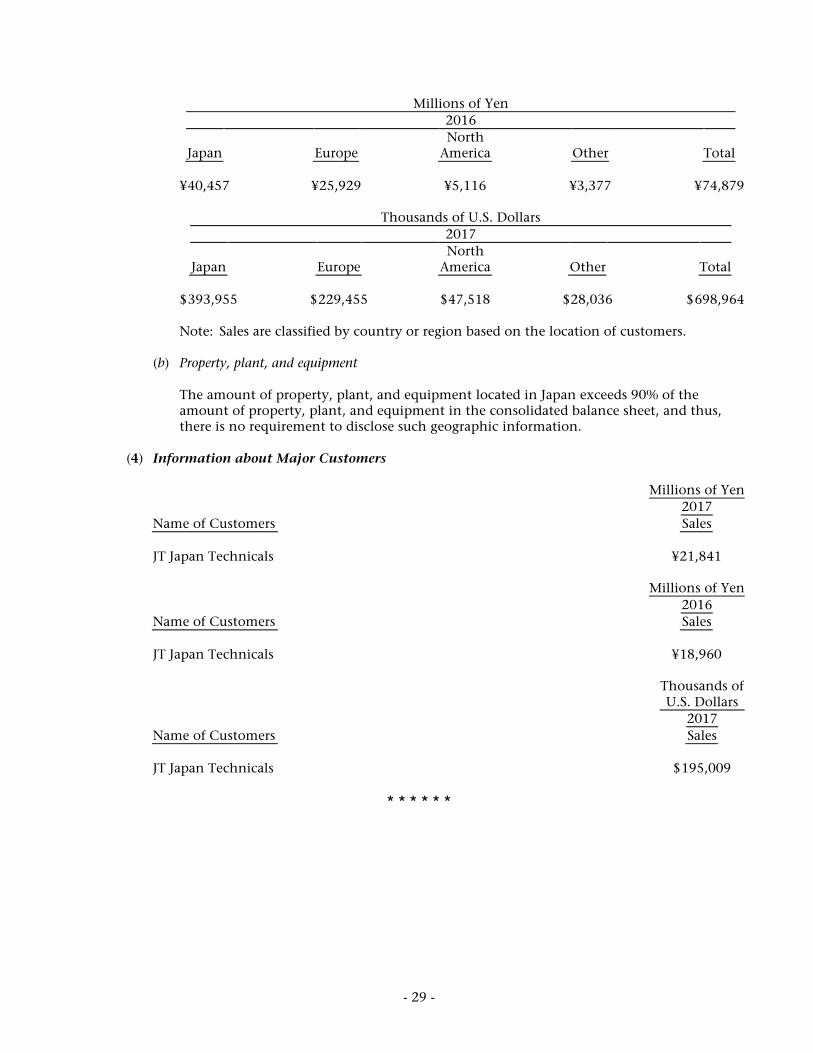
Millions of Yen 2016
Japan Europe North
America Other Total
¥ 40,457 ¥ 25,929 ¥5,116 ¥3,377 ¥ 74,879
Thousands of U.S. Dollars 2017
Japan Europe North
America Other Total
$ 393,955 $ 229,455 $ 47,518 $ 28,036 $ 698,964
Note: Sales are classified by country or region based on the location of customers.
(b) Property, plant, and equipment The amount of property, plant, and equipment located in Japan exceeds 90% of the amount of property, plant, and equipment in the consolidated balance sheet, and thus, there is no requirement to disclose such geographic information.
(4) Information about Major Customers
Millions of Yen 2017 Name of Customers Sales
JT Japan Technicals ¥ 21,841
Millions of Yen 2016 Name of Customers Sales
JT Japan Technicals ¥ 18,960
Thousands of U.S. Dollars
2017 Name of Customers Sales
JT Japan Technicals $ 195,009
* * * * * *