eis.hu.edu.jo complet e… · Web viewThe FOREX market is the largest market in the world, ......
31
The Hashemite University Faculty of Economics & Administrative Science Department of Banking & Finance Fall Semester 2013/2014 Course Name: Special Topics In Finance and Insurance Course code: 110204441 This material is prepared to cover the first topic covered in this course Topic One: Technical and fundamentals Analysis of Stock and FOREX market. Duration: one month Contents: • Overview. • Spot Rate Quotation. • Trading FOREX. • Trading on margin. • Why trade FOREX? • Trading Scenarios.
Transcript of eis.hu.edu.jo complet e… · Web viewThe FOREX market is the largest market in the world, ......

The Hashemite University
Faculty of Economics & Administrative Science
Department of Banking & Finance
Fall Semester 2013/2014
Course Name: Special Topics In Finance and Insurance
Course code: 110204441
This material is prepared to cover the first topic covered in this course
Topic One: Technical and fundamentals Analysis of Stock and FOREX
market.
Duration: one month
Contents:
• Overview.
• Spot Rate Quotation.
• Trading FOREX.
• Trading on margin.
• Why trade FOREX?
• Trading Scenarios.
• Types of Orders.
• Successful Traders.
• FOREX analysis (Fundamental vs technical).
• FOREX glossary.

Part I: Introduction to Trading FOREX
Overview
• Foreign exchange, FOREX, or just FX are all terms used to describe the trading of
the world's many currencies.
• The FOREX market is the largest market in the world, with trades amounting to
more than USD 3 trillion every day.
• Most FOREX trading is speculative, with only a low percentage of market activity
representing governments' and companies' fundamental currency conversion needs.
• Unlike trading on the stock market, the FOREX market is not conducted by a
central exchange, but on the “interbank” market, which is thought of as an OTC
(over the counter) market.
• Trading takes place directly between the two counterparts necessary to make a
trade, whether over the telephone or on electronic networks all over the world.
• The main centers for trading are Sydney, Tokyo, London, Frankfurt and New
York.
• This worldwide distribution of trading centers means that the FOREX market is a
24-hour market.
Spot Rate Quotations
1. Direct quotation (figure 1)
– the U.S. dollar equivalent
– e.g. “a Japanese Yen is worth about a penny”
2. Indirect Quotation (figure 2)
– the price of a U.S. dollar in the foreign currency
– e.g. “you get 100 yen to the dollar”.
Trading FOREX
• A currency trade is the simultaneous buying of one currency and selling of another
one.
• The currency combination used in the trade is called a cross (for example, the
euro/US dollar, or the GB pound/Japanese yen)
• The most commonly traded currencies are the so-called “majors” – EURUSD,
USDJPY and GBPUSD.
• The most important FOREX market is the spot market as it has the largest volume.
The market is called the spot market because trades are settled immediately, or “on
the spot”. In practice this means two banking days.

Trading on Margin
• A margin of 1.0% means you can trade up to USD 1,000,000 even though you
only have USD 10,000 in your account. A margin of 1% corresponds to a 100:1
leverage (or “gearing”).
• Using this much leverage enables you to make profits very quickly, but there is
also a greater risk of incurring large losses and even being completely wiped out.
Therefore, it is inadvisable to maximize your leveraging as the risks can be very
high.
The New York foreign exchange selling rates below apply to trading among banks in amounts of $1 million and more, as quoted at 4 p.m. Eastern time by Dow Jones Telerate Inc. and other sources. Retail transactions provide fewer units of foreign currency per dollar.
Special Drawing Rights (SDR) are based on exchange rates for the U.S., German, British, French, and Japanese currencies. Source: International Monetary Fund. European Currency Unit (ECU) is based on a basket of community currencies. a-fixing, Moscow Interbank Currency Exchange.
EXCHANGE RATES
Country Argentina (Peso) Australia (Dollar) Austria (Schilling) Bahrain (Dinar) Belgium (Franc) Brazil (Real) Britain (Pound) 30-Day Forward 90-Day Forward 180-Day Forward Canada (Dollar) 30-Day Forward 90-Day Forward 180-Day Forward Chile (Peso) China (Renminbi) Colombia (Peso) Czech. Rep (Krouna) Commercial rate Denmark (Krone) Ecuador (Sucre) Floating rate Finland (Markka) France (Franc) 30-Day Forward 90-Day Forward 180-Day Forward Germany (Mark) 30-Day Forward 90-Day Forward 180-Day Forward Greece (Drachma) Hong Kong (Dollar) Hungary (Forint) India (Rupee) Indonesia (Rupiah) Ireland (Punt) Israel (Shekel) Italy (Lira)
Wed. 1.0012
.7805 .09043 2.6525 .03080
.9607 1.6880 1.6869 1.6843 1.6802
.7399
.7414
.7442
.7479 .002352
.1201 .0009985
.... .03662
.1663 ....
.0002766 .2121 .1879 .1882 .1889 .1901 .6352 .6364 .6389 .6430
.004049 .1292
.006139 .02787
.0004233 1.6664
.3079 .0006483
Tues. 1.0012
.7902 .09101 2.6525 .03105
.9615 1.6946 1.6935 1.6910 1.6867
.7370
.7386
.7413
.7450 .002356
.1201 .0009985
.... .03677
.1677 ....
.0002787 .2135 .1893 .1896 .1903 .1914 .6394 .6407 .6432 .6472
.004068 .1292
.006164 .02786
.0004233 1.6714
.3085 .0006510
Wed. .9988
1.2812 11.058 .3770
32.470 1.0409
.5924
.5928
.5937 .5952
1.3516 1.3488 1.3437 1.3370 425.25 8.3272
1001.50 ....
27.307 6.0118
.... 3615.00
4.7150 5.3220 5.3126 5.2935 5.2617 1.5744 1.5714 1.5652 1.5552 246.98 7.7390 162.89 35.875
2362.15 .6001
3.2474 1542.50
Tues. .9988
1.2655 10.988
.3770 32.205 1.0401
.5901
.5905
.5914
.5929 1.3568 1.3539 1.3489 1.3422 424.40 8.3276
1001.50 ....
27.194 5.9633
.... 3587.50
4.6841 5.2838 5.2741 5.2558 5.2243 1.5639 1.5607 1.5547 1.5450 245.80 7.7390 162.23 35.890
2362.63 .5983
3.2412 1536.00
U.S. $ equiv. per U.S. $Currency
Country Japan (Yen) 30-Day Forward 90-Day Forward 180-Day Forward Jordan (Dinar) Kuwait (Dinar) Lebanon (Pound) Malaysia (Ringgit) Malta (Lira) Mexico (Peso) Floating rate Netherland (Guilder) New Zealand (Dollar) Norway (Krone) Pakistan (Rupee) Peru (new Sol) Philippines (Peso) Poland (Zloty) Portugal (Escudo) Russia (Ruble) (a) Saudi Arabia (Riyal) Singapore (Dollar) Slovak Rep. (Koruna) South Africa (Rand) South Korea (Won) Spain (Peseta) Sweden (Krona) Switzerland (Franc) 30-Day Forward 90-Day Forward 180-Day Forward Taiwan (Dollar) Thailand (Baht) Turkey (Lira) United Arab (Dirham) Uruguay (New Peso) Financial Venezuela (Bolivar) SDR ECU
Wed. .008639 .008676 .008750 .008865
1.4075 3.3367
.0006445 .4018
2.7624 ....
.1278
.5655
.7072
.1540 .02529 .3814
.03800 .3460
.006307 .0001787
.2666
.7116 .03259 .2141
.001184
.007546 .1431 .7334 .7357 .7401 .7470
.03638
.03902 .00000911
.2723 ....
.1145 .002098
- - - 1.4315 1.2308
Tues. .008681 .008718 .008791 .008907
1.4075 3.3389
.0006445 .4002
2.7701 ....
.1277
.5699
.7106
.1548 .02529 .3840
.03802 .3475
.006369 .0001788
.2667
.7124 .03259 .2142
.001184
.007603 .1435 .7387 .7411 .7454 .7523
.03637
.03906 .00000915
.2723 ....
.1145 .002096
1.4326 1.2404
Wed. 115.75 115.26 114.28 112.80
.7105
.2997 1551.50
2.4885 .3620
.... 7.8220 1.7685 1.4140 6.4926 39.540 2.6218 26.318 2.8900 158.55
5595.00 3.7503 1.4053 30.688 4.6705 844.75 132.52 6.9865 1.3635 1.3593 1.3511 1.3386 27.489 25.625
109755.00 3.6720
.... 8.7300 476.70
.6986
..........
Tues. 115.20 114.71 113.76 112.28 .7105 .2995
1551.50 2.4990 .3610
.... 7.8330 1.7547 1.4073 6.4599 39.540 2.6039 26.300 2.8780 157.02
5594.00 3.7502 1.4037 30.688 4.6690 844.65 131.53 6.9697 1.3537 1.3494 1.3416 1.3293 27.493 25.605
109235.00 3.6720
.... 8.7300 477.12
.6980
...........
U.S. $ equiv.Currencyper U.S. $Wednesday, January 8, 1997
Figure (1): Example of Direct Quotation
The direct quote for British pound is: £1 = $1.688

The New York foreign exchange selling rates below apply to trading among banks in amounts of $1 million and more, as quoted at 4 p.m. Eastern time by Dow Jones Telerate Inc. and other sources. Retail transactions provide fewer units of foreign currency per dollar.
Special Drawing Rights (SDR) are based on exchange rates for the U.S., German, British, French, and Japanese currencies. Source: International Monetary Fund. European Currency Unit (ECU) is based on a basket of community currencies. a-fixing, Moscow Interbank Currency Exchange.
EXCHANGE RATES
Country Argentina (Peso) Australia (Dollar) Austria (Schilling) Bahrain (Dinar) Belgium (Franc) Brazil (Real) Britain (Pound) 30-Day Forward 90-Day Forward 180-Day Forward Canada (Dollar) 30-Day Forward 90-Day Forward 180-Day Forward Chile (Peso) China (Renminbi) Colombia (Peso) Czech. Rep (Krouna) Commercial rate Denmark (Krone) Ecuador (Sucre) Floating rate Finland (Markka) France (Franc) 30-Day Forward 90-Day Forward 180-Day Forward Germany (Mark) 30-Day Forward 90-Day Forward 180-Day Forward Greece (Drachma) Hong Kong (Dollar) Hungary (Forint) India (Rupee) Indonesia (Rupiah) Ireland (Punt) Israel (Shekel) Italy (Lira)
Wed. 1.0012
.7805 .09043 2.6525 .03080
.9607 1.6880 1.6869 1.6843 1.6802
.7399
.7414
.7442
.7479 .002352
.1201 .0009985
.... .03662
.1663 ....
.0002766 .2121 .1879 .1882 .1889 .1901 .6352 .6364 .6389 .6430
.004049 .1292
.006139 .02787
.0004233 1.6664
.3079 .0006483
Tues. 1.0012
.7902 .09101 2.6525 .03105
.9615 1.6946 1.6935 1.6910 1.6867
.7370
.7386
.7413
.7450 .002356
.1201 .0009985
.... .03677
.1677 ....
.0002787 .2135 .1893 .1896 .1903 .1914 .6394 .6407 .6432 .6472
.004068 .1292
.006164 .02786
.0004233 1.6714
.3085 .0006510
Wed. .9988
1.2812 11.058 .3770
32.470 1.0409
.5924
.5928
.5937 .5952
1.3516 1.3488 1.3437 1.3370 425.25 8.3272
1001.50 ....
27.307 6.0118
.... 3615.00
4.7150 5.3220 5.3126 5.2935 5.2617 1.5744 1.5714 1.5652 1.5552 246.98 7.7390 162.89 35.875
2362.15 .6001
3.2474 1542.50
Tues. .9988
1.2655 10.988
.3770 32.205 1.0401
.5901
.5905
.5914
.5929 1.3568 1.3539 1.3489 1.3422 424.40 8.3276
1001.50 ....
27.194 5.9633
.... 3587.50
4.6841 5.2838 5.2741 5.2558 5.2243 1.5639 1.5607 1.5547 1.5450 245.80 7.7390 162.23 35.890
2362.63 .5983
3.2412 1536.00
U.S. $ equiv. per U.S. $Currency
Country Japan (Yen) 30-Day Forward 90-Day Forward 180-Day Forward Jordan (Dinar) Kuwait (Dinar) Lebanon (Pound) Malaysia (Ringgit) Malta (Lira) Mexico (Peso) Floating rate Netherland (Guilder) New Zealand (Dollar) Norway (Krone) Pakistan (Rupee) Peru (new Sol) Philippines (Peso) Poland (Zloty) Portugal (Escudo) Russia (Ruble) (a) Saudi Arabia (Riyal) Singapore (Dollar) Slovak Rep. (Koruna) South Africa (Rand) South Korea (Won) Spain (Peseta) Sweden (Krona) Switzerland (Franc) 30-Day Forward 90-Day Forward 180-Day Forward Taiwan (Dollar) Thailand (Baht) Turkey (Lira) United Arab (Dirham) Uruguay (New Peso) Financial Venezuela (Bolivar) SDR ECU
Wed. .008639 .008676 .008750 .008865
1.4075 3.3367
.0006445 .4018
2.7624 ....
.1278
.5655
.7072
.1540 .02529
.3814 .03800
.3460 .006307
.0001787 .2666 .7116
.03259 .2141
.001184
.007546 .1431 .7334 .7357 .7401 .7470
.03638
.03902 .00000911
.2723 ....
.1145 .002098
- - - 1.4315 1.2308
Tues. .008681 .008718 .008791 .008907
1.4075 3.3389
.0006445 .4002
2.7701 ....
.1277
.5699
.7106
.1548 .02529
.3840 .03802
.3475 .006369
.0001788 .2667 .7124
.03259 .2142
.001184
.007603 .1435 .7387 .7411 .7454 .7523
.03637
.03906 .00000915
.2723 ....
.1145 .002096
1.4326 1.2404
Wed. 115.75 115.26 114.28 112.80
.7105
.2997 1551.50
2.4885 .3620
.... 7.8220 1.7685 1.4140 6.4926 39.540 2.6218 26.318 2.8900 158.55
5595.00 3.7503 1.4053 30.688 4.6705 844.75 132.52 6.9865 1.3635 1.3593 1.3511 1.3386 27.489 25.625
109755.00 3.6720
.... 8.7300 476.70
.6986 ..........
Tues. 115.20 114.71 113.76 112.28
.7105
.2995 1551.50
2.4990 .3610
.... 7.8330 1.7547 1.4073 6.4599 39.540 2.6039 26.300 2.8780 157.02
5594.00 3.7502 1.4037 30.688 4.6690 844.65 131.53 6.9697 1.3537 1.3494 1.3416 1.3293 27.493 25.605
109235.00 3.6720
.... 8.7300 477.12
.6980
...........
U.S. $ equiv.Currencyper U.S. $Wednesday, January 8, 1997
Figure (2): Example of Indirect Quotation
The direct quote for British pound is: £0.5924= $11

Why Trading FOREX
• 24 hour trading
Trade 24 hours a day from Sunday evening (20:00 GMT) to Friday evening (22:00
GMT). This gives you a unique opportunity to react instantly to breaking news that
is affecting the markets.
Figure (3) Worldwide FOREX trading time
• Superior liquidity
The FOREX market is so liquid that there are always buyers and sellers to trade
with. The liquidity helps to ensure price stability and narrow spread.
• No commissions
The fact that FOREX is often traded without commissions makes it very attractive
as an investment opportunity for investors who want to deal on a frequent basis.
• 100:1 Leverage
Leverage (gearing) enables you to hold a position worth up to 100 times more than
your margin deposit.
• Profit potential in falling markets
There are always trading opportunities, whether a currency is strengthening or
weakening in relation to another currency. When you trade currencies, they
literally work against each other.
If the EURUSD declines, for example, it is because the US dollar gets stronger
against the euro and vice versa. So, if you think the EURUSD will decline (that is,
that the euro will weaken versus the dollar), you would sell EUR now and then
later you buy euro back at a lower price and take your profits.
Trading Scenarios
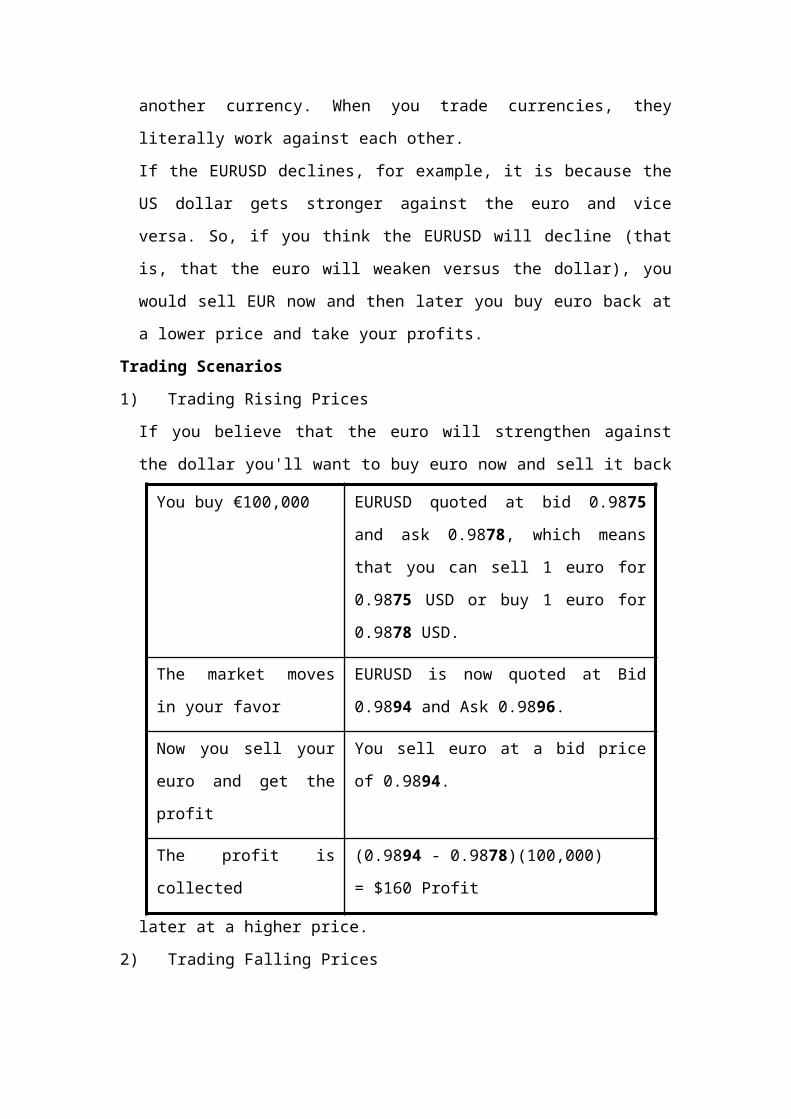
1) Trading Rising Prices

If you believe that the euro will strengthen against the dollar you'll want to buy
euro now and sell it back later at a higher price.
2) Trading Falling Prices
If, on the other hand, you believe that the euro will weaken against the dollar, you'll
sell EURUSD.
You sell €100,000 EURUSD quoted at bid 0.9875 and ask
0.9880, which means that you can sell 1
euro for 0.9875 USD or buy 1 euro for
0.9880 USD.
The market moves in your
favor
EURUSD is now quoted at Bid 0.9744 and
Ask 0.9749.
Now you buy euro and get
the profit
You buy euro at the ask price of 0.9749.
The profit is collected (0.9875 - 0.9749)(100,000)
= $1260 Profit
Types of Orders
1. Market Order
It is the order to buy (sell) a specific amount of a certain currency at the best
available market price.
2. Entry order
An order that is executed when a particular price level is reached and/or broken.
3. Stop Entry orders
You buy €100,000 EURUSD quoted at bid 0.9875 and ask
0.9878, which means that you can sell 1 euro
for 0.9875 USD or buy 1 euro for 0.9878
USD.
The market moves in your
favor
EURUSD is now quoted at Bid 0.9894 and
Ask 0.9896.
Now you sell your euro and
get the profit
You sell euro at a bid price of 0.9894.
The profit is collected (0.9894 - 0.9878)(100,000)
= $160 Profit
Are executed when the exchange rate breaks through a specific level. The client
placing a stop entry order believes that when the market's momentum breaks
through a specified level, the rate will continue in that direction.
4. Limit Entry orders
Are executed when the exchange rate touches (not breaks) a specific level. The
client placing a limit entry order believes that after touching a specific level, the
rate will bounce in the opposite direction of its previous momentum.
5. Stop-Loss Order
Is an entry order linked to a specific position for the purpose of stopping the
position from accruing additional losses. A stop-loss order remains in effect until
the position is liquidated or the client cancels the stop-loss order.
6. Limit Order:
Is a limit entry order linked to a specific position for the purpose of locking in the
gains on an existing position. A Limit order placed on a Buy position is a Close
entry order to Sell linked to that position. A Limit order remains in effect until the
position is liquidated or the client cancels the Limit order.
Discipline & Confidence
Confidence(3)
Successful Trader
Knowledge(1)
Discipline(2)

FOREX Analysis
• Basically, supply and demand determine the value of currencies. To forecast the
currency trend, there are two methodologies, which are fundamental and technical
analysis.
Fundamental Analysis
• Fundamental analysis is Based on key economic indicators that can influence
various currencies.
• Fundamental analysis studies cause of market movement.
• Fundamental analysis uses present events to predict future.
• Analysts will gain knowledge of charts analysis and indicators
• Fundamental analysis finds explanation of the current price.
• The outcome in the fundamental analysis is based on limited aspects at one time.
Technical Analysis
• Technical analysis is based on past performance of a currency or equity and
exercise with mathematical calculations to predict future results.
• Technical analysis studies the economic effect.
• Technical analysis predicts future from history.
• Analyst will gain knowledge of awareness of the fundamentals.
• Technical analysis find accurate forecast of future.
• Outcome is based on more than 150 different type of technical analysis
FOREX Glossary
Appreciation: is an increase in the value of a currency.
Depreciation/decline: is a fall in the value of a currency.
Ask: is the price requested by the trader. This usually indicates the lowest price a
seller will accept.
Bid: is the price offered by the trader. This usually indicates the highest price a
purchaser will pay.
Spread: The difference between the bid and the ask rate.
Bear: Someone who believes prices are heading down. A bear market is one in
which there has been a sustained fall in prices and which does not look like it will
recover quickly.
Bull: Someone who is optimistic about the market. A bull market is characterized
by enthusiastic and sustained buying.

Exchange rate: What one currency is worth in terms of another, for example the
Australian dollar might be worth 58 US cents or 70 yen.
Liquidity: The capacity to be converted easily and with minimum loss into cash. A
liquid market is one in which there is enough activity to satisfy both buyers and
sellers.
Open position: A position in a currency that has not yet been offset. For example,
if you have bought 100,000 USDJPY, you have an open position in USDJPY until
you offset it by selling 100,000 USDJPY, thus “closing” the position.
Short position: A position that benefits from a decline in market prices.
Long position: A position that increases its value if market prices increase.
Pips: A pip is the smallest unit by which a FOREX cross price quote changes. So if
EURUSD bid is now quoted at 0.9767 and it moves up 2 pips, it will be quoted at
0.9769.
Speculative: Buying and selling in the hope of making a profit, rather than doing so
for some fundamental business-related need.
Spot: A Spot rate is the current market price of an asset.
Spot market: The part of the market calling for spot settlement of transactions. The
precise meaning of “spot” will depend on local custom for a commodity, security
or currency. In the UK, US and Australian foreign-exchange markets, “spot”
means delivery two working days hence.

Part II: FOREX Technical Analysis
• What is Technical Analysis?
Technical analysis can be described as the mathematical analysis of historical data that carries out price forecast.
Technical analysis is based on the fact that there is a certain direction or a chart pattern for the price movement, but not at finding out the reasons of such movements, like complicated business environment, low earnings and level of management and other fundamental factors.
Technical analysis can be further divided into two major forms:
1) Chartism Analysis: uses lines and figures to identify recognizable trends and patterns in the information of currency rates.
2) Quantitative Analysis: uses various statistical properties to help assess the
extent of an overbought/oversold currency.
There are three basic premises of technical analysis:
1) Price movements are not random, but tend to trend in some direction of the
time. (Price movement has a purpose);
2) The price discounts all information available in the market (Everything should be considered);
3) History is repeat itself.
Types of Charts
• Four types of charts will be viewed:– Tick Chart.– Line Charts.– Bar Charts.– Japanese Candlestick Chart.
1. Tick Chart:
• Tick chart has the finest scale - 1 tick (individual quoting of bid and ask prices by market-maker). It is the chart of Bid and Ask quotations which look as columns on the chart of the prices. The maximum of each separate column is Ask, the minimum of each concrete column is Bid.
• As a rule tick chart is not used for the analysis of the market as its scale is so small that does not approach for the technical analysis. However tick charts are effectively used for exact definition of support and resistance levels and also to raise efficiency of purchases and sales, making it on local minima and maxima.

2. Line Chart:
• All charts are plotted with time on the x-axis and the currency pair on the y-axis. Each time period on our real time charts can range from a tick by tick to a weekly interval (the tick refers to each individual pip movement). This gives traders the flexibility to view currencies with closer examination while also allowing them to spot the trends most suitable for their time-sensitive trading strategy.
• A line chart's strength comes from its simple design; it provides an uncluttered, easy to understand view of a currency's price. Line charts display the currency's closing price.
• A line chart is simply a graph of the value of a currency taken at regular time intervals based on current prices.
3. Bar (Histogram) Chart:
• Standard bar charts are commonly used to convey price activity into an easily readable chart.
• Usually four elements make up a bar chart, the Open, High, Low, and Close for the trading session/time period.
• A price bar can represent any time frame the user wishes, from 1 minute to 1 month.
• The total vertical length/height of the bar represents the entire trading range for the period.

• The top of the bar represents the highest price of the period, and the bottom of the bar represents the lowest price of the period.
• The Open is represented by a small dash to the left of the bar, and the Close for the session is a small dash to the right of the bar.
• On a daily bar chart each bar represents one day's activity. The vertical bar is
drawn from the day's highest price to the day's lowest price. Closing price and
opening price are represented by ticks on the bar.
• Traditionally, the most popular time interval for bar chart is hourly chart. However, since the wide availability of the real time prices, it is common to use smaller time interval such as 30 minutes, 15 minutes, 5 minutes, 1 minute.
4. Japanese Candlestick Chart:
• Candlestick charts are much more visually appealing than a standard two-dimensional bar chart.
• As in a standard bar chart, there are four elements necessary to construct a candlestick chart, the OPEN, HIGH, LOW and CLOSING price for a given time period.
• A candlestick can either be solid or transparent. Its appearance depends on the relationship between the opening and the closing price. If the close is higher than the open, the candlestick is transparent or empty. If the close is lower than the open, the candle is solid or filled.
• When two thin lines extend vertically above and/or below the body of the candle, this means that they represent the highs and lows respectively. The high and the low for the period and referred to as shadows.

• Candlestick charts have three major advantages when compared to bar charts:– Candlestick charts are much more "visually immediate" than bar charts.– candles are vital for spotting reversals. These reversals are usually short term -
precisely the kind the swing trader is looking for.– Candlesticks are able to accurately pick up on the changes in trend that occur at the
end of each market swing.
Graphical Methods
– Support and Resistance Levels.– Trend Lines.– Channel and Trading Range.– Technical Patterns.
Support and Resistance levels
• One use of technical analysis is to derive "support" and "resistance" levels.• The underlying idea is that the market will tend to trade above its support levels
and below its resistance levels.• A support level indicates a specific price level that the currency will have
difficulties crossing below. If the price repeatedly fails to move below this particular point, a straight line pattern will appear.
• Resistance levels on the other hand, indicates a specific price level that the currency will have difficulties crossing above. Recurring failure for the price to move above this point will produce a straight line pattern.

Trend Lines:
• There are some types of trend lines in technical analysis:– Ascending Trend.– Descending Trend.– Reversal Trend.
Ascending Trend:
• If currency demand exceeds the currency offer the exchange rate grows on FOREX. On the contrary if the volume of currency which participants of the market wish to sell under the given concrete price more than volume of currency which other participants of the market wish to buy the rate falls.
• Each time in exchange rate achieves higher value in comparison with previous rate - price movement at which each subsequent local maximum and local minimum above previous.

Descending Trend:
• Each time FOREX rate achieves lower value - price movement, at which each subsequent local maximum and local minimum below previous.
• The more points of Forex rate values get on a straight line, the more trend is especially confirmed.
Reversal Trend:
• Change of a trend (reversal) is expressed in change of a rate movement direction after a break point (penetration point).
• However, it should be distinguished from a simple non-standard rate deviation which doesn't lead to change of a trend.
• The break point forms a sell signal for the confirmed change of an ascending trend, the confirmed change of a descending trend forms a buy signal.
• The best confirmation of change of a trend can be received when the former resistance line becomes a support line of a trend and on the contrary.

Channel and Trading Range:
• When the currency shifts between 2 parallel trend lines the channel is created.• The first thing to do in creating a channel to depict the primary trendline, above the
highs for a downward trend or below the bottoms for an up-trend. Connecting at least 2 subsequent highs draws a downward straight line.
• A channel is effectively working in two trend lines, which are depicted parallel to each other, the lower line acting as the support, and the higher line as the resistance one. It can be:
– Upward,– Downward, or– Sideways.

Technical Patterns.
– Continuation Patterns;
– Reversal Patterns.
Continuation Patterns:
1) Flags: Shaped like a flagpole with a pennant, this formation is characterized
by an upward movement with a large slope followed by a period of
consolidation.
2) Pennons: The pattern is characterized by a moderate movement in the opposite
direction to the main trend. Again using bar charts this period can last from
three to seven days before a sharp breakout in the direction of the original
trend is seen.

3) Triangles: This type of pattern characterized by a series of progressively lower
peaks and higher troughs is a sign of market indecision. The price usually
breaks out of this pattern by an amount equal to the base of the triangle and in
the direction of the original trend. There are four types:
– Ascending Triangle.
– Descending Triangle.
– Symmetrical Triangle.
Ascending Triangle: Ascending Triangles is a bullish continuation pattern that is
shaped like a right triangle consisting of two or more equal highs forming a
horizontal line at the top.
Descending Triangles is a bearish continuation pattern, the definitive bearish signal
of a descending triangle is when support on the lower rung of the triangle is
broken.
Symmetrical triangle: Also referred to as a coil, usually forms during a trend as a
continuation pattern. It contains at least two lower highs and two higher lows. At
the time these points are conjoined, the lines converge as they are extended and the
symmetrical triangle takes shape. One can also think of it as a contracting wedge,
wide at the beginning and narrowing over time.

Reversal Patterns:
1) Double Bottoms: implies a lower limit which the currency pair has touched
twice but has failed to penetrate. Accordingly, the asset can be expected to
trade within this range, or, if there is a breakout, the movement is expected to
be substantial.
2) Double Tops: A double top implies an upper limit which the currency pair has
touched twice but has failed to penetrate. Accordingly, the asset can be
expected to trade within this range, or, if there is a breakout, the movement is
expected to be substantial.
3) Head and Shoulders: A pattern resembling two peaks (the shoulders) with a
higher peak between the two shoulders (the head).
– The neckline, or the bottom boundary that both shoulders reach, is regarded
as a key point traders can use to enter/exit positions.
– This is probably the most famous of all chart patterns, but not always the
most reliable. When it works it will always be seen as a reversal pattern and
consists of four phases.

– The first phase is the formation of a small peak (point A which is the left
shoulder), retraces and then is followed by more aggressive buying to
create the head, which eventually retraces and tests the support (know as
the neckline), followed by another attempt at a rally, which does not
produce a peak as high as the head (point C). This is then followed by
another test of the neckline.
4) Inverse Head and Shoulders:
5) Triple Bottoms: is a pattern in which a currency has reached a price three
times previously, yet has been unable to sustain movements beyond those
three bottoms.

6) Triple Tops: is a pattern in which a currency has reached a price three times
previously, yet has been unable to sustain movements beyond those three
peaks.

Part II: FOREX Fundamental Analysis
What is Fundamental Analysis?
The Core of Fundamental Analysis.
Fundamental Indicators.
What is Fundamental Analysis?
– Fundamental analysis is based on key economic indicators that can
influence various currencies.
– Fundamental analysis studies cause of market movement.
– Fundamental analysis uses present events to predict future.
– Fundamental analysis finds explanation of the current price movements.
– It is possible to predict the conditions of the economy but unlikely the
market prices by using the fundamental analysis.
– You should have a certain plan of action concerning the ways of using the
information as entry and exit spots in a certain strategy of trading.
– The economic conditions in the currency native country along with a
number of other factors are the obligatory elements of the fundamental
analysis.
The Core of Fundamental Analysis?
Fundamental elements of the economy:
1. The Business Cycle:
The activity of the economy is generally shown by the business cycle. The
business cycle consists of four stages: recovery (also known as expansion), peak,
contraction (also called recession), and trough.
The growth of business activities imply an increase of the demand and the
supply which in turn cause and expansion in the employment.
The interest rates also is related to the business cycle. Generally rise during
the expansion and fall during the contractions.

2. Inflation:
At the moment of business cycle peak the amount of goods on demand gets
higher which is followed by an increase in the price level.
At the inflationary environment the customers’ purchasing power become
lower and the amount of money offered for the goods is higher.
The demand declines lowering the economic activity due to the prices
increase. The recessionary phase follows this process.
3. Gross National Product (GNP)
Gross National Product is one of the key indicators of the economic
activity. All the services provided and the goods produced within the
economy form the GNP. There are 4 components included in the GNP.
They are: consumer spending, government spending, investments, and net
exports.
One of the most important figure that affect the FOREX market is whether
the interest rate will go up or down.
The inflation rate is always linked to the interest rate. In other world, the
interest rate level is determined based on the inflation rate .
Inflation can take place in the following ways for which different data has to be
looked at.
1. Growth push inflation.
2. Price push inflation.
3. Wage push inflation.
4. Demand push inflation.
The trader should therefore look at the following data to check whether the interest
rate will go up or down.
Growth push inflation: this results because of a strong growth of the economy, we
need to look at the following indicators:
i. GDP figures,
ii. Unemployment,
iii. Non-farm payrolls.
Price push inflation: this results because of the prices going up. We need to look at
the following indicators:
i. PPI figures,
ii. CPI figures.

Wage push inflation: this results because of wage pressures and earnings going up.
We need to look at the following indicators:
i. Average Hourly Earnings,
ii. Employment Cost Index.
Demand push inflation: this results because of demand pressures. We need to look
at the following indicators:
i. Retail Sales,
ii. Car and Trucks Sales,
iii. Home Sales.
At any point of time for the central bank to move in to hike interest rates it is
important that out of the above four factors at least three should indicate a rise in
inflation.
In most cases, the market reaction to an economics news report is partly
determined by:
1. The market consensus forecast.
2. How significant data revisions are in previous periods.
3. The reliability and comprehensiveness of an economic indicator.
4. How important the indicator is thought to be to policy makers.
Every Economic Indicator Has a Story to Tell.