2010 10 27 Workshop Besparen Met Antwoord Benchmark Pu Za Brw Groep

EIGHTH INTERNATIONAL BENCHMARK WORKSHOP
ON
NUMERICAL ANALYSIS OF DAMS
23-30 October, 2005
Wuhan, Hubei, P.R.China
Organized by
ICOLD Ad-Hoc Committee on Computational Aspects of Analysis and Design of Dams
Wuhan University State Key Lab of Water Resources and Hydropower Engineering Science, China
Official supporting journal
The International Journal on Hydropower and Dams
Co-sponsored by Chinese National
Committee on Large Dams, China
Guiyang Hydroelectric Power Investigation, Design and Research
Institute, China
West-Northern China Hydroelectric Power
Investigation, Design and Research Institute, China
Hohai University, China
- 1 -
Table of Contents
Scientific and organizing Committees I
Theme A: Evaluation of alkali-aggregate reaction effects on the behaviour of an Italian hollow gravity dam
Keynote address: Assessment of ASR damages in concrete dams by overall and local in situ tests and inverse analysis, by Prof. G. Maier
Problem A: Evaluation of alkali-aggregate reaction effects on the behaviour of an Italian hollow gravity dam, Prepared by P. Masarati, G. Mazzà, M. Meghella, CESI S.p.A., Milan, Italy
·
Theme B: Temperature field simulation or/and crack analysis of a RCC arch dam
Keynote address: About the development of RCC arch dams, by A. Carrere
Problem B: Temperature field simulation or/and crack analysis of a RCC arch dam, by Prof. S.H.Chen, China
·3D Thermal analysis of a RCC arch dam, by Dr. C.J. Peng, X.T.WU, S.H.Chen, Wuhan University,China
· Development of RCC Construction Technology of GHIDRI, by C.J. Lan, J.X. Yang,Guiyang, Hydroelectric Investigation Design & Research Institute, CHECC
Theme C -Evaluation of the behavior and safety (static and dynamic) of a rock fill dam
Keynote address: Numerical modeling of earth dams, by I. Shahrour Problem C: Evaluation of the behavior and safety (static and dynamic) of a rock fill dam,by Dr
Ignacio Escuder Bueno,Spain Program of meeting
- 2 -

Advisory Committee H.Q.Chen(China) J.S.Jia(China) C.J. Lan(China) J.N.Liu(China)
Z.Mao(China) J.Z. Pan(China) Z.J.Shen(TChina) G.H.Shi(USA) R.K.Wang(China) Z.R.Wu(China) J.Xia(China) Y.X. Yan(China)
J.X.Yang(China) C.H.Yeh(USA) D.R.J. Owen(U.K.) C.H.Zhang(China) R.K.Zhang(China) C.K. Zhang(China) J.P.Zhou(China) B.F.Zhu(China)
L.C.Zou(China)
Scientific Committee Chairman
A. Carrere (France) Vice Chairman G.Mazza (Italy)
Members C. Bossoney(Switzerland) S.H.Chen(China) D. Curtis(Canada) M.Fanelli(Italy)
L.Kongeter(Germany) Y.P.Liapichev(Russia) G.Manueco(Spain) E.Matheu(USA) A. Popovic(Romania) O.Ravaska(Finland) I.Shahrour(France) G.Skans(Sweden)
S.N.Soheili(Iran) Y.Uchita(Japan) G.Zenz(Austria)
Organizing Committee A. Carrere( France) S.H.Chen(China) Ignacio Escuder Bueno (Spain) X.Z.Feng(China)
J.S.Huang(China) C.Z.Jiang(China) J.B.Lu(China) G. Mazza(Italy) A.Popovici(Romania) G.M. Tan(China) Y.Q.Wu (China) J.D. Yang(China)
J.Z. Yang(China) J.Q.Zhang(China) J.Zhao(China) Y.M.Zhu(China)
Technical Secretariat State Key Laboratory of Water Resources and Hydropower Engineering Science
Wuhan University Attn: Dr. Wu Yun-qing
8th, South Road of Donghu, Wuhan, Hubei 430072, P.R.China
Phone:+86-27-68772275 Mobile:+86-27-62113895
E-Mail: [email protected] Website:http://dam.waterlab.cn
Y.Q.Wu (China) S.Z. Zhang(China) C.X. Ren(China) F.Wang(China) C.J. Peng(China) W.M.Wang(China)
- 3 -

EIGHTH INTERNATIONAL BENCHMARK WORKSHOP
ON
NUMERICAL ANALYSIS OF DAMS
23-30 October, 2005
Wuhan, Hubei, P.R.China
THEME A
EVALUATION OF ALKALI-AGGREGATE REACTION EFFECTS ON THE
BEHAVIOUR OF AN ITALIAN HOLLOW GRAVITY DAM
- 4 -
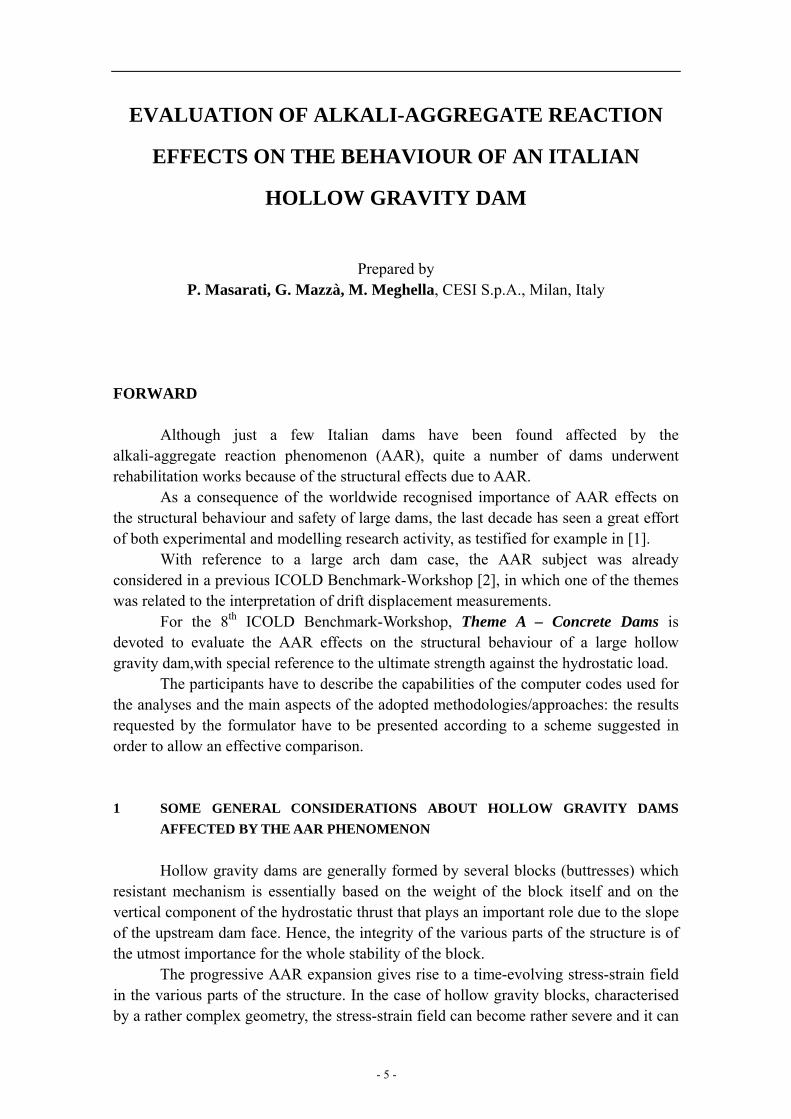
EVALUATION OF ALKALI-AGGREGATE REACTION
EFFECTS ON THE BEHAVIOUR OF AN ITALIAN
HOLLOW GRAVITY DAM
Prepared by P. Masarati, G. Mazzà, M. Meghella, CESI S.p.A., Milan, Italy
FORWARD
Although just a few Italian dams have been found affected by the alkali-aggregate reaction phenomenon (AAR), quite a number of dams underwent rehabilitation works because of the structural effects due to AAR.
As a consequence of the worldwide recognised importance of AAR effects on the structural behaviour and safety of large dams, the last decade has seen a great effort of both experimental and modelling research activity, as testified for example in [1].
With reference to a large arch dam case, the AAR subject was already considered in a previous ICOLD Benchmark-Workshop [2], in which one of the themes was related to the interpretation of drift displacement measurements.
For the 8th ICOLD Benchmark-Workshop, Theme A – Concrete Dams is devoted to evaluate the AAR effects on the structural behaviour of a large hollow gravity dam,with special reference to the ultimate strength against the hydrostatic load.
The participants have to describe the capabilities of the computer codes used for the analyses and the main aspects of the adopted methodologies/approaches: the results requested by the formulator have to be presented according to a scheme suggested in order to allow an effective comparison. 1 SOME GENERAL CONSIDERATIONS ABOUT HOLLOW GRAVITY DAMS
AFFECTED BY THE AAR PHENOMENON
Hollow gravity dams are generally formed by several blocks (buttresses) which resistant mechanism is essentially based on the weight of the block itself and on the vertical component of the hydrostatic thrust that plays an important role due to the slope of the upstream dam face. Hence, the integrity of the various parts of the structure is of the utmost importance for the whole stability of the block.
The progressive AAR expansion gives rise to a time-evolving stress-strain field in the various parts of the structure. In the case of hollow gravity blocks, characterised by a rather complex geometry, the stress-strain field can become rather severe and it can
- 5 -
give rise to crack formation and propagation, potentially dangerous, in principle, for the block stability.
Poglia Dam, located in Italy and briefly described in the following chapter, is the hollow gravity dam chosen for the proposed theme, as its owner (EDISON S.p.A.) has kindly allowed to use it as test-case for the benchmark. 2 SHORT DESCRIPTION OF POGLIA DAM
Poglia Dam is a large concrete hollow gravity structure located in the north of Italy [3]: the construction works took place in the period 1949-1950.
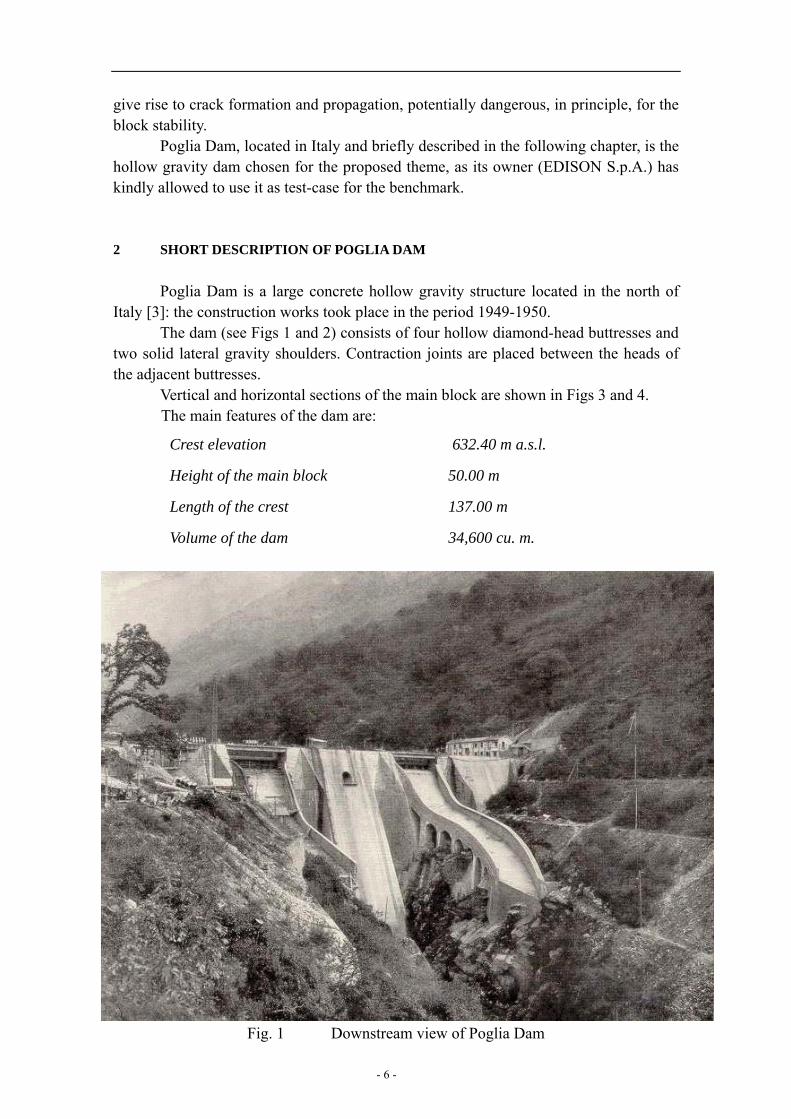
The dam (see Figs 1 and 2) consists of four hollow diamond-head buttresses and two solid lateral gravity shoulders. Contraction joints are placed between the heads of the adjacent buttresses.
Vertical and horizontal sections of the main block are shown in Figs 3 and 4. The main features of the dam are:
Crest elevation 632.40 m a.s.l.
Height of the main block 50.00 m
Length of the crest 137.00 m
Volume of the dam 34,600 cu. m.
Fig. 1 Downstream view of Poglia Dam
- 6 -

Fig. 2 Plan of Poglia Dam
Fig. 3 Vertical section of the main block
- 7 -
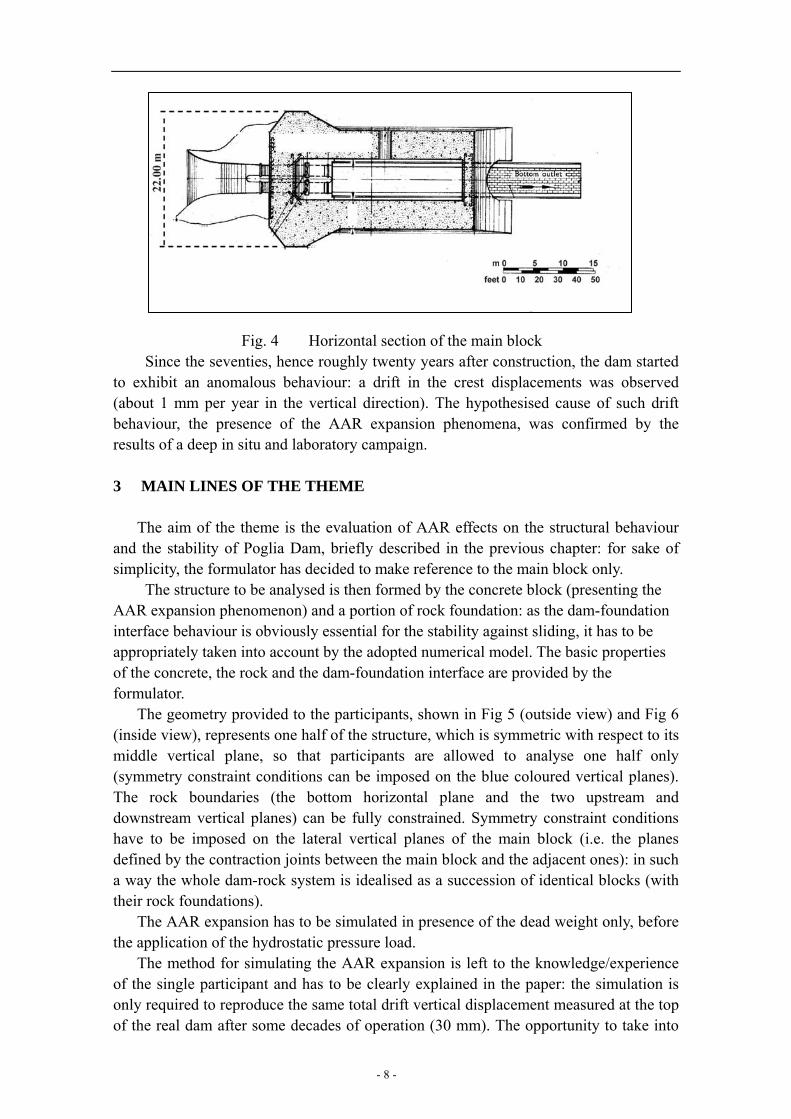
Fig. 4 Horizontal section of the main block Since the seventies, hence roughly twenty years after construction, the dam started
to exhibit an anomalous behaviour: a drift in the crest displacements was observed (about 1 mm per year in the vertical direction). The hypothesised cause of such drift behaviour, the presence of the AAR expansion phenomena, was confirmed by the results of a deep in situ and laboratory campaign. 3 MAIN LINES OF THE THEME
The aim of the theme is the evaluation of AAR effects on the structural behaviour and the stability of Poglia Dam, briefly described in the previous chapter: for sake of simplicity, the formulator has decided to make reference to the main block only.
The structure to be analysed is then formed by the concrete block (presenting the AAR expansion phenomenon) and a portion of rock foundation: as the dam-foundation interface behaviour is obviously essential for the stability against sliding, it has to be appropriately taken into account by the adopted numerical model. The basic properties of the concrete, the rock and the dam-foundation interface are provided by the formulator.
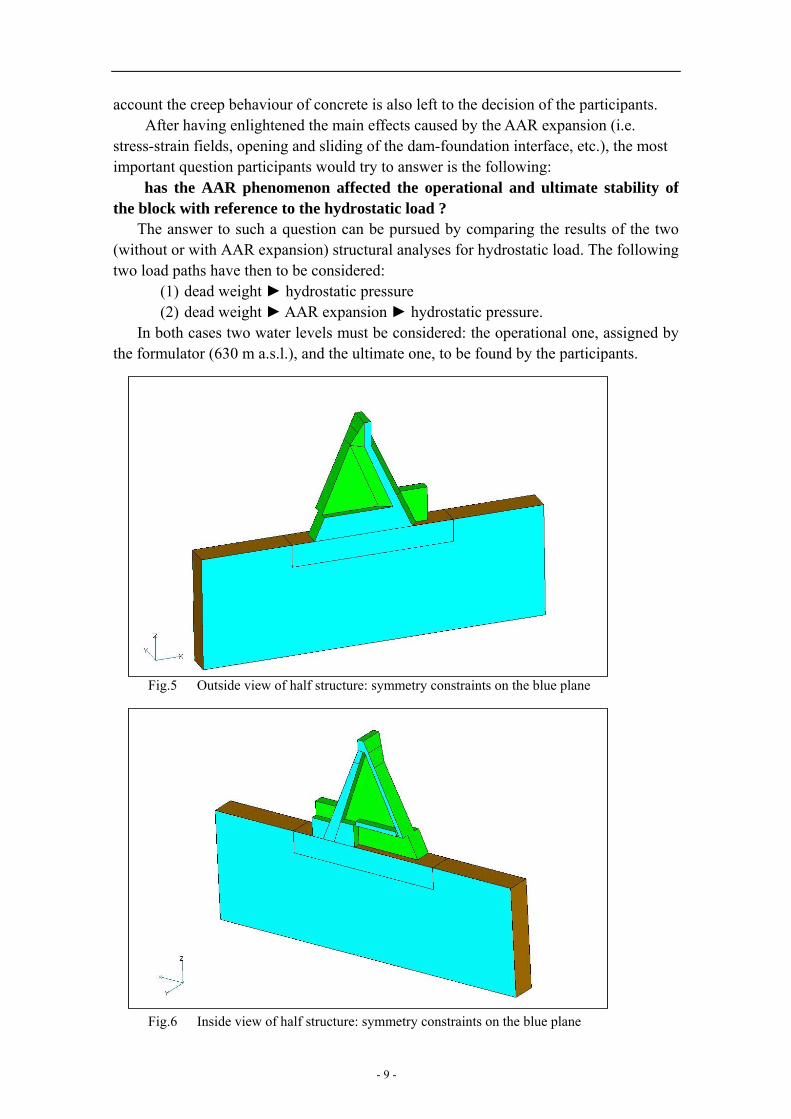
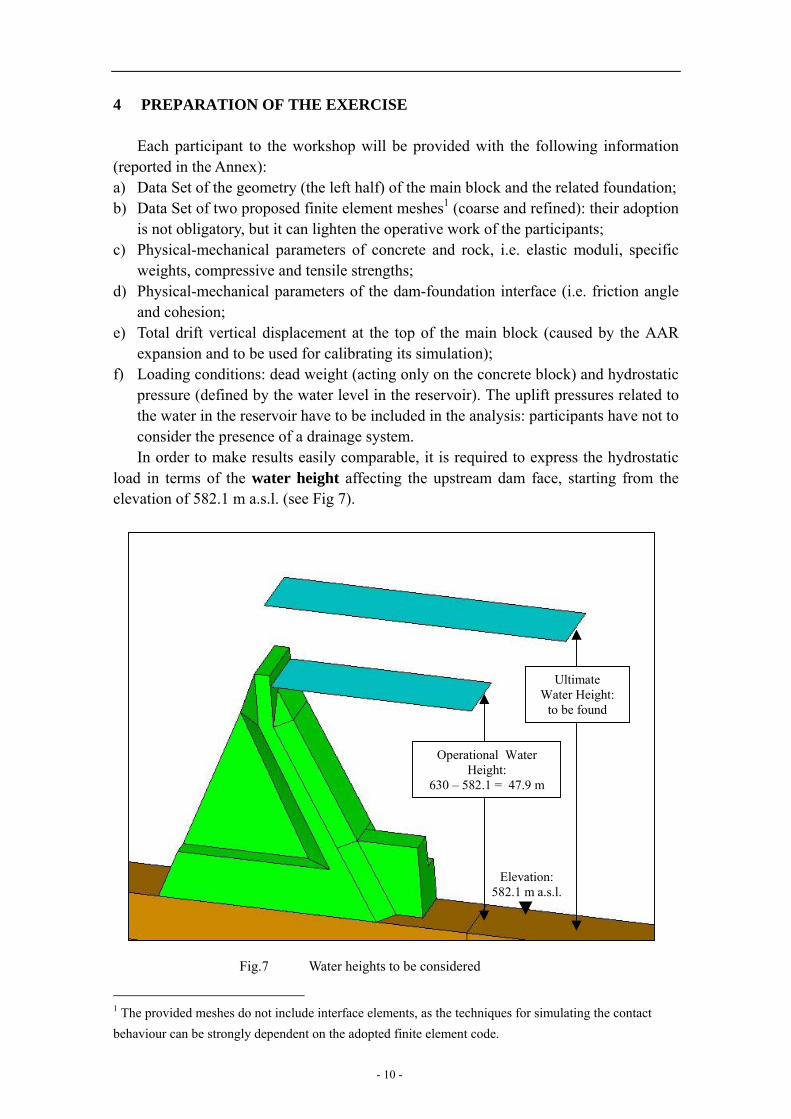
The geometry provided to the participants, shown in Fig 5 (outside view) and Fig 6 (inside view), represents one half of the structure, which is symmetric with respect to its middle vertical plane, so that participants are allowed to analyse one half only (symmetry constraint conditions can be imposed on the blue coloured vertical planes). The rock boundaries (the bottom horizontal plane and the two upstream and downstream vertical planes) can be fully constrained. Symmetry constraint conditions have to be imposed on the lateral vertical planes of the main block (i.e. the planes defined by the contraction joints between the main block and the adjacent ones): in such a way the whole dam-rock system is idealised as a succession of identical blocks (with their rock foundations).
The AAR expansion has to be simulated in presence of the dead weight only, before the application of the hydrostatic pressure load.
The method for simulating the AAR expansion is left to the knowledge/experience of the single participant and has to be clearly explained in the paper: the simulation is only required to reproduce the same total drift vertical displacement measured at the top of the real dam after some decades of operation (30 mm). The opportunity to take into
- 8 -
account the creep behaviour of concrete is also left to the decision of the participants. After having enlightened the main effects caused by the AAR expansion (i.e.
stress-strain fields, opening and sliding of the dam-foundation interface, etc.), the most important question participants would try to answer is the following:
has the AAR phenomenon affected the operational and ultimate stability of the block with reference to the hydrostatic load ?
The answer to such a question can be pursued by comparing the results of the two (without or with AAR expansion) structural analyses for hydrostatic load. The following two load paths have then to be considered:
(1) dead weight ► hydrostatic pressure (2) dead weight ► AAR expansion ► hydrostatic pressure.
In both cases two water levels must be considered: the operational one, assigned by the formulator (630 m a.s.l.), and the ultimate one, to be found by the participants.
Fig.5 Outside view of half structure: symmetry constraints on the blue plane
Fig.6 Inside view of half structure: symmetry constraints on the blue plane
- 9 -
4 PREPARATION OF THE EXERCISE
Each participant to the workshop will be provided with the following information (reported in the Annex): a) Data Set of the geometry (the left half) of the main block and the related foundation; b) Data Set of two proposed finite element meshes1 (coarse and refined): their adoption
is not obligatory, but it can lighten the operative work of the participants; c) Physical-mechanical parameters of concrete and rock, i.e. elastic moduli, specific
weights, compressive and tensile strengths; d) Physical-mechanical parameters of the dam-foundation interface (i.e. friction angle
and cohesion; e) Total drift vertical displacement at the top of the main block (caused by the AAR
expansion and to be used for calibrating its simulation); f) Loading conditions: dead weight (acting only on the concrete block) and hydrostatic
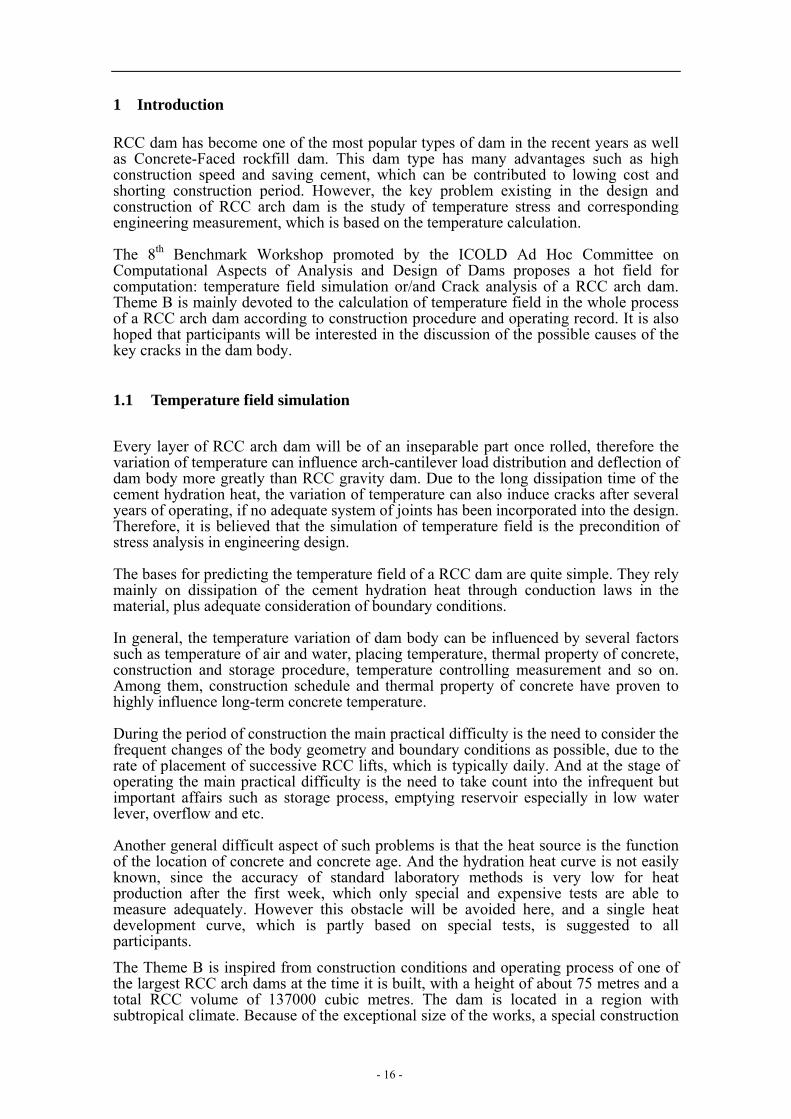
pressure (defined by the water level in the reservoir). The uplift pressures related to the water in the reservoir have to be included in the analysis: participants have not to consider the presence of a drainage system. In order to make results easily comparable, it is required to express the hydrostatic
load in terms of the water height affecting the upstream dam face, starting from the elevation of 582.1 m a.s.l. (see Fig 7).
Fig.7 Water heights to be considered
UltimateWater Height:
to be found
Operational WaterHeight:
630 – 582.1 = 47.9 m
Elevation:582.1 m a.s.l.
1 The provided meshes do not include interface elements, as the techniques for simulating the contact behaviour can be strongly dependent on the adopted finite element code.
- 10 -

5 PRESENTATION OF THE RESULTS
The structural state of the main block at the end of the AAR expansion simulation (without hydrostatic load) must be characterised by the outside and inside contour plots of the most meaningful quantities (i.e. stresses, strains, possible crack openings); the opening and sliding state of the dam-foundation interface should also be examined.
The behaviour of the main block loaded by the hydrostatic pressure must be discussed, first of all, by comparing the two load-displacement curves obtained without or with AAR expansion: in such curves, the load axis (vertical) must report the water height (increasing from zero to the operational height, and then to the ultimate one), while the displacement axis (horizontal) must report the related increment of the downstream displacement at the top of the block. Such curves are obviously of utmost importance to evaluate the AAR effects on the global performances of the dam, as they allow to compare both the stiffness of the structure and its ultimate strength. If possible, the additional comparison between the collapse mechanisms (without or with AAR) is welcome.
As for contours plots of field quantities (stresses, strains, openings) after the application of the hydrostatic load, the judgement about their actual meaningfulness is left to the single participant, as the AAR effects are expected to be so prevalent to almost hide the hydrostatic load effects. REFERENCES 1. 21st ICOLD Congress, Question 82, 16-20 June 2003, Montreal, Canada. 2. 6th ICOLD Benchmark-Workshop on Numerical Analysis of Dams, 17-19 October
2001, Salzburg, Austria. 3. ANIDEL. Dams for hydroelectric power in Italy. Vol. 2. 1952.
- 11 -

ANNEX a) Data Set of the geometry of the structure (left symmetric half), including the
main block of the dam and the related foundation rock: Solid and wire geometry included in attached “Geometry.zip” file, containing two different format files: • WireModel.geo (ASCII format) including point coordinates and line
connections • SolidModel.STP (STEP international graphic format) including solid
geometry of dam and foundation b) Data Set of the two proposed finite element meshes2 (coarse and refined):
Finite element meshes included in attached “Meshes.zip” file, containing two IDEAS universal format files (see next page for UNV format details): • CoarseMesh.unv • RefinedMesh.unv
c) Physical-mechanical parameters of materials: Concrete
• elastic modulus: 18000 MPa • mass density: 2400 Kg/m3 • Poisson coefficient: 0.2 • compressive strength: 32 Mpa • tensile strength: 1.5 MPa
Rock foundation • elastic modulus: 10000 MPa • Poisson coefficient: 0.1 • compressive strength: 32 Mpa • tensile strength: 0.15 MPa
d) Physical-mechanical parameters of the dam-foundation interface • friction angle: 37 degrees • cohesion: 0.1 MPa
e) AAR calibration datum: • total drift vertical displacement at the top of the main block: 30 mm
f) Loading conditions: • dead weight (only for the concrete block) • AAR expansion, simulated as to obtain the displacement given in point e) • hydrostatic pressure, with related uplift pressures:
operational water level at 630 m a.s.l. (water height: 47.9 m)
2 The provided meshes are made of linear finite elements: as the solid geometry has no curved boundaries, they can be easily transformed into parabolic element meshes (if considered necessary).
- 12 -

SDRC IDEAS® UNV format file details
Each provided UNV file is composed by two data sets (2411 and 2412). Each data set begins and ends with “ -1” . Data set 2411 contains node data.
Each node is defined by a couple of lines.
The first line contains 4 items: • Node label • No meaning • No meaning • No meaning
The second line contains: • X, Y, Z coordinates
Data set 2412 contains element data.
Each element is defined by a couple of lines.
The first line contains 6 items: • Element label • Type of element3 • Physical property4 • Material property4 • No meaning • Number of nodes of the element3
The second line contains: • List of node labels defining the topology of the element
3 For the provided coarse mesh, the element type can be 115 (linear brick solid, with 8 nodes) or 112 (linear wedge solid, with 6 nodes). For the provide refined mesh, the element type is 111 (linear tetrahedron solid, with 4 nodes). 4 For the provided meshes, physical property and material property are identified by the same number (1 for the dam elements, 2 for the rock elements).
- 13 -

EIGHTH INTERNATIONAL BENCHMARK WORKSHOP
ON
NUMERICAL ANALYSIS OF DAMS
23-30 October, 2005
Wuhan, Hubei, P.R.China
THEME B
TEMPERATURE FIELD SIMULATION OR/AND
CRACK ANALYSIS OF A RCC ARCH DAM
- 14 -

International Commission on Large Dams AD Hoc Committee on Computational Aspects of Analysis and Design of Dams
COMMISSION INTERNATIONALE DES GRANDS BARRAGES Comité Ad Hoc des Méthodes de Calcul pour les Barrages
8th Benchmark Workshop on Numerical Analysis of Dams
CIGB ICOLD
October 23-30, 2005 –WUHAN, CHINA
Theme B – RCC arch dams
TEMPERATURE FIELD SIMULATION OR/AND
CRACK ANALYSIS OF A RCC ARCH DAM Formulator: Chen Sheng-hong*, Yang Jia-xiu**, Peng Cheng-jia*
*State Key Laboratory of Water Resources and Hydropower Engineering Science Wuhan University
**Guiyang Hydroelectric Investigation, Design & Research Institute of State Power Corporation of China
Attn: Prof. CHEN Sheng-hong 8, South Road of Donghu,
Wuhan, Hubei 430072 P.R.China
E-Mail:[email protected]
The information package for the preparation of contributions to Theme BW
consists of:
the present description ThBW.doc
the position of instruments drawings ThBW.dwg
the mesh proposed for 3-D analysis ThBW.db
the input date Word file ThBW _data.doc
the temperature file for results ThBW _TResXXXX.xls
the stress file for results ThBW _SResXXXX.xls
the displacement file for results ThBW_DResXXXX.xls
- 15 -
1 Introduction RCC dam has become one of the most popular types of dam in the recent years as well as Concrete-Faced rockfill dam. This dam type has many advantages such as high construction speed and saving cement, which can be contributed to lowing cost and shorting construction period. However, the key problem existing in the design and construction of RCC arch dam is the study of temperature stress and corresponding engineering measurement, which is based on the temperature calculation.
The 8th Benchmark Workshop promoted by the ICOLD Ad Hoc Committee on Computational Aspects of Analysis and Design of Dams proposes a hot field for computation: temperature field simulation or/and Crack analysis of a RCC arch dam. Theme B is mainly devoted to the calculation of temperature field in the whole process of a RCC arch dam according to construction procedure and operating record. It is also hoped that participants will be interested in the discussion of the possible causes of the key cracks in the dam body.
1.1 Temperature field simulation
Every layer of RCC arch dam will be of an inseparable part once rolled, therefore the variation of temperature can influence arch-cantilever load distribution and deflection of dam body more greatly than RCC gravity dam. Due to the long dissipation time of the cement hydration heat, the variation of temperature can also induce cracks after several years of operating, if no adequate system of joints has been incorporated into the design. Therefore, it is believed that the simulation of temperature field is the precondition of stress analysis in engineering design.
The bases for predicting the temperature field of a RCC dam are quite simple. They rely mainly on dissipation of the cement hydration heat through conduction laws in the material, plus adequate consideration of boundary conditions.
In general, the temperature variation of dam body can be influenced by several factors such as temperature of air and water, placing temperature, thermal property of concrete, construction and storage procedure, temperature controlling measurement and so on. Among them, construction schedule and thermal property of concrete have proven to highly influence long-term concrete temperature.
During the period of construction the main practical difficulty is the need to consider the frequent changes of the body geometry and boundary conditions as possible, due to the rate of placement of successive RCC lifts, which is typically daily. And at the stage of operating the main practical difficulty is the need to take count into the infrequent but important affairs such as storage process, emptying reservoir especially in low water lever, overflow and etc.
Another general difficult aspect of such problems is that the heat source is the function of the location of concrete and concrete age. And the hydration heat curve is not easily known, since the accuracy of standard laboratory methods is very low for heat production after the first week, which only special and expensive tests are able to measure adequately. However this obstacle will be avoided here, and a single heat development curve, which is partly based on special tests, is suggested to all participants.
The Theme B is inspired from construction conditions and operating process of one of the largest RCC arch dams at the time it is built, with a height of about 75 metres and a total RCC volume of 137000 cubic metres. The dam is located in a region with subtropical climate. Because of the exceptional size of the works, a special construction
- 16 -
procedure has been used and standby sequences between series. This makes the temperature field simulation of the dam body still more complex.
The limit condition varies greatly from instant and location of concrete, which depends mainly on the construction procedure. Considering the size and thickness of the dam, most of the hydration heat will migrate through the RCC vertically at the stage of construction. And during the operating period, the contribution of heat dissipation towards the dam faces should also be taken into count because of the influence of the exchange of its heat with air and water. For these reasons, a 2-D analysis can be used to carry out the temperature field simulation during construction with a rather good approximation. However, some participants will be also interested in the analysis of the key cracks in the dam body, which is based on the 3-D calculation of temperature field; therefore data and mesh are provided for those who wish to make a 3-D analysis. Those who want to make a 2-D analysis are kindly requested to take the crown section as their study object and mesh it according to their own choice and experience.
All participants are kindly requested to provide a paper with 15 pages maximum, in which all assumptions are clearly exposed (especially as regards initial and boundary conditions). For comparison purpose, they must also give their key temperature results under a prescribed format, in an EXCEL file derived from the ThBW_TResXXXX.xls provided, where they will replace XXXX by an acronym of their organisation.
Compulsory results to be provided are the temperature in the crow section of the dam body at different instants and at different levels (coming either from 2-D or from 3-D analysis).
Participants who will carry out 3-D analysis should also provide the temperature result in the typical sections of the dam body at different instants and at different levels.
1.2 Crack analysis
The temperature stress can induce crack especially for RCC arch dam. Simulation computation and analysis are carried out to master the distribution regularity of temperature and stress in the dam body basically. And sometimes some engineering measurements are adopted to avoid crack or enhance the understanding of the disaster.
The designers and engineers of this project have also put forward some methods. Three induced joints(one of them is changed to be construction joint at the stage of construction for some reason) and the corresponding re-grout systems have been incorporated into the design. And the temperature data at some locations of this dam also show that the temperature calculation of that time is basically consistent with the monitoring results.
It’s once believed that even if great crack happens to appear, it should be in induced joints instead of other parts of dam body. However, the observations show that there are some cracks appearing in the dam body. Above all, two of them cut through the upstream and downstream face but they don’t exsit in the induced joints. What leads to the two key cracks and why they apprear in dam body instead of induced joints is still not very clear, which is therefore of great value of research.
Those who wish to carry out the research on the two key cracks in dam body are kindly requested to provide a paper with 20 pages maximum, in which both the calculation of stress field and the possible causes for the key cracks should be included besides the result of temperature simulation. For comparison purpose, they must also give their key stress and displacement results under a prescribed format, in an EXCEL file derived from the ThBW_SResXXXX.xls and ThBW_DResXXXX.xls provided, where they will replace XXXX by an acronym of their organisation. The other requests are the same as those listed in the chapter 1.1.
- 17 -

2 Input Data
All detailed information on input data is provided in the ThBW_Data.doc file.
2.1 General
This reservoir is of partial regulation reservoir. The design flood level is 1145 m and the normal tail water level is 1087.5 m. The average air temperature in the region is 14.7 0C and the average water temperature is 16.5 0C.
This arch dam consists of 6 main parts as follows: non-overflow dam, 4 open spillways, gravity pier, scour hole acting also as empting bottom outlet(located at the elevation 1093.5m), apron and bank-protection structures. The presentation of this dam is shown in Figure 1.
(a) Plan
(b) Photo
Figure 1: Presentation of the Dam
- 18 -
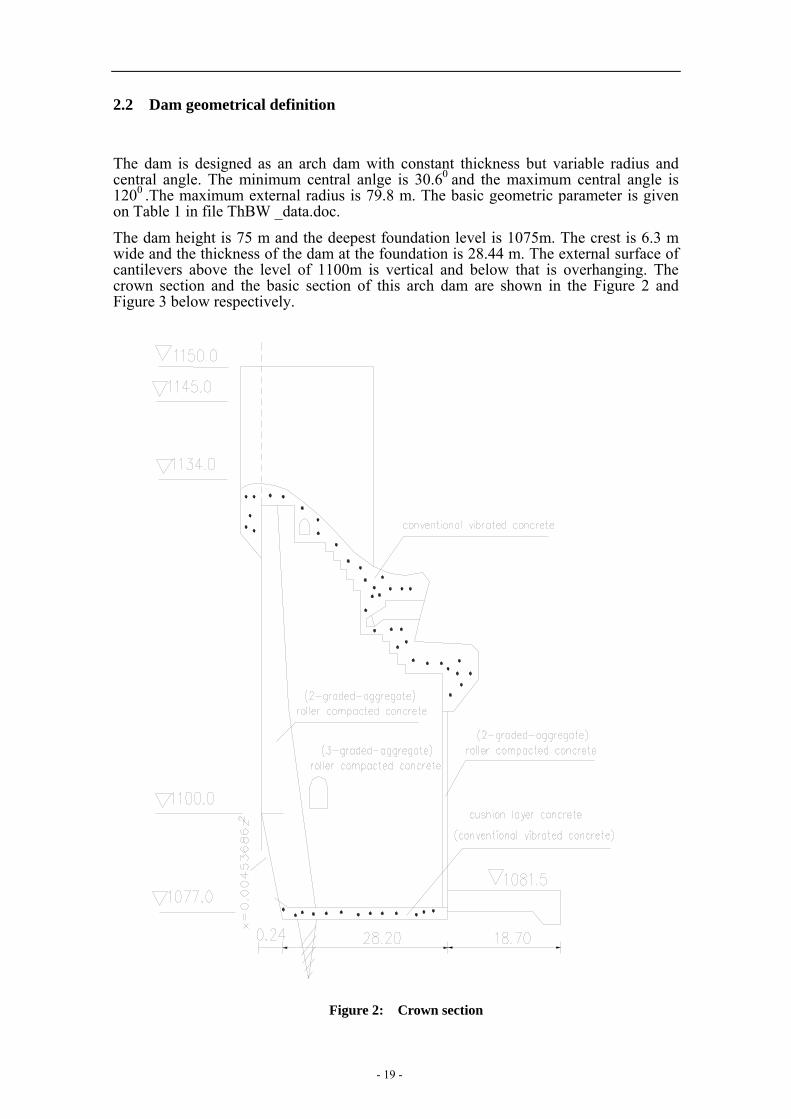
2.2 Dam geometrical definition
The dam is designed as an arch dam with constant thickness but variable radius and central angle. The minimum central anlge is 30.60 and the maximum central angle is 1200 .The maximum external radius is 79.8 m. The basic geometric parameter is given on Table 1 in file ThBW _data.doc.
The dam height is 75 m and the deepest foundation level is 1075m. The crest is 6.3 m wide and the thickness of the dam at the foundation is 28.44 m. The external surface of cantilevers above the level of 1100m is vertical and below that is overhanging. The crown section and the basic section of this arch dam are shown in the Figure 2 and Figure 3 below respectively.
Figure 2: Crown section
- 19 -

trajectory of circle centre
Figure 3: Basic section
2.3 Joint
In the preliminary design, three joints are adopted with the purpose of releasing tensile stress: The No.1 joint is located at the conjunction of right arch end and gravity pier; the No.2 joint is situated on the right side of scour outlet; the No.3 joint is placed at the conjunction of overflow dam and non-overflow dam. The spacings between the three joints are 55m and 80m separately, which is shown in Figure 4 below.
The joints are composed of presplit areas, which are made of many local fractures that don’t coalesce each other. Every area is defined by a rectangular whose long axis is 1 m and short axis is 0.3 m. This can be also seen from the schematic drawing in following Figure 4.
Two types of grouting system are adopted in the design. One is cement grouting system, the other one is chemical grouting system.
- 20 -
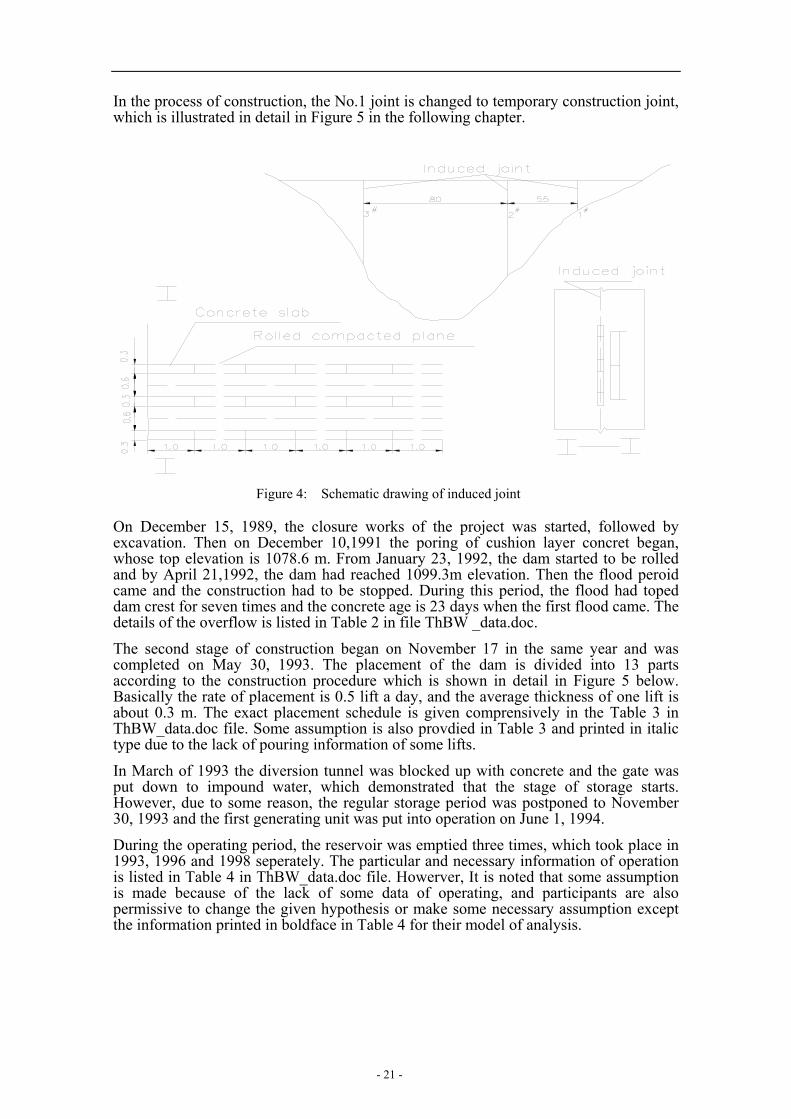
In the process of construction, the No.1 joint is changed to temporary construction joint, which is illustrated in detail in Figure 5 in the following chapter.
2.4 Construction and operation
Figure 4: Schematic drawing of induced joint
On December 15, 1989, the closure works of the project was started, followed by excavation. Then on December 10,1991 the poring of cushion layer concret began, whose top elevation is 1078.6 m. From January 23, 1992, the dam started to be rolled and by April 21,1992, the dam had reached 1099.3m elevation. Then the flood peroid came and the construction had to be stopped. During this period, the flood had toped dam crest for seven times and the concrete age is 23 days when the first flood came. The details of the overflow is listed in Table 2 in file ThBW _data.doc.
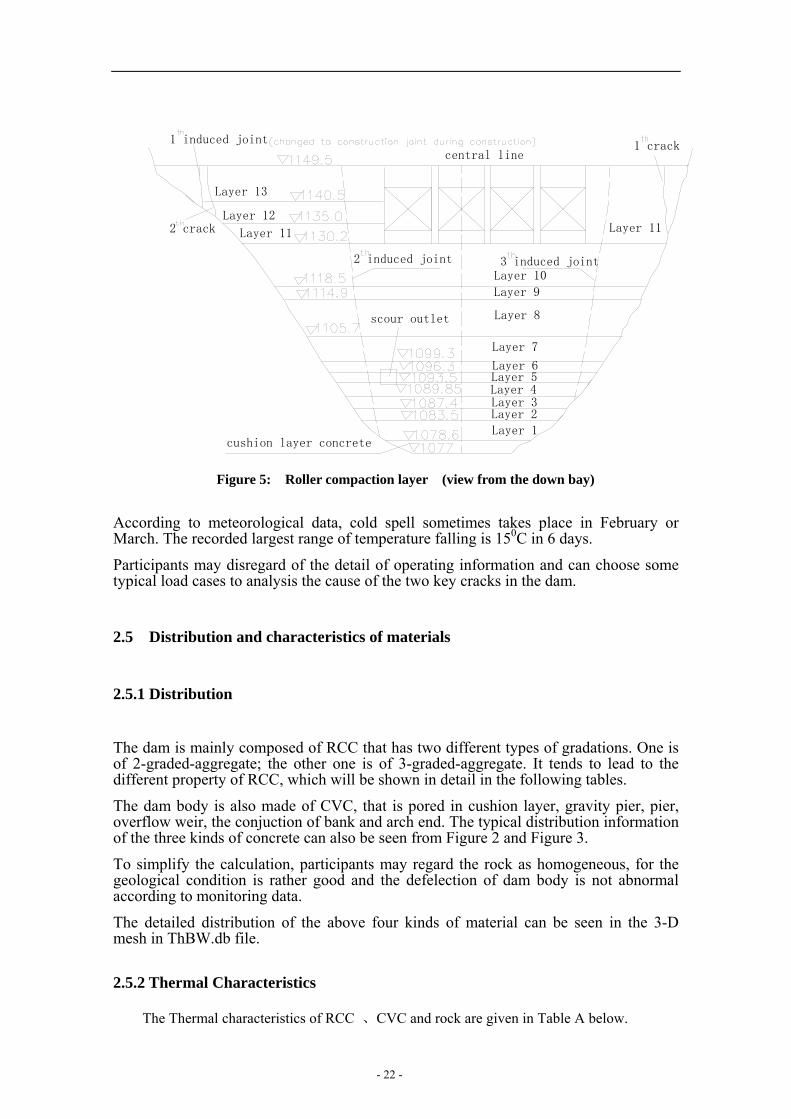
The second stage of construction began on November 17 in the same year and was completed on May 30, 1993. The placement of the dam is divided into 13 parts according to the construction procedure which is shown in detail in Figure 5 below. Basically the rate of placement is 0.5 lift a day, and the average thickness of one lift is about 0.3 m. The exact placement schedule is given comprensively in the Table 3 in ThBW_data.doc file. Some assumption is also provdied in Table 3 and printed in italic type due to the lack of pouring information of some lifts.
In March of 1993 the diversion tunnel was blocked up with concrete and the gate was put down to impound water, which demonstrated that the stage of storage starts. However, due to some reason, the regular storage period was postponed to November 30, 1993 and the first generating unit was put into operation on June 1, 1994.
During the operating period, the reservoir was emptied three times, which took place in 1993, 1996 and 1998 seperately. The particular and necessary information of operation is listed in Table 4 in ThBW_data.doc file. Howerver, It is noted that some assumption is made because of the lack of some data of operating, and participants are also permissive to change the given hypothesis or make some necessary assumption except the information printed in boldface in Table 4 for their model of analysis.
- 21 -
scour outlet
Layer 13
Layer 12
Layer 11 Layer 11
2 induced joint 3 induced joint
Layer 3Layer 4
Layer 1
Layer 5
Layer 2
Layer 9
Layer 6
Layer 7
Layer 8
Layer 10
cushion layer concrete
central line1 induced joint 1 crack
2 crack
Figure 5: Roller compaction layer (view from the down bay)
According to meteorological data, cold spell sometimes takes place in February or March. The recorded largest range of temperature falling is 150C in 6 days.
Participants may disregard of the detail of operating information and can choose some typical load cases to analysis the cause of the two key cracks in the dam.
2.5 Distribution and characteristics of materials
2.5.1 Distribution
The dam is mainly composed of RCC that has two different types of gradations. One is of 2-graded-aggregate; the other one is of 3-graded-aggregate. It tends to lead to the different property of RCC, which will be shown in detail in the following tables.
The dam body is also made of CVC, that is pored in cushion layer, gravity pier, pier, overflow weir, the conjuction of bank and arch end. The typical distribution information of the three kinds of concrete can also be seen from Figure 2 and Figure 3.
To simplify the calculation, participants may regard the rock as homogeneous, for the geological condition is rather good and the defelection of dam body is not abnormal according to monitoring data.
The detailed distribution of the above four kinds of material can be seen in the 3-D mesh in ThBW.db file.
2.5.2 Thermal Characteristics
The Thermal characteristics of RCC 、CVC and rock are given in Table A below.
- 22 -
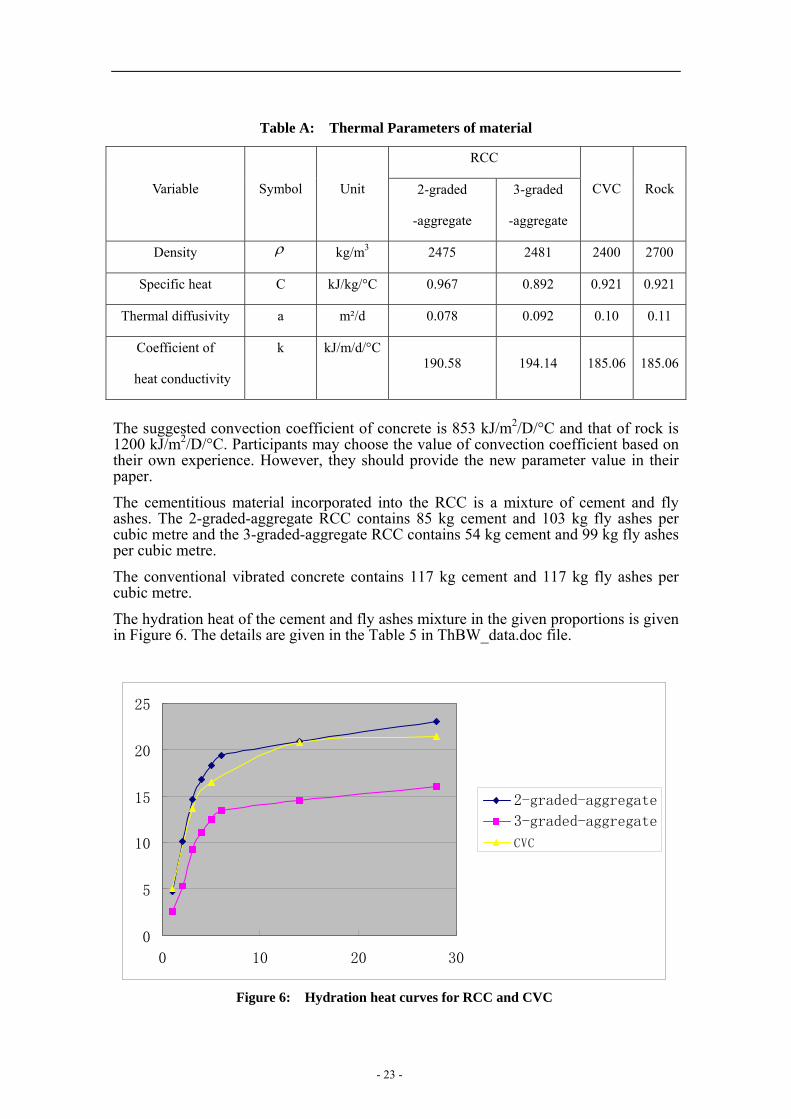
Table A: Thermal Parameters of material
RCC
Variable
Symbol
Unit
2-graded
-aggregate
3-graded
-aggregate
CVC Rock
Density ρ kg/m3 2475 2481 2400 2700
Specific heat C kJ/kg/°C 0.967 0.892 0.921 0.921
Thermal diffusivity a m²/d 0.078 0.092 0.10 0.11
Coefficient of
heat conductivity
k kJ/m/d/°C190.58 194.14 185.06 185.06
The suggested convection coefficient of concrete is 853 kJ/m2/D/°C and that of rock is 1200 kJ/m2/D/°C. Participants may choose the value of convection coefficient based on their own experience. However, they should provide the new parameter value in their paper.
The cementitious material incorporated into the RCC is a mixture of cement and fly ashes. The 2-graded-aggregate RCC contains 85 kg cement and 103 kg fly ashes per cubic metre and the 3-graded-aggregate RCC contains 54 kg cement and 99 kg fly ashes per cubic metre.
The conventional vibrated concrete contains 117 kg cement and 117 kg fly ashes per cubic metre.
The hydration heat of the cement and fly ashes mixture in the given proportions is given in Figure 6. The details are given in the Table 5 in ThBW_data.doc file.
0
5
10
15
20
25
0 10 20 30
2-graded-aggregate
3-graded-aggregate
CVC
Figure 6: Hydration heat curves for RCC and CVC
- 23 -

2.5.3 Mechanics Characteristics
The mechanics characteristics of RCC, CVC and rock are given in Table B below.
Table B: Mechanics Properties of material
RCC
Variable
Symbol
Unit
2-graded-aggregate 3-graded-aggregate
CVC Rock
Density ρ kg/m3 2475 2481 2400 2400
Poisson’s ratio
µ 0.167 0.167 0.167 0.21
Expansion coefficient
α 10-6/°C 5.22 5.37 5.37 2
The elastic modulus of concretes increases with the development of concrete age. The elastic modulus of the three types of concrete Vs time is shown in Table C below.
Table C: Elastic modulus of concrete Vs time
Day
Concrete
7
28
30
RCC (2-graded-aggregate) 2.4 3.53 3.92
RCC (3-graded-aggregate) 1.84 3.49 3.77
CVC 3.0 3.85
Some of other mechanics parameters of concretes also vary with the concrete age. Participants who wish to consider those variations Vs time besides elastic modulus are kindly hoped to consult the data of the corresponding field test on them, which are given in Table 6 in ThBW_data.doc file. Those who want to take into account the creep deformation will find that Table 7 in ThBW_data.doc file may be of some help.
2.6 Instrumentation
Electric thermo-couples、extensometers have been placed inside dam body in several sections and elevations. Figure 7 shows the position of some instruments for monitoring temperature at crow section, the temperature result of which is compulsory to provide on the purpose of comparison. The detail of them is given in ThBW_data.doc.
- 24 -

The position of some thermometers at the section of right quarter beam and left quarter beam are shown both in Figure 2 in ThBW_Data.doc file and ThBW.dwg file. The detail of the position of the instruments, the result of which is expected to provide on the purpose of comparison by those who will be interested in 3-D analysis, is given in the corresponding Excel file .
Other thermo-couples have been placed at different places outside the dam, which give the temperature variation of air and water Vs time.
2.7 Initial and
Statistical analyTable 9 and Tab
Initial RCC temTable 3, as weplacement. Thesplacement is subRCC temperatusuggested to usemonitoring data
According to thdensity tends to
Figure 7: Position of instruments at crow section
limit conditions
sis of air temperature and water temperature at site is given in Table 8, le 10 in ThBW_data.doc file.
perature, measured in the fresh material at the batching plant, is given in ll as a few initial temperatures of RCC layers at the time of their e data seem to indicate that the temperature of fresh RCC at the time of stantially higher than that measured at the batching plant. In fact initial
re seems not to be far from that of air at the same time. It is therefore air temperature as the initial RCC temperature wherever direct initial
are not provided.
e corresponding monitoring data of water and silt, current of higher reach the upstream reservoir especially in flood period due to the rather
- 25 -

high sediment charge, which can influence the distribution of water temperature of reservoir greatly. It’s therefore more reasonable to consider this important factor. Participants who wish to take count into the influence of the current of higher density will find that Table 11 in ThBW_data.doc file may be of some help.
Participants are permissive to consider the limit conditions in temperature calculation of their choice. They are also free to decide whether considering the radiation of sun or not.
Participants may disregard of the tectonic stress when calculating the initial stress of rock. They are also free to consider the boundary conditions of structure analysis of their choice.
2.8 Mesh and Load
The proposed 3-D mesh is given in File THBW.db which can be opened by software ANSYS7.1. Participants can remesh it according to the need of their own analysis. However, they should provide the new mesh in their paper.
Some useful components are defined with the purpose of the convenence of calculation. The detail of these components and its corrosponding description are listed in the following table D.
Table D: Useful Components
NAME KIND DESCRIPTION
VDAMJZI VOLUME The volume component of the num I Construction Block
VJOINTI VOLUME The volume component of the num I joint
VMIDPIERI VOLUME The volume component of the num I middle pier
VSIDEPIERI VOLUME The volume component of the num I side pier
AAIRROCK AREA The component of the rock area which is faced to the air
AAIRRANDC AREA The component of the area faced to the air
AUPH AREA The component of upstream area which is below elevation H
ADOWNH AREA The component of downstream area which is below elevation H
ABASEB AREA The component of the bottom boundary area of the model
AUPB AREA The component of the upstream boundary area of the model
ADOWNB AREA The component of the downstream boundary area of the model
ALEFTB AREA The component of the left boundary area of the model
- 26 -

ARIGHTB AREA The component of the right boundary area of the model
ACROWN AREA The component of crown section
ALEFTQUARTER AREA The component of left quarter beam section
ARIGHTQUARTER AREA The component of right quarter beam section
NIMIDPIERJ NODE The node component of the num I support of Jth middle pier
NISIDEPIERJ NODE The node component of the num I support of Jth side pier
NTTI-J NODE The node component labeled as TI-J to give temperature result
NSSI-J NODE The node component labeled as SI-J to give stress result
NDSI-J NODE The node component labeled as SI-J to give displacement result
For those who want to take silt sediment into count, the recommended silt elevation is 1105 m and the angle of silt’s internal friction is 150 and the buoyant unit weigt of silt is 800 kg/m3.
For those who want to consider gate thurst on side pier and middle pier, the recommended equivalent load applied to the former is expressed in 3-D when the water level is 1145 m: PH=5340kN, PV=1340kN, PS=700kN, where PH, PV, PS denotes the load in the direction of flow, vertical direction and direction perpendicular to the flow direction respectively .
The corresponding nodes components and volume components of pier have been defined in the 3-D mesh and the serial number of them is based on the direction. For instance, the volume component of left side pier is labelled as VSIDEPIER2.
Participants are free to choose the kind of load case in the process of their calculation.
2.9 Others
Participants are free to consider the physical model of concrete,rock and joint. They are also permissive to make some necessary hypothesis if the input data cannot afford all the information for their model of analysis.
3 Requested Results
The general request has been listed in chapter 1. And participants are kindly requested to fill the corresponding tables below according to their own choice.
3.1 For all participants
Temperature in the crown section at different levels and instants: fill the table in sheet 'Resu_2D' of ThBW_TResXXXX.xls (the table is reproduced below as Table E and F).
- 27 -

Table E : 2-D Results to be provided (in sheet 'Resu_2D' of ThBW_TResXXXX.xls)
Crown section
date Value at
T8-4 sensor(0C) date
Value at
T3-3 sensor(0C) date
Value at
T5-2 sensor(0C)
12-14-91 04-05-92 02-05-93
12-18-91 04-09-92 02-09-93
12-22-91 04-13-92 02-13-93
12-26-91 04-20-92 03-02-93
01-01-92 05-10-92 03-10-93
01-10-92 05-20-92 03-15-93
01-20-92 05-25-92 03-30-93
01-23-92 05-30-92 04-20-93
01-25-92 06-05-92 05-20-93
02-01-92 06-10-92 06-10-93
Table F: 2-D Results to be provided (in sheet 'Resu_2D' of ThBW_TResXXXX.xls)
Crown section
date Value at T3-2
sensor(0C) date
Value at T2-1 sensor(0C)
date Value at T4-2
sensor(0C)
04-05-92 02-27-92 04-25-92
04-09-92 03-02-92 04-29-92
04-13-92 03-06-92 05-03-92
04-20-92 04-30-92 05-05-92
04-30-92 05-06-92 05-07-92
05-09-92 05-10-92 05-10-92
05-11-92 05-11-92 05-11-92
05-12-92 05-12-92 05-12-92
05-25-92 05-25-92 05-25-92
05-30-92 05-30-92 05-30-92
06-03-92 06-03-92 06-03-92
06-07-92 06-07-92 06-07-92
- 28 -

06-13-92 06-13-92 06-13-92
3.2 Optional 3-D temperature results
Temperature in the section of left quarter beam and right quarter beam at different levels and at different instants: fill the table in sheet 'Resu_3D' of ThBW_TResXXXX.xls (the table is reproduced below as Table G).
Table G: 3-D Results to be provided (in sheet 'Resu_2D' of ThB_ResXXXX.xls)
section of left quarter section of right quarter
date Value at
T3-4 sensor(0C)
date Value at
T5-5 sensor(0C)
date Value at
T5-6 sensor(0C)
date Value at
T5-7 sensor(0C)
04-18-92 02-05-93 02-05-93 02-05-93
04-22-92 02-09-93 02-09-93 02-09-93
04-26-92 02-13-93 02-13-93 02-13-93
04-30-92 02-20-93 02-20-93 02-20-93
05-05-92 02-25-93 02-25-93 02-25-93
05-10-92 03-02-93 03-02-93 03-02-93
05-15-92 03-10-93 03-10-93 03-10-93
05-20-92 03-15-93 03-15-93 03-15-93
05-25-92 03-30-93 03-30-93 03-30-93
05-30-92 04-20-93 04-20-93 04-20-93
06-05-92 05-20-93 05-20-93 05-20-93
06-10-92 06-20-93 06-20-93 06-20-93
3.3 Optional stress/deformation analysis and crack analysis
Stresses in the section of crown, left quarter beam, right quarter beam and joints, at different levels and at different instants: fill the table in sheet 'Resu_3D' of ThBW_SResXXXX.xls (the table is reproduced below as Table H).
In the following tables, Sy denotes the stress which is in the direction perpendicular to radial; Sz denotes the stress in the vertical direction; S1 denotes the principle stress.
Table H: 3-D Results to be provided (in sheet 'Resu_3D' of ThB_SResXXXX.xls)
Result of Stress
Section Node
component Maximum Sy (MPa)
date Maximum Sz (MPa)
date Maximum S1 (MPa)
date
1th joint NSS1-1
- 29 -

NSS1-2
NSS1-3
NSS2-1
NSS2-2
NSS2-3 2th joint
NSS2-4
NSS3-1
NSS3-2
NSS3-3 3th joint
NSS3-4
NSS4-1
NSS4-2
NSS4-3 Crown
NSS4-4
NSS5-1
NSS5-2
NSS5-3
Left quarter beam
NSS5-4
NSS6-1
NSS6-2
NSS6-3
Right quarter beam
NSS6-4
Displacements in the section of crown, left quarter beam, right quarter beam and joints, at different levels and at different instants: fill the table in sheet 'Resu_3D' of ThBW_DisplXXXX.xls (the table is reproduced below as Table I), at least the yellow cells.
In the following tables, Uy denotes the displacement which is in the direction of flow; Uz denotes the displacement in the vertical direction.
Table I: 3-D Results to be provided (in sheet 'Resu_3D' of ThB_DisplXXXX.xls)
Result of Displacement
Section Node component Maximum date Maximum date
- 30 -

Uy(mm) Uz(mm)
NDS1-1
NDS1-2 1th joint
NDS1-3
NDS2-1
NDS2-2
NDS2-3 2th joint
NDS2-4
NDS3-1
NDS3-2
NDS3-3 3th joint
NDS3-4
NDS4-1
NDS4-2
NDS4-3 Crown
NDS4-4
NDS5-1
NDS5-2
NDS5-3 Left quarter beam
NDS5-4
NDS6-1
NDS6-2
NDS6-3 Right quarter beam
NDS6-4
Finally, Participants are encouraged to give the jugement : what leads to the two key cracks and when did they happen. Participants are also kindly hoped to tell us why they apperar in the dam body instead of the induced joints and give some advice on the design and construction of RCC arch dam.
Paiticipants are free to present the temperature and stress results of any part of the dam body or rock if it is helpful to pinpoint the key cracks.
3-D THERMAL ANALYSIS OF A RCC ARCH DAM
- 31 -

Peng Cheng-jia
Wu Xiao-tao
Chen Sheng-hong State Key Laboratory of Water Resources and Hydropower Engineering Sciences,
Wuhan,China
SUMMARY: This paper describes a methodology for predicting the 3-D thermal state of a RCC arch dam. The study is carried out using numerical analysis performed with FEM software ANSYS.
The calculation takes account into the rock initial temperature distribution and frequent variations of three kinds of boundary conditions according to construction schedule and operation procedure, i.e. air and water temperature, hydration heat, the reservoir level and the solar, as much as possible. They are realized efficiently with the help of birth and death of elements and secondary development technology of ANSYS.
The 3-D temperature variations of dam body, lasting 2332 days from the start of pouring to operation period and including seven times flood overtopping as well as two times cold spell, are simulated. The computational results obtained for the RCC arch dam are given as tables proposed in the frame of the 8th Benchmark Workshop and also in the form of contour lines and figures.
1. INTRODUCTION
One of the main features of RCC dam is the speed and continuity of concrete placement, which can be contributed to lowing cost and shorting construction period. Nevertheless, the high placement rate presents many technical problems, e.g temperature control.
The variation of temperature can influence arch-cantilever load distribution and dam body
deflection more greatly than RCC gravity dam, as every layer of a RCC arch dam will be of an inseparable part once rolled. Due to the long dissipation of the cement hydration heat and some other uncertain reason, cracks could appear after several years of operation.
The prediction of thermal state, as a precondition of the study of thermal stresses and corresponding engineering measurements, is essential in the design of a RCC arch dam. The bases for predicting the temperature field are quite simple, but the main practical difficulty is the need to consider the frequent changes of the boundary conditions as much as possible, due to the high placement rate of successive RCC lifts, which is typically daily. Another generally difficult aspect is that the heat source is the function of the location, age and several thermal parameters of concrete. Above all, some important parameters cannot be measured easily and afforded accurately in time.
In this paper, the simulation of temperature field for a RCC arch dam in the whole process is realized by the use of ANSYS software and its secondary development technique rapidly [1].The results of the temperature field analysis are presented and discussed, which may be helpful to pinpoint the cause of the crack in this arch dam built in 1990s in China.
2. THEORETICAL BACKGROUND
At any time step the temperature changes are obtained from the heat balance considering the heat generated inside the concrete and the heat flow exchange with the nearby elements:
- 32 -
)(z
qy
qx
qQTc zyx
∂∂
+∂
∂+
∂∂
−=∂∂τ
ρ (1)
Where,
xq , , = the heat flow in yq zq , ,x y z direction respectively;
ρ = density; c = special heat;
Q =the internal heat generation rate per unit volume given in kJ/d/m3;
The heat transmission in a body is taken into account by a linear function of the temperature gradient according to the well-known Fourier’s Law:
x x
y y
x z
TqxTqyTqz
λ
λ
λ
⎧ ∂= − ⋅⎪ ∂⎪
∂⎪ = − ⋅⎨ ∂⎪⎪ ∂
= − ⋅⎪∂⎩
(2)
Where,
, ,x y zλ λ λ = the thermal conductivity in , ,x y z direction respectively.
Usually, x y zλ λ λ= = = λ is assumed. According to the Eq.(1) and (2), the law of
conservation of energy can be represented in the following form for an isotropic solid temperature-independent thermal conductivity:
)( 2
2
2
2
2
2
zT
yT
xTa
cQT
∂∂
+∂∂
+∂∂
+=∂∂
ρτ (3)
Where thermal diffusivity α is defined by / cα λ ρ= (4)
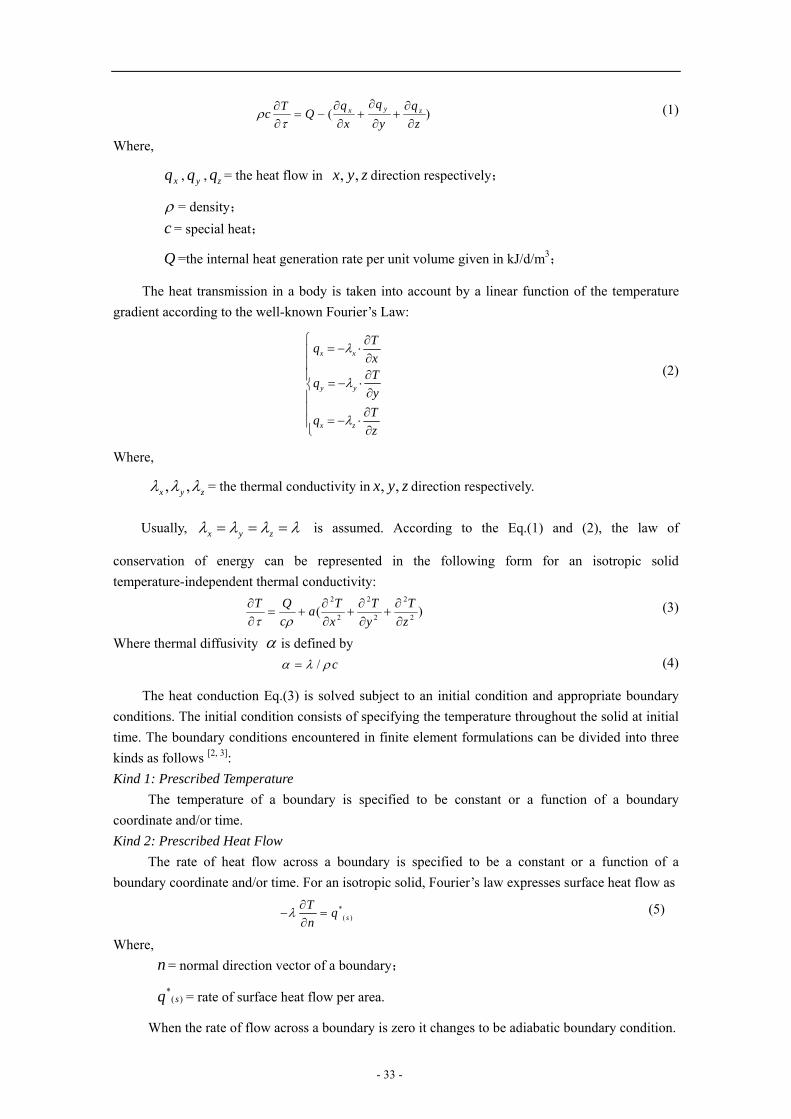
The heat conduction Eq.(3) is solved subject to an initial condition and appropriate boundary conditions. The initial condition consists of specifying the temperature throughout the solid at initial time. The boundary conditions encountered in finite element formulations can be divided into three kinds as follows [2, 3]: Kind 1: Prescribed Temperature The temperature of a boundary is specified to be constant or a function of a boundary coordinate and/or time. Kind 2: Prescribed Heat Flow The rate of heat flow across a boundary is specified to be a constant or a function of a boundary coordinate and/or time. For an isotropic solid, Fourier’s law expresses surface heat flow as
*( )s
T qn
λ ∂− =
∂ (5)
Where, n = normal direction vector of a boundary;
)(*
sq = rate of surface heat flow per area.
When the rate of flow across a boundary is zero it changes to be adiabatic boundary condition.
- 33 -

Kind 3: Convective Heat Exchange Convection is the transfer of thermal energy through a fluid due to motion of fluid. When the
rate of heat flow across a boundary is proportional to the difference between the surface temperature
sT and convective exchange temperature of adjacent fluid, the convective boundary condition is eT
)( es TTnT
−=∂∂
− βλ (6)
Where,
β =convection heat transfer coefficient (film coefficient);it may be temperature dependent.
The convective exchange temperature may be a function of a boundary coordinate and/or
time. When
eT
β is zero this kind of boundary condition turns to be a adiabatic boundary condition, while when β is absolutely large it changes to be the kind 1 boundary condition, i.e. the surface temperature can be assumed to equal the temperature of the water at any time due to the fact that the direct contact between concrete and water corresponds to a very high connectivity.
The solar radiation should also be taken into account as it represents a significant amount of energy and can affect the temperature field to some extend. In the calculation, the radiation boundary condition can also be included in the kind 3 boundary condition. The energy flow absorbed by the surface can be defined in the following form:
βα cos..SR = (7) Where,
α = absorbivity of the concrete surface (0.50~0.65) ; S = actual radiation intensity at the dam face according to the atmospheric conditions;
β = angle between the sun and the outward normal to the face.
Considering the solar radiation Eq. (6) can be written in the following equation
RTTnT
es −−=∂∂
− )(βλ (8)
or )/([( ββλ RTTnT
es +−=∂∂
− (9)
The solar radiation can be also taken into account in a simplified way in assuming an equivalent increase of the air temperature when comparing Eq.(8) with Eq.(9), which can be represented as follows:
△ β/RT =e (10)
Where, T△ e may vary between 1.5 and 4 (sometimes until 6 ) depending on the site and the ℃ ℃
orientation of the surface.
3. BASIC DATA OF CALCULATION
3.1 CALCULATION MODEL AND CORROSPONDING SCHEDULE
3.1.1 DAM GEOMETRY
Only the main features of the arch dam are mentioned below, while the detailed information of
- 34 -

the problem can be seen from the input data file provided by the formulator. The RCC arch dam to be studied is 75m high. It is mainly composed of RCC that has two different gradations. One is 2-graded-aggregate concrete, and the other is 3-graded-aggregate concrete. Both upstream and downstream faces of dam body are made up of the former to assure dam water-tightness. The dam body is also made of CVC, which is poured in cushion layer, conjunction of bank and arch end, gravity pier, pier and overflow weir. The crown profile and quarter cantilever sections, where several thermometers were disposed to follow the concrete temperature evolution, are shown in Figure 1 below.
Figure 1: Crown profile and quarter cantilever section geometry and location of the thermometers
3.1.2 FINITE ELEMENT MODEL
The element Solid 70 with 8 nodes, provided by the ANSYS package of programs [1], is employed in this analysis. Every layer of dam body contains at least 2 layers meshes in vertical direction, which is somewhat different with the initial mesh provided. The new finite element mesh used in this analysis consists of 33479 nodes and 28595 elements. However, the geometry of the model is not changed.
The cycling adding of the concrete layers in the successive meshing determines some difficulties in generating and updating the boundary and initial conditions. In this analysis the dam model is created entirely at one time, and then the dam erection is simulated by birth and death of elements according to ANSYS implemented procedure.
The calculation has been run with a selected time step of 1 day during construction, while 0.25 to 0.5 day when flood took place during the intervals between construction, and 5 days during operation. When any of the boundary conditions changes, there is a new load step to be created, and the whole load step number is 54 and the whole lasting time is 2332 days, which is from December 10 1991 to April 30 1998.
3.1.3 CONSTRUCTION PROCEDURE AND OPERATION SCHEDULE
The pouring of dam started on December 10, 1991, and by April 21, 1992, the dam had reached 1099.3m elevation. Then the flood period came and the construction had to be stopped. During this period, the flood had overtopped dam crest for seven times. The second stage of construction began on November 17 in the same year and completed on May 30, 1993. During the operation period, the
- 35 -
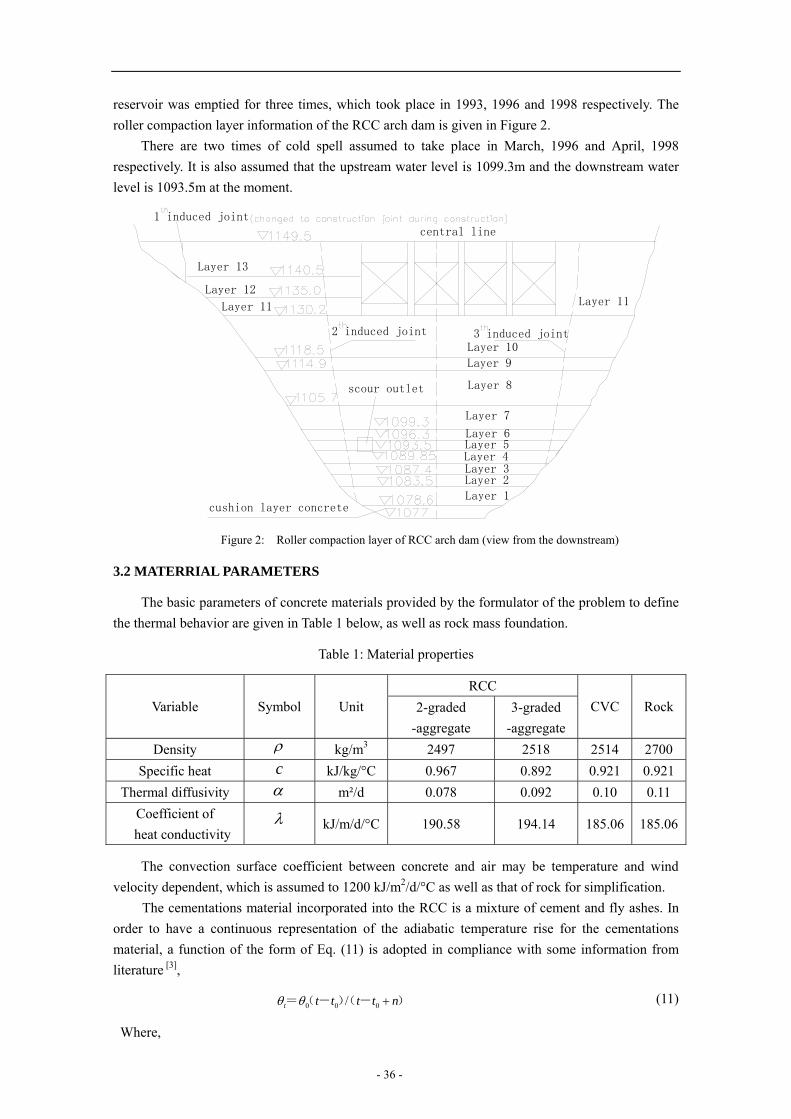
reservoir was emptied for three times, which took place in 1993, 1996 and 1998 respectively. The roller compaction layer information of the RCC arch dam is given in Figure 2.
There are two times of cold spell assumed to take place in March, 1996 and April, 1998 respectively. It is also assumed that the upstream water level is 1099.3m and the downstream water level is 1093.5m at the moment.
scour outlet
Layer 13
Layer 12
Layer 11 Layer 11
2 induced joint 3 induced joint
Layer 3Layer 4
Layer 1
Layer 5
Layer 2
Layer 9
Layer 6
Layer 7
Layer 8
Layer 10
cushion layer concrete
central line1 induced joint
Figure 2: Roller compaction layer of RCC arch dam (view from the downstream)
3.2 MATERRIAL PARAMETERS
The basic parameters of concrete materials provided by the formulator of the problem to define the thermal behavior are given in Table 1 below, as well as rock mass foundation.
Table 1: Material properties
RCC Variable
Symbol
Unit
2-graded
-aggregate 3-graded
-aggregate CVC Rock
Density ρ kg/m3 2497 2518 2514 2700 Specific heat c kJ/kg/°C 0.967 0.892 0.921 0.921
Thermal diffusivity α m²/d 0.078 0.092 0.10 0.11 Coefficient of heat conductivity
λ kJ/m/d/°C 190.58 194.14 185.06 185.06
The convection surface coefficient between concrete and air may be temperature and wind velocity dependent, which is assumed to 1200 kJ/m2/d/°C as well as that of rock for simplification.
The cementations material incorporated into the RCC is a mixture of cement and fly ashes. In order to have a continuous representation of the adiabatic temperature rise for the cementations material, a function of the form of Eq. (11) is adopted in compliance with some information from literature [3],
0 0 0t /t t t t nθ θ += (- )(- ) (11)
Where,
- 36 -

0θ = the final adiabatic temperature rise;
= the concrete age when the adiabatic temperature rise is half of n 0θ ;
t = the actual time;
= the start time of the corresponding placement of the RCC layer. 0t
Usually, and n 0θ are fitted with the known adiabatic temperature rise values in a
acceptable way or other laboratory data; The selected coefficients are presented in Table 2 below, which is based on the adiabatic
temperature rise curve provided by the formulator but adjusted according to the own experience of the author.
Table 2: Hydration function parameters
RCC coefficient
Unit
2-graded
-aggregate 3-graded
-aggregate CVC
0θ °C 23.5 18.5 25.0
n day 1.95 2.84 2.03
After the adiabatic temperature rise is calculated by the Eq.(11), the heat generation rate per day and per unit volume is calculated as follows:
02
0( )cq c
t t t nnρ θθρ ⋅ ⋅ ⋅∂
= =∂ − +
(12)
3.3 AIR TEMPERATURE AND WATER TEMPERATURE
The air temperature is assumed to change cyclically from year to year, and it could be simulated by a function in the form of cosine as follows
[ ]0cos / 6 )aT A B t t tπ += + ( -c
0
(13)
Where, A = the multiyear average air temperature; B= the annual variation amplitude of air temperature; t = the actual time calculated from the start day of construction;
ct = the interval time between the start day of construction and January 1;
= the interval time between January 1 and the day when the maximum air temperature
appears in a year;
t
The solar radiation is taken into account in a simplified and equivalent way by assuming that the air temperature increases about 2.5°C. Considering the meteorological data, the final air temperature variation is formulated as below
[ ]17.18 8.31cos / 6 218)aT π= + (-t (14)
- 37 -

The form of Eq.(13) may also apply to the water temperature during unsteady period, and based on the data given by the formulator it can be represented as
[ ]16.5 5.62cos 0.986 263)aT= + (-t
0m m
(15)
During steady period, the water temperature at any depth is calculated by the following function referenced by Bofang Zhu[3 ]
( , ) ( ) ( ) cos 2 / ( )T y T y A y pτ π τ τ ε= + − − (16)
Where, Tm (y)= the average annual water temperature; Am (y)=the annual variation amplitude of water temperature;
ε = the dispersion of phase at the water depth y ;
0τ = the day when the average maximum temperature appears;
p = the cycle of temperature variation. The main parameters referenced in the Eq.(16) are annual water temperature (17.18 ) and its ℃
variation (8.31 ) at the top of reservoir water and annual water temperature(12 ) at the reservoir ℃ ℃
bottom.
3.4 INITIAL CONDITIONS AND BOUNDARY CONDITIONS
The dam is placed on the foundation rock, which is modeled with a thickness of 80 m. Since the ambient daily temperature at the site was not provided, a temperature pre-analysis of the foundation mass before the start of concrete placement is carried out along a previous period of 5 years. In this calculation the surface of foundation rock is assumed to subject to annual average air temperature variation due to the lack of further information.
Three boundary conditions were considered: i) fix temperature at 80m depth(multiyear average air temperature 14.7°C); ii) a convective boundary at the surface of the rock; iii) null flux at other faces of the base. The finial temperature distribution on December 10, 1991 is obtained, which can be considered as an initial condition for the thermal analysis of the dam, as Figure 3.
Figure 3: Foundation temperature distribution before the pouring of the concrete
- 38 -
In order to estimate the initial rolling temperature of placement, measurements have been carried out with the fresh concrete at the batching plant. In our temperature simulation the selected initial rolling temperatures of concrete selected are the same as those provided or assumed previously by the formulator for the final convenient comparison with other partition’s results. The boundary conditions in the temperature simulation can be formulated according to the following three types: i) On the dam and rock surfaces are specified the temperatures of water when necessary;
ii) On the dam and rock surfaces are specified the input/output of the heat exchange; iii) Heat flow rate per area of the calculation boundaries is always zero;
3.5 Secondary development
The construction of the dam body is simulated by birth and death elements according to ANSYS implemented procedure;and the boundary conditions changes regularly with it. The hydration heat of each concrete layer is a function of its age and some other thermal parameters, and the air and water temperature are also functions of some important parameters.
For the convenience of efficient calculation an own program code is written in macro with APDL (ANSYS Parameter Design Language). Every time a new layer is placed, the following procedures are taken:
i) Activation of the corresponding elements and removal of the convective boundary conditions on the contacting faces of the layers rolled previously and the new layer;
ii) Hydration heat generated from element alive; iii) Activation of convective boundary conditions on the exposed faces of new layer; iv)Specification of the temperature of surface contacting water to water temperature if
necessary.
4. MAIN RESULTS
4.1 TEMPERATURE VERSUS TIME
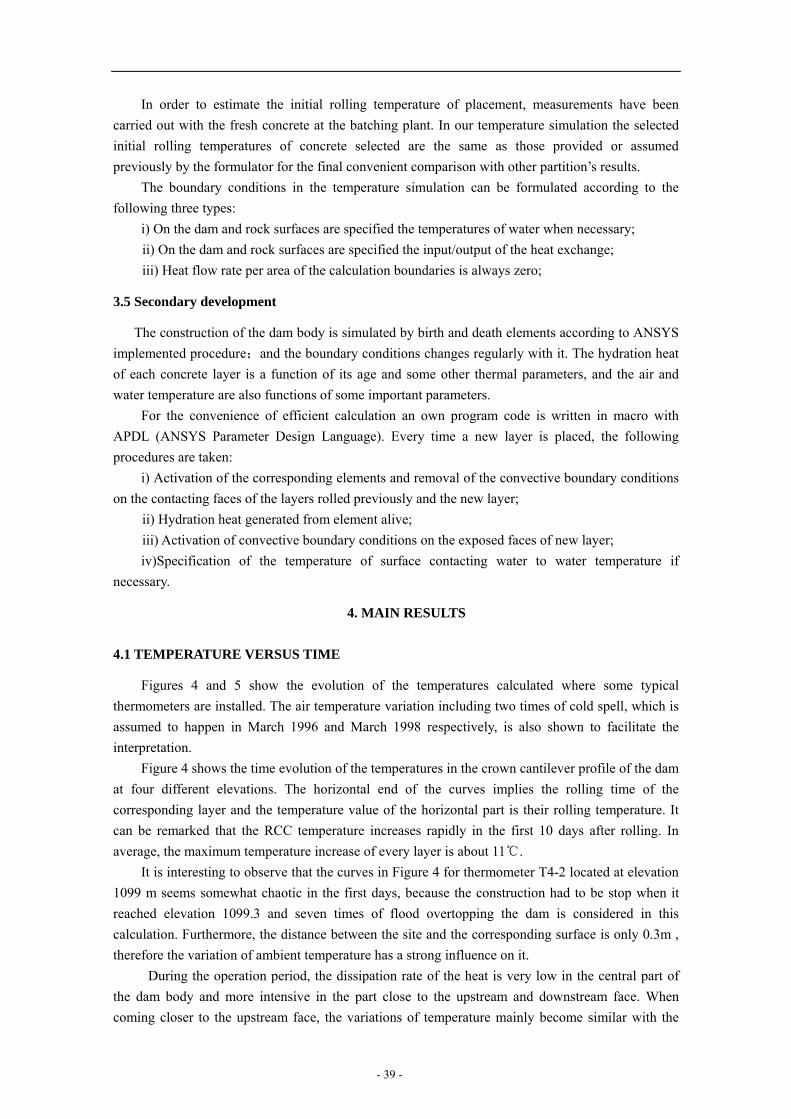
Figures 4 and 5 show the evolution of the temperatures calculated where some typical thermometers are installed. The air temperature variation including two times of cold spell, which is assumed to happen in March 1996 and March 1998 respectively, is also shown to facilitate the interpretation.
Figure 4 shows the time evolution of the temperatures in the crown cantilever profile of the dam at four different elevations. The horizontal end of the curves implies the rolling time of the corresponding layer and the temperature value of the horizontal part is their rolling temperature. It can be remarked that the RCC temperature increases rapidly in the first 10 days after rolling. In average, the maximum temperature increase of every layer is about 11 . ℃
It is interesting to observe that the curves in Figure 4 for thermometer T4-2 located at elevation 1099 m seems somewhat chaotic in the first days, because the construction had to be stop when it reached elevation 1099.3 and seven times of flood overtopping the dam is considered in this calculation. Furthermore, the distance between the site and the corresponding surface is only 0.3m , therefore the variation of ambient temperature has a strong influence on it.
During the operation period, the dissipation rate of the heat is very low in the central part of the dam body and more intensive in the part close to the upstream and downstream face. When coming closer to the upstream face, the variations of temperature mainly become similar with the
- 39 -
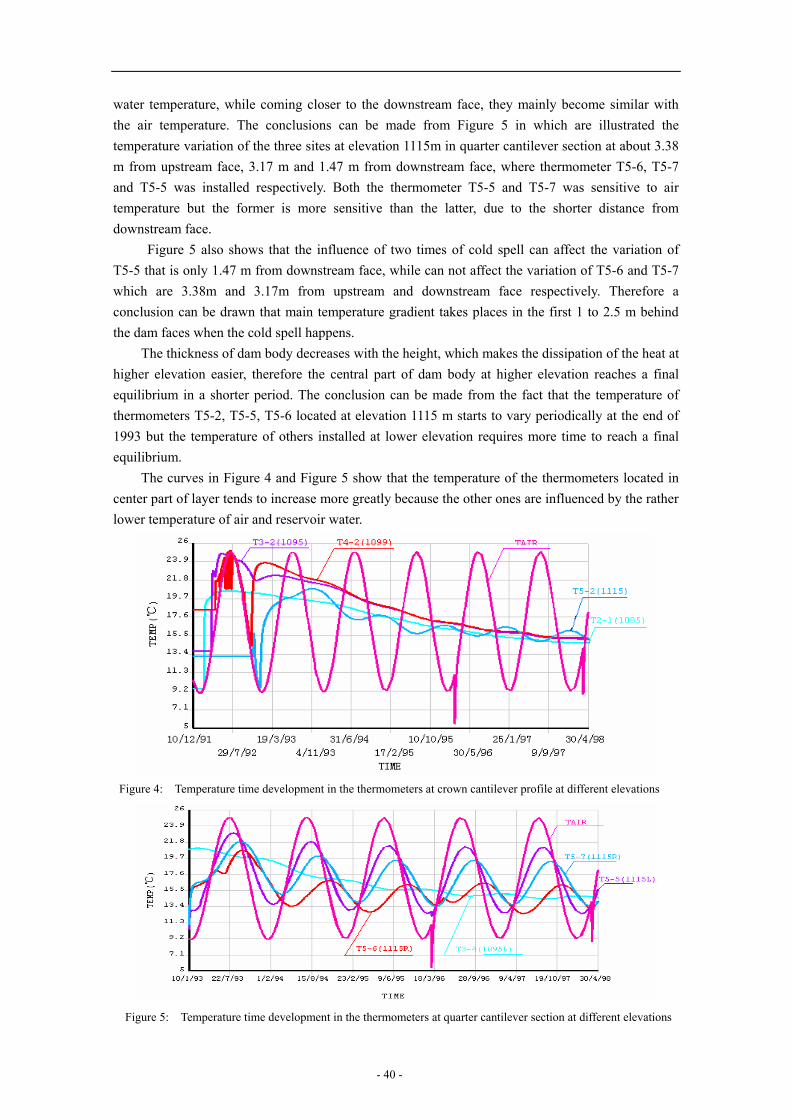
water temperature, while coming closer to the downstream face, they mainly become similar with the air temperature. The conclusions can be made from Figure 5 in which are illustrated the temperature variation of the three sites at elevation 1115m in quarter cantilever section at about 3.38 m from upstream face, 3.17 m and 1.47 m from downstream face, where thermometer T5-6, T5-7 and T5-5 was installed respectively. Both the thermometer T5-5 and T5-7 was sensitive to air temperature but the former is more sensitive than the latter, due to the shorter distance from downstream face.
Figure 5 also shows that the influence of two times of cold spell can affect the variation of T5-5 that is only 1.47 m from downstream face, while can not affect the variation of T5-6 and T5-7 which are 3.38m and 3.17m from upstream and downstream face respectively. Therefore a conclusion can be drawn that main temperature gradient takes places in the first 1 to 2.5 m behind the dam faces when the cold spell happens.
The thickness of dam body decreases with the height, which makes the dissipation of the heat at higher elevation easier, therefore the central part of dam body at higher elevation reaches a final equilibrium in a shorter period. The conclusion can be made from the fact that the temperature of thermometers T5-2, T5-5, T5-6 located at elevation 1115 m starts to vary periodically at the end of 1993 but the temperature of others installed at lower elevation requires more time to reach a final equilibrium.
The curves in Figure 4 and Figure 5 show that the temperature of the thermometers located in center part of layer tends to increase more greatly because the other ones are influenced by the rather lower temperature of air and reservoir water.
Figure 4: Temperature time development in the thermometers at crown cantilever profile at different elevations
Figure 5: Temperature time development in the thermometers at quarter cantilever section at different elevations
- 40 -
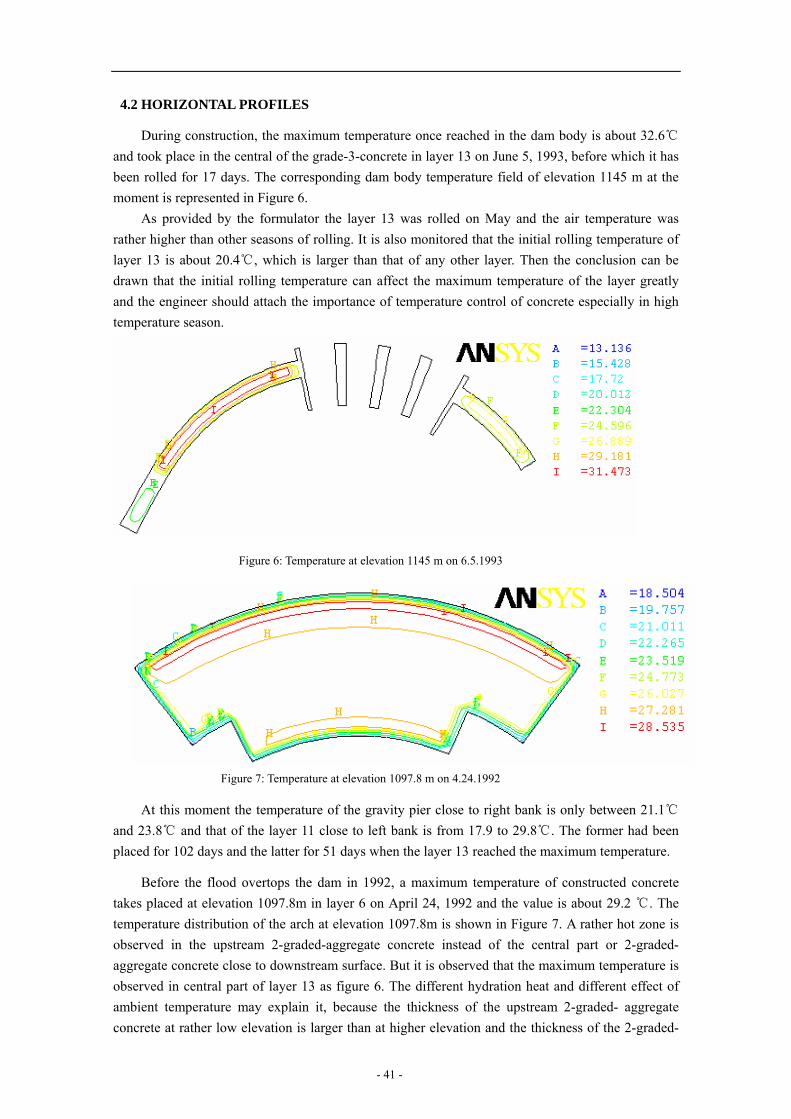
4.2 HORIZONTAL PROFILES
During construction, the maximum temperature once reached in the dam body is about 32.6 ℃
and took place in the central of the grade-3-concrete in layer 13 on June 5, 1993, before which it has been rolled for 17 days. The corresponding dam body temperature field of elevation 1145 m at the moment is represented in Figure 6.
As provided by the formulator the layer 13 was rolled on May and the air temperature was rather higher than other seasons of rolling. It is also monitored that the initial rolling temperature of layer 13 is about 20.4 , which is larger than that of any other layer. Then t℃ he conclusion can be drawn that the initial rolling temperature can affect the maximum temperature of the layer greatly and the engineer should attach the importance of temperature control of concrete especially in high temperature season.
Figure 6: Temperature at elevation 1145 m on 6.5.1993
Figure 7: Temperature at elevation 1097.8 m on 4.24.1992
At this moment the temperature of the gravity pier close to right bank is only between 21.1 ℃
and 23.8 and that of the layer 11 close to left bank is from ℃ 17.9 to 29.8℃. The former had been placed for 102 days and the latter for 51 days when the layer 13 reached the maximum temperature.
Before the flood overtops the dam in 1992, a maximum temperature of constructed concrete takes placed at elevation 1097.8m in layer 6 on April 24, 1992 and the value is about 29.2 . The ℃
temperature distribution of the arch at elevation 1097.8m is shown in Figure 7. A rather hot zone is observed in the upstream 2-graded-aggregate concrete instead of the central part or 2-graded- aggregate concrete close to downstream surface. But it is observed that the maximum temperature is observed in central part of layer 13 as figure 6. The different hydration heat and different effect of ambient temperature may explain it, because the thickness of the upstream 2-graded- aggregate concrete at rather low elevation is larger than at higher elevation and the thickness of the 2-graded-
- 41 -

aggregate concrete downstream is only about 2m.
The long term history of the temperature of the nodes 4199 and 32247, which once reached the above maximum temperature respectively, is shown in Figure 8. It is noticeable that the variation amplitude of node 32247 is smaller than that of the former during operation, which reflects the regularity of the water and air temperature variation.
Figure 8: Temperature development of node 32247 and 4199
4.3. CROWN CANTILEVER PROFILES
Figures 9 and 10 show the temperature distribution of crown cantilever section on two typical days. Figure 9 refers to the temperature field on April 24, 1992, on which the maximum temperature before flood in 1992 takes place. The maximum temperature appears in the upstream 2-graded-aggregate concrete in the first days after its pouring, because the cement hydration of this kind of concrete at lower elevation develops at a greater rate and/or volume than 3-graded-aggregate concrete center and 2-graded-aggregate concrete downstream, as provided.
Figure 10 refers the temperature field on May 14, 1992, the day before flood overtopped the dam crest. Comparing Figure 9 and Figure 10 it can be observed that the location of the residual hot zone changes from upstream to dam core, which is also due to the influence of the ambient temperature.
According to the calculation results the temperature of elevation 1090 m seems to reach a final equilibrium in the end of 1994, while the temperature at lower elevation requires more than 7 years doing that. The calculation also shows that the maximum temperature in dam center in January decrease about 2.1 in 1995, and 1.6 in 1996, 0.6 in 1997, 0.4 in 1998. The temperature of ℃ ℃ ℃ ℃
crown cantilever profile on January in 1994 and 1998 is represented in Figures 11 and 12 respectively. After a long period after construction, the thermal gradients are very small in the dam core, but those of surfaces change periodically due to the ambient temperature variation. It may be also noticed that in winter days, the surfaces temperature is lower than that of the center part of dam and the final average temperature in dam core is still 1.5~2.5 higher than the ℃ multiyear average air temperature because of the solar radiation.
- 42 -
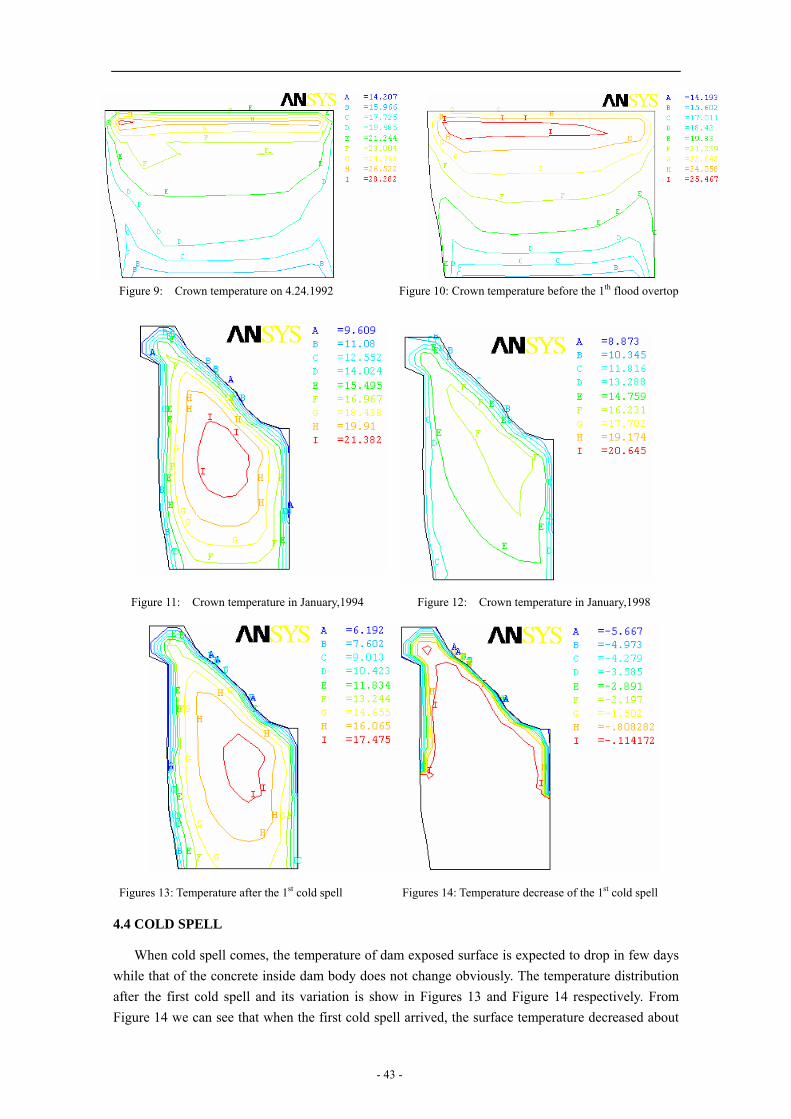
Figure 9: Crown temperature on 4.24.1992 Figure 10: Crown temperature before the 1th flood overtop
Figure 11: Crown temperature in January,1994 Figure 12: Crown temperature in January,1998
Figures 13: Temperature after the 1st cold spell Figures 14: Temperature decrease of the 1st cold spell
4.4 COLD SPELL
When cold spell comes, the temperature of dam exposed surface is expected to drop in few days while that of the concrete inside dam body does not change obviously. The temperature distribution after the first cold spell and its variation is show in Figures 13 and Figure 14 respectively. From Figure 14 we can see that when the first cold spell arrived, the surface temperature decreased about
- 43 -

6 . It also can be seen that the thermal gradients are very small in the central of the dam body and ℃
much intensive in the surface of the dam body, leading to great thermal tensile stresses, which may induce thermal cracks. It comes to a conclusion that the effect of cold spell is limited to the top exposed surface and the corresponding temperature control in cold spell is necessary especially when the concrete is rolled not long.
5. CONCLUTIONS
The present paper reports on a 3-D temperature simulation of a RCC arch dam during and after construction. This analysis is carried out using numerical analysis performed with FEM software ANSYS with the efficient help of birth and death of elements and its secondary development technology. After the study the following conclusions may be drawn:
i) The maximum temperature in the RCC dam is 32.6 , taking place in the layer 13 that is rolled in ℃
high temperature season. The rolling temperature can affect the maximum temperature of the concrete greatly and then it is important to control the initial rolling temperature of concrete. ii) For many layers, the high temperature zones tends to be in the 2-graded-aggregate RCC of the upstream instead of in the 3-graded-aggregate RCC in the first days, due to the difference of thermal property (heat hydration) and thickness. iii) The effect of cold spell is limited to the top surface, which may contribute greatly to the thermal tensile stresses. The corresponding temperature control in cold spell is necessary especially when the concrete is in its earlier age. iv) During operation, the thermal gradients are very small in the center because ambient temperature does only affect the top exposed surface of dam body. The temperature of a thick RCC arch dam core and low elevation requires a longer time to drop to the final equilibrium sate (more than 7 years in this case). v) To conclude, the thermal behavior of a RCC arch dam is a very complicated process, which involves many uncertainties in both material properties and environmental conditions. An error of 20~30% can thus be considered as an excellent accuracy for the analysis of practical problems [4]. The main source of errors comes from the input data rather than the modeling or computations techniques, because many key parameters and material properties vary in quite wide ranges and cannot be measured accurately and easily.
REFERENCES
[1] ANSYS Manuals (Theory manual, User’s guide Element manual), 2004. V7.1 [2] JiaZheng Pan,Temperatreu contral of hydraulic structure [M], 1990 [3] Bofang Zhu, Thermal stresses and temperature control of mass concrete [M], 1999 [4] Wang, Ch., Dilger, W.H. – Prediction of temperature distribution in hardening concrete,
International RILEM Symposium of Munich, October 1994
- 44 -
Development of RCC Construction Technology of GHIDRI
Lan Chunjie, Yang Jiaxiu (Guiyang Hydroelectric Investigation Design & Research Institute, CHECC)
Abstract: The paper gives the basic introduction and main technological superiorities of Guiyang
Hydroelectric Investigation Design & Research Institute, CHECC (GHIDRI) as well as the
achievements in the aspects of RCC construction materials and technology.
1. Brief introduction
GHIDRI was founded in 1958 and is an unit of the one hundred strongest design
institutes in investigation and design strength calculated according to comprehensive
multi-indicator in China. GHIDRI is a large design institute majoring in engineering
investigation and design, construction supervision, engineering consultation, general
contract for engineering project with 17 qualification certificates of Class A, including
engineering design and investigation, survey and drawing, engineering consultation,
general contract for engineering projects, industrial and civil architecture, construction
supervision, environmental assessment, water and soil conservation etc. GHIDRI owns
a strong technological force with various specifications and has advanced investigation
and test equipments. Now there is a staff of 1000, of which over 550 are specific
technicians, 44 registered structure engineers, 3 registered architectures, 165
construction supervisors and 12 registered construction cost engineers.
For 47 years, GHIDRI completed the hydraulic energy development planning of
more than 30 rivers and the geological investigation and design of 110 hydropower
projects on Wujiang, Nanpanjiang and Beipanjiang rivers and a lot of hydropower
projects with influence, characteristics and renovation. On Maotiaohe river, the seven
cascade stations with various dam types, new structures, advanced technology and
characteristics successfully resolves technological problems of hydropower construction
under the various complicated geological conditions in the karst area. The seven
cascade stations are called the museum of hydropower dam construction in the karst
area. The long and large tunnels constructed in Tiangshengqiao No. 2 hydropower
station on Nanpanjiang river pioneers in the design and construction of the longest
- 45 -
power tunnel in China. The RCC arch dam of Puding hydropower station and high and
thin arch dam (162m high, 25m base thickness and 254.35m crest arch length ) of
Dongfeng hydropower station on Wujiang catchment are awarded the golden models for
the national excellent engineering geological investigation and design. Since 1981,
GHEDRI has obtained over 47 prizes for the national, ministrial and provincial
scientific and technological advance, of which there are 2 first prizes and 3 second
prizes for the national scientific and technological advance, 12 first prizes for the
ministrial and provincial scientific and technological advance, 3 golden medals for the
national excellent engineering geological investigation and design. GHIDRI has
continuously honored with the title of “Abiding by Contracts and Keeping its Credit ”
awarded by Guiyang City for six years and awarded by Guizhou Province for 3 years.
Through the practice for many years, GHIDRI is experienced in RCC arch dam
construction technology, high and thin arch dam investigation, design and construction
technology, electric power transmission technology with high head and large capacity,
geological investigation and design of high slope and large-scale landslide treatment
technology, geological investigation and treatment technology of large and middle-scale
reservoir karst leakage proof, safety monitoring design and construction of hydraulic
structures, earth-rock overtopped cofferdam technology under complicated foundation
condition, geological investigation and design technology of long and large tunnel and
underground chambers under complicated geological condition, anti-seepage and
curtain grouting technology of earth-rock dam and new geophysical technology.
Some of the new technology, new method and new techniques reach the advanced level
in Guizhou Province, some reach the advanced level in China and some are in the lead
level among the international same industry in the world.
2. RCC construction technology development
Extra-dry concrete is used as the construction materials of RCC dam and
earth-rock dam construction methods is adopted in RCC dam. Rollcrete arised from dry
poor concrete abroad in 30's of the 20th century and was normally used in the concrete
gravity design in the 70's, which was named as rollcrete. In 1981, the test and research
of rollcrete was started in China and in 1986, Kengkou RCC gravity dam in Fujian
- 46 -
Province was completed, which is the first completed RCC gravity dam since starting
the test of RCC materials in China, in 1978. The impervious asphalt mortar layer is used
in the dam face which is protected by precast concrete plate.
In 1986, GHIDRI started the study on RCC damming in the dam design of
Tianshengqiao No.2 hydropower project (10 km long power tunnel and 1320MW
installed capacity). On the basis of absorbing the experiences at home and abroad, after
the study and analysis of physical property and thermal property of RCC materials,
satisfactory scientific results are obtained. The various property index of rollcrete meets
the design requirements and the total cementing material is 140kg/m3, of which cement
is only 55kg/ m3. The dam height of Tianshengqiao hydropower station is 60.7m and the
crest length is 490.97m. The dam is divided into 26 sections and the maximum
transverse joint space is 63m. The impervious body adopts normal concrete to wrap
rollcrete, named “gold wrapping silver”. The impervious body is 3m thick, the RCC
construction material is 3-graduation mixture (the maximum aggregate diameter of
80mm), Vc value is 10~25 s, the strength is C90-15, anti-seepage is W4 and fines
content is only about 8.6%. The coal ash quality reaches Grade 2 standard. Through
the successful construction of Tianshengqiao RCC gravity dam, the RCC materials are
further understood and the first-hand valuable data of RCC construction technology are
accumulated, which make fine foundation for the development and application of RCC
construction technology of GHIDRI.
In 1988, GHIDRI applied RCC dam construction technology to the arch dam
design of Puding hydropower station and set up a group of topic research . In 1990, the
topic “ Study on Structure Design of Puding RCC Arch Dam” was listed as the key
tackled project of science and technology by the former Energy Ministry and in 1991,
the topic was turned into the key tackled project of science and technology of “the
Eighth Five-year Plan” in China, which systematically and comprehensively studied
RCC arch dam structure, measures of temperature control, anti-crack, anti-seepage,
combination between layers and concrete spreading, construction materials, observation
design and instrument burying, and safety assessment. The technological problems were
successfully resolved, so Puding hydropower station was successfully put into
- 47 -
operation.
Puding hydropower station has a single-centered single-curvature arch dam with a
maximum height of 75m, a maximum base width of 28.2m and a crest arc length of
195.7m. The dam is made from 2-grade rollcrete as the self anti-seepage without
impervious layers and the anti-crack technology of induced joint is used for dam
construction. The maximum joint space is 80m, which needs higher requirements for
anti-crack, anti-seepage and combination between layers, therefore the following
measures are adopted in the RCC mix proportion design research: such as use fine
aggregate gradation for the impervious concrete materials of water face to raise cement
material and admixture content; raise water reduction rate and extend the initial
cementitious time, reduce the concrete Vc value (10±5s), raise the remoulding effort
and compactibility, utilize the stone powder in manufactured sand below 0.16mm and
raise the content to 12%-15%. The above comprehensive measures improve RCC
property, prevent aggregate from separation and raise RCC combination between layers,
and the shear resistance and anti-seepage capability. In addition, in order to raise the
combination capability between layers and prevent layers from leakage, net cement ash
mortar with small gel is placed on the layer of 2-grade zone of water face upstream. In
the later period of the dam construction, the placement of net mortar is turned into the
addition of net mortar and the technology of abnormal concrete by immersion vibrator
is adopted.
As a result of that the reasonable structure design is combined with the
comprehensive technological measures of RCC construction materials, the first RCC
arch dam with full section is constructed in China. Under the condition of no
impervious layer on the upstream face, the destination of anti-crack, anti-seepage and
good lift combination is reached. The RCC arch dam of Puding hydropower project is
successfully constructed.
The RCC arch dam of Puding hydropower project is the key topic of science and
technology tackle of “the Eighth Five-year Plan” of GHIDRI and is the first RCC arch
dam which is designed and constructed in China and is the highest RCC arch dam in the
world. It denotes the new history of the RCC construction technology in China and its
- 48 -

scientific research result takes the lead level in the world. The technology is applied to
Shapai and Shimenzi hydropower projects. The construction of Puding hydropower
state makes GHIDRI's RCC construction technology step to a new platform.
Depending on the technological superiority of Puding hydropower project,
GHDIRI undertook the design and construction supervision of Shimenzi reservoir arch
dam in Xinjing Uygur Autonomous Region, in 1997 and the design of Longshou
hydropower project in Gangshu, in 1998. GHIDRI successfully applies the new RCC
construction technology in the south to the dam construction in the extremely cold
weather in the northwest.
Longshou hydropower project started construction in 1999 and was put into
operation in advance in June 2001 and in July of the same year, the dam was completed.
It has a double curvature arch dam with a maximum. height of 80m and a base thickness
of 13.5m. The gravity dam of 54.5m high and a thrust pier of 32m high were set
respectively on the both abutments as the foundation of arch terminal. The dam is
composed of three sections with complicated structures and is made from rollcrete.
There are three outlets at the middle height and two surface orifices placed in the dam.
Until now, it is the highest RCC double curvature thin arch dam completed in the
northwest where the amplitude of temperature variation is 70ºC and it is extremely cold
with high seismic intensity and heavy evaporation.
In 1999, GHIDRI was in charge of the study on the topic “RCC arch dam
construction technology in the killing freeze area”, which was a scientific and
technological item studied on the basis of Longshou and Shimenzi hydropower projects
in the killing freeze area and enriched the content of the study of RCC construction
technology. Longshou and Shimenzi hydropower projects are successfully completed
like a winter plum blossom being quietly in full bloom in the northwest plateau.
The mature technology in the study on Puding RCC materials is succeed to the
study on the above two projects. The sharp characteristics of mix proportion are as
follows:
Adopt low ratio of water by cement, large quantity coal ash, air-entraining
agent; study and raise RCC durability and change regulation. Summarize how
- 49 -
to raise effectively the frost-resisting property and durability under the
condition of adding coal ash. The frost-resisting property and durability are
raised from 50 times or from 100 times to 300 times.
Under the natural condition of dry, extremely cold and great temperature
variation, adopt MgO addition technology. Adding about 4% MgO to
compensate RCC shrinkage and reduce concrete crack. The practice approves
that they are effective and feasible technological measures.
Study how to extend the initial condensation time of rollcrete in the dry and
heavy evaporation area and suppose the additive type and the influence result
of addition on extending condensation time. In the mix proportion, select the
set-retarding admixture. According to the project actuality, further decrease
the Vc value of concrete out of mixer from 7-8s to 3-5s. In fact, reduce the Vc
value and then raise the air content, so that it is favor for raising the RCC
durability.
Have deep knowledge of the natural sand aggregate in the northwest area. The
sand fineness modulus is 2.0~3.4 and fines content is 5%~20%. Study the
influence of sand quality on concrete, especially on RCC, further relieve the
influence on the various properties of rollcrete.
Apply the abnormal concrete technology of Puding hydropower project
summarized in the later period to Longshou and Shimenzi hydropower
projects. Study on abnormal concrete mix proportion and property in the
laboratory and in the field. In the temperature control calculation, consider the
abnormal concrete influence on the dam thermal property and mechanical
property. The actual usage shows it is successfully.
Because the above material technology is used comprehensively, the RCC
construction material technology is developed from the north to the south and the
achievements are obtained. A great progress of RCC construction material technology is
achieved in China.
The topic of “Study on RCC arch construction technology” is the scientific
research item conducted by GHIDRI. The item was accepted and appraised by the State
- 50 -
Network Corporation in Beijing on Oct.1 2004. The research item is the renovation of
GHIDRI in the RCC arch dam construction technology and also a new break-through on
the foundation of Puding RCC arch dam construction technology. The two projects
constructed in the killing freeze area achieved systematical results of dam structure,
material, construction and quality control, and evident economic and social benefits. It
proves the structure design concept that RCC construction technology can be instead of
substitute for normal concrete dam construction. The complicated porous structure of
normal concrete and the dam construction technology under the adverse weather
condition are applied to rollcrete. The boundary line of rollcrete application and
spreading is broken. The RCC construction technology explains a complete new
concept and gives a new connotation . GHIDRI raises the level of RCC arch
construction technology and promotes its development, and does a hard work and
makes a great contribution.
In 2004, GHIDRI completed the study on special topic of dam type alternation of
Guangzhao hydropower project and passed the examination. The normal concrete
gravity dam of 195.5m high is changed to a RCC gravity dam. On August 2005, the
rollcrete test on the site was completed and the cushion concrete was placed, which
show that GHIDRI can apply the RCC construction technology to the 200m high
gravity dam. In addition, the RCC gravity dam with a height of 135m of Dahuashui
hydropower project started compacting and the dam reached the elevation of 16m. It is
expected that the Dahuashui project will be completed in 2006 and have the highest
RCC arch dam under construction in China now.
At the present, there are about 20 RCC gravity and arch dams completed and under
construction, which are designed by GHIDRI. The highest RCC gravity dam reaches
200m and RCC arch dam about 150m.
3. Future target and direction
In spite of the rollcrete research and development for 20 years and accumulating
rich experience, because different geological and weather conditions, dam construction
materials, project scale and construction condition exist, there are a lot of technological
problems remaining to be solved. In the future, more attentions should be paid to the
- 51 -

study of following aspects in the structure design of RCC construction technology.
Pay attention to the entire structure and detail structure of RCC gravity dam,
such as impervious system, anti-crack measures, lifts combination etc. and
their design theory and research. Apply RCC construction technology to the
250m ~300m high gravity dams.
Study on temperature control measure and construction technology of
extremely large dam face.
Pay attention to the entire structure and detail structure of RCC arch dam,
such as impervious system, anti-crack measures, lifts combination etc. and
their design theory and research. Apply RCC construction technology to the
200m high arch dams.
More attention should be paid to study of the following aspects in dam
construction materials.
Pay attention to the study of rollcrete material property of high arch and
gravity dams which is used under the complicated force conditon.
Water face concrete which has high requirement of anti-seepage and
durability still selects the maximum aggregate fine diameter, lower water and
cement ration, applicable admixture and quantity.
Pay attention to the selection of RCC sand-gravel aggregate, especially the
selection of gravel gradation, sand fine gradation, fines modulus and fines
content.
Except using coal ash as admixture, further study on the possibility of other
materials which can be used as admixture, such as mineral waste and their
properties.
Pay attention to the construction technology study on rollcrete material under
negative temperature, so as to use the partial time of the winter season in the
north to construct continuously and further accelerate RCC construction
progress.
- 52 -

4. Introduction of representative projects
4.1 RCC gravity dam of Tianshengqiao No.2 hydropower station
Tianshengqiao No.2 hydropower station is located on the upstream of Hongshui
river, the boundary river between Guizhou and Yunnan provinces. The complex is
composed of intake structure of the dam, three power tunnels of 10km long on the right
bank and a ground powerhouse. The total installed capacity is 1320MW. It has a RCC
gravity dam, which is composed of non-overflow section on the left bank, middle
overflow section, silt drainage and water abstraction section. The dam is a “s”
shape.(see.Fig.)
THE TIANSHENGQIAO SECOND CASCADE HYDROPOWER STATION IN GUIZHOU PROVINCE
- 53 -
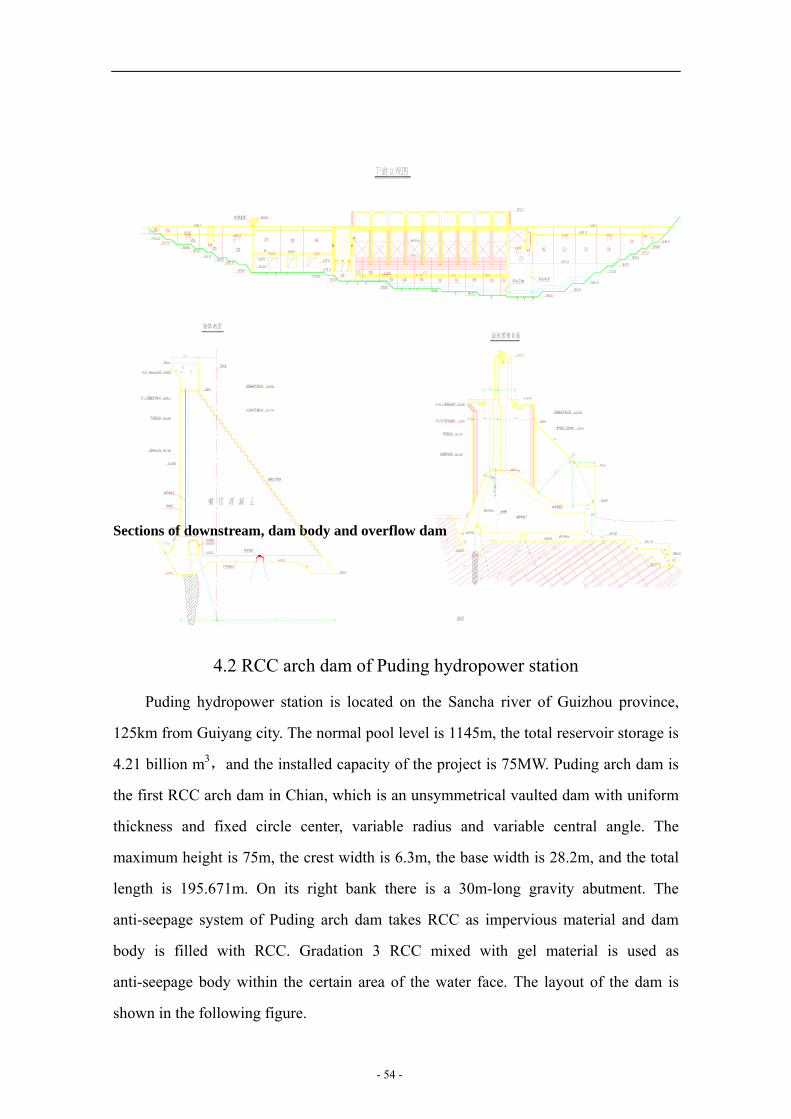
Sections of downstream, dam body and overflow dam
4.2 RCC arch dam of Puding hydropower station
Puding hydropower station is located on the Sancha river of Guizhou province,
125km from Guiyang city. The normal pool level is 1145m, the total reservoir storage is
4.21 billion m3,and the installed capacity of the project is 75MW. Puding arch dam is
the first RCC arch dam in Chian, which is an unsymmetrical vaulted dam with uniform
thickness and fixed circle center, variable radius and variable central angle. The
maximum height is 75m, the crest width is 6.3m, the base width is 28.2m, and the total
length is 195.671m. On its right bank there is a 30m-long gravity abutment. The
anti-seepage system of Puding arch dam takes RCC as impervious material and dam
body is filled with RCC. Gradation 3 RCC mixed with gel material is used as
anti-seepage body within the certain area of the water face. The layout of the dam is
shown in the following figure.
- 54 -
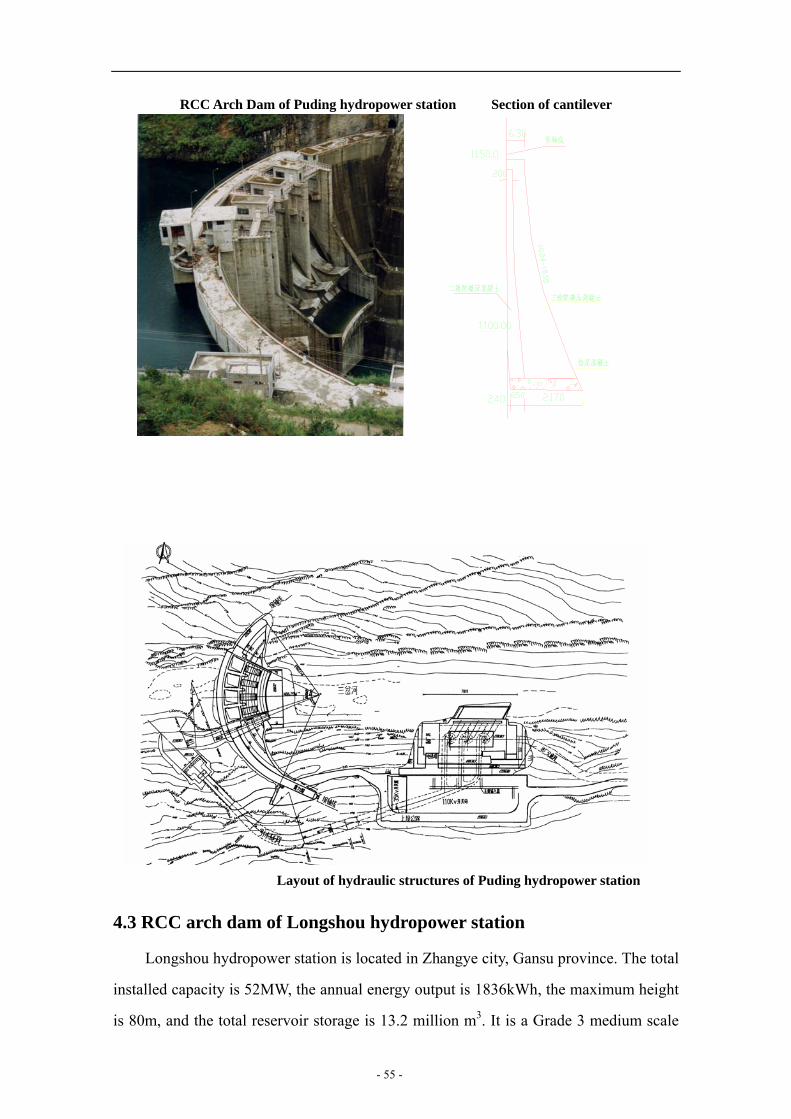
RCC Arch Dam of Puding hydropower sta
tion Section of cantilever
Layout of hydraulic structures of Puding hydropower station
4.3 RCC arch dam of Longshou hydropower station
insta
Longshou hydropower station is located in Zhangye city, Gansu province. The total
lled capacity is 52MW, the annual energy output is 1836kWh, the maximum height
is 80m, and the total reservoir storage is 13.2 million m3. It is a Grade 3 medium scale
- 55 -
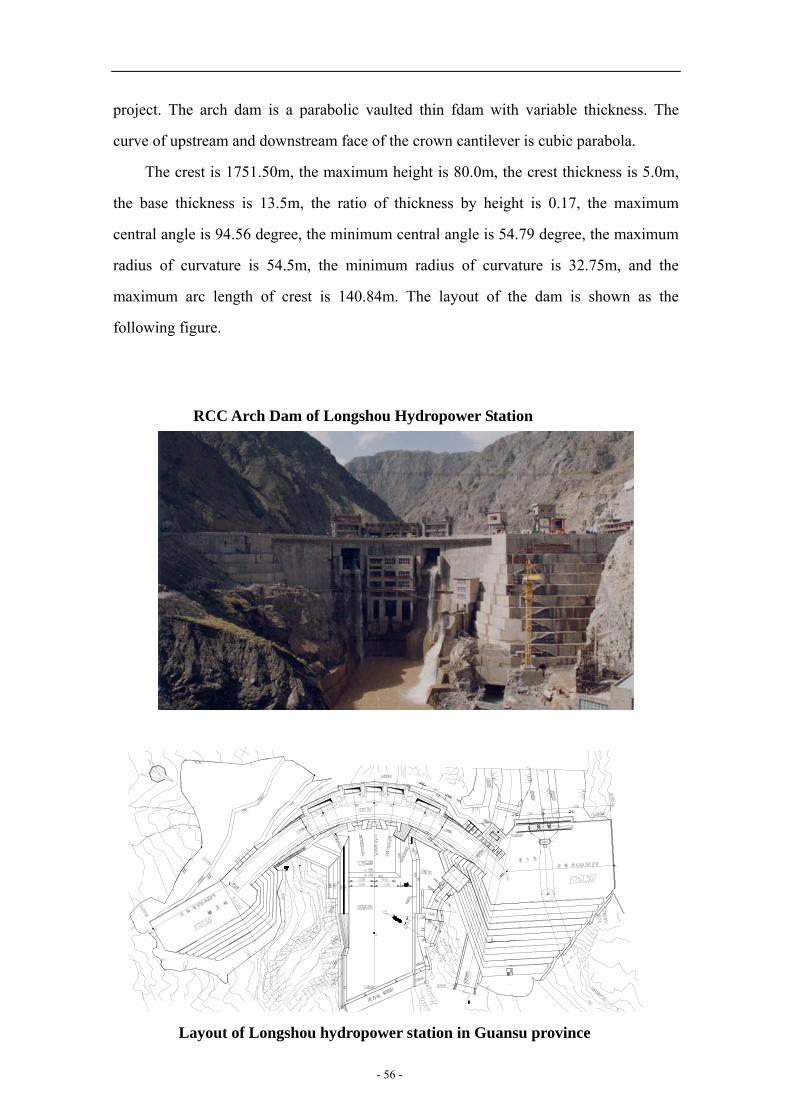
project. The arch dam is a parabolic vaulted thin fdam with variable thickness. The
curve of upstream and downstream face of the crown cantilever is cubic parabola.
The crest is 1751.50m, the maximum height is 80.0m, the crest thickness is 5.0m,
the b
RCC Arch Dam of Longshou Hydropower Station
ase thickness is 13.5m, the ratio of thickness by height is 0.17, the maximum
central angle is 94.56 degree, the minimum central angle is 54.79 degree, the maximum
radius of curvature is 54.5m, the minimum radius of curvature is 32.75m, and the
maximum arc length of crest is 140.84m. The layout of the dam is shown as the
following figure.
- 56 -
消力坎
Layout of Longshou hydropower station in Guansu province

4.4 RCC gravity dam of Guangzhao hydropower Project Guangzhao hydropower Project is a Grade 1 large scale project, and the dam is a
Grad
3 3 3
ormal
conc
e 1 structure. It is a complete cross-sectional RCC gravity dam. The crest elevation
is 750.50m, the maximum height is 195.5m, the maximum width is 159.05m, and the
total crest length is 410m. The dam is divided into 20 sections. The concrete volume is
2800km , among which the RCC is 2420km , the normal concrete is 380km , and the
RCC covers 86 percent. The layout of the dam is shown in the following picture.
The dam is designed with whole cross-sectional RCC, which is divided into n
rete, rolled concrete and abnormal concrete. The dam upstream at the elevation
above 40m takes Grade 2 RCC mixed with gel material as anti-seepage body. The
impervious lift of the upstream face is from 3.5m to 13.3m. The upstream face takes
abnormal concrete with a thickness from 0.8m to 1.5m. The downstream face takes
abnormal concrete with a thickness of 0.5m. Until now, the excavation of the dam base
has been completed and the placement of basic cushion concrete is started. It is
expected that the dam construction will be completed by the end of 2007.
Simulative figure of the Guangzhao hydropower station
- 57 -

Layout of Guangzhao hydropower station in Guizhou province
Section of Overflow Gravity Dam Section of Gravity Dam 4.5 RCC arch dam of Dahuashui hydropower project
The project is the highest among the present RCC dams under construction. On the
left bank of the dam site there is an ancient river channel, and the ground is a flat slope.
According to the characteristics of landform and geology, a RCC gravity dam is built on
the ancient river channel, which can be partly to act as the abutment of the arch dam.
- 58 -

The RCC double curvature arch dam is placed on the main river channel.
The maximum dam height is 134.50m, the crest thickness is 7.00m, the base
thickness is 25.00m, and the ratio of thickness by height is 0.186. The maximum arc
length of crest is 198.43m. The arch dam is unsymmetrical.
The Grade 2 RCC mixed with medium and high gel material is used as the
impervious layer and its thickness is from 2m to 7m.
Two induced joints and two short peripheral joints are adopted in the arch dam
structure alternative. The two induced joints on the right and left sides are placed on the
two sides of the orifices on the right and left sides. They are radial layout. The two short
peripheral joints are located on the abutments on the right and left banks. On the left
bank the peripheral joint above the elevation of 800m is on the contacting face between
the arch dam and gravity dam. The layout of the dam is shown as following figure.
Constructing RCC Arch Dam
- 59 -
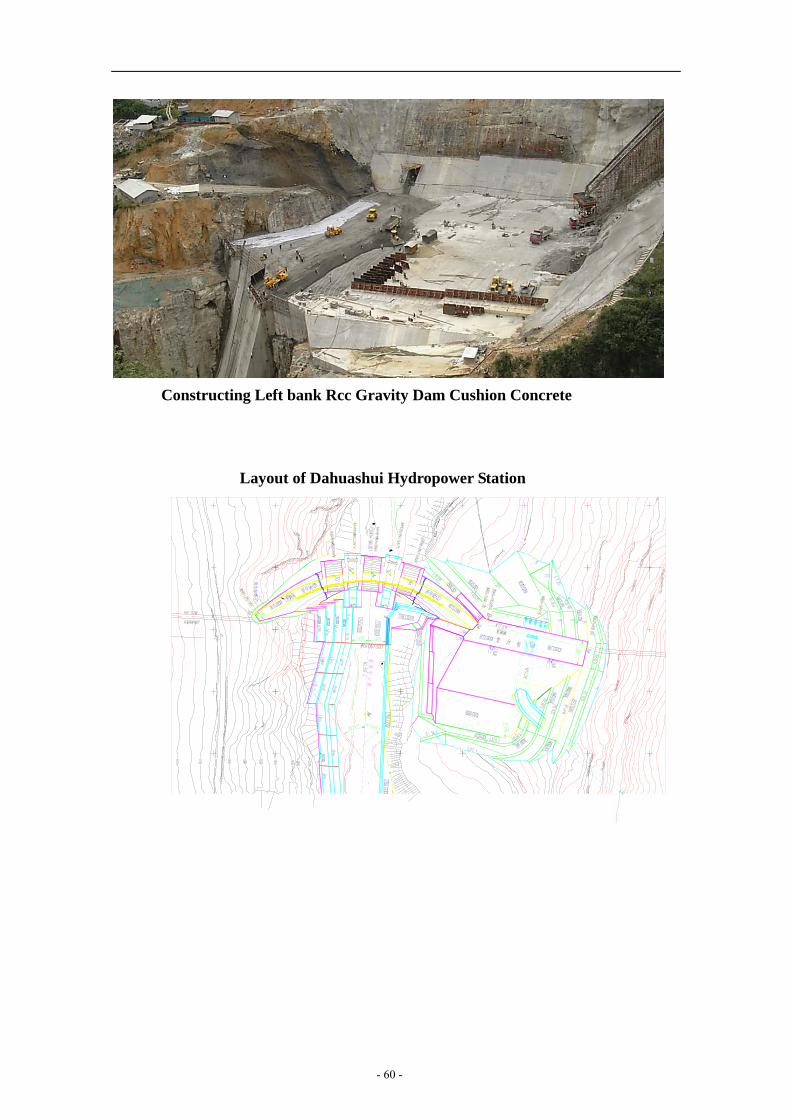
Constructing Left bank Rcc Gravity Dam Cushion Concrete
Layout of Dahuashui Hydropower Station
- 60 -

Downpstream view of the Dahua hydropower station Section of cantilever
5 Conclusion It has been 20 years since GHDIRI began the study of RCC construction material
of Tianshengqiao No.2 hydropower station in 1986. GHIDRI has undertaken the design of about 20 RCC arch dams and gravity dams in succession, of which Tianshengqiao No.2, Puding, Gansu Longshou and Wujiang Suofengying hydropower stations are completed, Guangzhao , Dahuashui, Silin and Shatuo hydropower projects are under construction or will be constructed. The construction of the above RCC dams represents GHIDRI's technology level in the different periods from introducing, applying and absorbing of RCC construction technology respectively. Today GHIDRI has reached the world advanced level in the RCC construction technology research. GHIDRI will have a prospers future in the dam design through designers’ continuous exploring and improving in practice.
- 61 -
EIGHTH INTERNATIONAL BENCHMARK WORKSHOP
ON
NUMERICAL ANALYSIS OF DAMS
23-30 October, 2005
Wuhan, Hubei, P.R.China
THEME C
Evaluation of the behaviour and safety (static and dynamic)
of a rockfill dam
- 62 -
1. Foreword Records obtained from dam instrumentation are crucial in order to interpret the structure behaviour and be able to assess its safety. However, due to the uncertainties involved in the process of installing such instruments, the way readings are collected, the nature of the instruments and their conservation state, measurements can be not as reliable as expected. In fact, measurements can be misunderstood, can lead to make the wrong decisions and, in some cases, can make dam engineers to develop some degree of scepticism about their importance. Numerical modelling can be a helping tool but also adds some additional uncertainties if they are not carefully and rigorously used: construction data should be examined, constitutive models properly chosen, etc. In summary, combination of a good knowledge of the instruments, an appropriate conservation of instrumentation and reading procedure, a realistic data management program and the implementation of numerical models is a very important task that has to be carefully undertaken due to all the involved uncertainties. But also, the behaviour itself of a dam is a source (some times the main one) of uncertainties. 2. Aim of the theme In this context, the study of the behaviour and safety of a dam is proposed. In particular, New TOUS dam on the Jucar river in Spain is a 140 meter high rockfill dam with a clay core, whose geometrical definition is quite singular. It was constructed between 1991 and 1996 at the place of the old dam that failed in 1982. Instrumentation data (vertical and horizontal movements, pore pressures, total pressures, etc.) have been collected since the beginning of the construction until now. The water level (real static load) has been recorded on a daily basis. Although no real significant earthquake has been recorded at the site, design earthquakes up to ten thousand years of return period have been calculated. The exercise proposed aims at predicting the stress-strain behavior of the dam and perform some static and dynamic safety calculations. 3. Formulation of the Theme Given Data: The geometry of a cross section (P21.dwg and appendix)
- 63 -

Material static and dynamic properties (See appendix) Core pore pressure distribution measured (See appendix) Post constructional settlement measured (See appendix) Velocity time history of the MCE (See appendix) Maximum and minimum reservoir levels per year:
Table. Maximum and minimum water level per year (meters above sea level)
YEAR MAX. Reservoir level (meters above sea level)
MIN. Reservoir Level (meters above sea level)
1996 and 1997 (very stable around 80 m.a.s.l) (very stable around 80 m.a.s.l) 1998 91.41 80.39 1999 103.05 82.41 2000 90.13 81.1 2001 96.73 82.16 2002 99.37 80.05 2003 95.87 79.81
Problem: Part 0 Participants will justify their static numerical tool (finite difference or finite element), their geometric model (cell sizes and location) and all constitutive models used in about 5 pages. In order to calibrate the static model, the following records are to be used: Beginning of construction: 1991 End of construction: June 1996 Next figure shows the measured settlement distribution during construction:
Figure: settlement in centimetres during construction (cross section geometry values are in meters above sea level).
- 64 -
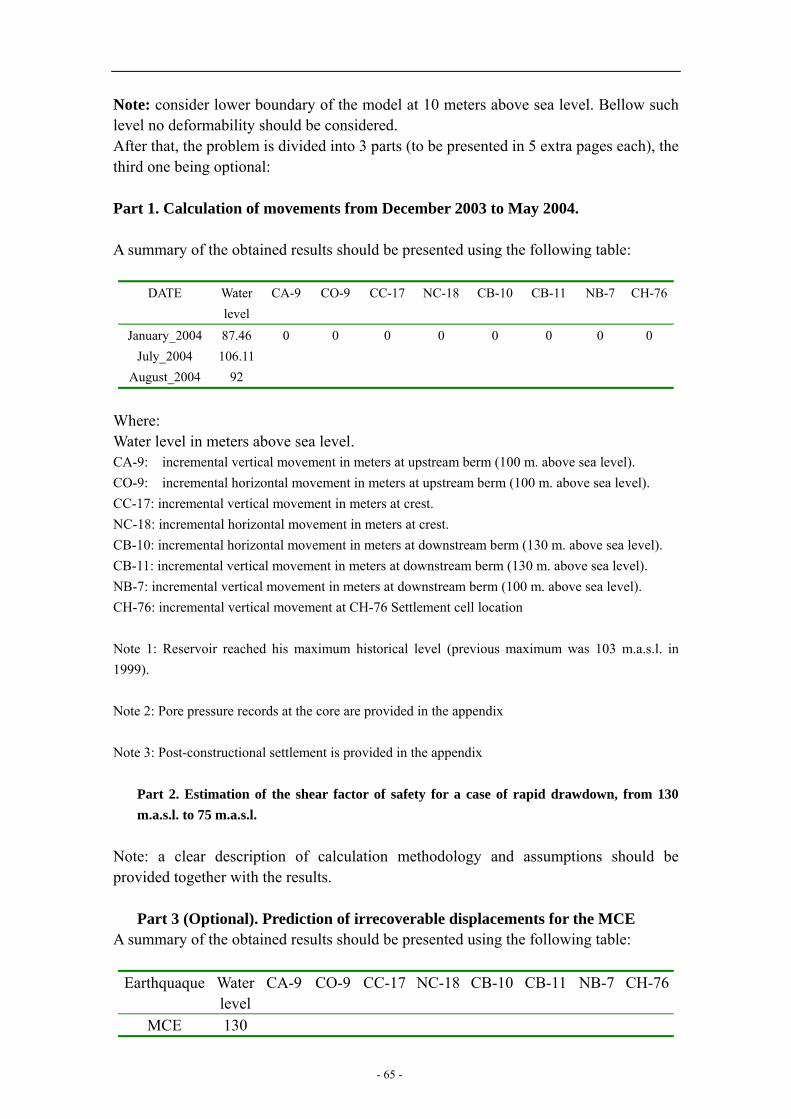
Note: consider lower boundary of the model at 10 meters above sea level. Bellow such level no deformability should be considered. After that, the problem is divided into 3 parts (to be presented in 5 extra pages each), the third one being optional: Part 1. Calculation of movements from December 2003 to May 2004. A summary of the obtained results should be presented using the following table:
DATE Water
level CA-9 CO-9 CC-17 NC-18 CB-10 CB-11 NB-7 CH-76
January_2004 87.46 0 0 0 0 0 0 0 0 July_2004 106.11
August_2004 92
Where: Water level in meters above sea level. CA-9: incremental vertical movement in meters at upstream berm (100 m. above sea level). CO-9: incremental horizontal movement in meters at upstream berm (100 m. above sea level). CC-17: incremental vertical movement in meters at crest. NC-18: incremental horizontal movement in meters at crest. CB-10: incremental horizontal movement in meters at downstream berm (130 m. above sea level). CB-11: incremental vertical movement in meters at downstream berm (130 m. above sea level). NB-7: incremental vertical movement in meters at downstream berm (100 m. above sea level). CH-76: incremental vertical movement at CH-76 Settlement cell location Note 1: Reservoir reached his maximum historical level (previous maximum was 103 m.a.s.l. in 1999). Note 2: Pore pressure records at the core are provided in the appendix Note 3: Post-constructional settlement is provided in the appendix
Part 2. Estimation of the shear factor of safety for a case of rapid drawdown, from 130 m.a.s.l. to 75 m.a.s.l.
Note: a clear description of calculation methodology and assumptions should be provided together with the results.
Part 3 (Optional). Prediction of irrecoverable displacements for the MCE A summary of the obtained results should be presented using the following table:
Earthquaque Water
level CA-9 CO-9 CC-17 NC-18 CB-10 CB-11 NB-7 CH-76
MCE 130
- 65 -

Where: Water level in meters above sea level. CA-9: irrecoverable vertical movement in meters at upstream berm (100 m. above sea level). CO-9: irrecoverable horizontal movement in meters at upstream berm (100 m. above sea level). CC-17: irrecoverable vertical movement in meters at crest. NC-18: irrecoverable horizontal movement in meters at crest. CB-10: irrecoverable horizontal movement in meters at downstream berm (130 m. above sea level). CB-11: irrecoverable vertical movement in meters at downstream berm (130 m. above sea level). NB-7: irrecoverable vertical movement in meters at downstream berm (100 m. above sea level). CH-76: irecoverable vertical movement at CH-76 Settlement cell location Note 1: A clear description of calculation methodology and assumptions should be provided together with the results, with special attention to how upstream filter licuefaction potential has been introduced in the analysis. Note 2: Velocities are to be applied to the rock at 10 meters above sea level, where a much stiffer foundation ends. Note 3: Rayleight damping equal to 0.05
- 66 -

APPENDIX Following Figure show geometry and types of materials for the cross section: (see file P21.dwg for detailed geometry):
Following table summarize known static and dynamic material prMaterial
Dry density
(KN/m3)
Porosity C
(KN/m2)
φ (Degrees)
Core
20 0.08 100 28
Quarrel 23 0.25 0 45 Filter
19
0.2
0
30
Rock 26
…..
….
…..
Table: Material static and dynamic prop
Note 1any other needed property may be used if justified by the particNote 2remember to consider lower foundation level at 10 meters abodeformability should be considered.
- 67 -
Consider Four Types of material:
1. Core (clay) 2. Shell (quarrel) 3. Filters (sand) 4 F d ti ( k)
operties: Dyn. Shear Modulus
(Pascals)
1.9χ108
5.2χ108
….. 109
erties ipant. ve sea level. Bellow such level no
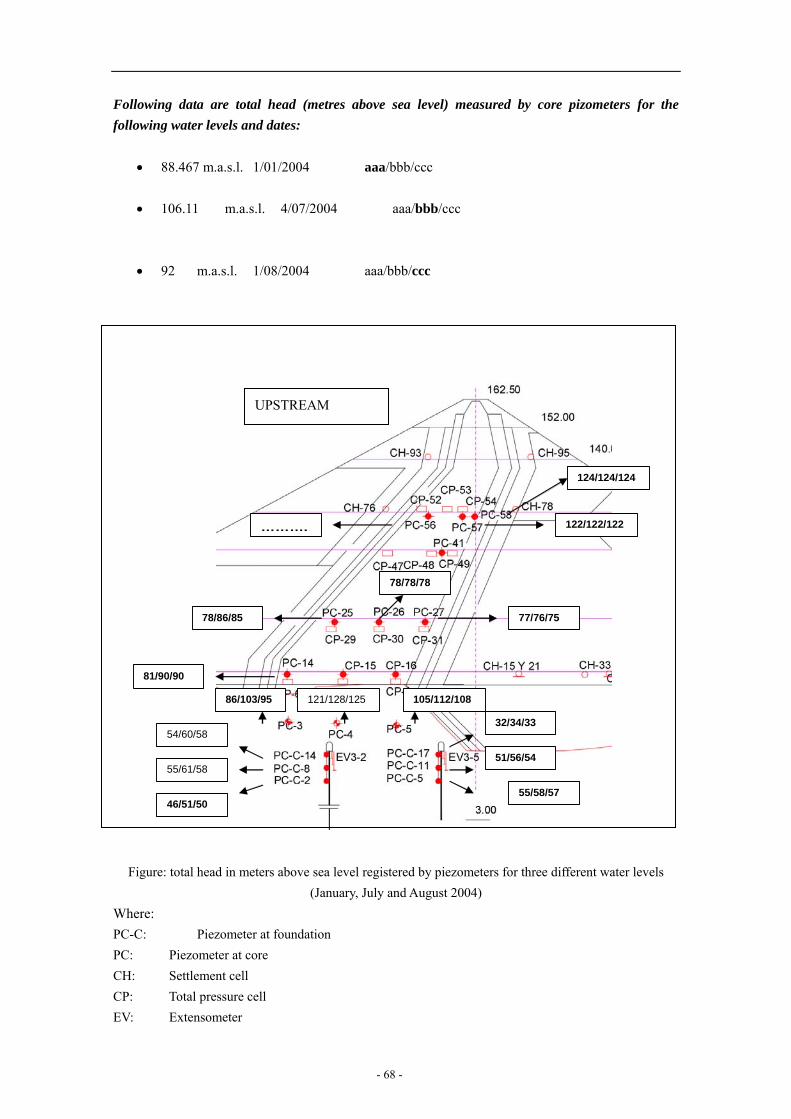
Following data are total head (metres above sea level) measured by core pizometers for the following water levels and dates:
• 88.467 m.a.s.l. 1/01/2004 aaa/bbb/ccc
• 106.11 m.a.s.l. 4/07/2004 aaa/bbb/ccc
• 92 m.a.s.l. 1/08/2004 aaa/bbb/ccc
122/122/122 ……….
77/76/75 78/86/85
81/90/90
32/34/33
51/56/54
55/58/57
78/78/78
54/60/58
55/61/58
46/51/50
86/103/95 121/128/125 105/112/108
124/124/124
UPSTREAM
Figure: total head in meters above sea level registered by piezometers for three different water levels
(January, July and August 2004) Where: PC-C: Piezometer at foundation PC: Piezometer at core CH: Settlement cell CP: Total pressure cell EV: Extensometer
- 68 -
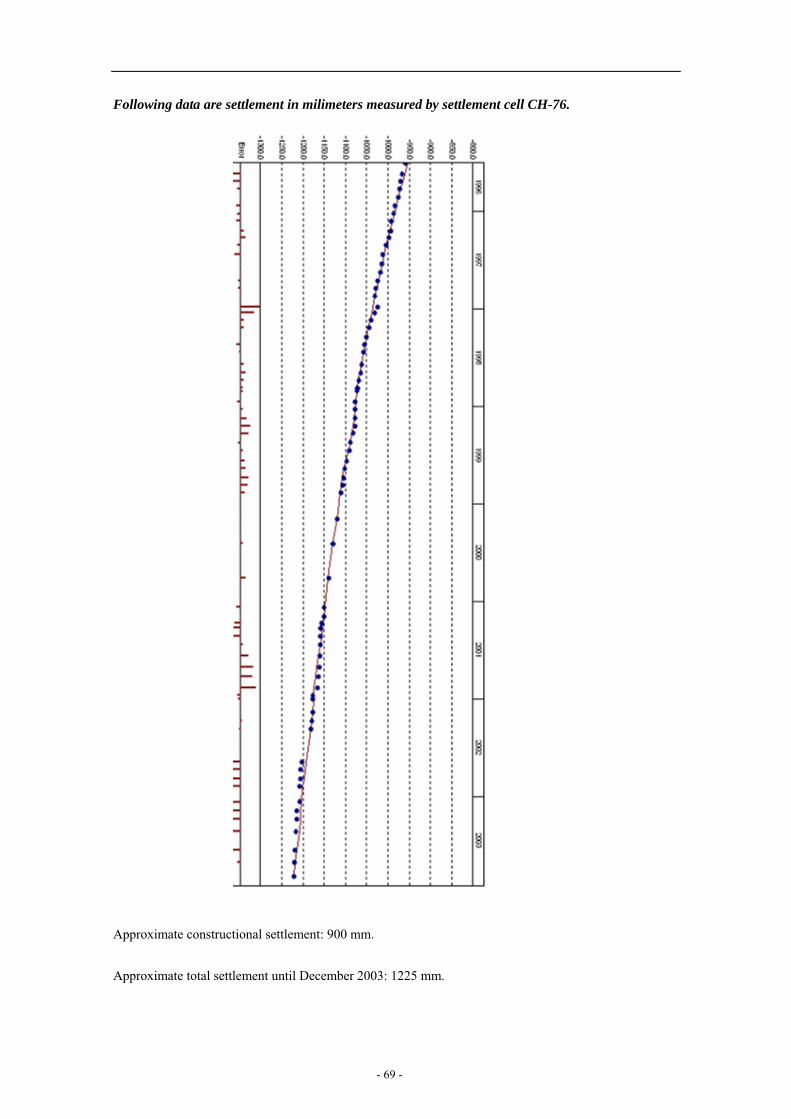
Following data are settlement in milimeters measured by settlement cell CH-76. Approximate constructional settlement: 900 mm. Approximate total settlement until December 2003: 1225 mm.
- 69 -

Following data are horizontal MCE velocities by pairs (time, velocity): “aa,bb” where aa: time in seconds where bb: velocity (Important: velocity numbers have to be multiplied by ten to be in meters per second). 0,0 0.02,-0.0003 0.04,-0.000112 0.06,0.00056 0.08,0.0008
0.1,0.000738 0.12,0.000642 0.14,0.000782 0.16 -3.4e-5
0.18,-0.00044 0.2,-0.000416 0.22,-0.000468 0.24,0.000138
0.26,0.00246 0.28,0.00222 0.3,-0.000978 0.32,-0.006364
0.34,-0.010696 0.36,-0.01438 0.38,-0.016894 0.4,-0.017736
0.42,-0.02066 0.44,-0.020584 0.46,-0.019334 0.48,-0.016856
0.5,-0.013866 0.52,-0.015566 0.54,-0.01837 0.56,-0.020832
0.58,-0.025672 0.6,-0.023242 0.62,-0.017958 0.64,-0.011286
0.66,-0.00915 0.68,-0.010556 0.7,-0.011768 0.72,-0.013266
0.74,-0.0083 0.76,-0.001524 0.78,-0.000674 0.8,-0.002132
0.82,-0.002728 0.84,-0.004096 0.86,-0.003658 0.88,-0.00184
0.9,-0.001552 0.92,-0.006128 0.94,-0.012642 0.96,-0.016172
0.98,-0.013208 1,-0.014584 1.02,-0.02096 1.04,-0.020764
1.06,-0.011482 1.08,-0.00051 1.1,0.00781 1.12,0.007444
1.14,0.004478 1.16,-0.000314 1.18,-0.002212 1.2,-0.006372
1.22,-0.011986 1.24,-0.00964 1.26,-0.0038 1.28,-0.000164
1.3,-0.000186 1.32,0.000496 1.34,0.00232 1.36,-0.00757
1.38,-0.014904 1.4,-0.01377 1.42,-0.017628 1.44,-0.01942
1.46,-0.017394 1.48,-0.017326 1.5,-0.021488 1.52,-0.021154
1.54,-0.014616 1.56,-0.0103 1.58,-0.009582 1.6,-0.014112
1.62,-0.014448 1.64,-0.009588 1.66,-0.002164 1.68,-0.00031
1.7,-0.004204 1.72,-0.003446 1.74,0.002928 1.76,0.004666
1.78,0.006 1.8,0.002058 1.82,-0.004626 1.84,-0.006282
1.86,-0.007558 1.88,-0.017034 1.9,-0.025044 1.92,-0.033126
1.94,-0.039046 1.96,-0.043062 1.98,-0.042306 2,-0.035644
2.02,-0.028144 2.04 -0.022864 2.06,-0.022322 2.08,-0.024794
2.1,-0.025906 2.12,-0.019926 2.14,-0.014314 2.16,-0.017488
2.18,-0.024434 2.2,-0.026278 2.22,-0.026216 2.24,-0.024378
2.26,-0.014202 2.28,-0.00623 2.3,-0.001948 2.32,0.002842
2.34,0.00714 2.36,0.013462 2.38,0.01273 2.4,0.00603
2.42,0.003632 2.44,0.001544 2.46,0.004146 2.48,0.00737
2.5,0.00922 2.52,0.007536 2.54,0.006392 2.56,0.005118
2.58,0.004098 2.6,0.007066 2.62,0.013208 2.64,0.02022
2.66,0.02558 2.68,0.022132 2.7,0.010768 2.72,0.011356
2.74,0.01222 2.76,0.015014 2.78,0.01678 2.8,0.019736
- 70 -

2.82,0.023214 2.84,0.02593 2.86,0.018976 2.88,0.009498
2.9,0.007962 2.92,0.00898 2.94,0.010766 2.96,0.009204
2.98,0.009404 3,0.008436 3.02,0.009586 3.04,0.015408
3.06,0.019176 3.08,0.023378 3.1,0.025484 3.12,0.028836
3.14,0.031956 3.16,0.034734 3.18,0.037456 3.2,0.032166
3.22,0.026784 3.24,0.025862 3.26,0.018268 3.28,0.007186
3.3,0.003078 3.32,0.003788 3.34,0.010602 3.36,0.021928
3.38,0.022732 3.4,0.017172 3.42,0.014358 3.44,0.012724
3.46,0.011242 3.48,0.007276 3.5,0.008068 3.52,0.01253
3.54,0.018644 3.56,0.017908 3.58,0.01051 3.6,0.004788
3.62,0.001146 3.64,-0.006176 3.66,-0.00528 3.68,0.00057
3.7,-0.0013 3.72,-0.00283 3.74,-0.00168 3.76,-0.004594
3.78,-0.007406 3.8,-0.006264 3.82,-0.000276 3.84,0.001278
3.86,0.000552 3.88,0.002848 3.9,0.007478 3.92,0.009738
3.94,0.00767 3.96,0.007646 3.98,0.009782 4,0.005974
4.02,0.004342 4.04,0.003632 4.06,0.001656 4.08,-0.005448
4.1,-0.008924 4.12,-0.002056 4.14,0.00317 4.16,0.00394
4.18,-0.000968 4.2,-0.006808 4.22,-0.004438 4.24,0.00252
4.26,0.007092 4.28,0.01156 4.3,0.021582 4.32,0.027304
4.34,0.034124 4.36,0.037786 4.38,0.032296 4.4,0.026412
4.42,0.026112 4.44,0.020214 4.46,0.014184 4.48,0.011284
4.5,0.007592 4.52,0.012226 4.54,0.016338 4.56,0.01405
4.58,0.009666 4.6,0.005602 4.62,0.004404 4.64,0.006364
4.66,0.008826 4.68,0.006698 4.70,0.003118 4.72,-0.001562
4.74,-0.007916 4.76,-0.009622 4.78,-0.009272 4.8,-0.013204
4.82,-0.023246 4.84,-0.028766 4.86,-0.023962 4.88,-0.011962
4.9,-0.0064 4.92 -0.00222,4.94 0.000706 4.96,-0.001498
4.98,-0.000356 5,0.002488 5.02,0.005766 5.04,0.005376
5.06,0.005224 5.08,0.000192 5.1,-0.010304 5.12,-0.017846
5.14,-0.018192 5.16,-0.012356 5.18,-0.001888 5.2,0.005088
5.22,0.010518 5.24,0.015566 5.26,0.014136 5.28,0.00989
5.3,0.006718 5.32,0.002344 5.34,0.0014 5.36,-0.000134
5.38,0.005326 5.4,0.011774 5.42,0.016434 5.44,0.018044
5.46,0.014216 5.48,0.009838 5.5,0.004086 5.52,-0.002586
5.54,-0.00966 5.56,-0.013242 5.58,-0.01357 5.6,-0.016092
5.62,-0.014788 5.64,-0.014316 5.66,-0.015306 5.68,-0.016014
5.7,-0.019488 5.72,-0.017018 5.74,-0.01628 5.76,-0.016234
5.78,-0.018818 5.8,-0.018878 5.82,-0.016474 5.84,-0.009206
5.86,-0.00778 5.88,-0.012268 5.9,-0.014262 5.92,-0.013116
5.94,-0.012384 5.96,-0.009318 5.98,-0.010868 6,-0.012874
6.02,-0.012614 6.04,-0.013816 6.06,-0.014432 6.08,-0.01829
6.1,-0.02292 6.12,-0.022036 6.14 -0.01768 6.16,-0.013576
6.18,-0.014144 6.2,-0.01907 6.22,-0.020294 6.24,-0.016156
6.26,-0.012472 6.28,-0.009706 6.3,-0.007794 6.32,-0.003854
6.34,-0.000224 6.36,-0.001072 6.38,-0.006104 6.4,-0.008238
6.42,-0.008008 6.44,-0.004104 6.46,0.001548 6.48,-2.4e-5
- 71 -
6.5,-0.001672 6.52,-0.001354 6.54,0.001178 6.56,0.001804
6.58,-0.000866 6.6,-0.001748 6.62,-0.004326 6.64,-0.007194
6.66,-0.007156 6.68,-0.009538 6.7,-0.010916 6.72,-0.010772
6.74,-0.014872 6.76,-0.014196 6.78,-0.010622 6.8,-0.009136
6.82,-0.00693 6.84,-0.004638 6.86,-0.003892 6.88,-0.006386
6.9,-0.00735 6.92,-0.005114 6.94 -0.003828 6.96,-0.004668
6.98,-0.005004 7,-0.00442 7.02,-0.00054 7.04,0.00766
7.06,0.014432 7.08,0.01684 7.1,0.016928 7.12,0.017296
7.14,0.016032 7.16,0.014434 7.18,0.012738 7.2,0.010326
7.22,0.009452 7.24,0.008408 7.26,0.006472 7.28,0.00346
7.3,0.000642 7.32,0.000138 7.34,-0.001338 7.36,-0.003582
7.38,-0.00271 7.4,-0.003708 7.42,-0.004582 7.44,-0.005626
7.46,-0.007562 7.48,-0.010574 7.5,-0.013392 7.52,-0.013896
7.54,-0.015372 7.56,-0.017616 7.58,-0.018488 7.6,-0.019486
7.62,-0.021522 7.64,-0.02144 7.66,-0.020644 7.68,-0.019754
7.7,-0.020126 7.72,-0.020364 7.74,-0.018258 7.76,-0.013948
7.78,-0.01136 7.8,-0.00931 7.82,-0.00447 7.84,-0.000214
7.86,0.003432 7.88,0.00382 7.9,0.0013 7.92,-0.000934
7.94,-0.001058 7.96,0.003294 7.98,0.004982 8,0.006778
8.02,0.008162 8.04,0.006422 8.06,0.002628 8.08,-0.001368
8.1,-0.004606 8.12,-0.006198 8.14,-0.006048 8.16,-0.005752
8.18,-0.007438 8.2,-0.007496 8.22,-0.008772 8.24,-0.011976
8.26,-0.01509 8.28,-0.01699 8.3,-0.01605 8.32,-0.01618
8.34,-0.016866 8.36,-0.019028 8.38,-0.021034 8.4,-0.023406
8.42,-0.02482 8.44,-0.024204 8.46,-0.02501 8.48,-0.024866
8.5,-0.023976 8.52,-0.021364 8.54 -0.018554 8.56,-0.018144
8.58,-0.019514 8.6,-0.020228 8.62,-0.006104 8.64,-0.005454
8.66,-0.003822 8.68,-0.001306 8.7,0.0018 8.72,0.002622
8.74,-0.000548 8.76,-0.00402 8.78,-0.006474 8.8,-0.006052
8.82,-0.00459 8.84,-0.003356 8.86,-0.001168 8.88,0.000844
8.9,0.001382 8.92,0.001298 8.94,-0.002058 8.96,-0.006362
8.98,-0.00684 9,-0.006196 9.02,-0.005434 9.04,-0.006812
9.06,-0.00778 9.08,-0.007022 9.1,-0.005506 9.12,-0.006518
9.14,-0.00649 9.16,-0.00569 9.18,-0.005412 9.2,-0.004684
9.22,-0.004226 9.24,-0.00466 9.26,-0.002604 9.28,0.000108
9.3,0.002228 9.32,0.002932 9.34,0.002926 9.36,0.004446
9.38,0.00448 9.4,0.002268 9.42,-0.00109 9.44,-0.00163
9.46,-0.00192 9.48,-0.00142 9.5,-0.000604 9.52,-0.000876
9.54,-0.000978 9.56,-0.00018 9.58,-0.001698 9.6,-0.00264
9.62,-0.002722 9.64,-0.003104 9.66,-0.003924 9.68,-0.004786
9.7,-0.006528 9.72,-0.006618 9.74,-0.005572 9.76,-0.004392
9.78,-0.0043 9.8,-0.004494 9.82,-0.004058 9.84,-0.001736
9.86,0.000282 9.88,0.002096 9.9,0.002786 9.92,0.002156
9.94,0.00172 9.96,0.000462 9.98,-0.001424 10,-0.002902
10.02,-0.002792 10.04,-0.000688 10.06,0.000922 10.08,0.00043
10.1,0.000954 10.12,0.000418 10.14,-0.00106 10.16,-0.002352
- 72 -
10.18,-0.002918 10.2,-0.002992 10.22,-0.0043 10.24,-0.006772
10.26,-0.009258 10.28,-0.008124 10.3,-0.006256 10.32,-0.005948
10.34,-0.005692 10.36,-0.00369 10.38 0.000138,10.4 0.003658
10.42,0.005274 10.44,0.005026 10.46,0.004626 10.48,0.005188
10.5,0.005032 10.52,0.00478 10.54,0.003504 10.56,0.002828
10.58,0.002494 10.6,0.000816 10.62,-0.000424 10.64,-0.00082
10.66,-0.000804 10.68,-0.00179 10.7,-0.003428 10.72,-0.003558
10.74,-0.00261 10.76,-0.001504 10.78,-0.00079 10.8,-0.00108
10.82,-0.001204 10.84,-0.001516 10.86,-0.001882 10.88,-0.002162
10.9,-0.002672 10.92,-0.002376 10.94,-0.001378 10.96,3.0e-05
10.98,0.00138 11,0.00108 11.02,0.000362 11.04,-7.0e-5 11.06,-0.000248
11.08,0.00052 11.1,0.000976 11.12,0.001514 11.14,0.00063
11.08,0.00052 11.1,0.000976 11.12,0.001514 11.14,0.00063
11.16,-0.001188 11.18,-0.002364 11.2,-0.003346 11.22,-0.003448
11.24,-0.00341 11.26,-0.002524 11.28,-0.001794 11.3,-0.002048
11.32,-0.001584 11.34,7.2e-5 11.36,0.000472 11.38,-1.0e-05
11.4,-0.000116 11.42,-0.000232 11.44,-0.000172 11.46,0.000338
11.48,-0.000126 11.5,0.00026 11.52,0.001662 11.54,0.00324
11.56,0.00401 11.58,0.00402 11.6,0.00378 11.62,0.003254
11.64,0.002132 11.66,0.000494 11.68,-0.000584 11.7,-0.000688
11.72,0.000254 11.74,0.000428 11.76,0.000394 11.78,-0.000182
11.8,-0.00059 11.82,-0.000524 11.84,-0.000868 11.86,-0.00062
11.88,-0.00091 11.9,-0.001496 11.92,-0.001888 11.94,-0.002054
11.96,-0.002776 11.98,-0.00317 12,-0.003722 12.02,-0.003964
12.04,-0.003436 12.06,-0.002998 12.08,-0.002416 12.1,-0.001756
12.12,-0.001016 12.14,-0.000988 12.16,-0.000594 12.18,9.4e-5
12.2,0.000552 12.22,-8e-6 12.24,-0.000766 12.26,-0.000638
12.28,0.000358 12.3,0.00092 12.32,0.000526 12.34,7.6e-5
12.36,0.000164 12.38,0.000272 12.4,0.000356 12.42,0.00042
12.44,0.000594 12.46,0.00015 12.48,-0.000872 12.5,-0.0014
12.52,-0.001402 12.54,-0.001292 12.56 -0.001636 12.58,-0.001278
12.6,-0.001572 12.62,-0.002466 12.64,-0.003426 12.66,-0.00428
12.68,-0.00426 12.7,-0.003722 12.72,-0.003014 12.74,-0.002766
12.76,-0.002884 12.78,-0.002722 12.8,-0.00312 12.82,-0.003716
12.84,-0.003696 12.86,-0.003496 12.88,-0.002616 12.9,-0.00183
12.92,-0.001596 12.94,-0.001366 12.96,-0.001534 12.98,-0.002052
13,-0.001898 13.02,-0.001872 13.04,-0.002114 13.06,-0.00214
13.08,-0.002074 13.1,-0.001672 13.12,-0.00181 13.14,-0.002634
13.16,-0.003216 13.18,-0.003076 13.2,-0.003452 13.22,-0.004162
13.24,-0.004268 13.26,-0.004296 13.28,-0.004972 13.3,-0.005238
13.32,-0.00515 13.34,-0.0047 13.36,-0.004044 13.38,-0.00333
13.4,-0.002724 13.42,-0.002752 13.44,-0.003506 13.46,-0.002654
13.48,-0.003072 13.5,-0.003118 13.52,-0.002774 13.54,-0.002442
13.56,-0.002 13.58,-0.001794 13.6,-0.002164 13.62,-0.002112
13.64,-0.001744 13.66,-0.001368 13.68,-0.00155 13.7,-0.00163
13.72,-0.001284 13.74,-0.00101 13.76,-0.001052 13.78,-0.001446
- 73 -
13.8,-0.001296 13.82,-0.000832 13.84,-0.000348 13.86,-0.000168
13.88,-5.2e-5 13.9,-1e-5 13.92,-6.0e-5 13.94,-0.000248 13.96,-0.000836
13.98,-0.001004 14,-0.001316 14.02,-0.00097 14.04,-0.00108 14.06,-0.002032
14.08,-0.0028 14.1,-0.002834 14.12,-0.002624 14.14,-0.002416
14.16,-0.002222 14.18,-0.00226 14.2,-0.002074 14.22,-0.002018
14.24,-0.001888 14.26,-0.001816 14.28,-0.00174 14.3,-0.001272
14.32,-0.000504 14.34,0.000176 14.36,0.000144 14.38,-0.000168
14.4,-0.00056 14.42,-0.001096 14.44,-0.00132 14.46,-0.001298
14.48,-0.000934 14.5,-0.000472 14.52,-0.000344 14.54,-0.000402
14.56,-0.000284 14.58,-0.000106 14.6,-0.000118 14.62,-0.000476
14.64,-0.000592 14.66 -0.000298 14.68,-4e-6 14.7,0.00024
14.72,0.00031 14.74,-5.2e-5 14.76,-0.000678 14.78,-0.00077
14.8,-0.000676 14.82,-0.00052 14.84,-0.000678 14.86,-0.000668
14.88,2.6e-5 14.9,0.000702 14.92,0.000826 14.94,0.000752
14.96,0.000746 14.98,0.00053 15,0.000162 15.02,-0.000148
15.04,-0.000584 15.06,-0.000794 15.08,-0.000388 15.1,0.000268
15.12,0.000528 15.14,0.000634 15.16,0.000494 15.18,0.000118
15.2,-0.000616 15.22,-0.001016 15.24,-0.000594 15.26,-0.000374
15.28,1.2e-5 15.3,0.000158 15.32,-0.00032 15.34,-0.000918
15.36,-0.001188 15.38,-0.001006 15.4,-0.000834 15.42,-0.000658
15.44,-0.000324 15.46,-0.000434 15.48,-0.000734 15.5,-0.00105
15.52,-0.001392 15.54,-0.001472 15.56,-0.00138 15.58,-0.001212
15.6,-0.001192 15.62,-0.001134 15.64,-0.000892 15.66,-0.000676
15.68,-0.000656 15.7,-0.00052 15.72,-0.000108 15.74,6.6e-5
15.76,-0.00014 15.78,-0.00058 15.8,-0.001026 15.82,-0.00114
15.84,-0.000652 15.86,-0.000326 15.88,-3.6e-5 15.9,0.00033
15.92,0.000564 15.94,0.000658 15.96,0.000516 15.98,0.00015
16,-0.000122 16.02,-6.0e-5 16.04,-8.8e-5 16.06,-4.4e-5
16.08,-6.6e-5 16.1,-0.000258 16.12,-0.000664 16.14,-0.000948
16.16,-0.000934 16.18,-0.000944 16.2,-0.001054 16.22,-0.000968
16.24,-0.000906 16.26,-0.000984 16.28,-0.001 16.3,-0.00093
16.32,-0.000796 16.34,-0.00065 16.36,-0.000658 16.38,-0.000808
16.4,-0.000788 16.42,-0.000682 16.44,-0.00058 16.46,-0.000186
16.48,5.4e-5 16.5,8e-6 16.52,0.000148 16.54,0.000278
16.56,0.000264 16.58,0.000196 16.6,5.8e-5 16.62,-0.00014
16.64,-0.000206 16.66 -7.4e-5 16.68,0.000108 16.7,-2.2e-5
16.72,5.8e-5 16.74,8.2e-5 16.76,2.6e-5 16.78,-3.8e-05
16.8,-0.000122 16.82,1.2e-5 16.84,4e-6 16.86,-0.000128
16.88,3.6e-5 16.9,0.000232 16.92,0.000314 16.94,0.000348
16.96,0.00047 16.98,0.000542 17,0.000716 17.02,0.000728
17.04,0.000728 17.06,0.00078 17.08,0.000764 17.1,0.000716
17.12,0.00062 17.14,0.000462 17.16,0.00034 17.18,0.000158
17.2,-2.8e-5 17.22,2.4e-5 17.24,5.8e-5 17.26,5.2e-5
17.28,-7e-5 17.3,-0.00043 17.32,-0.000474 17.34,-0.000352
17.36,-0.00021 17.38,2.4e-5 17.4,8.4e-5 17.42,4e-5
17.44,-0.000128 17.46,-0.000476 17.48,-0.000626 17.5,-0.000634
- 74 -
17.52,-0.000616 17.54,-0.000508 17.56,-0.00063 17.58,-0.00052
17.6,-0.000496 17.62,-0.000484 17.64,-0.000532 17.66,-0.000432
17.68,-0.000328 17.7,-0.000266 17.72,-0.00016 17.74,-0.000204
17.76,-0.00026 17.78,-0.00049 17.8,-0.000854 17.82,-0.00114
17.84,-0.001136 17.86,-0.001038 17.88,-0.001166 17.9,-0.001256
17.92,-0.001108 17.94,-0.000928 17.96,-0.000798
17.98,-0.000856 18,-0.001008 18.02,-0.001182 18.04,-0.001288
18.06,-0.00135 18.08,-0.001336 18.1,-0.001284 18.12,-0.00117
18.14,-0.000904 18.16,-0.000634 18.18,-0.000528 18.2,-0.000508
18.22,-0.000506 18.24,-0.000512 18.26,-0.000568 18.28,-0.00067
18.3,-0.000762 18.32 -0.00082 18.34,-0.0008 18.36,-0.000746
18.38,-0.000754 18.4,-0.00078 18.42,-0.000692 18.44,-0.00072
18.46,-0.000762 18.48,-0.0007 18.5,-0.000612 18.52,-0.000574
18.54,-0.000582 18.56,-0.00069 18.58,-0.00079 18.6,-0.000986
18.62,-0.001136 18.64,-0.001124 18.66,-0.001062 18.68,-0.000944
18.7,-0.00085 18.72,-0.00084 18.74,-0.000918 18.76,-0.00094
18.78,-0.000964 18.8,-0.000994 18.82,-0.001036 18.84,-0.00105
18.86,-0.001018 18.88,-0.001062 18.9,-0.001276 18.92,-0.00137
18.94,-0.001298 18.96,-0.001128 18.98,-0.001054 19,-0.001058
19.02,-0.001002 19.04,-0.000976 19.06,-0.000908 19.08,-0.000854
19.1,-0.000818 19.12,-0.00081 19.14,-0.00085 19.16,-0.000926
19.18,-0.000834 19.2,-0.000906 19.22,-0.000954 19.24,-0.000872
19.26,-0.000742 19.28,-0.00072 19.3,-0.000758 19.32,-0.000706
19.34,-0.0007 19.36,-0.000722 19.38,-0.000684 19.4,-0.000692
19.42,-0.000822 19.44,-0.001172 19.46,-0.001258 19.48,-0.001262
19.5,-0.001194 19.52,-0.00108 19.54,-0.00094 19.56,-0.00085
19.58,-0.000866 19.6 -0.000906 19.62,-0.000916 19.64,-0.00098
19.66,-0.001024 19.68,-0.001092 19.7,-0.001106 19.72,-0.001168
19.74,-0.001214 19.76,-0.001152 19.78,-0.001132 19.8,-0.001136
19.82,-0.001104 19.84,-0.001082 19.86,-0.001058 19.88,-0.001058
19.9,-0.00113 19.92,-0.00126 19.94,-0.001348 19.96,-0.001406
19.98,-0.001438 20,-0.001474 20.02,-0.001534 20.04,-0.00155
20.06,-0.001568 20.08,-0.001514 20.1,-0.00144 20.12,-0.00151
20.14,-0.001616 20.16,-0.001736 20.18,-0.001824 20.2,-0.001894
- 75 -

Program of meeting
1. Registration and Wuhan city tour October 23, 2005
08:00 – 20:00 The Secretariat will have a reception desk at the Wuhan air port on 23 October in charge of sending the participants to the hotel.
12:00 - Lunch, First floor, Mingzhuyuan Hotel 15:00 - City tour, Yellow Crane Tower(Bus from Mingzhuyuan Hotel) 18:00-21:00 Dinner on the excursion ship, with sightseeing along the Yangzhi River (One
bus from Yellow Crane Tower, Bus from Hongyi Hotel)
2. Workshop Conference hall 4, second floor, Mingzhuyuan hotel
Coffee break in the ballroom, second floor, Mingzhuyuan hotel
October 24, 2005 Morning 07:00 - Breakfast, second floor, Hongyi Hotel 08:30-09:30 Welcome speech by the president of Wuhan University
Address by the Director of the State Key Laboratory of Water Resources and Hydropower Engineering Sciences Address by the Scientific Committee Address by the Organization Committee
09:30-12:00 Theme A - Evaluation of alkali-aggregate reaction effects on the behavior of an Italian hollow gravity dam
09.30-10:30 Keynote lecture: Assessment of ASR damages in concrete dams by overall and local in situ tests and inverse analysis, by Prof. G. Maier
10:30-11:00 Presentation of Poglia dam case history and of the exercise proposed for the workshop, by Dr. G. Mazzà.
11:00-11:20 Presentation of the report prepared by CESI in which it is shown a comparison of results obtained with CANT and ABAQUS computer codes, by Dr. M. Meghella
11:20-11:30 Short synthesis of contributions received for Theme A and conclusive comments, by Dr. G. Mazzà
11:30-12:00 Discussion
12:00 - Lunch, Ballroom, Second floor, Mingzhuyuan Hotel
- 76 -

13:00- Visit the Laboratories (State Key Laboratory of Water Resources and Hydropower Engineering Sciences)
Afternoon
14:30-17:30 Theme B -Temperature field simulation and crack analysis of a RCC arch dam
14:30-15:00 Keynote lecture: about the development of RCC arch dams, by Dr. A. Carrere
15:00-15:30 Presentation of Puding dam case history and of the exercise proposed for the workshop , by Prof. S.H.Chen.
15:30-16:00 3D Thermal analysis of a RCC arch dam, by Dr. C.J. Peng 16:00-16:30 Practice of the RCC arch dam design in Guiyang Hydroelectric Power
Investigation, Design and Research Institute, China, By Mr. J.X.Yang 16:30-17:00 Short synthesis of contributions received for Theme B and conclusive
comments, by Dr. C.J. Peng.
17:00-17:30 Discussion
18:00 - Dinner(Luojia Hotel), Bus from Hongyi Hotel
October 25, 2005 Morning 07:00 - Breakfast, second floor, Hongyi Hotel 08:30-11:30 Theme C -Evaluation of the behavior and safety (static and dynamic) of a
rock fill dam 08:30-09:00 Keynote lecture: Numerical modelling of earth dams, by Prof. I. Shahrour 09:00-09:30 Presentation of the Theme C, by Dr. Ignacio Escuder Bueno.
09:30-10:30 Presentation of the papers
10:30-11:00 Short synthesis of contributions received for Theme C and conclusive comments, by Dr. Ignacio Escuder Bueno
11:00-11:30 Discussion
12:00 - Lunch, Ballroom, Second floor, Mingzhuyuan Hotel 13:00- Visit the Laboratories(State Key Laboratory of Water Resources and
Hydropower Engineering Sciences) Afternoon 14:30-17:30 Round table discussion 18:00 - Dinner(Hujing Restaurant), Bus from Hongyi Hotel
- 77 -

3. Technical Tour
October 26, 2005 07:00 - Breakfast, First floor, Hongyi Hotel 08:00 - Start for the Shuibuya project (highest CFRD in the world)
October 27, 2005 08:30 - Visit the Shuibuya project 12:30 - Start for the Yichang
October 28, 2005 8:00 - Visit the Three Gorges Project(the largest hydropower plant in the world) 14:30- Start of the tour to the three gorges
October 29~30, 2005 Tour to the three gorges Back to Wuhan University at 18:00, October 30, 2005
- 78 -