EICV3 DISTRICT PROFILE...
92
EICV3 DISTRICT PROFILE Gicumbi GOVERNMENT OF RWANDA REPUBLIC OF RWANDA NATIONAL INSTITUTE OF STATISTICS OF RWANDA
Transcript of EICV3 DISTRICT PROFILE...

EICV3 DISTRICT PROFILE Gicumbi
GOVERNMENT OF RWANDA
REPUBLIC OF RWANDA
NATIONAL INSTITUTE OF STATISTICS OF RWANDA


EICV3 DISTRICT PROFILE - Gicumbi i
Foreword
The 2010/11 Integrated Household Living Conditions Survey (EICV3) is the third in the series of surveys which started in 2000/01 and is designed to monitor poverty and living conditions. The survey fieldwork commenced in November 2010 and continued for one full year. In 2010/11, for the first time the achieved sample size of 14,308 households in the EICV3 was sufficient to provide estimates which are reliable at the level of the district.
To date, twelve publications have been issued by the National Institute of Statistics Rwanda (NISR) using EICV3 data:
• A report with an overview of main indicators;
• A poverty profile;
• A series of ten thematic reports, each exploring in depth a theme from the Economic Development and Poverty Reduction Strategy (EDPRS). The ten reports in this series are:
(i) Economic Activity; (ii) Utilities and Amenities (water/sanitation/energy/housing/-transport/ Information and Communication Technology (ICT)); (iii) Social Protection; (iv) Environment and Natural Resources; (v) Consumption; (vi) Gender; (vii) Youth; (viii) Education, (ix) Agriculture; and (x) Income.
This district profile is one of 30 further documents issued by the NISR. Based on EICV3 data, each district profile discusses the living conditions in one of the 30 districts of Rwanda.
Yusuf MURANGWADirector General
EICV3 DISTRICT PROFILE - Gicumbiii
Acknowledgements
This report has been prepared with participation of a large number of individuals and organizations. We would like to express our gratitude to all of them.
We would like to express our sincere appreciation to the partner Ministries, Institutions, agencies and development partners for their respective great support and inputs throughout the process of writing and publishing this report.
We also express our profound gratitude to the team of Oxford Policy Management (OPM), and in particular to Mary Strode and her colleagues. Their technical assistance contributed to the success of this report.
We also thank the technical staff from National Institute of Statistics of Rwanda (NISR) for their unfailing participation in all activities of the survey data analysis, which was coordinated by HABIMANA Dominique and his assistants, APPEL Derek and KARANGWA John.
We appreciate the valuable support provided by administrative and financial departments of the NISR. Their interventions allowed this survey data analysis to be carried out smoothly and under good conditions.

EICV3 DISTRICT PROFILE - Gicumbi iii
Table of contents
Foreward i
Acknowledgements ii
List of tables and figures v
Abbreviations viii
1 Introduction 1
2 Demographics 3
3 Poverty 5
4 Standard of living (utilities and amenities) 7
4.1 Water and sanitation 7
4.2 Housing and energy 11
4.3 Ownership of selected durables 14
4.4 Distance to facilities/services 16
4.5 Use of financial services 18
5 Economic activity and income sources 19
5.1 Economic activity 19
5.2 Income sources 22
6 Agriculture 23
6.1 Land 23
6.2 Farming practices 26
6.3 Commercialisation of crop production 29
6.4 Livestock 30
7 Education 31
7.1 Schooling and literacy 31
7.2 Primary and secondary education 33
7.3 ICT education 35
8 Vulnerable groups 36
8.1 People with disabilities 36
8.2 Orphans 36
9 Some gender Aspects 38
10 Conclusions for Gicumbi 39
References 40

EICV3 DISTRICT PROFILE - Gicumbiiv
Annex A District tables for all indicators presented in this report 41
A.1 Demographics 41
A.2 Poverty 45
A.3 Standard of living (utilities and amenities) 46
A.4 Economic activity and income 56
A.5 Agriculture 62
A.6 Education 68
A.7 Vulnerable groups and gender issues 74

EICV3 DISTRICT PROFILE - Gicumbi v
List of tables and figures
Figure 1.1 Northern Province 2
Figure 2.1 Distribution of population in Gicumbi by age groups and sex (000s) 3
Figure 2.2 Number of females per 100 males, by district 3
Figure 2.3 Mean household size, by district 4
Figure 3.1 Percentage of population identified as poor and extremely poor, by district 5
Figure 3.2 Map: Percentage of population identified as poor, by district 6
Figure 4.1 Main source of drinking water (percentage of households) in Gicumbi 7
Figure 4.2 Map: Percentage of households using improved drinking
water source, by district 8
Figure 4.3 Percentage of households within 15 minutes’ walking
distance to improved water source, by district 9
Figure 4.4 Map: Percentage of households using improved sanitation, by district 10
Figure 4.5 Percentage of households with cement floor, by district 12
Figure 4.6 Percentage of households with mud-covered tree trunks
as wall material, by district 13
Figure 4.7 Map: Percentage of households with electricity as main
source of lighting, by district 14
Figure 4.8 Percentage of households owning mobile phone, by district 15
Figure 4.9 Percentage of households owning radio set, by district 15
Figure 4.10 Map: Mean walking distance to basic services (in minutes):
Primary school, by district 16
Figure 4.11 Map: Mean walking distance to basic services (in minutes):
Health centre, by district 17
Figure 4.12 Percentage of households with at least one savings account, by district 18
Figure 5.1 Economic activity: Employment, unemployment, and economic
inactivity among persons aged 16 and above (usual), by district 19
Figure 5.2 Employment types (usual main job) in Gicumbi 20
Figure 5.3 Industry of usual main jobs in Gicumbi 20
Figure 5.4 Underemployment (percentage of working people that worked
35 hours or fewer in all their jobs in the previous seven days), by district 21
Figure 5.5 Median number of hours spent in last seven days on domestic
duties by men and women, by district 21
Figure 5.6 Household income shares in Gicumbi 22

EICV3 DISTRICT PROFILE - Gicumbivi
Figure 6.1 Map: Mean size of land cultivated per household (ha), by district 24
Figure 6.2 Percentage of cultivating households with under 0.3 ha land, by district 25
Figure 6.3 Map: Percentage of households that have been exposed to
LTR programme, by district 26
Figure 6.4 Map: Percentage of land protected against soil erosion, by district 27
Figure 6.5 Percentage of agricultural households incurring expenditure
on chemical fertiliser, by district 28
Figure 6.6 Mean share of harvest sold, by district 29
Figure 6.7 Percentage of households raising livestock over the
last 12 months, by district 30
Figure 7.1 Percentage of individuals aged six and above that have ever
attended school, by district 31
Figure 7.2 Literacy rate (%) among population aged 15 and above, by district 32
Figure 7.3 Map: NARs in primary school, by district 33
Figure 7.4 Map: NARs in secondary school, by district 34
Figure 7.5 Percentage of users satisfied with education services, by district 34
Figure 7.6 Computer literacy: Percentage of population aged six and
above that have used a computer before and would feel
confident about using one again, by district 35
Figure 8.1 Percentage of persons with major disability, by district 36
Figure 8.2 Percentage of orphans (one parent or both parents) among
population aged 0–20, by district 37
Figure 9.1 Sex of heads of household in Gicumbi 38
Figure 9.2 Employment type by sex in Gicumbi 38
Table A.1 Distribution of population by age groups and sex (000s) 41
Table A.2 Number of females per 100 males 43
Table A.3 Mean household size 44
Table A.4 Percentage of population identified as poor or extremely poor 45
Table A.5 Main source of drinking water 46
Table A.6 Walking distance to improved water source (in minutes) 47
Table A.7 Sanitation 48
Table A.8 Main flooring material of the dwelling 49
Table A.9 Main wall material of the dwelling 50
Table A.10 Main source of lighting 51

EICV3 DISTRICT PROFILE - Gicumbi vii
Table A.11 Percentage of households owning various devices 52
Table A.12 Mean walking distance to basic services (in minutes): Primary school 53
Table A.13 Mean walking distance to basic services (in minutes): Health centre 54
Table A.14 Percentage of households with at least one savings account 55
Table A.15 Economic activity: Employment, unemployment, and
economic inactivity among persons aged 16 and above (12-month period) 56
Table A.16 Employment type (usual main job) 57
Table A.17 Industry of usual main job 58
Table A.18 Hours worked in all jobs in the previous seven days 59
Table A.19 Median number of hours spent on all domestic duties in
last seven days, by all persons aged 16 and above
(including working and non-working persons) 60
Table A.20 Income shares 61
Table A.21 Size of land cultivated per household (in ha) 62
Table A.22 Percentage of households that have been exposed to LTR programme 63
Table A.23 Percentage of land irrigated and protected against soil erosion 64
Table A.24 Percentage of agricultural households incurring expenditure on fertiliser 65
Table A.25 Mean share of harvest sold 66
Table A.26 Percentage of households raising livestock over the last 12 months 67
Table A.27 Percentage of individuals aged six and above that have ever attended school 68
Table A.28 Literacy rate (%) among population aged 15 and above 69
Table A.29 NARs in primary school 70
Table A.30 NARs in secondary school 71
Table A.31 Percentage of users satisfied with education services 72
Table A.32 Use of computers among population aged six and above 73
Table A.33 Percentage of persons with major disability 74
Table A.34 Percentage of orphans (one parent or both parents)
among population aged 0–20 75
Table A.35 Sex of heads of household 76
Table A.36 Employment type by sex (usual main job) 77
Table A.37 Youth population (000s) 78

EICV3 DISTRICT PROFILE - Gicumbiviii
Abbreviations
EDPRS Economic Development and Poverty Reduction Strategy
EICV Enquête Intégrale sur les Conditions de Vie des Ménages (Integrated Household Living Conditions Survey)
HH Household
ICT Information Communication Technology
ILO International Labour Organisation
LTR Land Tenure Regularisation
MINALOC Ministry of Local Government
NAR Net Attendance Rate
NISR National Institute of Statistics Rwanda
OPM Oxford Policy Management
RWF Rwandan Franc
WHO World Health Organisation
EICV3 DISTRICT PROFILE - Gicumbi 1
1 Introduction
On 7 February 2012, the President of Rwanda officially launched the design phase of the EDPRS2. A key input into the development of the EDPRS2 is the evidence collected through the third Integrated Household Living Conditions Survey (EICV3), fieldwork for which was carried out by the NISR between October 2010 and November 2011. In 2010–11, for the first time the achieved sample size of 14,308 households in the EICV was sufficient to provide estimates which are reliable at the level of the district. This district profile presents the key findings from EICV3 for the district of Gicumbi in the Northern Province.1
This profile contains key baseline indicators for the district which are structured into eight sections as follows:
1. Demographic characteristics;
2. Poverty indicators;
3. Standards of living, which includes water and sanitation, housing and energy, ownership of selected durables, distance to facilities/services, and use of financial services;
4. Economic activities and income sources;
5. Agriculture, which includes land, farming practices, commercialisation of crop production, and livestock;
6. Education indicators covering schooling and literacy, primary and secondary education, and ICT education;
7. Vulnerable groups, including persons with major disabilities and orphans; and
8. Gender issues, including female heads of household and employment type by sex.
1 District tables underlying all figures in this report are presented in the Annex.

EICV3 DISTRICT PROFILE - Gicumbi2
1.1 Northern Province

EICV3 DISTRICT PROFILE - Gicumbi 3
2 Demographics
The EICV3 survey results show that the total population of Gicumbi district in 2010–2011 was 572,000. This represents 29% of the total population of Northern Province and 5.3% of the total population of Rwanda. Females comprised 52.1% of the population of Gicumbi district. Figure 2.1 below clearly shows that the majority is young with 81% of the population aged under 40 years old.
Figure 2.1 Distribution of population in Gicumbi by age groups and sex (000s)
Source: EICV3.
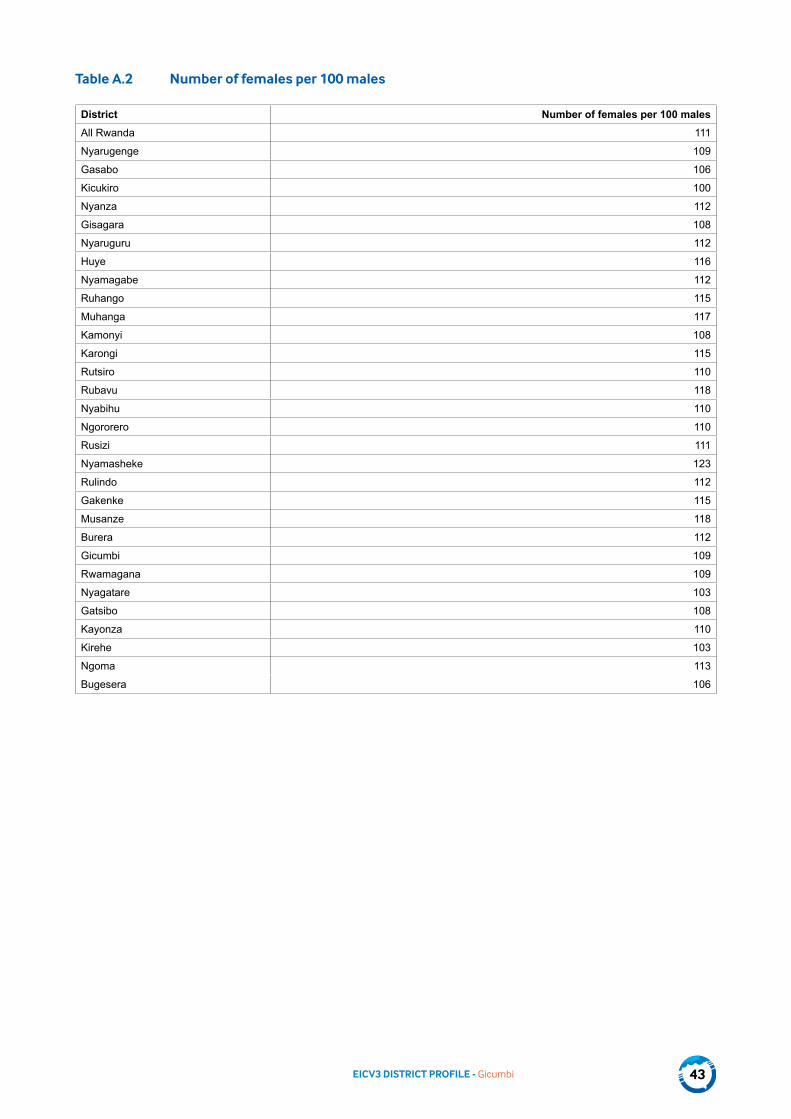
Figure 2.2 shows that Gicumbi district has 109 females per 100 males, which is slightly below the national average of 111 females per 100 males.
Figure 2.2 Number of females per 100 males, by district
Source: EICV3. Note: Horizontal line represents national average.
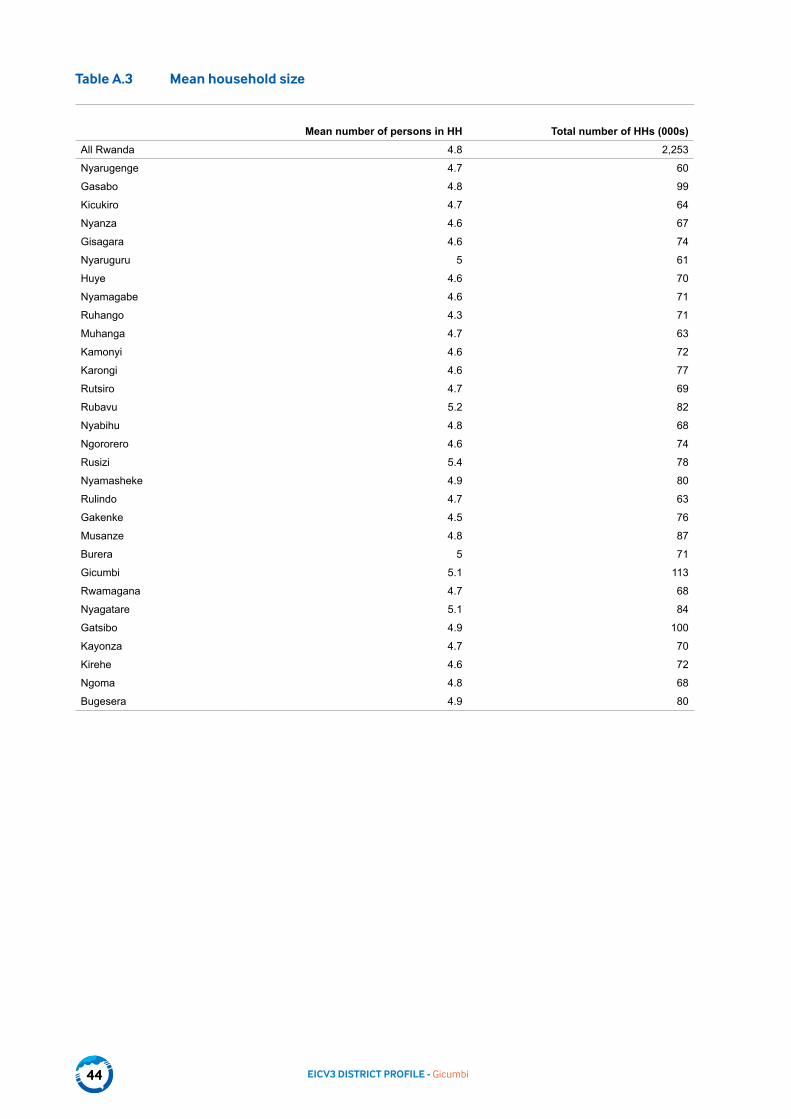
As shown in Figure 2.3, the average household size is 5.1 for Gicumbi district, which is above the national average of 4.8. On this indicator, Gicumbi ranks third after Rusizi and Rubavu among all districts and highest among all districts in the Northern Province. The figures for the other districts in the province are 4.5 for Gakenke, 4.7 for Rulindo, 4.8 for Musanze, 5 for Burera and 4.7 for Rulindo. Given that Gicumbi is a rural district, this high mean household size is to be expected.

EICV3 DISTRICT PROFILE - Gicumbi4
Figure 2.3 Mean household size, by district
Source: EICV3. Note: Horizontal line represents national average.

EICV3 DISTRICT PROFILE - Gicumbi 5
3 Poverty
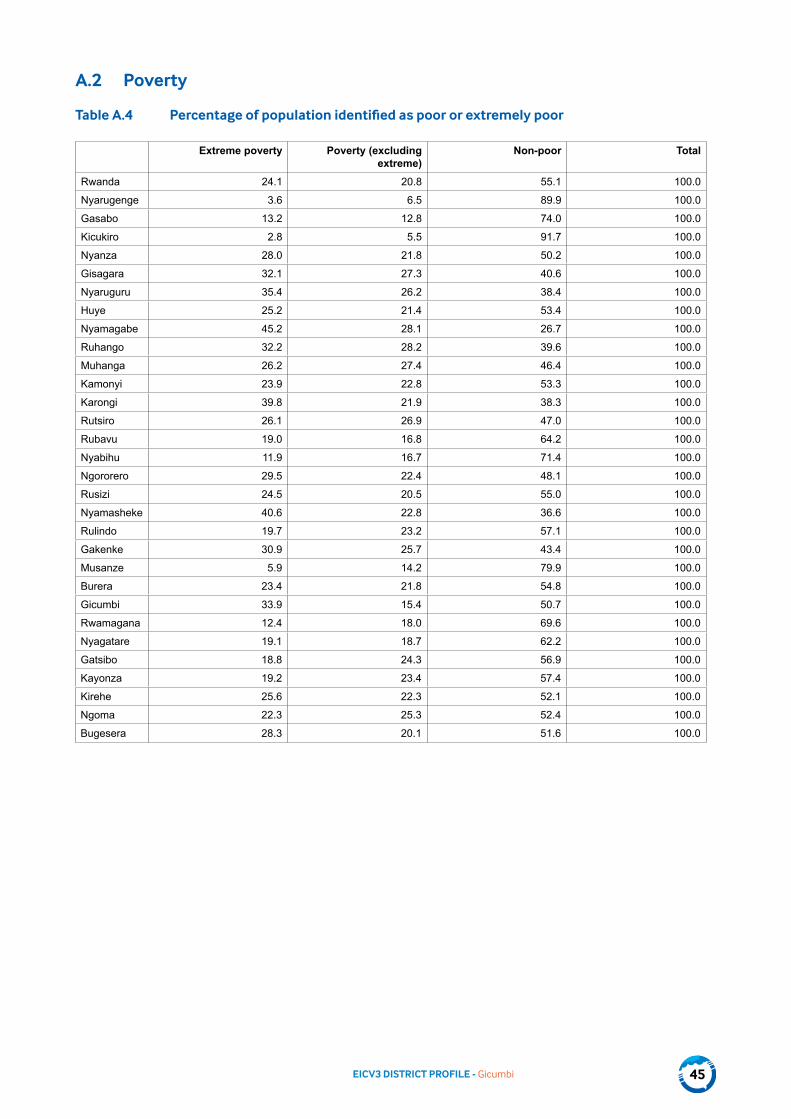
The poverty line defines a level of household consumption per adult below which a household is deemed to be poor. The poverty line used here is set with reference to a minimum food consumption basket, which was judged to offer the required number of calories required for a Rwandan who was likely to be involved in physically demanding work, along with an allowance for non-food consumption. An extreme poverty line was also set as the cost of buying the food consumption basket if nothing was spent on non-food at all; this line corresponds to RWF 83,000 and the poverty line is RWF 118,000.
Figure 3.1 presents the percentage of the population classified into extremely poor, poor and non-poor. In Gicumbi district, 50.7% of the population is identified as non-poor, 15.4% as poor and 33.9% as extremely poor. While compared with other districts of Northern Province, Gicumbi district has the highest percentage of extreme poor.
Figure 3.1 Percentage of population identified as poor and extremely poor, by district
Source: EICV3. Note: Horizontal lines represent national averages of poverty and extreme poverty. Districts sorted by overall poverty level.

EICV3 DISTRICT PROFILE - Gicumbi6
As shown in Figure 3.2 below, Gicumbi district is among the districts with the proportion of the population identified as poor in the range of 40 to 55%. Only Nyarugenge, Kicukiro and Musanze have below 25% of their populations classified as poor.
Figure 3.2 Map: Percentage of population identified as poor, by district

EICV3 DISTRICT PROFILE - Gicumbi 7
4 Standard of living (utilities and amenities)
This section focuses on water and sanitation, energy and housing, ownership of selected durables, distance to facilities/services, and use of financial services. The Vision 2020, Rwanda’s vision of its future development, identified the utilities and amenities discussed in this section as all being crucial requirements for Rwanda’s social and economic development.
4.1 Water and sanitation
According to EICV3, 89.4% of Gicumbi district households use an improved drinking water source. This places Gicumbi district first in Northern Province and fourth nationally after Nyarugenge, Rubavu and Huye. Improved drinking water sources include protected springs, public standpipes, water piped into dwelling/yard, boreholes, protected wells and rainwater collection, as defined by the World Health Organisation (WHO). Figure 4.1 shows that 26% of households in Gicumbi district use a public standpipe or water piped into a dwelling/yard; however, 10.6% of households still use an unimproved drinking water.
This Gicumbi district achievement is above the EDPRS national target for the water and sanitation sector, which is to increase access to drinking water to 85% by 2012.
Figure 4.1 Main source of drinking water (percentage of households) in Gicumbi
Source: EICV3. Improved sources presented in blue, unimproved in red.

EICV3 DISTRICT PROFILE - Gicumbi8
As shown in Figure 4.2, Gicumbi district is among nine districts with between 80% and 94% of households using an improved drinking water source. These districts can be ranked as follows: Nyarugenge (94%), Rubavu (93.4%), Huye (91%), Gicumbi (89.4%), Gicumbi (84.7), Muhanga (84.4%), Nyanza (82.1%), Gisagara (82.1%) and Rwamagana (82%).
Figure 4.2 Map: Percentage of households using improved drinking water source, by district

EICV3 DISTRICT PROFILE - Gicumbi 9
Figure 4.3 shows that 39.5% of households in Gicumbi district are within 15 minutes’ walking distance of an improved water source. Gicumbi district comes below the national average of 44.8%. On the other hand, 28% of households in Gicumbi district still walk more 30 minutes to reach an improved water source and this is the highest percentage nationally.
The mean time to an improved water source in Gicumbi district is 20 minutes, which is higher than the national average (14.4 minutes). Gicumbi ranks second highest after Gisagara district (22.7 minutes).
Figure 4.3 Percentage of households within 15 minutes’ walking distance to improved water source, by district
Source: EICV3. Note: Horizontal line represents national average.

EICV3 DISTRICT PROFILE - Gicumbi10
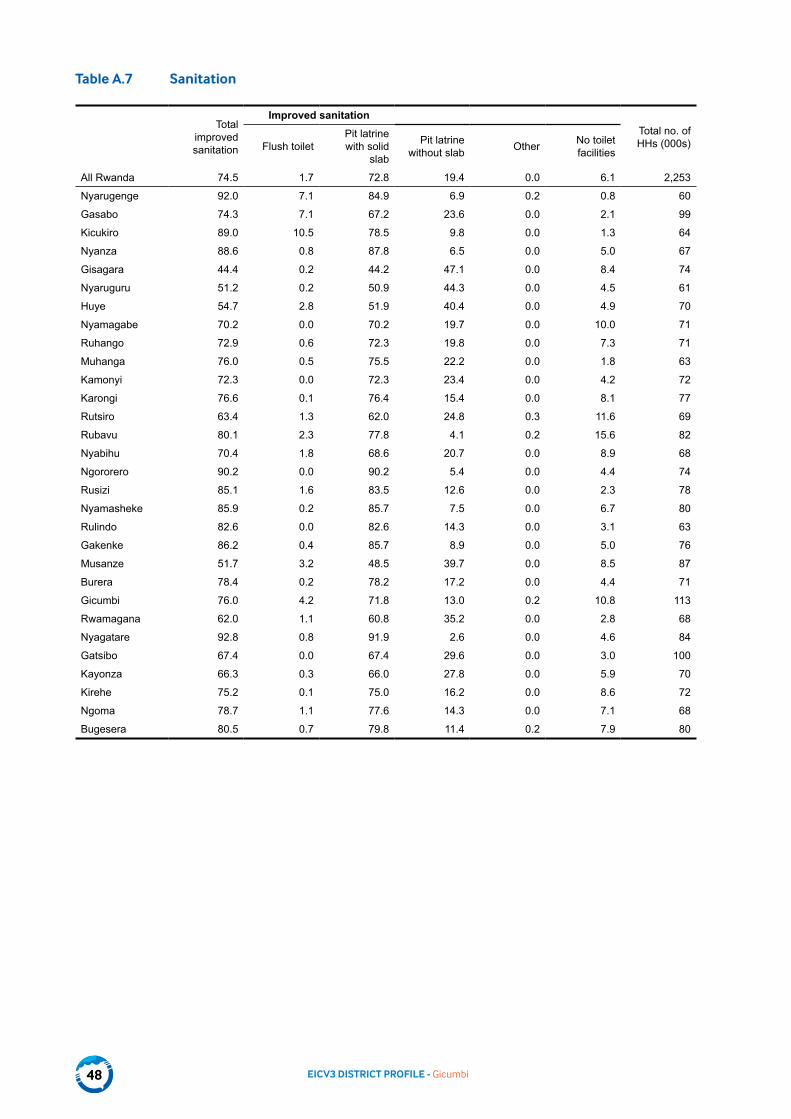
The WHO/UNICEF Joint Monitoring Programme defines an ‘improved sanitation facility’ as flush toilets and pit latrines with a floor slab.2
Figure 4.4 presents the percentage of households with improved sanitation facilities by district. It shows that Gicumbi district has 76% of households with access to improved sanitation facilities, which is above the national average (74.4%). The EDPRS target on sanitation is to have 65% of the total population with hygienic sanitation by 2012. It is clear that Gicumbi district has achieved and even surpassed this target by more than 11 percentage points.
Figure 4.4 Map: Percentage of households using improved sanitation, by district
2 http://www.wssinfo.org/definitions-methods/watsan-categories/

EICV3 DISTRICT PROFILE - Gicumbi 11
4.2 Housing and energy
This section describes the housing and energy characteristics of the household. The habitat sub-sector has the main objective of contributing to sustainable economic growth and the wellbeing of the Rwandan population by improving habitat and urbanism infrastructure. The sub-sector engages in a programme to modernise cities in Rwanda, especially in the habitat areas, with interventions to curb the proliferation of unplanned housing and to improve living standards in irregular neighbourhoods.3
The guiding documents of the sub-sector are the Vision 2020 and the EDPRS. As summarised in the sub-sector’s EDPRS Self-Assessment Report (2008–2011), the objectives of the Vision 2020 with regard to human settlement are summarised as follows:
• Having urbanisation master plans and particular development plans for towns;
• Using urban land according to adopted plans; and
• Developing basic infrastructure in urban areas and other rural development zones.
The objectives of the EDPRS with regard to human settlement and management of public property are worded as follows:
• Planning and development of improved human facilities in both rural and urban areas;
• Sustainable and rational use of land and environmental protection;
• Designing urban master plans;
• Construction of regrouped settlements (Imidugudu);
• 10,000 ha of marked-out and improved plots;
• Restructuring of seven districts where the population suffer from bad living conditions; and
• Accommodating public facilities into comfortable buildings in accordance with the need for rapid and quality services.
In order to achieve these objectives, the sector has stipulated specific sub-programmes to be focused on:
• Real estate promotion, construction and maintenance of public buildings;
• Registration of land plots with all necessary statutory requirements;
• Imidugudu promotion and development of master plans;
• Support for housing financing;
• Establishment of main planning, urban architectural designs and simplified plans of 30 municipalities (district towns);
• Improvement of informal/peripheral neighbourhoods;
• Sensitisation on the standards of construction and urbanism as well as the protection of the urban environment; and
• Promotion of low cost and indigenous good materials and techniques for home building.
Energy is regarded a key requirement for the development of the national economy and essential for the development of industries and businesses as well as to the delivery of high-quality services from social institutions such as health facilities, schools and administrative offices.
3 Introduction to the habitat and urbanism sub-sector, MINIFRA (http://www.mininfra.gov.rw/index.php?id=26)
EICV3 DISTRICT PROFILE - Gicumbi12
The EDPRS energy sector objectives are increasing access to energy, a sustainable tariff structure, diversification of energy resources, and security and strengthening of institutional framework and institutional capacity. Two main targets and indicators
related to electricity generation capacity and numbers of electricity connections were defined for the period of the EDPRS.4
4.2.1 Dwelling characteristics
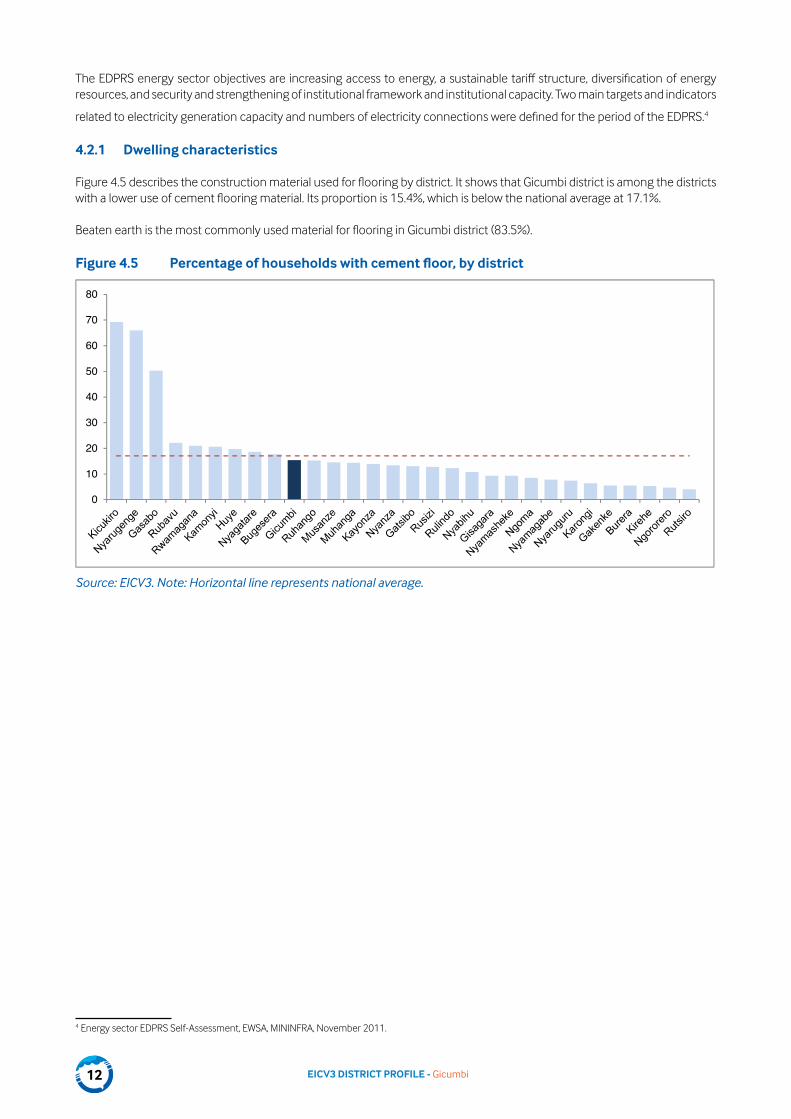
Figure 4.5 describes the construction material used for flooring by district. It shows that Gicumbi district is among the districts with a lower use of cement flooring material. Its proportion is 15.4%, which is below the national average at 17.1%.
Beaten earth is the most commonly used material for flooring in Gicumbi district (83.5%).
Figure 4.5 Percentage of households with cement floor, by district
Source: EICV3. Note: Horizontal line represents national average.
4 Energy sector EDPRS Self-Assessment, EWSA, MININFRA, November 2011.
EICV3 DISTRICT PROFILE - Gicumbi 13
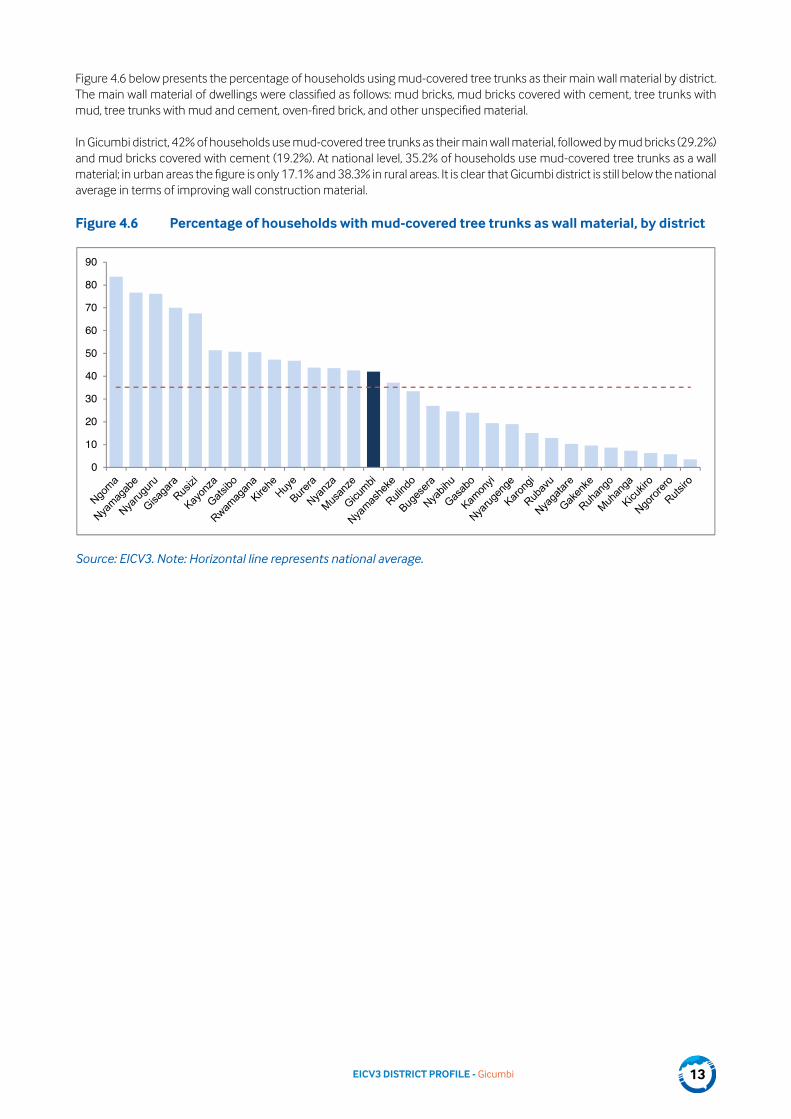
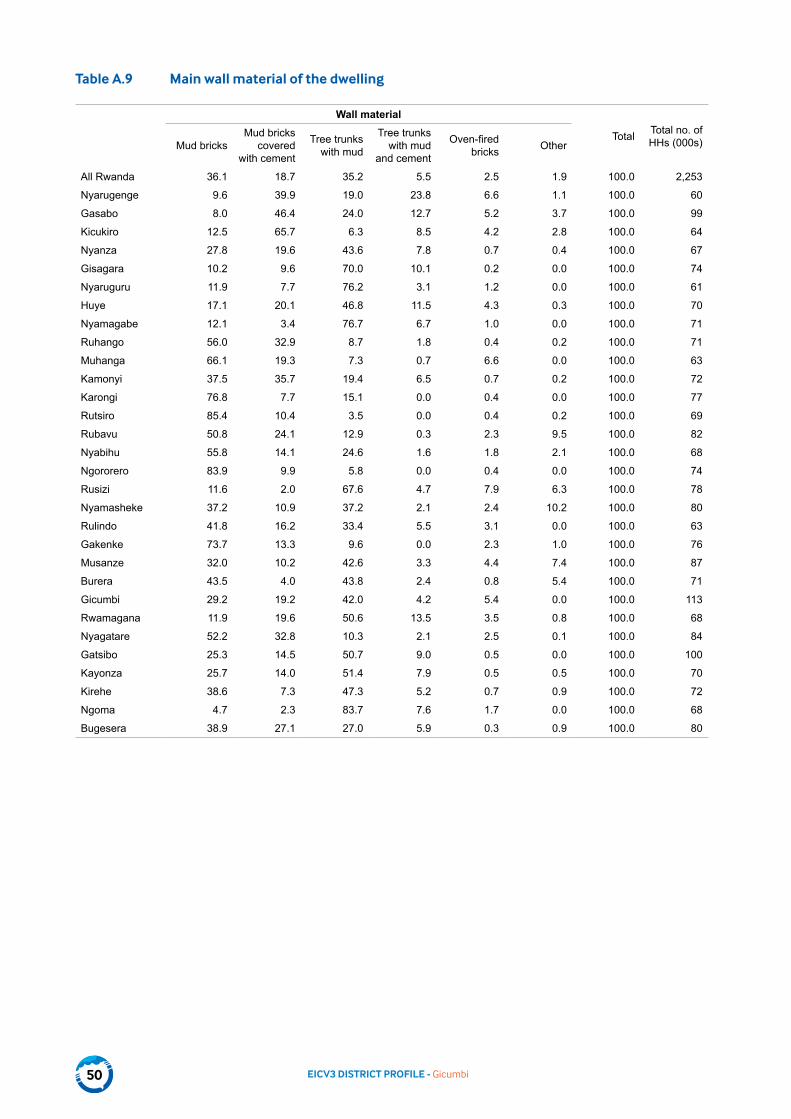
Figure 4.6 below presents the percentage of households using mud-covered tree trunks as their main wall material by district. The main wall material of dwellings were classified as follows: mud bricks, mud bricks covered with cement, tree trunks with mud, tree trunks with mud and cement, oven-fired brick, and other unspecified material.
In Gicumbi district, 42% of households use mud-covered tree trunks as their main wall material, followed by mud bricks (29.2%) and mud bricks covered with cement (19.2%). At national level, 35.2% of households use mud-covered tree trunks as a wall material; in urban areas the figure is only 17.1% and 38.3% in rural areas. It is clear that Gicumbi district is still below the national average in terms of improving wall construction material.
Figure 4.6 Percentage of households with mud-covered tree trunks as wall material, by district
Source: EICV3. Note: Horizontal line represents national average.

EICV3 DISTRICT PROFILE - Gicumbi14
4.2.2 Energy characteristics
The primary sources of energy used for lighting by households were categorised as follows: electricity, oil lamp, firewood, candle, lantern, battery, and other unspecified sources.
Figure 4.7 presents the distribution of households using electricity as the main source of lighting by district. In Gicumbi district, 8.9% of households use electricity as their main source of lighting, ranking the district second in Northern Province after Musanze (14.5%), and ahead of Rulindo (2.6), and Burera (3.2%) and Gakenke (1%).
The urban area average for the proportion of households using electricity as the main source of lighting is 46.1%, while it is only 4.8% in rural areas and 10.8% at national level. Gicumbi district is therefore below the national and urban area averages.
Figure 4.7 Map: Percentage of households with electricity as main source of lighting, by district
4.3 Ownership of selected durables
The EICV3 provides information on ownership of selected ICT devices by district and categorises them into mobile phone, landline phone, computer, radio, TV set, and video/DVD player.
When the Vision 2020 was elaborated in 1998/99, the national consultative process stated: ‘Telecommunication coverage in Rwanda is very low. The communication policy will take advantage of the small size of the country, its high population density and the single local language to attract investors so that the sector can be liberalised. By 2020, Rwanda projects to have internet access at all administrative levels, for all secondary schools and for a large number of primary schools. Telephone services will be widespread in rural areas’.

EICV3 DISTRICT PROFILE - Gicumbi 15
Ever since, the ICT sector has been regarded a key element of Rwanda’s development process. It is expected to create jobs, facilitate general economy development, and ensure that Rwanda will transform into a globally competitive, information-rich, knowledge-based economy.5
In line with these aspirations, the EDPRS/Common Performance Assessment Framework defines two sector-relevant progress indicators: ICT penetration in terms of voice (i.e. phone) and data (i.e. internet) services.
Figure 4.8 below describes the percentage of households owning a mobile phone by district. It shows that Gicumbi district has 38.3% of households owning a mobile phone, ranking it last within Northern Province after Musanze (48.6%), followed by Gakenke (41.1%), Burera (38.9%) and Rulindo (43.1%).
In urban areas, 71.5% of households own a mobile phone, while in rural area it is 40.6% and 45.2% country-wide. Gicumbi therefore ranks below national, urban and rural averages on this indicator.
Figure 4.8 Percentage of households owning mobile phone, by district
Source: EICV3.
Figure 4.9 below describes the percentage of households owning a radio by district. In Gicumbi district, 62.3% of households own a radio. The national average is 46.7% while in urban areas it is 50.7% and in rural areas 45.9%. The top-ranked district on this indicator is Nyagatare with 69.5%.
Figure 4.9 Percentage of households owning radio set, by district
Source: EICV3. Note: Horizontal line represents national average.
5 ICT Sector EDPRS Self-Assessment Report, Ministry of Information and Communications Technology, December 2011.

EICV3 DISTRICT PROFILE - Gicumbi16
4.4 Distance to facilities/services
Walking distance to basic services can be considered an indicator of both provision/coverage of such services and the remoteness of households’ dwellings. The basic services were categorised into Food Market/Shop, Primary School, Secondary School, and Health Centre.
Figure 4.10 shows the mean walking distance to primary school by district. The mean walking distance to a primary school in Gicumbi district is 37.1 minutes, higher than the mean figure for rural areas (28.6 minutes), and 32.6% of households are between 30 and 59 minutes of a primary school. In urban areas, the mean walking distance to a primary school is 19.4 minutes, while it is 27.2 minutes country-wide.
Figure 4.10 Map: Mean walking distance to basic services (in minutes): Primary school, by district

EICV3 DISTRICT PROFILE - Gicumbi 17
Figure 4.11 below shows the mean walking distance to health centre by district. In Gicumbi district, the mean walking distance to a health centre is 61.9 minutes and 44% of households walk for under an hour on average to reach a health centre.
The mean walking distance to a health centre is 35 minutes in urban areas and 64.4 minutes in rural areas, while it is one hour country-wide. When compared to urban areas, Gicumbi district health centres are on average an additional 26.9 minutes from household dwellings.
Figure 4.11 Map: Mean walking distance to basic services (in minutes): Health centre, by district

EICV3 DISTRICT PROFILE - Gicumbi18
4.5 Use of financial services
Figure 4.12 presents the percentage of households with at least one saving account by district. It shows that in Gicumbi district, 35.7% of households have at least one saving account, ranking it last in Northern Province after Gakenke (43.2%), Burera (40.9%), Musanze (38.6%) and Rulindo (45.5%). At national level, 39.4% of households have at least one saving account.
Figure 4.12 Percentage of households with at least one savings account, by district
Source: EICV3. Note: Horizontal line represents national average.

EICV3 DISTRICT PROFILE - Gicumbi 19
5 Economic activity and income sources
5.1 Economic activity
This section refers to the population aged 16 years and above, as 16 years is the legal working age in Rwanda. Employment questions were asked of all individuals aged six years and above but only data for those aged 16 years and above appear in this section. It should be noted that the survey collected data about all the jobs people did over a 12-month period, as well as about those they did in the last seven days. We refer to the former as usual economic activity and to the latter as current economic activity.
The formal International Labour Organisation (ILO) definition of unemployment is those people who work under one hour per week but are actively seeking work and able to start immediately. In many low-income countries that do not have social safety nets, formal unemployment is quite low because it is rare to be able to afford to do no work at all. We present here statistics for formal unemployment and an estimate for the small number of discouraged workers. We also look at broader measures such as underemployment, which consist of those working part time, but who would like to work more hours a week.
Figure 5.1 below presents usual employment, unemployment, and economic inactivity among persons aged 16 years and above by district
In Gicumbi district, the overall employment rate is 85.9% of the resident population aged 16 years and above; the unemployment rate is 0.7% and economic inactivity rate is 13.5%. As shown in Figure 5.1 below, Gicumbi district is among the districts with a high employment rate. The national average employment rate is 84%, the unemployment rate is 0.9% and the economic inactivity rate is 15%.
Figure 5.1 Economic activity: Employment, unemployment, and economic inactivity among persons aged 16 and above (usual), by district
Source: EICV3. Note: Based on all persons aged 16 and above. Horizontal line represents national average of employment rate.

EICV3 DISTRICT PROFILE - Gicumbi20
Figure 5.2 presents employment types by the usual main job in Gicumbi district. It shows that most people aged 16 years and above in Gicumbi are independent farmers (67%). The second most frequent main job is wage non-farm (16%).
Figure 5.2 Employment types (usual main job) in Gicumbi
Source: EICV3. Note: Based on all persons aged 16 and above usually working.
Figure 5.3 describes the industry of usual main jobs in Gicumbi district. Agriculture is shown as the main industry, involving 76% of the population aged 16 year and above, followed by Trade (7%) and Government (4.8%).
Figure 5.3 Industry of usual main jobs in Gicumbi
Source: EICV3. Note: Based on all persons aged 16 and above usually working.
Figure 5.4 below presents the percentage of underemployed people – meaning the percentage of working people that worked 35 hours or fewer in all their jobs in the previous seven days – by district. Taking all the jobs that people did in the seven days before the survey we can start to understand underemployment. People whose main job is a waged job work on average 45 hours per week in all of their jobs (though this type of job holder is the least likely to be involved in more than one job). Those who work in small businesses as owners work 36 hours a week. Those who work as independent farmers work just 24 hours per week in all jobs, and waged farm workers work just 29 hours. People working on farms are the most likely to be working in more than one job at a time.
Setting a definition of underemployment at 35 hours a week or fewer, two-thirds of Rwandese adults can be defined as underemployed. Those working in farm jobs are the most likely to be underemployed, although it should be noted that farm workers must spend more time on gathering fodder for animals, fetching water and firewood, and marketing produce, which is not here counted as economic activity.

EICV3 DISTRICT PROFILE - Gicumbi 21
Only Northern Province has a significant percentage of the population working more than 35 hours a week. This is related to the higher than average proportion of jobs in Kigali that are non-farm paid work.
In Gicumbi district, 71.6% of adults worked 35 hours or fewer in all their jobs in the seven days prior to survey data collection and are classified as underemployed. This is higher than the national average of 67.8%.
Figure 5.4 Underemployment (percentage of working people that worked 35 hours or fewer in all their jobs in the previous seven days), by district
Source: EICV3. Note: Based on all adults aged 16 and above who worked in the previous seven days, and gave the numbers of hours worked in all their jobs. Horizontal line represents national average.
Figure 5.5 describes the median number of hours spent in the last seven days on domestic duties by men and women by district. All persons were asked how many hours they spent on domestic duties. Fetching water, fodder and firewood are officially classed as economic activity according to the ILO.
In Gicumbi district, the median number of hours spent on all domestic duties in last seven days, by all persons 16 and above, including working and non-working persons, is 16 hours where males spent eight hours and females 21 hours. The national median number of hours spent by females on all domestic duties is 26 hours, while males spent nine hours, together making an average of 19 hours.
Figure 5.5 Median number of hours spent in last seven days on domestic duties by men and women, by district
Source: EICV3. Note: Domestic duties include foraging for firewood, fodder searching, water fetching, going to the market, cooking, and other household chores. Fetching water, fodder and firewood are officially classed as economic activity according to the ILO. Estimates based on all adults aged 16 and above (both working and non-working). Horizontal lines represent the national average of median hours spent on domestic duties by men (lower line) and women (upper line). Districts are ordered by the median number of hours spent on domestic duties by women.

EICV3 DISTRICT PROFILE - Gicumbi22
5.2 Income sources
This section focuses on five main components of income: agricultural income, wage income, business income, rent income, and income from transfers.
• Household agricultural income: this component is first divided into agricultural income (income from land cultivation) and livestock income. Unless otherwise specified, this report sums the two components into one agricultural component. It includes revenues from sale of crops, processed crop products, livestock products and other agricultural products, own consumption of food and non-food products, and the revenues from renting out livestock and sale of small animals. The income aggregate deducts costs on crop inputs, inputs used for processing crop products, and expenditure on livestock and the cost of renting land. Within the costs, the income aggregate includes the depreciation of land and agricultural equipment. The depreciation rate is equal to 0.2 per annum.
• Wage income: this includes cash and in-kind revenues received from farm and non-farm work. In-kind payments include food and other agricultural products, provision of house and other benefits received for the work.
• Non-farm self-employment (business): this includes income received net of labour and other inputs.
• Income from rents: this includes actual rents received from renting out livestock, agricultural equipment and land (rent and sharecropping), as well as imputed rental value of owner-occupied dwellings.
• Transfers: transfers include remittances received (cash and in-kind) and other private transfers. It also includes public transfers. Private transfers received from dowry and sales of assets and land are excluded.
All income values are in real terms, with the price index equal to 100 in January 2011. The price deflator used here to express values in real terms is the same one that was used in the poverty analysis. The price index is based on a general basket of goods including food and non-food items, thus implicitly assuming the income generated by a household is spent on this general basket of goods.
The EICV3 results shows that at the national level agriculture contributes the largest share of a household’s income (46%), followed by wage income (25%), business income (i.e. self-employment), transfers, and rents.
Figure 5.6 below presents the household income shares in Gicumbi district. It shows that household income is driven by agriculture income (49%), the main driver, followed by wage income (25%) and business income (9%). The smallest contributor to household income in Gicumbi district is transfer income (public and private transfers) with 3%.
Figure 5.6 Household income shares in Gicumbi
Source: EICV3.
EICV3 DISTRICT PROFILE - Gicumbi 23
6 Agriculture
This section seeks to inform and support the development of the EDPRS2 with data from the EICV3 and focuses on the agriculture sector. It provides detailed insights into the living conditions of the Rwandan population with regard to agricultural production. Agriculture is the backbone of Rwanda’s economy and the majority of households in Rwanda are currently engaged in some sort of crop or livestock production activity.
In recent years, the Government of Rwanda has implemented several ambitious programmes to increase the productivity of the agriculture sector. The motivation behind these actions is reflected in the Ministry of Agriculture’s vision: ‘Our Vision is to modernise Agriculture and Livestock to achieve food security. One of the key pillars of this vision is the transformation of Agriculture from subsistence to a productive high-value, market-oriented farming that is environmentally friendly and has an impact on other sectors of the economy.’
This section explores a wealth of evidence on agricultural production collected through the EICV3.6
6.1 Land
One of the major inputs in agricultural production is land. Rwanda is a small country with total arable land of about 1.4 million hectares.7
Given a growing population combined with strong reliance on agriculture, it is clear that land is one of the scarcest resources in Rwanda. The EICV collects detailed data on land use and the agricultural activities of Rwandan households. It is however important to note that the EICV is not a specialised agricultural survey.
Since the EICV does not require that the plot sizes of a household are measured, it is possible that estimates of land size are not as reliable as those that would be obtained by a specialist agricultural survey, nor are issues of land quality addressed.8 Here we classify households which cultivate land into the following categories; very small cultivators (under 0.3 ha), small cultivators (0.3 to 0.9 ha), medium cultivators (0.9 to 3 ha) and large cultivators (more than 3 ha).
6 Sample size of EICV3: 14,308 households. District-level estimates for selected indicators can be found in Annex A.7 Rwanda State of Environment and Outlook, REMA/UNEP, 2009.8The CFSVA 2009 survey estimates that nationally, 19% cultivated under 0.1 ha, 37% under 0.2 ha, and 59% under 0.5 ha. EICV3 estimates that 16% cultivated under 0.1 ha, 32% under 0.2 ha, and 66% under 0.5 ha.

EICV3 DISTRICT PROFILE - Gicumbi24
Figure 6.1 shows the mean size of land cultivated per household (in ha), by district. For Gicumbi district, the mean size of land cultivated per household is 0.49 ha, which is below the national average (0.59) and rural average (0.6), but above the urban average (0.46). Gicumbi district has 85.6% of households cultivating under 0.9 ha of land.9
Figure 6.1 Map: Mean size of land cultivated per household (ha), by district
9 The Food and Agriculture Organisation estimates that on average a Rwandan household requires at least 0.9 ha to conduct sustainable agriculture (National Land Policy Report).
EICV3 DISTRICT PROFILE - Gicumbi 25
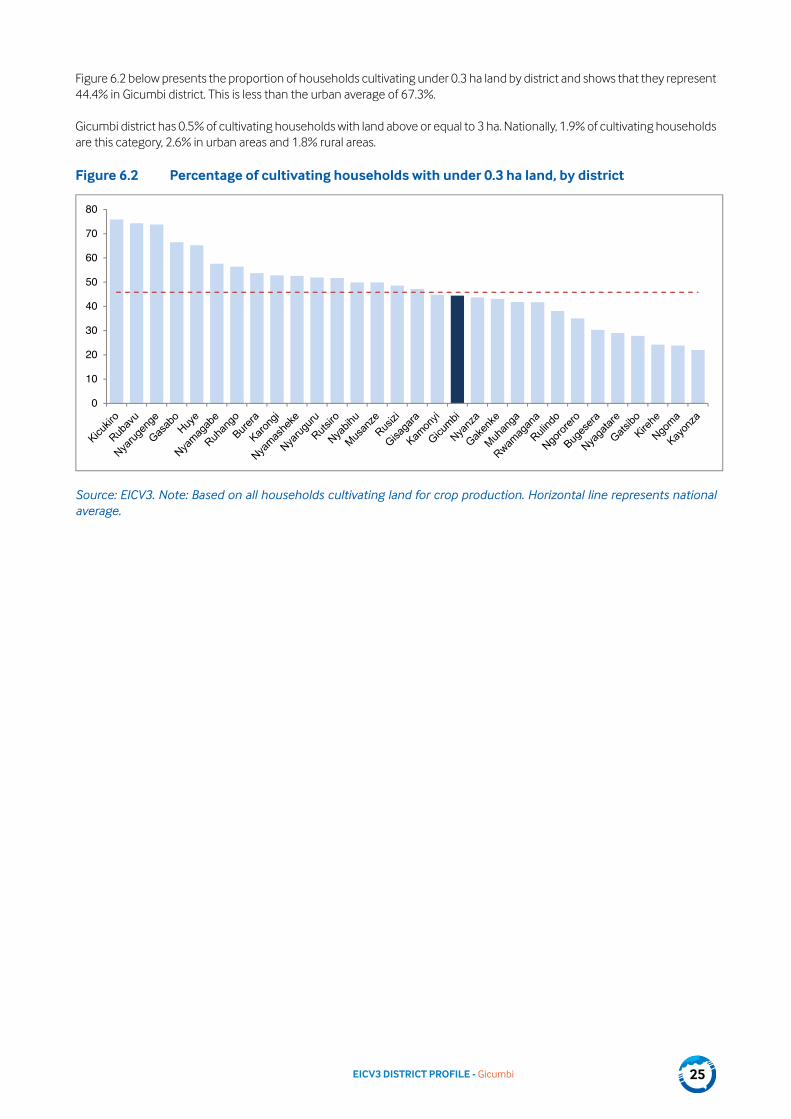
Figure 6.2 below presents the proportion of households cultivating under 0.3 ha land by district and shows that they represent 44.4% in Gicumbi district. This is less than the urban average of 67.3%.
Gicumbi district has 0.5% of cultivating households with land above or equal to 3 ha. Nationally, 1.9% of cultivating households are this category, 2.6% in urban areas and 1.8% rural areas.
Figure 6.2 Percentage of cultivating households with under 0.3 ha land, by district
Source: EICV3. Note: Based on all households cultivating land for crop production. Horizontal line represents national average.

EICV3 DISTRICT PROFILE - Gicumbi26
Figure 6.3 below shows the proportion of households that have been exposed to the Land Tenure Regularisation (LTR) programme by district. Gicumbi district has 48.5% of households that have been exposed to the LTR programme. This proportion is 54.1% country-wide on average.
Figure 6.3 Map: Percentage of households that have been exposed to LTR programme, by district
6.2 Farming practices
The following Figure 6.4 presents the percentage of cultivated land which has been protected against soil erosion by district.
The percentage of land that has been reported as protected against soil erosion in Gicumbi district is 89.8%. Rubavu is reported to have the lowest percentage (47.9%) and Nyabihu the highest (94.1%) among all districts.
Around 78% of cultivated land nationally is reported as being protected against erosion, with Northern Province having the lowest percentage and Southern Province the highest.

EICV3 DISTRICT PROFILE - Gicumbi 27
Figure 6.4 Map: Percentage of land protected against soil erosion, by district

EICV3 DISTRICT PROFILE - Gicumbi28
Figure 6.5 presents the percentage of percentage of agricultural households incurring expenditure on chemical fertiliser by district, which in Gicumbi district is around 16.5%.
The national average is around 29% with Gakenke district incurring the highest (63%) percentage and Nyarugenge district incurring the lowest (2.2%).
Figure 6.5 Percentage of agricultural households incurring expenditure on chemical fertiliser, by district
Source: EICV3. Note: Based on all households cultivating land for crop production. Horizontal line represents national average.

EICV3 DISTRICT PROFILE - Gicumbi 29
6.3 Commercialisation of crop production
Figure 6.6 below presents the mean share of harvest sold, by district. Commercialisation of crop production overall, as measured by the share of harvest sold (including households selling zero crops), is 19.5% in Gicumbi district. It is 20.9% at national level and around 20% in all other provinces outside Kigali City. It is the highest in Nyabihu district (28%) and lowest in Nyarugenge district (10.8%).
The mean share of harvest sold for fruit and vegetables (19.7%) is slightly higher than for staple crops (17.3%) in Gicumbi district and this pattern is similar at national, urban and rural areas level.
Figure 6.6 Mean share of harvest sold, by district
Source: EICV3. Note: Based on all households cultivating land for crop production. Horizontal line represents national average.

EICV3 DISTRICT PROFILE - Gicumbi30
6.4 Livestock
In addition to crops, livestock is another important source of income and food for agricultural households.
Figure 6.7 presents the percentage of households raising livestock over the last 12 months by district and shows that 77.8% of all households in Gicumbi district raise some type of livestock.
This percentage is 68.2% at national level, 72.8% in rural areas, 41.8% in urban areas and is between 69% and 76% in other provinces, excluding Kigali City where it is 34.5%.
Figure 6.7 Percentage of households raising livestock over the last 12 months, by district
Source: EICV3. Note: Horizontal line represents national average.

EICV3 DISTRICT PROFILE - Gicumbi 31
7 Education
Rwanda Vision 2020 acknowledges Rwanda as ‘suffering from serious deficiencies in terms of trained human capital’ and states as its major objective, the creation of ‘a knowledge-based and technology-led economy’ for which ‘comprehensive human resources development is considered to be one of the necessary pillars [for Rwanda] to reach the status of a middle income country (US$ 220 GDP/capita in 2003 to US$ 900 GDP/capita by 2020)’.10
Although education is this section’s general theme, it focuses essentially on access to education rather than other areas of interest such as pupil/student performance and the quality of services delivered by the education system in Rwanda. This is because the EICV3 did not collect the data necessary for a comprehensive review of these areas of interest.
7.1 Schooling and literacy
Figure 7.1 below presents the percentage distribution of individuals aged six and above that have ever attended school by district.
Gicumbi district is ranked eleventh at national level and fourth in Northern Province with 83.7% of individuals aged six having at some time attended school. The top-performing district is Kicukiro (94.4%) followed by Nyarugenge (90.7%). All other districts range from 78.4% to 86%.
Figure 7.1 Percentage of individuals aged six and above that have ever attended school, by district
Source: EICV3. Note: Based on all persons aged six and above. Horizontal line represents national average.
Figure 7.2 shows that Gicumbi district is ranked eleventh at national level with a literacy rate of 84.8% among the population aged 15 and above. Apart from Kicukiro (89.5%) and Nyarugenge (86.7%), which are ranked first and second respectively, other districts range from 56.5% (Gisagara) to 72.9% (Bugesera).
At national level, the average level of literacy rate is 69.7%. It is 82.6% in urban areas and 67.3% in rural areas. The average level of literacy rate in the provinces ranges from 67.5% in Southern Province to 68.7% in Northern Province, excluding Kigali City where it is 86.7%.
10Rwanda Vision 2020, p. 6.

EICV3 DISTRICT PROFILE - Gicumbi32
Figure 7.2 Literacy rate (%) among population aged 15 and above, by district
Source: EICV3. Note: Based on all persons 15 and above. Horizontal line represents national average.

EICV3 DISTRICT PROFILE - Gicumbi 33
7.2 Primary and secondary education
In Rwanda, the education and training system is structured into four main levels. A pre-primary level, which lasts three years, precedes the primary level that lasts six years. Above primary school, two levels exist, the first being a technical or vocational education, which aims at preparing students to enter the labour market once they complete this level, and the second being a secondary education, aimed at those students that wish to pursue a college or university degree before entering the labour market. Each of these levels is a six-year long programme. A fourth level is available for those completing secondary education or, in some cases, such as technical courses like those in the area of engineering, the technical or vocational levels. This education level is referred to as higher learning and comprises colleges and universities, lasting a maximum of seven years. The Nine-Year Basic Education Policy aims at ensuring that all children are ‘able to get education in nine years (six years of primary education and three years of general cycle of secondary education) without paying school fees’.11
Figure 7.3 presents the net attendance rates (NARs) in primary school, by district. The NAR in primary school for Gicumbi district is 97.9%, above the national average of 91.7%, the urban (93.3%) and rural (91.5%) area averages and the average for Kigali City (94.1%). Gicumbi district has the highest NAR in Northern Province.
Figure 7.3 Map: NARs in primary school, by district
11 Nine-Year Basic Education Implementation – Fast Track Strategies, p3, MINEDUC, November 2008.

EICV3 DISTRICT PROFILE - Gicumbi34
Figure 7.4 below presents the NARs in secondary school by district. Gicumbi district has a NAR in secondary school of 25.8%, which is above the national average (21%) and above the rural area average (18.2%) but less than the urban area average (37.4%).
Figure 7.4 Map: NARs in secondary school, by district
The EICV3 survey asked users of all levels of the education system questions about their satisfaction with the education services received. Although on a self-perceived basis, these questions allow for a review of the progress observed in the level of satisfaction of users.
Figure 7.5 below presents these results by district. Across all Gicumbi district, 84.5% of the users of education services in 2010–11, were satisfied with these services. This is above the national level of users’ satisfaction (81.9%).
The results show that satisfaction is lower among users in rural areas (80.9%) than in urban areas (87.1%).
Figure 7.5 Percentage of users satisfied with education services, by district
Source: EICV3. Note: Based on all persons currently attending education. Horizontal line represents national average.

EICV3 DISTRICT PROFILE - Gicumbi 35
7.3 ICT education
Figure 7.6 presents results of a broader approach, investigating computer literacy in the overall population aged six and above that have used a computer before and would feel confident about using one again, by district.
The survey results show that 7.2% of Gicumbi district have used a computer before and would feel confident using one again. Gicumbi ranks first in the Northern Province and fourth at national level.
Among the urban population, 14% can be classified as computer literate, but this applies to only 2% of the rural population. Only 4% at national level can be classified as computer literate.
Figure 7.6 Computer literacy: Percentage of population aged six and above that have used a computer before and would feel confident about using one again, by district
Source: EICV3. Note: Horizontal line represents national average.

EICV3 DISTRICT PROFILE - Gicumbi36
8 Vulnerable groups
Groups that are considered particularly vulnerable by the Government of Rwanda are children under five years old, elderly people aged 60 and over, and people with disabilities. The government delivers a core set of social protection programmes through the Ministry of Local Government (MINALOC), supported by a number of complementary initiatives delivered by other ministries.
The main programme run by MINALOC, and a flagship of the EDPRS 2008–2012, is the Vision 2020 Umurenge Programme (VUP) which contains three pillars: VUP public works, VUP direct support, and VUP financial services. The three pillars represent public works for the poor who are able to work, cash transfers for very poor households without labour capacity, and financial services such as the Ubudehe Credit Scheme.
In addition to VUP, MINALOC runs two other social assistance schemes: the Genocide Survivors Support and Assistance Fund, and the Rwanda Demobilisation and Reintegration Commission. Outside these core programmes are the social protection initiatives run by other ministries such the Girinka ‘One Cow per Poor Family’ programme of the Ministry of Agriculture, the free basic education programme, subsidised subscriptions for mutual health insurance, and in-kind social care services run by the Ministry of Gender and Family Promotion. Moreover, Rwanda has a limited system of contributory social protection mechanisms that enable people in formal employment to access medical care and an old-age pension.
8.1 People with disabilities
Figure 8.1 presents the percentage distribution of persons with a major disability, by district. It shows that Gicumbi district ranks seventh among all districts with a high percentage of people with a major disability (6.2%). This percentage is above the national average of 4.5%. The district with the most people with a major disability is Burera, with 8.2%.
Figure 8.1 Percentage of persons with major disability, by district
Source: EICV3. Note: Horizontal line represents national average.
8.2 Orphans
Figure 8.2 below presents the percentage distribution of orphans – including those with one parent or both parents deceased – among the population aged 0– 20, by district. It shows that Gicumbi district has 0.7% of orphans with both parents deceased and 13.2% of orphans with one parent deceased. Both these indicators are below the national level averages, which are 2.7% and 14% respectively.

EICV3 DISTRICT PROFILE - Gicumbi 37
Figure 8.2 Percentage of orphans (one parent or both parents) among population aged 0–20, by district
Source: EICV3. Note: Based on all persons aged 0–20. Districts ordered by percentage of orphans (one or both parents). Horizontal line represents national average of orphans (one or both parents).

EICV3 DISTRICT PROFILE - Gicumbi38
9 Some gender aspects
The resident population of Gicumbi district is 572,000. 274,000 are male and 298,000 female, meaning females outnumber males by 24,000 people.
Figure 9.1 below presents the percentage of heads of household by gender in Gicumbi district. It shows that 25% of households in Gicumbi district are headed by females and 6% are ‘de facto female-headed households’, i.e. those headed by females in the absence of a male head.
Figure 9.1 Sex of heads of household in Gicumbi
Source: EICV3. Note: In addition to the households who reported the household head as female, other households were headed by females in the absence of a male head. We call these households ‘de facto female-headed households’. These households were temporarily headed by females whose husbands had been away for long periods of time.
Figure 9.2 shows the percentage distribution of employment by gender in Gicumbi district. It shows that the majority of females in Gicumbi district are small-scale farm workers (78%), with 8% wage farm workers. The majority of males are also involved in small-scale farm work (53%), wage non-farm work (7%); 11% are involved in wage farm and 9% in independent non-farm.
Figure 9.2 Employment type by sex in Gicumbi
Source: EICV3. Note: Based on all working people aged 16 and above.

EICV3 DISTRICT PROFILE - Gicumbi 39
10 Conclusions for Gicumbi
The percentage of the poor in Gicumbi is 49.3%, which is above the national average of 45%. The percentage of the extreme poor is 33.3%, which is the highest in Northern Province.
The percentage of households in Gicumbi district with access to an improved drinking water source is 89.4%, which is above the EDPRS target of having 85% of the population with access to an improved water source by 2012. All the other districts in the Northern Province are below the national target.
The percentage of households that uses electricity as their main source of lighting in Gicumbi district is only 9% which is below the urban and national averages. However, Gicumbi ranks second on this indicator in the Northern Province.
Gicumbi district is among the districts with few households owning a mobile phone. Gicumbi district has 38.3% of households owning a mobile phone and is ranked last within the Northern Province. In urban areas, 71.5% of households own a mobile phone while in rural areas the figure is 40.6%, and 45.2% country-wide. Therefore Gicumbi ranks below the national, urban and rural averages.
The mean walking distance to a primary school in Gicumbi district is 37.1 minutes, which is above the mean distance in rural areas of 28.6 minutes. In urban areas, the mean walking distance to a primary school is 19.4 minutes while it is 27.2 minutes country-wide.
The industry of usual main jobs in Gicumbi district is mainly agriculture with 76% of the working population aged 16 year and above involved in this. Agriculture is the main source of income for 49% of households.
Gicumbi is among the districts with a high percentage of households raising livestock (77.8%).
The literacy rate among the population aged 15 and above in Gicumbi district is 70.5%, which is equal to the national average of 69.7%. The NAR in primary school for Gicumbi district is 97.9%, above the national average of 91.7%, the urban (93.3%) and rural (91.5%) area average and the average for Kigali City (94.1%). Gicumbi district has the highest NAR in Northern Province.
The survey results show that 7.2% of the population of Gicumbi district have used a computer before and would feel confident using one again. Gicumbi ranks first in the Northern Province and fourth at national level on this indicator.

EICV3 DISTRICT PROFILE - Gicumbi40
References
1. Agriculture and Poverty in Rwanda: A Comparative Analysis of the EICV1, EICV2, and LRSS Surveys. 2009.
2. Banerjee, Abhijit V. and Duflo, E. 2008. ‘What Is Middle Class about the Middle Classes around the World?’ Journal of Economic Perspectives, 22(2): 3–28.
3. Economic Development and Poverty Reduction Strategy, 2008–2012. 2007.
4. McKay, A. and Perge, E. 2012. The Evolution of Poverty in Rwanda From 2000 to 2011: Results from the EICV Household Surveys.
5. Ministry of Education. 2007. Special Needs Education Policy.
6. Ministry of Education. 2008. Higher Education Policy.
7. Ministry of Education. 2008. Nine-Year Basic Education Implementation – Fast Track Strategies.
8. Ministry of Education. 2008. Technical and Vocational Education and Training Policy.
9. Ministry of Education. 2010. Education Sector Strategic Plan, 2010–2015.
10. Ministry of Education. 2012. 2011 Education Statistics.
11. National Institute of Statistics of Rwanda. 2012. Rwanda Demographic and Health Survey 2010 – Final Report.
12. National Institute of Statistics of Rwanda. 2012. The Third Integrated Household Living Conditions Survey (EICV3): Main Indicators Report.
13. National Land Policy Report.
14. Rwanda State of Environment and Outlook, REMA/UNEP. 2009.
15. SIDA. 2008. Growth and Poverty in Rwanda: Evaluating the EDPRS 2008–2012 – Country Economic Report.
16. Strode, M., Wylde, E., and Murangwa, Y. 2006. Labour Market and Economic Activity Trends in Rwanda: Analysis of the EICV2 Survey.

EICV3 DISTRICT PROFILE - Gicumbi 41
Annex A District tables for all indicators presented in this report
A.1 Demographics
Table A.1 Distribution of population by age groups and sex (000s)
0-4 5-9 10-14
15-19
20-24
25-29
30-34
35-39
40-44
45-49
50-54
55-59
60-64
65+ Total
Nyarugenge Male 19 17 13 14 16 18 14 6 6 4 3 2 1 2 135
Female 21 17 16 21 20 17 9 8 5 4 2 3 2 3 147
Gasabo Male 39 32 25 22 28 23 20 15 9 6 4 2 3 3 231
Female 38 28 23 30 31 24 20 11 12 8 4 5 3 7 246
Kicukiro Male 21 18 18 12 19 21 13 10 8 5 2 1 0 2 151
Female 24 17 12 17 19 18 13 9 6 4 3 1 2 4 150
Nyanza Male 22 24 21 15 14 12 5 7 5 6 4 3 1 5 145
Female 24 23 20 17 12 11 10 8 6 8 5 5 4 10 162
Gisagara Male 31 22 19 18 14 13 10 6 5 6 5 4 3 4 162
Female 27 25 21 16 14 14 13 9 6 6 6 7 4 6 175
Nyaruguru Male 22 20 21 22 13 11 7 6 4 4 5 3 2 4 144
Female 25 23 24 18 13 12 8 7 5 5 7 5 2 7 160
Huye Male 21 24 21 15 15 11 8 7 6 5 4 4 2 5 147
Female 23 23 20 18 16 12 9 11 9 7 7 7 3 7 172
Nyamagabe Male 23 24 23 18 14 10 8 6 7 6 5 4 3 6 156
Female 25 25 23 19 14 14 8 9 6 7 6 5 4 9 174
Ruhango Male 22 22 17 17 13 13 7 4 5 6 4 2 2 6 141
Female 25 21 18 16 13 15 9 6 8 8 7 4 3 10 163
Muhanga Male 21 20 19 15 13 9 8 7 7 4 4 5 2 4 137
Female 20 22 20 16 13 13 12 8 8 6 8 4 3 7 160
Kamonyi Male 24 25 21 16 14 11 9 8 6 6 6 4 3 4 159
Female 23 22 19 19 12 15 10 10 12 6 7 4 4 8 171
Karongi Male 25 26 21 21 17 10 8 8 7 4 5 3 3 7 165
Female 26 26 24 21 16 13 11 10 9 8 7 6 2 10 190
Rutsiro Male 25 28 22 18 12 11 11 6 6 4 4 3 2 5 155
Female 27 24 23 16 16 18 11 8 5 4 5 4 3 6 171
Rubavu Male 38 32 24 24 17 14 13 7 6 6 4 3 2 3 194
Female 36 40 32 23 24 19 15 9 7 6 7 3 3 6 229
Nyabihu Male 24 27 22 22 17 10 8 5 6 5 3 4 2 4 157
Female 23 26 23 20 21 11 11 6 6 8 6 4 2 6 173
Ngororero Male 27 29 21 16 14 12 10 7 5 5 6 4 3 5 163
Female 27 25 22 18 16 17 11 8 7 5 8 6 3 6 179
Rusizi Male 29 27 29 29 21 12 9 9 7 6 6 5 4 7 198
Female 26 31 31 28 22 15 12 10 8 9 8 6 4 9 219
Nyamasheke Male 27 25 27 22 13 15 9 7 5 5 7 5 3 5 177
Female 35 30 24 25 22 19 13 9 8 7 7 6 3 9 217
Rulindo Male 22 23 21 13 10 10 9 7 6 6 4 3 1 4 139
Female 19 21 22 18 14 13 11 9 7 6 4 5 2 5 155

EICV3 DISTRICT PROFILE - Gicumbi42
Gakenke Male 26 22 22 16 15 15 10 6 5 4 6 3 4 6 160
Female 28 28 19 16 17 21 13 9 6 6 7 4 3 7 185
Musanze Male 32 29 24 23 19 16 10 9 7 6 5 4 3 4 191
Female 30 32 33 24 21 23 12 12 5 7 7 4 4 10 225
Burera Male 21 26 26 22 16 10 7 6 7 5 6 4 3 7 167
Female 23 32 27 21 17 12 10 9 7 6 7 4 2 10 187
Gicumbi Male 39 41 39 32 29 25 12 8 11 8 11 6 4 8 274
Female 34 30 51 38 37 21 14 11 14 14 6 12 3 14 298
Rwamagana Male 23 24 17 19 18 11 11 7 5 5 4 2 2 4 152
Female 23 24 22 17 14 12 12 7 8 6 6 3 3 8 166
Nyagatare Male 35 31 34 26 17 12 11 11 10 6 6 5 2 3 209
Female 37 32 29 20 19 18 12 14 8 7 8 4 2 5 215
Gatsibo Male 38 36 37 30 18 19 11 8 8 8 9 3 4 6 236
Female 41 39 28 25 26 20 14 15 8 11 8 9 4 7 255
Kayonza Male 25 26 21 19 13 13 9 6 5 7 4 4 2 4 158
Female 28 27 19 19 17 14 11 9 5 7 5 3 3 6 174
Kirehe Male 27 27 23 18 15 14 7 7 5 4 6 4 2 4 162
Female 25 23 21 15 16 16 10 8 7 7 6 4 2 6 167
Ngoma Male 28 21 20 19 13 10 11 7 5 5 3 3 2 5 152
Female 25 27 21 16 16 15 11 9 7 6 6 3 3 8 171
Bugesera Male 32 33 24 22 13 16 10 10 8 6 7 2 2 5 190
Female 35 27 25 21 18 16 16 12 5 8 5 4 4 5 201
All Rwanda Male 805 781 693 595 479 408 297 224 191 164 152 102 72 142 5,105
Female 825 791 711 611 547 477 352 280 222 205 183 146 88 219 5,657
EICV3 DISTRICT PROFILE - Gicumbi 43
Table A.2 Number of females per 100 males
District Number of females per 100 malesAll Rwanda 111
Nyarugenge 109
Gasabo 106
Kicukiro 100
Nyanza 112
Gisagara 108
Nyaruguru 112
Huye 116
Nyamagabe 112
Ruhango 115
Muhanga 117
Kamonyi 108
Karongi 115
Rutsiro 110
Rubavu 118
Nyabihu 110
Ngororero 110
Rusizi 111
Nyamasheke 123
Rulindo 112
Gakenke 115
Musanze 118
Burera 112
Gicumbi 109
Rwamagana 109
Nyagatare 103
Gatsibo 108
Kayonza 110
Kirehe 103
Ngoma 113
Bugesera 106
EICV3 DISTRICT PROFILE - Gicumbi44
Table A.3 Mean household size
Mean number of persons in HH Total number of HHs (000s)All Rwanda 4.8 2,253
Nyarugenge 4.7 60
Gasabo 4.8 99
Kicukiro 4.7 64
Nyanza 4.6 67
Gisagara 4.6 74
Nyaruguru 5 61
Huye 4.6 70
Nyamagabe 4.6 71
Ruhango 4.3 71
Muhanga 4.7 63
Kamonyi 4.6 72
Karongi 4.6 77
Rutsiro 4.7 69
Rubavu 5.2 82
Nyabihu 4.8 68
Ngororero 4.6 74
Rusizi 5.4 78
Nyamasheke 4.9 80
Rulindo 4.7 63
Gakenke 4.5 76
Musanze 4.8 87
Burera 5 71
Gicumbi 5.1 113
Rwamagana 4.7 68
Nyagatare 5.1 84
Gatsibo 4.9 100
Kayonza 4.7 70
Kirehe 4.6 72
Ngoma 4.8 68
Bugesera 4.9 80
EICV3 DISTRICT PROFILE - Gicumbi 45
A.2 Poverty
Table A.4 Percentage of population identified as poor or extremely poor
Extreme poverty Poverty (excluding extreme)
Non-poor Total
Rwanda 24.1 20.8 55.1 100.0
Nyarugenge 3.6 6.5 89.9 100.0
Gasabo 13.2 12.8 74.0 100.0
Kicukiro 2.8 5.5 91.7 100.0
Nyanza 28.0 21.8 50.2 100.0
Gisagara 32.1 27.3 40.6 100.0
Nyaruguru 35.4 26.2 38.4 100.0
Huye 25.2 21.4 53.4 100.0
Nyamagabe 45.2 28.1 26.7 100.0
Ruhango 32.2 28.2 39.6 100.0
Muhanga 26.2 27.4 46.4 100.0
Kamonyi 23.9 22.8 53.3 100.0
Karongi 39.8 21.9 38.3 100.0
Rutsiro 26.1 26.9 47.0 100.0
Rubavu 19.0 16.8 64.2 100.0
Nyabihu 11.9 16.7 71.4 100.0
Ngororero 29.5 22.4 48.1 100.0
Rusizi 24.5 20.5 55.0 100.0
Nyamasheke 40.6 22.8 36.6 100.0
Rulindo 19.7 23.2 57.1 100.0
Gakenke 30.9 25.7 43.4 100.0
Musanze 5.9 14.2 79.9 100.0
Burera 23.4 21.8 54.8 100.0
Gicumbi 33.9 15.4 50.7 100.0
Rwamagana 12.4 18.0 69.6 100.0
Nyagatare 19.1 18.7 62.2 100.0
Gatsibo 18.8 24.3 56.9 100.0
Kayonza 19.2 23.4 57.4 100.0
Kirehe 25.6 22.3 52.1 100.0
Ngoma 22.3 25.3 52.4 100.0
Bugesera 28.3 20.1 51.6 100.0

EICV3 DISTRICT PROFILE - Gicumbi46
A.3
St
anda
rd o
f liv
ing
(uti
litie
s an
d am
enit
ies)
Tabl
e A
.5
Mai
n s
ourc
e of
dri
nki
ng
wat
er
Tota
l im
prov
ed
wat
er s
ourc
e
Impr
oved
wat
er s
ourc
esTo
tal n
o. o
f H
Hs
(000
s)P
rote
cted
sp
ring
Pub
lic
stan
dpip
e
Pip
ed in
to
dwel
ling/
ya
rdB
oreh
ole
Pro
tect
ed
wel
lR
ain
wat
erS
urfa
ce
wat
er (r
iver
or
lake
)
Unp
rote
cted
sp
ring
Unp
ro-
tect
ed
wel
lTa
nker
truc
kO
ther
All
Rw
anda
74.2
38.1
25.7
5.9
1.8
2.3
0.4
11.6
10.6
2.3
0.0
1.3
2,25
3
Nya
ruge
nge
94.0
1.8
47.0
39.4
3.9
1.9
0.0
0.9
1.7
0.5
0.0
3.0
60
Gas
abo
84.7
16.7
36.9
24.0
2.2
4.8
0.0
6.5
7.1
1.7
0.0
0.0
99
Kic
ukiro
69.0
7.3
20.7
39.3
0.2
1.2
0.3
4.5
0.3
0.0
0.0
26.2
64
Nya
nza
82.1
62.3
15.5
1.8
1.0
1.5
0.0
15.1
2.7
0.0
0.0
0.0
67
Gis
agar
a82
.161
.817
.30.
00.
02.
90.
09.
96.
12.
00.
00.
074
Nya
rugu
ru66
.144
.414
.70.
70.
06.
30.
06.
721
.55.
50.
20.
061
Huy
e91
.063
.717
.06.
70.
03.
70.
03.
53.
12.
00.
00.
470
Nya
mag
abe
68.4
50.9
8.5
2.5
0.0
6.5
0.0
9.9
17.4
3.7
0.0
0.6
71
Ruh
ango
58.7
46.5
6.0
0.9
0.0
5.3
0.0
21.7
17.2
2.4
0.0
0.0
71
Muh
anga
84.4
64.7
11.6
4.3
0.0
3.8
0.0
4.6
9.1
2.0
0.0
0.0
63
Kam
onyi
65.9
43.0
14.9
0.2
0.0
7.8
0.0
16.3
11.4
6.4
0.0
0.0
72
Kar
ongi
74.7
51.7
13.0
1.6
3.1
5.3
0.0
10.3
14.8
0.2
0.0
0.0
77
Rut
siro
59.9
50.3
9.0
0.2
0.3
0.2
0.0
9.6
28.3
0.7
0.0
1.5
69
Rub
avu
93.4
14.8
59.6
12.4
0.0
0.0
6.6
5.2
1.2
0.3
0.0
0.0
82
Nya
bihu
79.6
52.5
25.6
0.1
0.0
0.8
0.7
5.1
11.3
2.9
0.0
1.1
68
Ngo
rore
ro63
.754
.78.
60.
00.
00.
20.
24.
330
.31.
70.
00.
074
Rus
izi
72.8
27.4
30.8
6.1
4.1
4.4
0.0
4.4
20.0
2.1
0.0
0.7
78
Nya
mas
heke
72.6
40.1
28.6
3.4
0.0
0.6
0.0
2.5
23.0
1.8
0.0
0.2
80
Rul
indo
74.6
59.7
14.3
0.2
0.2
0.2
0.0
7.8
16.4
1.2
0.0
0.0
63
Gak
enke
74.6
57.3
15.8
0.6
0.0
0.9
0.0
6.1
15.9
3.4
0.0
0.0
76
Mus
anze
74.0
13.8
53.3
6.6
0.0
0.2
0.1
20.9
4.9
0.0
0.0
0.2
87
Bur
era
76.8
44.0
31.2
0.4
0.0
0.6
0.6
12.6
9.9
0.0
0.0
0.7
71
Gic
umbi
89.4
58.9
17.3
9.0
0.4
2.5
1.3
2.6
7.1
0.6
0.0
0.3
113
Rw
amag
ana
82.0
28.4
44.9
6.1
0.0
2.4
0.2
11.9
3.8
1.7
0.0
0.7
68
Nya
gata
re42
.32.
218
.13.
115
.43.
40.
240
.65.
15.
40.
06.
684
Gat
sibo
72.3
33.8
32.7
0.7
5.1
0.0
0.0
12.1
6.9
8.3
0.4
0.0
100
Kay
onza
72.0
26.8
37.1
1.6
5.8
0.8
0.0
22.1
3.2
2.7
0.0
0.0
70
Kire
he61
.533
.727
.20.
20.
00.
40.
017
.417
.33.
80.
00.
072
Ngo
ma
67.6
40.7
21.8
1.3
3.7
0.0
0.0
28.1
3.0
1.4
0.0
0.0
68
Bug
eser
a70
.64.
756
.22.
65.
51.
60.
024
.61.
22.
50.
01.
180

EICV3 DISTRICT PROFILE - Gicumbi 47
Table A.6 Walking distance to improved water source (in minutes)
Mean time to
improved water
source (minutes)
Time to improved water source (minutes)
No improved
sourceTotal
Total no. of HHs (000s)
Water piped into dwelling/
yard
0–4 min 5–14 min 15–29 min
30–59 min 60+ min
All Rwanda 14.4 5.9 10.2 28.7 16.7 10.3 2.5 25.8 100.0 2,253
Nyarugenge 9.4 39.5 15.8 18.8 6.0 11.1 2.8 6.0 100.0 60
Gasabo 10.5 24.1 13.3 26.8 10.8 6.5 3.3 15.3 100.0 99
Kicukiro 6.2 39.3 4.5 13.1 5.3 6.8 0.0 31.0 100.0 64
Nyanza 13.6 1.9 9.5 36.9 23.5 9.1 1.3 17.9 100.0 67
Gisagara 22.7 0.0 4.7 22.1 28.4 20.7 6.1 17.9 100.0 74
Nyaruguru 14.2 0.7 7.4 30.7 18.5 7.6 1.2 33.9 100.0 61
Huye 13.9 6.7 9.1 34.2 28.1 12.3 0.7 9.0 100.0 70
Nyamagabe 15.7 2.5 6.6 27.4 16.0 14.9 1.1 31.6 100.0 71
Ruhango 12.2 0.9 9.9 29.0 11.9 6.7 0.5 41.3 100.0 71
Muhanga 9.6 4.1 14.9 43.2 18.4 3.1 0.5 15.8 100.0 63
Kamonyi 15.9 0.2 6.9 30.5 14.4 11.4 2.4 34.1 100.0 72
Karongi 14.1 1.6 11.6 33.6 17.9 7.6 2.5 25.3 100.0 77
Rutsiro 17.4 0.2 6.3 23.6 16.8 9.8 3.0 40.4 100.0 69
Rubavu 12.8 12.4 13.9 38.0 16.1 8.6 4.4 6.6 100.0 82
Nyabihu 12.0 0.1 14.0 37.5 21.2 6.9 0.0 20.4 100.0 68
Ngororero 14.4 0.0 5.6 30.4 18.3 8.0 1.5 36.3 100.0 74
Rusizi 10.6 6.1 17.1 30.9 11.4 5.8 1.5 27.2 100.0 78
Nya-masheke 11.9 3.3 8.0 37.4 15.8 7.4 0.6 27.4 100.0 80
Rulindo 14.7 0.2 12.1 28.3 20.3 12.9 1.0 25.4 100.0 63
Gakenke 15.3 0.6 7.5 33.2 20.7 11.3 1.2 25.4 100.0 76
Musanze 9.7 6.5 17.0 27.9 17.3 4.9 0.3 26.0 100.0 87
Burera 18.2 0.4 6.7 28.8 19.9 18.0 3.0 23.2 100.0 71
Gicumbi 20.4 9.0 4.9 25.6 21.8 22.3 5.8 10.5 100.0 113
Rwamaga-na 14.8 6.1 9.6 31.2 20.5 12.2 2.4 18.0 100.0 68
Nyagatare 17.6 3.1 7.3 12.5 10.0 7.1 2.4 57.7 100.0 84
Gatsibo 14.2 0.7 13.5 29.4 18.8 8.1 1.8 27.7 100.0 100
Kayonza 16.1 1.6 9.7 33.0 14.8 9.1 3.8 28.0 100.0 70
Kirehe 26.0 0.2 7.2 16.9 11.2 16.1 10.0 38.5 100.0 72
Ngoma 16.3 1.4 13.1 27.0 11.5 10.1 4.4 32.5 100.0 68
Bugesera 13.5 2.3 16.2 25.0 14.9 9.7 2.2 29.6 100.0 80
EICV3 DISTRICT PROFILE - Gicumbi48
Table A.7 Sanitation
Total improved sanitation
Improved sanitation Total no. of HHs (000s)Flush toilet
Pit latrine with solid
slab
Pit latrine without slab Other No toilet
facilities
All Rwanda 74.5 1.7 72.8 19.4 0.0 6.1 2,253
Nyarugenge 92.0 7.1 84.9 6.9 0.2 0.8 60
Gasabo 74.3 7.1 67.2 23.6 0.0 2.1 99
Kicukiro 89.0 10.5 78.5 9.8 0.0 1.3 64
Nyanza 88.6 0.8 87.8 6.5 0.0 5.0 67
Gisagara 44.4 0.2 44.2 47.1 0.0 8.4 74
Nyaruguru 51.2 0.2 50.9 44.3 0.0 4.5 61
Huye 54.7 2.8 51.9 40.4 0.0 4.9 70
Nyamagabe 70.2 0.0 70.2 19.7 0.0 10.0 71
Ruhango 72.9 0.6 72.3 19.8 0.0 7.3 71
Muhanga 76.0 0.5 75.5 22.2 0.0 1.8 63
Kamonyi 72.3 0.0 72.3 23.4 0.0 4.2 72
Karongi 76.6 0.1 76.4 15.4 0.0 8.1 77
Rutsiro 63.4 1.3 62.0 24.8 0.3 11.6 69
Rubavu 80.1 2.3 77.8 4.1 0.2 15.6 82
Nyabihu 70.4 1.8 68.6 20.7 0.0 8.9 68
Ngororero 90.2 0.0 90.2 5.4 0.0 4.4 74
Rusizi 85.1 1.6 83.5 12.6 0.0 2.3 78
Nyamasheke 85.9 0.2 85.7 7.5 0.0 6.7 80
Rulindo 82.6 0.0 82.6 14.3 0.0 3.1 63
Gakenke 86.2 0.4 85.7 8.9 0.0 5.0 76
Musanze 51.7 3.2 48.5 39.7 0.0 8.5 87
Burera 78.4 0.2 78.2 17.2 0.0 4.4 71
Gicumbi 76.0 4.2 71.8 13.0 0.2 10.8 113
Rwamagana 62.0 1.1 60.8 35.2 0.0 2.8 68
Nyagatare 92.8 0.8 91.9 2.6 0.0 4.6 84
Gatsibo 67.4 0.0 67.4 29.6 0.0 3.0 100
Kayonza 66.3 0.3 66.0 27.8 0.0 5.9 70
Kirehe 75.2 0.1 75.0 16.2 0.0 8.6 72
Ngoma 78.7 1.1 77.6 14.3 0.0 7.1 68
Bugesera 80.5 0.7 79.8 11.4 0.2 7.9 80

EICV3 DISTRICT PROFILE - Gicumbi 49
Table A.8 Main flooring material of the dwelling
Floor materialTotal Total no. of
HHs (000s)Beaten earth Cement Bricks Hardened dung Other
All Rwanda 78.4 17.1 1.5 2.2 0.8 100.0 2,253
Nyarugenge 30.9 66.0 1.3 0.5 1.3 100.0 60
Gasabo 43.1 50.3 0.2 0.7 5.7 100.0 99
Kicukiro 25.3 69.3 0.9 0.0 4.6 100.0 64
Nyanza 83.7 13.4 1.2 1.3 0.4 100.0 67
Gisagara 84.8 9.3 4.6 1.0 0.2 100.0 74
Nyaruguru 86.9 7.4 2.2 3.5 0.0 100.0 61
Huye 72.2 19.7 5.3 2.4 0.5 100.0 70
Nyamagabe 91.1 7.8 1.1 0.0 0.0 100.0 71
Ruhango 79.8 15.3 4.3 0.5 0.0 100.0 71
Muhanga 79.7 14.4 5.5 0.4 0.0 100.0 63
Kamonyi 78.1 20.6 0.4 0.0 0.8 100.0 72
Karongi 91.4 6.4 1.9 0.0 0.4 100.0 77
Rutsiro 88.7 4.1 6.3 0.4 0.4 100.0 69
Rubavu 74.5 22.1 1.4 0.2 1.7 100.0 82
Nyabihu 89.2 10.8 0.0 0.0 0.0 100.0 68
Ngororero 93.8 4.7 1.3 0.0 0.2 100.0 74
Rusizi 83.0 12.8 3.0 0.0 1.2 100.0 78
Nyamasheke 86.7 9.3 2.5 0.0 1.4 100.0 80
Rulindo 86.0 12.3 1.0 0.2 0.4 100.0 63
Gakenke 91.2 5.5 1.9 0.0 1.4 100.0 76
Musanze 85.1 14.5 0.0 0.0 0.3 100.0 87
Burera 93.9 5.5 0.6 0.0 0.0 100.0 71
Gicumbi 83.5 15.4 0.0 0.2 0.9 100.0 113
Rwamagana 72.9 21.0 0.4 5.6 0.0 100.0 68
Nyagatare 76.5 18.6 0.2 4.7 0.0 100.0 84
Gatsibo 82.0 13.1 0.0 4.9 0.0 100.0 100
Kayonza 81.8 13.9 0.0 3.8 0.5 100.0 70
Kirehe 76.1 5.3 0.1 18.3 0.2 100.0 72
Ngoma 72.3 8.5 0.9 18.1 0.2 100.0 68
Bugesera 81.6 17.7 0.5 0.2 0.0 100.0 80
EICV3 DISTRICT PROFILE - Gicumbi50
Table A.9 Main wall material of the dwelling
Wall material
Total Total no. of HHs (000s)Mud bricks
Mud bricks covered
with cement
Tree trunks with mud
Tree trunks with mud
and cement
Oven-fired bricks Other
All Rwanda 36.1 18.7 35.2 5.5 2.5 1.9 100.0 2,253
Nyarugenge 9.6 39.9 19.0 23.8 6.6 1.1 100.0 60
Gasabo 8.0 46.4 24.0 12.7 5.2 3.7 100.0 99
Kicukiro 12.5 65.7 6.3 8.5 4.2 2.8 100.0 64
Nyanza 27.8 19.6 43.6 7.8 0.7 0.4 100.0 67
Gisagara 10.2 9.6 70.0 10.1 0.2 0.0 100.0 74
Nyaruguru 11.9 7.7 76.2 3.1 1.2 0.0 100.0 61
Huye 17.1 20.1 46.8 11.5 4.3 0.3 100.0 70
Nyamagabe 12.1 3.4 76.7 6.7 1.0 0.0 100.0 71
Ruhango 56.0 32.9 8.7 1.8 0.4 0.2 100.0 71
Muhanga 66.1 19.3 7.3 0.7 6.6 0.0 100.0 63
Kamonyi 37.5 35.7 19.4 6.5 0.7 0.2 100.0 72
Karongi 76.8 7.7 15.1 0.0 0.4 0.0 100.0 77
Rutsiro 85.4 10.4 3.5 0.0 0.4 0.2 100.0 69
Rubavu 50.8 24.1 12.9 0.3 2.3 9.5 100.0 82
Nyabihu 55.8 14.1 24.6 1.6 1.8 2.1 100.0 68
Ngororero 83.9 9.9 5.8 0.0 0.4 0.0 100.0 74
Rusizi 11.6 2.0 67.6 4.7 7.9 6.3 100.0 78
Nyamasheke 37.2 10.9 37.2 2.1 2.4 10.2 100.0 80
Rulindo 41.8 16.2 33.4 5.5 3.1 0.0 100.0 63
Gakenke 73.7 13.3 9.6 0.0 2.3 1.0 100.0 76
Musanze 32.0 10.2 42.6 3.3 4.4 7.4 100.0 87
Burera 43.5 4.0 43.8 2.4 0.8 5.4 100.0 71
Gicumbi 29.2 19.2 42.0 4.2 5.4 0.0 100.0 113
Rwamagana 11.9 19.6 50.6 13.5 3.5 0.8 100.0 68
Nyagatare 52.2 32.8 10.3 2.1 2.5 0.1 100.0 84
Gatsibo 25.3 14.5 50.7 9.0 0.5 0.0 100.0 100
Kayonza 25.7 14.0 51.4 7.9 0.5 0.5 100.0 70
Kirehe 38.6 7.3 47.3 5.2 0.7 0.9 100.0 72
Ngoma 4.7 2.3 83.7 7.6 1.7 0.0 100.0 68
Bugesera 38.9 27.1 27.0 5.9 0.3 0.9 100.0 80

EICV3 DISTRICT PROFILE - Gicumbi 51
Table A.10 Main source of lighting
Primary source of lighting
TotalTotal no.
of HHs (000s)
Electricity distribu-
torsOil lamp Firewood Candle Lantern Battery Other
All Rwanda 10.8 9.7 8.8 5.9 34.7 28.6 1.5 100.0 2,253
Nyarugenge 61.6 9.2 1.0 11.7 13.8 2.1 0.6 100.0 60
Gasabo 47.3 8.1 1.2 15.2 15.6 10.8 1.8 100.0 99
Kicukiro 63.0 12.4 0.0 9.6 11.0 3.5 0.6 100.0 64
Nyanza 2.9 9.7 4.2 2.2 52.6 27.4 1.2 100.0 67
Gisagara 0.3 4.0 14.7 2.4 29.4 48.9 0.4 100.0 74
Nyaruguru 0.7 4.4 43.0 7.8 14.3 28.6 1.1 100.0 61
Huye 8.3 7.5 9.7 5.6 46.7 22.2 0.0 100.0 70
Nyamagabe 2.7 7.6 24.9 9.1 19.6 30.6 5.5 100.0 71
Ruhango 2.6 10.7 8.0 1.5 57.0 19.6 0.6 100.0 71
Muhanga 5.5 4.9 4.5 1.7 56.8 26.3 0.3 100.0 63
Kamonyi 3.5 8.2 1.4 1.7 64.1 18.6 2.3 100.0 72
Karongi 2.8 9.4 27.3 5.4 18.7 33.7 2.6 100.0 77
Rutsiro 0.4 9.6 12.1 8.8 22.4 44.0 2.8 100.0 69
Rubavu 21.0 10.8 5.3 12.0 22.6 26.8 1.5 100.0 82
Nyabihu 10.0 6.5 15.6 6.6 33.7 26.5 1.2 100.0 68
Ngororero 0.4 9.9 19.1 2.3 27.5 40.6 0.2 100.0 74
Rusizi 13.5 33.2 6.5 3.0 16.9 24.8 2.1 100.0 78
Nyamasheke 7.7 22.1 13.8 4.2 24.9 25.8 1.5 100.0 80
Rulindo 2.6 6.9 5.0 10.2 23.1 50.9 1.3 100.0 63
Gakenke 1.0 4.8 9.9 2.1 29.9 52.0 0.4 100.0 76
Musanze 14.5 2.1 6.1 5.6 40.7 30.4 0.7 100.0 87
Burera 3.2 6.0 14.2 7.0 31.8 36.7 1.2 100.0 71
Gicumbi 8.9 5.3 9.0 9.8 27.2 37.2 2.5 100.0 113
Rwamagana 9.8 18.9 0.4 5.1 44.4 19.3 2.1 100.0 68
Nyagatare 11.0 16.1 2.1 4.0 25.3 40.7 0.8 100.0 84
Gatsibo 2.5 6.9 0.9 5.6 41.3 41.7 1.1 100.0 100
Kayonza 7.5 7.5 2.3 1.7 69.8 10.5 0.7 100.0 70
Kirehe 1.6 9.0 0.9 1.5 64.8 21.9 0.4 100.0 72
Ngoma 3.4 5.2 1.7 1.3 76.1 11.7 0.6 100.0 68
Bugesera 4.3 13.8 5.8 7.4 31.9 31.9 4.8 100.0 80
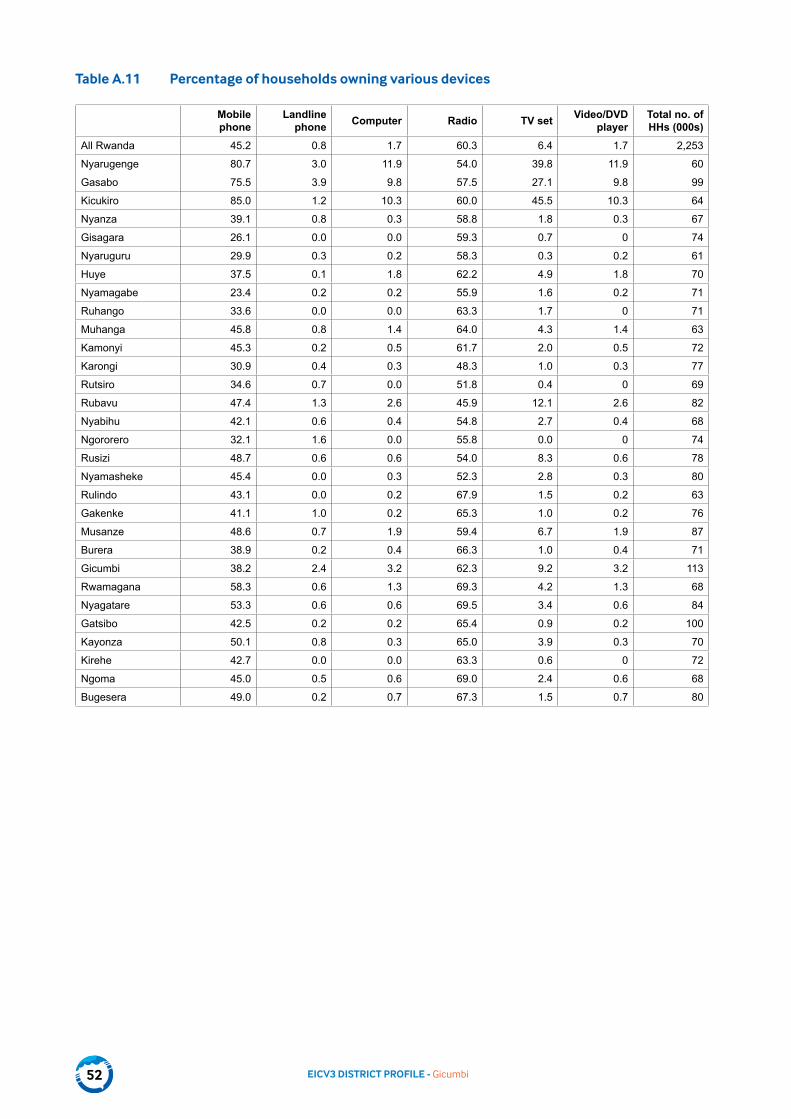
EICV3 DISTRICT PROFILE - Gicumbi52
Table A.11 Percentage of households owning various devices
Mobile phone
Landline phone Computer Radio TV set Video/DVD
playerTotal no. of HHs (000s)
All Rwanda 45.2 0.8 1.7 60.3 6.4 1.7 2,253
Nyarugenge 80.7 3.0 11.9 54.0 39.8 11.9 60
Gasabo 75.5 3.9 9.8 57.5 27.1 9.8 99
Kicukiro 85.0 1.2 10.3 60.0 45.5 10.3 64
Nyanza 39.1 0.8 0.3 58.8 1.8 0.3 67
Gisagara 26.1 0.0 0.0 59.3 0.7 0 74
Nyaruguru 29.9 0.3 0.2 58.3 0.3 0.2 61
Huye 37.5 0.1 1.8 62.2 4.9 1.8 70
Nyamagabe 23.4 0.2 0.2 55.9 1.6 0.2 71
Ruhango 33.6 0.0 0.0 63.3 1.7 0 71
Muhanga 45.8 0.8 1.4 64.0 4.3 1.4 63
Kamonyi 45.3 0.2 0.5 61.7 2.0 0.5 72
Karongi 30.9 0.4 0.3 48.3 1.0 0.3 77
Rutsiro 34.6 0.7 0.0 51.8 0.4 0 69
Rubavu 47.4 1.3 2.6 45.9 12.1 2.6 82
Nyabihu 42.1 0.6 0.4 54.8 2.7 0.4 68
Ngororero 32.1 1.6 0.0 55.8 0.0 0 74
Rusizi 48.7 0.6 0.6 54.0 8.3 0.6 78
Nyamasheke 45.4 0.0 0.3 52.3 2.8 0.3 80
Rulindo 43.1 0.0 0.2 67.9 1.5 0.2 63
Gakenke 41.1 1.0 0.2 65.3 1.0 0.2 76
Musanze 48.6 0.7 1.9 59.4 6.7 1.9 87
Burera 38.9 0.2 0.4 66.3 1.0 0.4 71
Gicumbi 38.2 2.4 3.2 62.3 9.2 3.2 113
Rwamagana 58.3 0.6 1.3 69.3 4.2 1.3 68
Nyagatare 53.3 0.6 0.6 69.5 3.4 0.6 84
Gatsibo 42.5 0.2 0.2 65.4 0.9 0.2 100
Kayonza 50.1 0.8 0.3 65.0 3.9 0.3 70
Kirehe 42.7 0.0 0.0 63.3 0.6 0 72
Ngoma 45.0 0.5 0.6 69.0 2.4 0.6 68
Bugesera 49.0 0.2 0.7 67.3 1.5 0.7 80

EICV3 DISTRICT PROFILE - Gicumbi 53
Table A.12 Mean walking distance to basic services (in minutes): Primary school
EICV3Mean time to service (minutes)
Time to service (minutes)
TotalTotal no.
of HHs (000s)0–29 min 30–59 min 60–119
min 120+ minFrequency of use not
known
All Rwanda 27.2 54.7 34.3 10.1 0.7 0.1 100.0 2,253
Nyarugenge 17.3 82.5 14.2 3.1 0.0 0.2 100.0 60
Gasabo 25.5 59.1 32.9 7.4 0.6 0.0 100.0 99
Kicukiro 16.5 80.7 16.2 2.9 0.0 0.2 100.0 64
Nyanza 25.7 55.6 39.4 5.0 0.0 0.0 100.0 67
Gisagara 35.5 34.5 45.8 18.9 0.8 0.0 100.0 74
Nyaruguru 28.5 51.2 36.7 11.3 0.8 0.0 100.0 61
Huye 23.0 63.8 32.1 3.8 0.4 0.0 100.0 70
Nyamagabe 31.0 42.8 44.2 12.5 0.4 0.0 100.0 71
Ruhango 30.1 46.0 40.0 12.9 1.2 0.0 100.0 71
Muhanga 26.4 52.6 38.2 9.2 0.0 0.0 100.0 63
Kamonyi 25.7 53.8 39.8 5.5 0.2 0.6 100.0 72
Karongi 24.6 59.8 30.3 9.8 0.2 0.0 100.0 77
Rutsiro 29.0 48.9 37.8 12.7 0.6 0.0 100.0 69
Rubavu 19.9 75.1 19.5 5.4 0.0 0.0 100.0 82
Nyabihu 28.7 47.8 44.6 7.4 0.0 0.2 100.0 68
Ngororero 32.1 42.5 40.8 16.3 0.4 0.0 100.0 74
Rusizi 21.2 65.1 31.3 3.7 0.0 0.0 100.0 78
Nyamasheke 25.4 59.5 31.7 8.4 0.4 0.0 100.0 80
Rulindo 28.9 45.5 42.6 11.4 0.2 0.2 100.0 63
Gakenke 30.9 41.2 46.6 11.4 0.6 0.2 100.0 76
Musanze 21.6 67.7 29.8 2.5 0.0 0.0 100.0 87
Burera 24.3 62.8 27.2 8.3 0.4 1.3 100.0 71
Gicumbi 37.1 39.7 32.6 24.5 3.3 0.0 100.0 113
Rwamagana 26.6 50.7 40.3 7.9 1.0 0.0 100.0 68
Nyagatare 34.4 43.8 35.1 17.3 3.8 0.0 100.0 84
Gatsibo 24.2 62.5 31.6 5.4 0.5 0.0 100.0 100
Kayonza 29.7 52.1 36.1 10.6 1.2 0.0 100.0 70
Kirehe 34.6 41.9 35.9 21.3 0.9 0.0 100.0 72
Ngoma 24.4 62.8 30.6 5.9 0.5 0.2 100.0 68
Bugesera 28.4 54.2 29.9 14.1 1.5 0.3 100.0 80
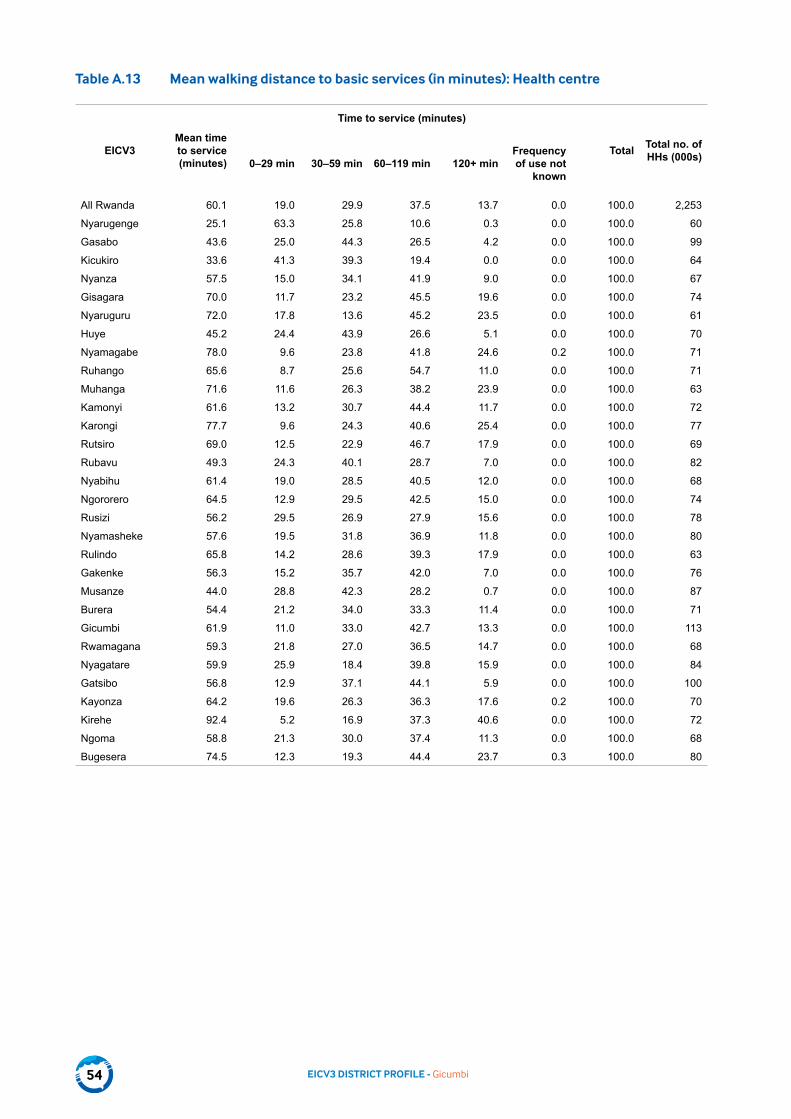
EICV3 DISTRICT PROFILE - Gicumbi54
Table A.13 Mean walking distance to basic services (in minutes): Health centre
EICV3Mean time to service (minutes)
Time to service (minutes)
Total Total no. of HHs (000s)0–29 min 30–59 min 60–119 min 120+ min
Frequency of use not
known
All Rwanda 60.1 19.0 29.9 37.5 13.7 0.0 100.0 2,253
Nyarugenge 25.1 63.3 25.8 10.6 0.3 0.0 100.0 60
Gasabo 43.6 25.0 44.3 26.5 4.2 0.0 100.0 99
Kicukiro 33.6 41.3 39.3 19.4 0.0 0.0 100.0 64
Nyanza 57.5 15.0 34.1 41.9 9.0 0.0 100.0 67
Gisagara 70.0 11.7 23.2 45.5 19.6 0.0 100.0 74
Nyaruguru 72.0 17.8 13.6 45.2 23.5 0.0 100.0 61
Huye 45.2 24.4 43.9 26.6 5.1 0.0 100.0 70
Nyamagabe 78.0 9.6 23.8 41.8 24.6 0.2 100.0 71
Ruhango 65.6 8.7 25.6 54.7 11.0 0.0 100.0 71
Muhanga 71.6 11.6 26.3 38.2 23.9 0.0 100.0 63
Kamonyi 61.6 13.2 30.7 44.4 11.7 0.0 100.0 72
Karongi 77.7 9.6 24.3 40.6 25.4 0.0 100.0 77
Rutsiro 69.0 12.5 22.9 46.7 17.9 0.0 100.0 69
Rubavu 49.3 24.3 40.1 28.7 7.0 0.0 100.0 82
Nyabihu 61.4 19.0 28.5 40.5 12.0 0.0 100.0 68
Ngororero 64.5 12.9 29.5 42.5 15.0 0.0 100.0 74
Rusizi 56.2 29.5 26.9 27.9 15.6 0.0 100.0 78
Nyamasheke 57.6 19.5 31.8 36.9 11.8 0.0 100.0 80
Rulindo 65.8 14.2 28.6 39.3 17.9 0.0 100.0 63
Gakenke 56.3 15.2 35.7 42.0 7.0 0.0 100.0 76
Musanze 44.0 28.8 42.3 28.2 0.7 0.0 100.0 87
Burera 54.4 21.2 34.0 33.3 11.4 0.0 100.0 71
Gicumbi 61.9 11.0 33.0 42.7 13.3 0.0 100.0 113
Rwamagana 59.3 21.8 27.0 36.5 14.7 0.0 100.0 68
Nyagatare 59.9 25.9 18.4 39.8 15.9 0.0 100.0 84
Gatsibo 56.8 12.9 37.1 44.1 5.9 0.0 100.0 100
Kayonza 64.2 19.6 26.3 36.3 17.6 0.2 100.0 70
Kirehe 92.4 5.2 16.9 37.3 40.6 0.0 100.0 72
Ngoma 58.8 21.3 30.0 37.4 11.3 0.0 100.0 68
Bugesera 74.5 12.3 19.3 44.4 23.7 0.3 100.0 80
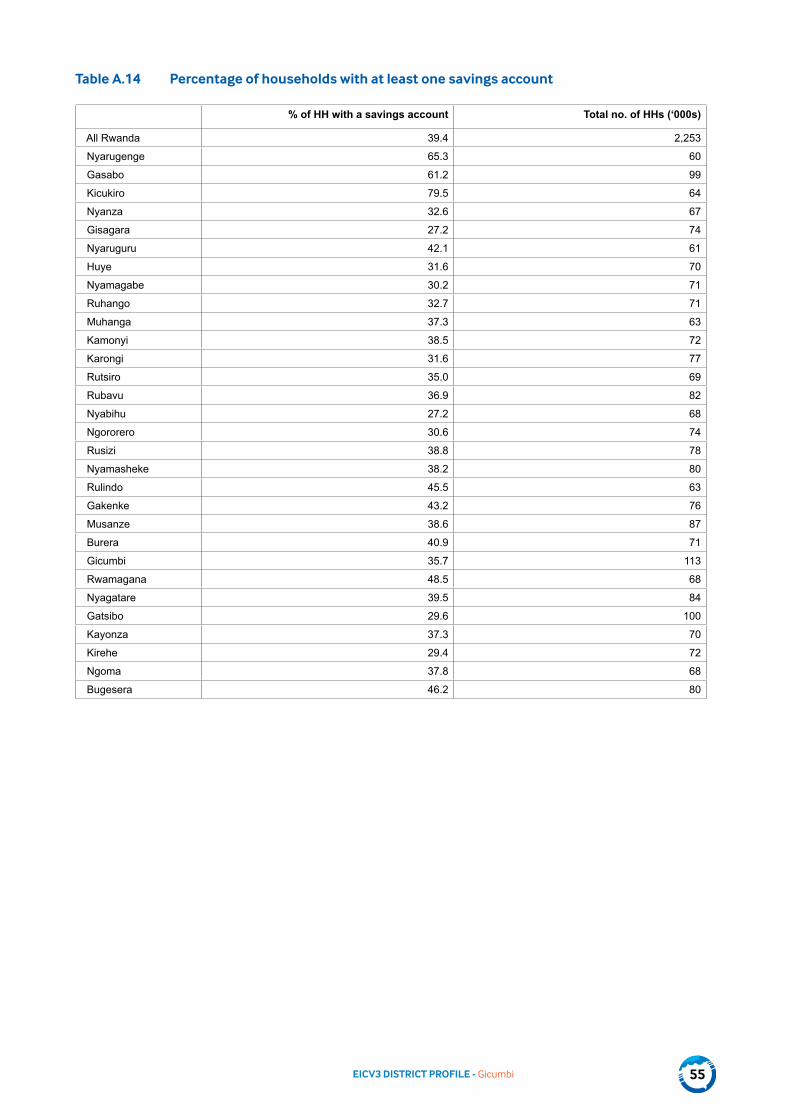
EICV3 DISTRICT PROFILE - Gicumbi 55
Table A.14 Percentage of households with at least one savings account
% of HH with a savings account Total no. of HHs (‘000s)
All Rwanda 39.4 2,253
Nyarugenge 65.3 60
Gasabo 61.2 99
Kicukiro 79.5 64
Nyanza 32.6 67
Gisagara 27.2 74
Nyaruguru 42.1 61
Huye 31.6 70
Nyamagabe 30.2 71
Ruhango 32.7 71
Muhanga 37.3 63
Kamonyi 38.5 72
Karongi 31.6 77
Rutsiro 35.0 69
Rubavu 36.9 82
Nyabihu 27.2 68
Ngororero 30.6 74
Rusizi 38.8 78
Nyamasheke 38.2 80
Rulindo 45.5 63
Gakenke 43.2 76
Musanze 38.6 87
Burera 40.9 71
Gicumbi 35.7 113
Rwamagana 48.5 68
Nyagatare 39.5 84
Gatsibo 29.6 100
Kayonza 37.3 70
Kirehe 29.4 72
Ngoma 37.8 68
Bugesera 46.2 80

EICV3 DISTRICT PROFILE - Gicumbi56
A.4 Economic activity and income
Table A.15 Economic activity: Employment, unemployment, and economic inactivity among persons aged 16 and above (12-month period)
Employment rate Unemployment rate Inactivity rate All population aged 16+ (000s)
All Rwanda 84.2 0.9 15.0 5,888
Nyarugenge 71.3 9.0 21.7 173
Gasabo 78.0 5.3 17.7 280
Kicukiro 77.9 4.7 18.3 186
Nyanza 82.2 0.4 17.4 167
Gisagara 86.9 0.2 12.9 184
Nyaruguru 84.6 0.0 15.4 160
Huye 80.2 0.6 19.3 181
Nyamagabe 86.3 0.2 13.5 178
Ruhango 88.0 0.3 11.8 170
Muhanga 86.4 0.3 13.4 167
Kamonyi 81.8 0.0 18.2 185
Karongi 83.3 0.4 16.4 196
Rutsiro 86.3 0.0 13.7 170
Rubavu 79.6 2.0 18.7 213
Nyabihu 82.0 0.1 17.9 177
Ngororero 92.7 0.0 7.3 182
Rusizi 77.9 0.6 21.6 235
Nyamasheke 86.7 0.0 13.3 215
Rulindo 88.5 0.1 11.5 160
Gakenke 89.1 0.4 10.6 193
Musanze 84.7 0.4 15.0 225
Burera 93.9 0.2 5.9 186
Gicumbi 85.9 0.7 13.5 321
Rwamagana 83.9 0.3 15.8 178
Nyagatare 84.8 0.2 15.0 212
Gatsibo 84.3 0.1 15.7 258
Kayonza 85.7 0.0 14.3 177
Kirehe 87.2 0.2 12.6 175
Ngoma 86.1 0.0 13.9 174
Bugesera 85.4 0.3 14.4 204

EICV3 DISTRICT PROFILE - Gicumbi 57
Table A.16 Employment type (usual main job)
Wage farm Wage non-farm
Independent farmer
Independent non-farm
Unpaid non-farm, other
and n.i.
Total All 16+ usu-ally working
(000s)All Rwanda 9.9 16.9 61.8 9.7 1.8 100.0 4,960
Nyarugenge 2.7 53.0 14.3 25.2 4.8 100.0 123
Gasabo 5.1 47.9 25.3 17.9 3.9 100.0 219
Kicukiro 3.7 60.5 14.1 18.2 3.5 100.0 145
Nyanza 10.9 11.0 71.4 6.2 0.7 100.0 138
Gisagara 15.5 6.9 70.5 5.9 1.2 100.0 160
Nyaruguru 9.3 10.7 71.6 6.3 2.0 100.0 136
Huye 8.7 16.8 66.3 7.3 0.9 100.0 145
Nyamagabe 12.5 13.3 64.3 8.8 1.1 100.0 154
Ruhango 11.7 7.6 70.9 7.6 2.3 100.0 150
Muhanga 3.8 12.8 74.5 7.8 1.1 100.0 145
Kamonyi 5.6 13.7 71.6 7.9 1.1 100.0 151
Karongi 11.5 9.2 73.7 4.4 1.1 100.0 164
Rutsiro 14.1 13.1 62.7 8.0 2.0 100.0 147
Rubavu 11.1 23.9 37.8 23.8 3.4 100.0 170
Nyabihu 22.7 10.9 51.2 13.4 1.9 100.0 145
Ngororero 9.0 11.3 71.4 7.0 1.2 100.0 169
Rusizi 7.1 16.4 60.0 14.0 2.5 100.0 183
Nyamasheke 14.0 18.9 56.1 9.1 1.8 100.0 187
Rulindo 15.2 15.8 61.9 6.0 1.1 100.0 142
Gakenke 6.6 11.2 75.1 6.7 0.4 100.0 172
Musanze 9.8 21.6 57.4 10.7 0.5 100.0 191
Burera 14.3 10.9 64.9 8.7 1.2 100.0 175
Gicumbi 8.9 16.5 66.6 7.2 0.8 100.0 276
Rwamagana 6.5 12.9 68.1 9.8 2.7 100.0 149
Nyagatare 13.2 10.1 66.5 7.4 2.7 100.0 180
Gatsibo 12.3 8.9 72.2 5.7 0.9 100.0 217
Kayonza 6.4 10.7 71.1 9.3 2.6 100.0 152
Kirehe 8.5 7.0 77.3 5.6 1.6 100.0 153
Ngoma 6.9 9.3 73.5 8.3 2.0 100.0 150
Bugesera 8.4 13.8 68.5 7.5 1.9 100.0 174

EICV3 DISTRICT PROFILE - Gicumbi58
Tabl
e A
.17
Indu
stry
of u
sual
mai
n jo
b
Agr
icul
ture
, fis
hing
, fo
rest
ry
Min
ing
and
quar
ryin
gM
anu-
fact
ur-
ing
Con
stru
ct-
ion
Trad
e
Tran
spor
t an
d co
mm
u-ni
c-at
ions
Gov
ern-
m
ent
Rec
re-a
tion
and
tour
ism
Oth
er s
ervi
ces
(incl
udin
g ut
ili-
ties
and
finan
cial
se
rvic
es)
Inad
equ-
atel
y de
scrib
edTo
tal
Tota
l no.
of
wor
king
per
-so
ns 1
6+A
ll R
wan
da72
.51.
02.
32.
98.
91.
84.
30.
54.
71.
110
0.0
4,96
0
Nya
ruge
nge
17.1
1.0
7.1
4.7
26.2
6.6
12.1
2.5
20.0
2.7
100.
012
3
Gas
abo
31.4
1.1
4.0
7.0
17.1
6.0
11.3
1.5
18.5
2.2
100.
021
9
Kic
ukiro
18.6
0.4
4.7
6.8
18.9
5.7
14.2
1.8
26.5
2.4
100.
014
5
Nya
nza
82.9
0.0
0.8
2.4
5.6
2.1
2.4
0.4
2.8
0.6
100.
013
8
Gis
agar
a86
.00.
61.
81.
15.
00.
62.
90.
21.
10.
610
0.0
160
Nya
rugu
ru81
.20.
62.
01.
66.
01.
13.
20.
33.
40.
810
0.0
136
Huy
e75
.60.
01.
81.
96.
61.
55.
21.
05.
31.
010
0.0
145
Nya
mag
abe
78.2
0.7
6.4
1.3
5.8
0.6
2.5
0.7
3.3
0.7
100.
015
4
Ruh
ango
83.2
0.2
2.1
1.2
5.8
1.9
1.4
0.0
2.6
1.8
100.
015
0
Muh
anga
78.5
1.2
1.6
2.1
7.3
1.7
1.9
0.2
5.1
0.6
100.
014
5
Kam
onyi
77.3
1.2
1.2
4.2
6.9
2.2
3.5
0.0
3.2
0.2
100.
015
1
Kar
ongi
86.4
0.7
0.5
1.6
3.8
1.3
2.9
0.2
2.3
0.3
100.
016
4
Rut
siro
78.0
1.4
1.1
2.6
8.1
1.0
2.7
1.0
1.7
2.5
100.
014
7
Rub
avu
50.4
1.1
4.0
5.0
23.6
3.6
5.1
0.3
6.2
0.9
100.
017
0
Nya
bihu
73.9
0.5
1.4
2.8
11.3
0.3
3.5
0.4
4.0
1.9
100.
014
5
Ngo
rore
ro81
.31.
62.
43.
14.
21.
62.
90.
41.
21.
210
0.0
169
Rus
izi
69.7
0.2
1.5
2.9
13.7
2.7
4.3
0.1
3.8
1.1
100.
018
3
Nya
mas
heke
72.9
0.2
1.4
3.3
13.4
0.2
3.8
0.7
2.5
1.7
100.
018
7
Rul
indo
76.8
5.3
2.3
4.1
5.6
1.6
1.5
0.0
1.6
1.3
100.
014
2
Gak
enke
82.5
2.1
0.8
1.7
5.1
1.0
3.6
0.4
1.6
1.3
100.
017
2
Mus
anze
67.1
1.0
2.7
6.2
7.9
2.9
4.4
0.7
6.5
0.7
100.
019
1
Bur
era
80.2
1.4
2.4
1.9
8.8
0.4
3.3
0.4
1.0
0.3
100.
017
5
Gic
umbi
75.9
2.0
2.2
3.2
7.3
0.8
4.8
0.4
2.5
1.0
100.
027
6
Rw
amag
ana
76.0
0.5
2.1
3.5
8.2
1.3
3.7
0.0
3.0
1.7
100.
014
9
Nya
gata
re79
.60.
12.
41.
87.
41.
23.
50.
02.
91.
010
0.0
180
Gat
sibo
84.9
0.5
0.7
1.2
5.0
0.8
3.0
0.0
3.5
0.2
100.
021
7
Kay
onza
79.0
1.5
1.6
1.6
9.8
1.5
2.7
0.5
1.5
0.4
100.
015
2
Kire
he88
.30.
01.
80.
14.
90.
73.
10.
10.
70.
310
0.0
153
Ngo
ma
81.5
0.5
2.6
1.3
5.6
1.3
4.0
0.0
2.6
0.7
100.
015
0
Bug
eser
a77
.81.
31.
44.
74.
81.
93.
20.
63.
01.
510
0.0
174

EICV3 DISTRICT PROFILE - Gicumbi 59
Table A.18 Hours worked in all jobs in the previous seven days
District 1 to 5 hours 6 to 15 hours 16 to 25 hours
26 to 35 hours
36 to 45 hours
46 or more hours
Total
All Rwanda 5.9% 18.6% 23.0% 20.3% 13.3% 18.9% 100.0%
Nyarugenge 2.4% 7.8% 10.2% 9.6% 14.2% 55.9% 100.0%
Gasabo 3.0% 12.6% 12.6% 13.1% 12.0% 46.6% 100.0%
Kicukiro 3.3% 9.3% 7.6% 5.9% 12.0% 61.9% 100.0%
Nyanza 9.5% 22.4% 25.4% 22.5% 11.3% 8.9% 100.0%
Gisagara 4.7% 22.9% 33.7% 19.2% 9.7% 9.8% 100.0%
Nyaruguru 8.0% 20.6% 26.9% 19.4% 11.8% 13.2% 100.0%
Huye 5.9% 16.6% 24.0% 23.0% 13.3% 17.3% 100.0%
Nyamagabe 5.4% 16.7% 25.2% 25.0% 15.9% 11.9% 100.0%
Ruhango 8.5% 18.4% 22.8% 22.4% 14.3% 13.6% 100.0%
Muhanga 7.3% 19.9% 29.4% 20.7% 9.3% 13.4% 100.0%
Kamonyi 6.9% 21.7% 28.1% 18.9% 11.8% 12.6% 100.0%
Karongi 4.7% 18.1% 26.2% 20.3% 14.2% 16.3% 100.0%
Rutsiro 5.9% 20.6% 21.2% 21.9% 16.0% 14.4% 100.0%
Rubavu 5.3% 17.2% 14.4% 18.6% 15.9% 28.7% 100.0%
Nyabihu 5.1% 17.9% 20.1% 21.4% 16.1% 19.3% 100.0%
Ngororero 6.8% 18.2% 24.2% 20.4% 13.8% 16.6% 100.0%
Rusizi 3.6% 14.8% 19.4% 22.1% 18.4% 21.7% 100.0%
Nyamasheke 9.7% 20.2% 22.8% 18.6% 13.9% 14.8% 100.0%
Rulindo 5.0% 17.0% 26.1% 24.7% 12.2% 14.9% 100.0%
Gakenke 5.6% 20.2% 28.8% 24.4% 11.2% 9.9% 100.0%
Musanze 4.7% 19.5% 21.8% 19.0% 15.1% 20.0% 100.0%
Burera 8.2% 24.5% 18.5% 19.6% 13.0% 16.1% 100.0%
Gicumbi 6.1% 21.5% 25.5% 18.5% 11.1% 17.4% 100.0%
Rwamagana 6.1% 15.9% 25.0% 19.5% 15.9% 17.6% 100.0%
Nyagatare 3.9% 18.0% 23.5% 23.6% 14.3% 16.6% 100.0%
Gatsibo 4.7% 22.7% 28.1% 25.0% 10.1% 9.5% 100.0%
Kayonza 8.2% 21.9% 25.5% 21.3% 11.3% 11.8% 100.0%
Kirehe 5.7% 20.8% 24.7% 25.7% 13.2% 9.9% 100.0%
Ngoma 6.5% 16.8% 24.4% 22.0% 14.8% 15.5% 100.0%
Bugesera 6.2% 18.2% 20.5% 19.3% 15.2% 20.6% 100.0%

EICV3 DISTRICT PROFILE - Gicumbi60
Table A.19 Median number of hours spent on all domestic duties in last seven days, by all persons aged 16 and above (including working and non-working persons)
Male Female Total
All Rwanda 9 26 19
Nyarugenge 6 24 16
Gasabo 7 22 15
Kicukiro 5 30 19
Nyanza 12 24 19
Gisagara 12 32 23
Nyaruguru 11 26 19
Huye 10 26 20
Nyamagabe 10 26 20
Ruhango 10 31 23
Muhanga 11 28 20
Kamonyi 8 20 16
Karongi 13 33 23
Rutsiro 13 36 26
Rubavu 7 28 22
Nyabihu 8 24 18
Ngororero 11 26 20
Rusizi 13 32 23
Nyamasheke 7 25 18
Rulindo 9 22 16
Gakenke 10 21 16
Musanze 9 27 21
Burera 9 22 16
Gicumbi 8 21 16
Rwamagana 10 24 17
Nyagatare 7 21 15
Gatsibo 12 28 21
Kayonza 10 28 20
Kirehe 9 25 19
Ngoma 11 33 22
Bugesera 9 28 20

EICV3 DISTRICT PROFILE - Gicumbi 61
Table A.20 Income shares
Agriculture Wages Business income
Public transfers
Private transfers Rents Total Total no. of
HHs (000s)
All Rwanda 45.7% 25.3% 10.5% 3.2% 6.9% 8.4% 100.0% 2,253
Nyarugenge 9.1% 40.1% 28.1% 3.0% 10.7% 9.0% 100.0% 60
Gasabo 16.4% 42.2% 18.0% 2.1% 9.5% 11.8% 100.0% 99
Kicukiro 7.0% 50.3% 20.9% 2.4% 10.1% 9.3% 100.0% 64
Nyanza 52.4% 20.4% 9.3% 1.1% 7.3% 9.5% 100.0% 67
Gisagara 52.9% 21.8% 4.9% 7.0% 5.4% 8.1% 100.0% 74
Nyaruguru 49.9% 21.7% 6.8% 7.4% 5.6% 8.7% 100.0% 61
Huye 47.7% 27.9% 8.5% 0.7% 6.4% 8.7% 100.0% 70
Nyamagabe 42.8% 25.5% 7.3% 8.9% 8.2% 7.3% 100.0% 71
Ruhango 56.2% 22.4% -0.9% 0.8% 9.6% 11.8% 100.0% 71
Muhanga 55.1% 20.0% 8.0% 1.3% 7.1% 8.6% 100.0% 63
Kamonyi 54.5% 20.3% 9.8% 1.0% 5.7% 8.7% 100.0% 72
Karongi 51.2% 20.7% 5.3% 8.8% 8.3% 5.8% 100.0% 77
Rutsiro 49.4% 23.2% 12.7% 1.4% 6.9% 6.4% 100.0% 69
Rubavu 29.3% 27.1% 21.7% 6.4% 7.4% 8.2% 100.0% 82
Nyabihu 43.0% 25.7% 12.4% 6.7% 6.6% 5.6% 100.0% 68
Ngororero 53.9% 20.7% 7.5% 5.6% 6.4% 5.9% 100.0% 74
Rusizi 43.6% 22.8% 16.1% 1.0% 6.7% 9.8% 100.0% 78
Nyamasheke 44.3% 29.0% 8.5% 0.7% 9.1% 8.4% 100.0% 80
Rulindo 52.4% 23.5% 8.8% 3.0% 4.7% 7.6% 100.0% 63
Gakenke 56.5% 21.6% 7.0% 3.5% 6.1% 5.5% 100.0% 76
Musanze 46.1% 26.5% 10.2% 3.5% 6.9% 6.9% 100.0% 87
Burera 45.7% 25.6% 10.1% 5.9% 5.7% 7.0% 100.0% 71
Gicumbi 48.4% 24.8% 9.3% 3.3% 5.1% 9.0% 100.0% 113
Rwamagana 42.3% 22.3% 20.6% 0.2% 4.6% 10.1% 100.0% 68
Nyagatare 44.8% 25.0% 8.6% 4.4% 8.3% 8.9% 100.0% 84
Gatsibo 60.2% 16.0% 8.0% 2.1% 5.7% 8.0% 100.0% 100
Kayonza 57.4% 18.9% 11.4% 0.1% 5.5% 6.6% 100.0% 70
Kirehe 54.4% 23.2% 4.3% 2.3% 4.6% 11.3% 100.0% 72
Ngoma 56.3% 21.3% 8.0% 0.2% 5.1% 9.1% 100.0% 68
Bugesera 46.2% 28.2% 6.6% 0.7% 8.3% 10.1% 100.0% 80

EICV3 DISTRICT PROFILE - Gicumbi62
A.5 Agriculture
Table A.21 Size of land cultivated per household (in ha)
EICV3
Mean size of culti-
vated land (ha)
Median size of culti-
vated land (ha)
Size of cultivated land
Total
Number of HHs culti-
vating land for crop
production (000s)
<0.3 ha 0.3–0.9 ha 0.9–3 ha >=3 ha
All Rwanda 0.59 0.33 45.8 37.6 14.7 1.9 100.0 2,095
Nyarugenge 0.26 0.05 73.8 18.9 6.8 0.5 100.0 25
Gasabo 0.80 0.15 66.5 21.7 8.1 3.8 100.0 68
Kicukiro 0.36 0.06 75.8 15.0 7.6 1.6 100.0 32
Nyanza 0.52 0.34 43.7 44.4 10.5 1.4 100.0 64
Gisagara 0.56 0.33 47.2 39.2 11.7 1.9 100.0 74
Nyaruguru 0.44 0.28 51.9 36.7 10.2 1.2 100.0 60
Huye 0.41 0.20 65.2 25.1 7.9 1.8 100.0 66
Nyamagabe 0.51 0.25 57.6 32.2 7.9 2.3 100.0 70
Ruhango 0.45 0.27 56.4 32.9 9.0 1.7 100.0 69
Muhanga 0.97 0.37 41.8 40.8 12.7 4.7 100.0 62
Kamonyi 0.53 0.34 44.8 40.2 14.1 0.9 100.0 68
Karongi 0.50 0.28 52.8 37.4 7.8 2.0 100.0 75
Rutsiro 0.57 0.29 51.7 32.7 12.8 2.9 100.0 68
Rubavu 0.26 0.13 74.3 21.4 4.1 0.2 100.0 71
Nyabihu 0.46 0.30 49.9 39.8 9.4 0.9 100.0 66
Ngororero 0.63 0.42 35.1 46.4 16.3 2.2 100.0 74
Rusizi 0.46 0.31 48.6 40.7 9.9 0.9 100.0 75
Nyamasheke 0.49 0.27 52.6 32.8 13.1 1.4 100.0 78
Rulindo 0.70 0.39 38.1 46.0 14.6 1.3 100.0 62
Gakenke 0.62 0.34 43.1 37.4 17.7 1.9 100.0 76
Musanze 0.45 0.30 49.9 37.1 12.4 0.5 100.0 85
Burera 0.39 0.28 53.7 37.6 8.7 0.0 100.0 70
Gicumbi 0.49 0.34 44.4 41.2 13.9 0.5 100.0 111
Rwamagana 0.70 0.36 41.7 35.9 19.1 3.4 100.0 64
Nyagatare 0.77 0.51 29.0 37.4 31.2 2.3 100.0 80
Gatsibo 0.76 0.49 27.8 47.5 22.5 2.3 100.0 99
Kayonza 0.82 0.56 22.0 46.4 29.1 2.5 100.0 66
Kirehe 0.73 0.56 24.2 45.5 29.2 1.1 100.0 70
Ngoma 0.83 0.56 23.9 47.4 25.4 3.2 100.0 67
Bugesera 0.88 0.52 30.3 40.6 24.2 4.9 100.0 78
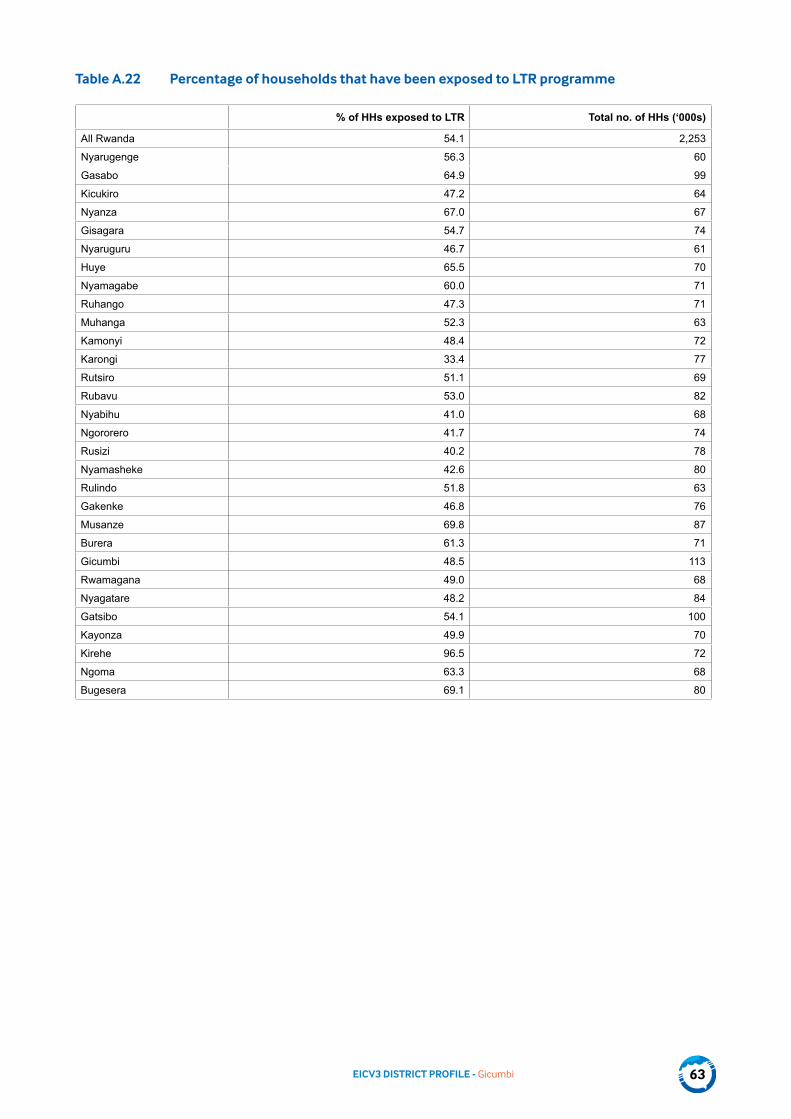
EICV3 DISTRICT PROFILE - Gicumbi 63
Table A.22 Percentage of households that have been exposed to LTR programme
% of HHs exposed to LTR Total no. of HHs (‘000s)
All Rwanda 54.1 2,253
Nyarugenge 56.3 60
Gasabo 64.9 99
Kicukiro 47.2 64
Nyanza 67.0 67
Gisagara 54.7 74
Nyaruguru 46.7 61
Huye 65.5 70
Nyamagabe 60.0 71
Ruhango 47.3 71
Muhanga 52.3 63
Kamonyi 48.4 72
Karongi 33.4 77
Rutsiro 51.1 69
Rubavu 53.0 82
Nyabihu 41.0 68
Ngororero 41.7 74
Rusizi 40.2 78
Nyamasheke 42.6 80
Rulindo 51.8 63
Gakenke 46.8 76
Musanze 69.8 87
Burera 61.3 71
Gicumbi 48.5 113
Rwamagana 49.0 68
Nyagatare 48.2 84
Gatsibo 54.1 100
Kayonza 49.9 70
Kirehe 96.5 72
Ngoma 63.3 68
Bugesera 69.1 80

EICV3 DISTRICT PROFILE - Gicumbi64
Table A.23 Percentage of land irrigated and protected against soil erosion
Total cultivated land area (000 ha)% land irrigated % land protected against erosion
All Rwanda 3.0 78.1 1,228
Nyarugenge 1.7 68.6 6
Gasabo 5.1 73.2 54
Kicukiro 1.7 83.5 11
Nyanza 2.8 83.5 33
Gisagara 5.2 78.2 41
Nyaruguru 2.7 89.2 27
Huye 4.3 76.4 27
Nyamagabe 2.9 91.3 36
Ruhango 2.5 80.9 31
Muhanga 1.9 88.3 60
Kamonyi 2.7 88.4 36
Karongi 1.4 90.2 38
Rutsiro 0.4 90.1 39
Rubavu 0.1 47.9 18
Nyabihu 0.0 94.1 30
Ngororero 1.5 89.6 46
Rusizi 4.6 81.2 35
Nyamasheke 0.7 53.6 38
Rulindo 5.7 87.0 43
Gakenke 1.6 92.2 47
Musanze 0.3 53.3 38
Burera 0.8 73.4 27
Gicumbi 1.0 89.8 54
Rwamagana 5.5 86.3 45
Nyagatare 5.9 64.5 61
Gatsibo 5.7 76.4 75
Kayonza 3.3 51.6 54
Kirehe 3.6 79.2 51
Ngoma 2.1 63.7 56
Bugesera 3.7 76.4 68
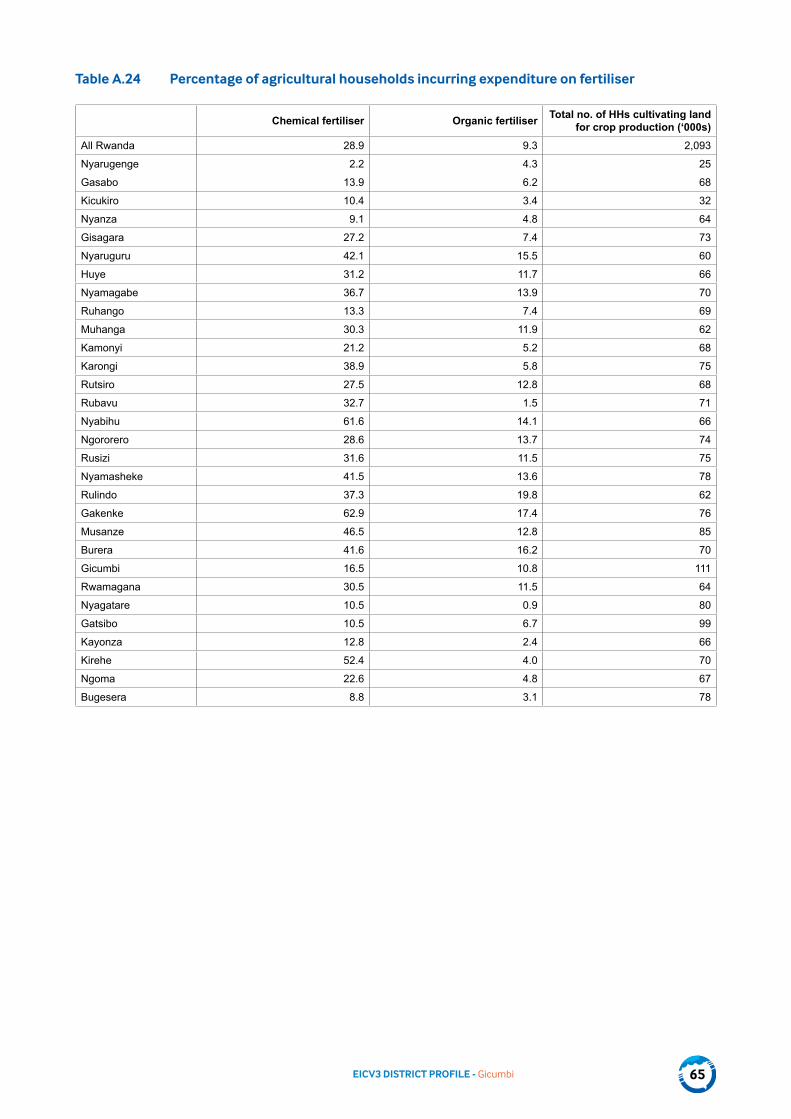
EICV3 DISTRICT PROFILE - Gicumbi 65
Table A.24 Percentage of agricultural households incurring expenditure on fertiliser
Chemical fertiliser Organic fertiliser Total no. of HHs cultivating land for crop production (‘000s)
All Rwanda 28.9 9.3 2,093
Nyarugenge 2.2 4.3 25
Gasabo 13.9 6.2 68
Kicukiro 10.4 3.4 32
Nyanza 9.1 4.8 64
Gisagara 27.2 7.4 73
Nyaruguru 42.1 15.5 60
Huye 31.2 11.7 66
Nyamagabe 36.7 13.9 70
Ruhango 13.3 7.4 69
Muhanga 30.3 11.9 62
Kamonyi 21.2 5.2 68
Karongi 38.9 5.8 75
Rutsiro 27.5 12.8 68
Rubavu 32.7 1.5 71
Nyabihu 61.6 14.1 66
Ngororero 28.6 13.7 74
Rusizi 31.6 11.5 75
Nyamasheke 41.5 13.6 78
Rulindo 37.3 19.8 62
Gakenke 62.9 17.4 76
Musanze 46.5 12.8 85
Burera 41.6 16.2 70
Gicumbi 16.5 10.8 111
Rwamagana 30.5 11.5 64
Nyagatare 10.5 0.9 80
Gatsibo 10.5 6.7 99
Kayonza 12.8 2.4 66
Kirehe 52.4 4.0 70
Ngoma 22.6 4.8 67
Bugesera 8.8 3.1 78
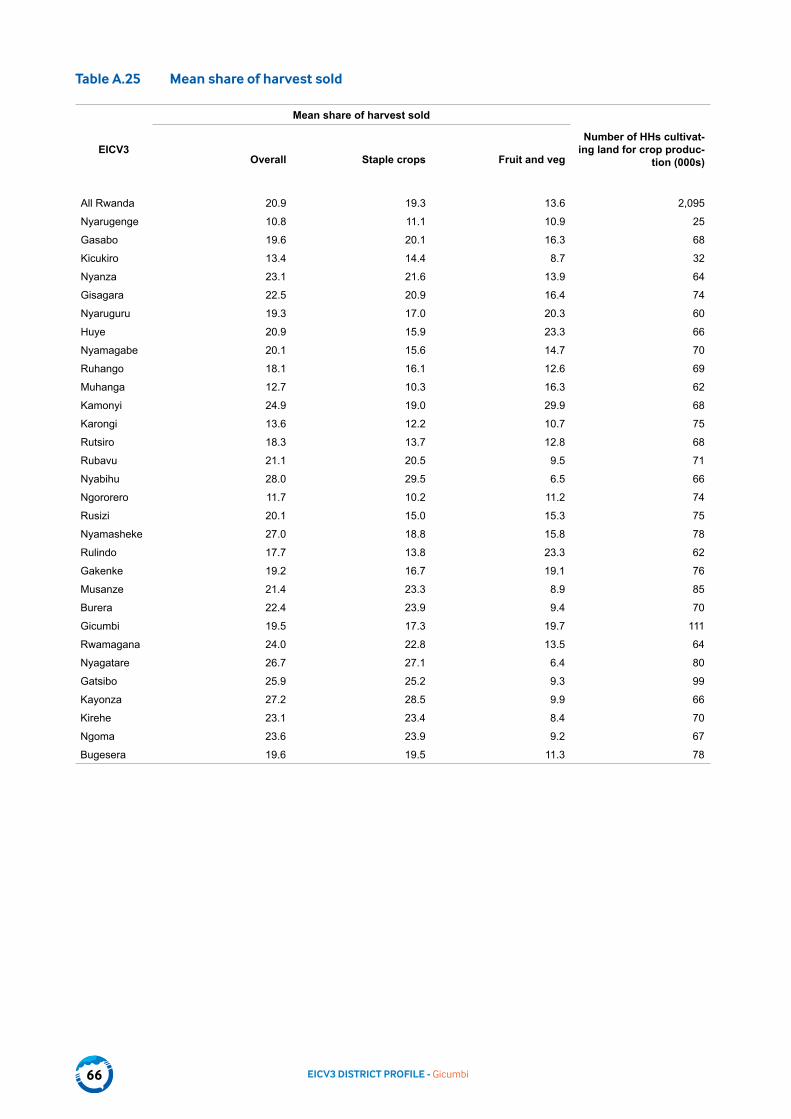
EICV3 DISTRICT PROFILE - Gicumbi66
Table A.25 Mean share of harvest sold
EICV3
Mean share of harvest sold
Number of HHs cultivat-ing land for crop produc-
tion (000s)Overall Staple crops Fruit and veg
All Rwanda 20.9 19.3 13.6 2,095
Nyarugenge 10.8 11.1 10.9 25
Gasabo 19.6 20.1 16.3 68
Kicukiro 13.4 14.4 8.7 32
Nyanza 23.1 21.6 13.9 64
Gisagara 22.5 20.9 16.4 74
Nyaruguru 19.3 17.0 20.3 60
Huye 20.9 15.9 23.3 66
Nyamagabe 20.1 15.6 14.7 70
Ruhango 18.1 16.1 12.6 69
Muhanga 12.7 10.3 16.3 62
Kamonyi 24.9 19.0 29.9 68
Karongi 13.6 12.2 10.7 75
Rutsiro 18.3 13.7 12.8 68
Rubavu 21.1 20.5 9.5 71
Nyabihu 28.0 29.5 6.5 66
Ngororero 11.7 10.2 11.2 74
Rusizi 20.1 15.0 15.3 75
Nyamasheke 27.0 18.8 15.8 78
Rulindo 17.7 13.8 23.3 62
Gakenke 19.2 16.7 19.1 76
Musanze 21.4 23.3 8.9 85
Burera 22.4 23.9 9.4 70
Gicumbi 19.5 17.3 19.7 111
Rwamagana 24.0 22.8 13.5 64
Nyagatare 26.7 27.1 6.4 80
Gatsibo 25.9 25.2 9.3 99
Kayonza 27.2 28.5 9.9 66
Kirehe 23.1 23.4 8.4 70
Ngoma 23.6 23.9 9.2 67
Bugesera 19.6 19.5 11.3 78

EICV3 DISTRICT PROFILE - Gicumbi 67
Table A.26 Percentage of households raising livestock over the last 12 months
% of HHs raising livestock Total no. of HHs (000s)
All Rwanda 68.2 2,253
Nyarugenge 22.8 60
Gasabo 44.5 99
Kicukiro 30.0 64
Nyanza 69.0 67
Gisagara 83.1 74
Nyaruguru 82.8 61
Huye 69.3 70
Nyamagabe 77.6 71
Ruhango 60.6 71
Muhanga 76.9 63
Kamonyi 67.1 72
Karongi 80.9 77
Rutsiro 76.4 69
Rubavu 47.7 82
Nyabihu 64.1 68
Ngororero 83.1 74
Rusizi 62.8 78
Nyamasheke 71.7 80
Rulindo 78.8 63
Gakenke 84.5 76
Musanze 62.6 87
Burera 78.5 71
Gicumbi 77.8 113
Rwamagana 70.2 68
Nyagatare 64.0 84
Gatsibo 72.8 100
Kayonza 63.9 70
Kirehe 70.3 72
Ngoma 69.9 68
Bugesera 78.4 80

EICV3 DISTRICT PROFILE - Gicumbi68
A.6 Education
Table A.27 Percentage of individuals aged six and above that have ever attended school
Ever attended school Never attended school Total Total no. of persons aged 6+ (000s)
All Rwanda 83.2 16.8 100.0 8,821
Nyarugenge 90.7 9.3 100.0 235
Gasabo 89.8 10.2 100.0 385
Kicukiro 94.4 5.6 100.0 250
Nyanza 80.4 19.6 100.0 252
Gisagara 79.0 21.0 100.0 268
Nyaruguru 78.7 21.3 100.0 251
Huye 84.5 15.5 100.0 267
Nyamagabe 78.4 21.6 100.0 272
Ruhango 82.8 17.2 100.0 250
Muhanga 84.9 15.1 100.0 248
Kamonyi 85.5 14.5 100.0 274
Karongi 82.7 17.3 100.0 294
Rutsiro 79.9 20.2 100.0 265
Rubavu 82.6 17.4 100.0 332
Nyabihu 81.6 18.4 100.0 274
Ngororero 81.1 18.9 100.0 275
Rusizi 83.3 16.7 100.0 352
Nyamasheke 82.7 17.4 100.0 321
Rulindo 85.2 14.8 100.0 244
Gakenke 86.0 14.0 100.0 279
Musanze 84.6 15.4 100.0 342
Burera 80.6 19.4 100.0 299
Gicumbi 83.7 16.3 100.0 483
Rwamagana 84.0 16.0 100.0 263
Nyagatare 82.3 17.7 100.0 339
Gatsibo 79.7 20.3 100.0 400
Kayonza 81.6 18.4 100.0 268
Kirehe 81.4 18.7 100.0 267
Ngoma 82.5 17.5 100.0 260
Bugesera 81.3 18.7 100.0 312

EICV3 DISTRICT PROFILE - Gicumbi 69
Table A.28 Literacy rate (%) among population aged 15 and above
Literacy rate (%) Total no. of persons 15+ (000s)
All Rwanda 69.7 6,157
Nyarugenge 86.7 179
Gasabo 84.8 291
Kicukiro 89.5 190
Nyanza 64.3 174
Gisagara 57.5 191
Nyaruguru 62.9 169
Huye 68.3 188
Nyamagabe 63.2 188
Ruhango 65.5 180
Muhanga 71.1 174
Kamonyi 72.8 195
Karongi 69.9 206
Rutsiro 64.2 178
Rubavu 68.8 221
Nyabihu 68.4 185
Ngororero 63.8 190
Rusizi 72.7 245
Nyamasheke 69.4 225
Rulindo 71.1 167
Gakenke 70.9 200
Musanze 65.6 235
Burera 65.0 198
Gicumbi 70.5 338
Rwamagana 70.9 185
Nyagatare 67.5 225
Gatsibo 62.5 272
Kayonza 67.1 186
Kirehe 67.9 184
Ngoma 70.5 181
Bugesera 72.9 215

EICV3 DISTRICT PROFILE - Gicumbi70
Table A.29 NARs in primary school
NAR (%) Population aged 7 to 12 (000s)
All Rwanda 91.7 1,813
Nyarugenge 91.4 38
Gasabo 95.0 65
Kicukiro 95.3 39
Nyanza 89.6 53
Gisagara 87.3 51
Nyaruguru 89.6 55
Huye 92.6 55
Nyamagabe 90.5 57
Ruhango 91.9 49
Muhanga 90.7 50
Kamonyi 95.7 55
Karongi 94.3 60
Rutsiro 88.8 60
Rubavu 89.7 79
Nyabihu 93.7 59
Ngororero 91.4 57
Rusizi 90.1 71
Nyamasheke 91.4 65
Rulindo 95.4 54
Gakenke 95.7 55
Musanze 95.0 73
Burera 93.7 68
Gicumbi 97.9 99
Rwamagana 90.6 53
Nyagatare 87.1 74
Gatsibo 90.4 85
Kayonza 92.9 56
Kirehe 86.7 57
Ngoma 86.7 56
Bugesera 87.7 66

EICV3 DISTRICT PROFILE - Gicumbi 71
Table A.30 NARs in secondary school
NAR (%) Population aged 13 to 18 (000s)
All Rwanda 20.9 1538
Nyarugenge 40.0 38
Gasabo 37.5 62
Kicukiro 48.7 34
Nyanza 20.5 43
Gisagara 15.0 46
Nyaruguru 16.9 49
Huye 23.4 43
Nyamagabe 14.7 49
Ruhango 16.1 41
Muhanga 20.8 41
Kamonyi 20.7 44
Karongi 13.7 53
Rutsiro 11.6 45
Rubavu 23.3 58
Nyabihu 20.9 53
Ngororero 14.8 46
Rusizi 24.5 70
Nyamasheke 15.4 57
Rulindo 21.2 40
Gakenke 26.5 43
Musanze 20.1 62
Burera 11.3 55
Gicumbi 25.8 92
Rwamagana 21.3 45
Nyagatare 18.1 64
Gatsibo 15.9 73
Kayonza 19.1 48
Kirehe 13.9 45
Ngoma 19.5 44
Bugesera 22.8 55
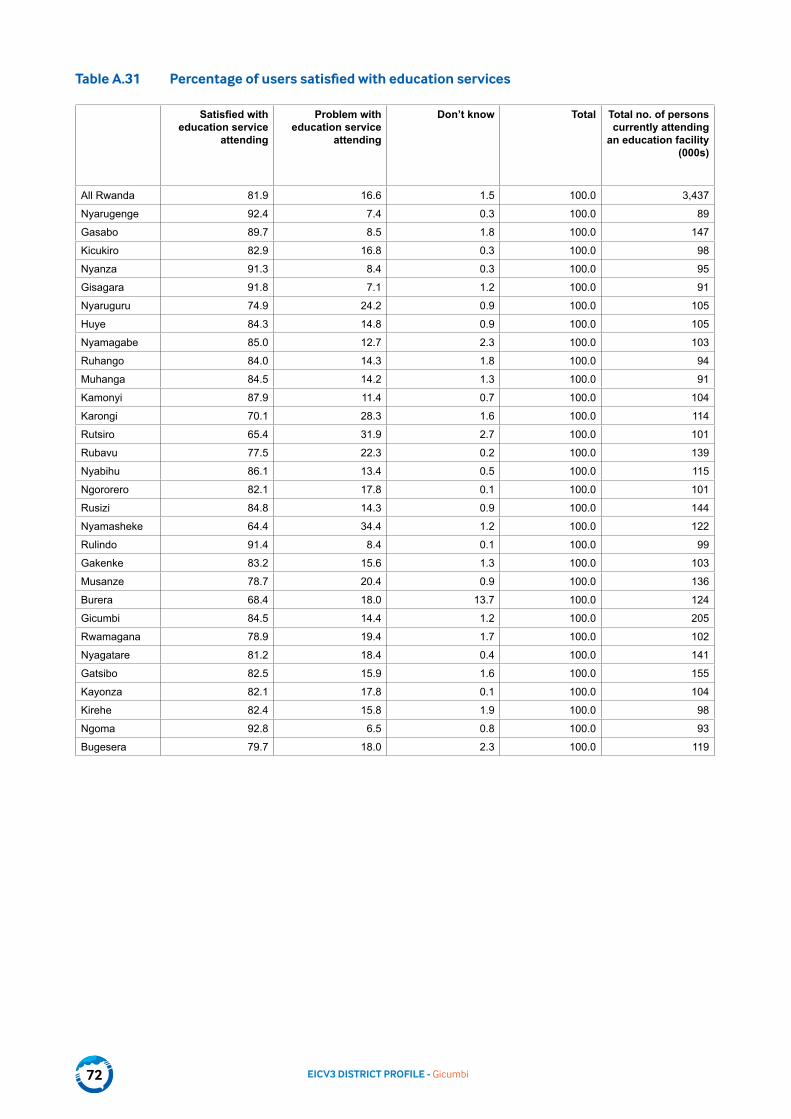
EICV3 DISTRICT PROFILE - Gicumbi72
Table A.31 Percentage of users satisfied with education services
Satisfied with education service
attending
Problem with education service
attending
Don’t know Total Total no. of persons currently attending
an education facility (000s)
All Rwanda 81.9 16.6 1.5 100.0 3,437
Nyarugenge 92.4 7.4 0.3 100.0 89
Gasabo 89.7 8.5 1.8 100.0 147
Kicukiro 82.9 16.8 0.3 100.0 98
Nyanza 91.3 8.4 0.3 100.0 95
Gisagara 91.8 7.1 1.2 100.0 91
Nyaruguru 74.9 24.2 0.9 100.0 105
Huye 84.3 14.8 0.9 100.0 105
Nyamagabe 85.0 12.7 2.3 100.0 103
Ruhango 84.0 14.3 1.8 100.0 94
Muhanga 84.5 14.2 1.3 100.0 91
Kamonyi 87.9 11.4 0.7 100.0 104
Karongi 70.1 28.3 1.6 100.0 114
Rutsiro 65.4 31.9 2.7 100.0 101
Rubavu 77.5 22.3 0.2 100.0 139
Nyabihu 86.1 13.4 0.5 100.0 115
Ngororero 82.1 17.8 0.1 100.0 101
Rusizi 84.8 14.3 0.9 100.0 144
Nyamasheke 64.4 34.4 1.2 100.0 122
Rulindo 91.4 8.4 0.1 100.0 99
Gakenke 83.2 15.6 1.3 100.0 103
Musanze 78.7 20.4 0.9 100.0 136
Burera 68.4 18.0 13.7 100.0 124
Gicumbi 84.5 14.4 1.2 100.0 205
Rwamagana 78.9 19.4 1.7 100.0 102
Nyagatare 81.2 18.4 0.4 100.0 141
Gatsibo 82.5 15.9 1.6 100.0 155
Kayonza 82.1 17.8 0.1 100.0 104
Kirehe 82.4 15.8 1.9 100.0 98
Ngoma 92.8 6.5 0.8 100.0 93
Bugesera 79.7 18.0 2.3 100.0 119

EICV3 DISTRICT PROFILE - Gicumbi 73
Table A.32 Use of computers among population aged six and above
Never used com-puter before
Used computer before but not
confident to use it again
Used computer be-fore and confident
to use it again (computer literate)
Total Total no. of per-sons 6+ (‘000s)
All Rwanda 93.5 2.6 3.9 100.0 8,820
Nyarugenge 75.4 6.7 17.8 100.0 235
Gasabo 78.2 7.8 14.0 100.0 385
Kicukiro 71.6 8.1 20.3 100.0 250
Nyanza 96.1 2.5 1.4 100.0 252
Gisagara 97.6 1.1 1.3 100.0 268
Nyaruguru 97.0 1.9 1.1 100.0 251
Huye 92.2 3.8 4.0 100.0 267
Nyamagabe 96.9 1.4 1.7 100.0 272
Ruhango 96.2 3.0 0.8 100.0 250
Muhanga 94.6 2.2 3.2 100.0 248
Kamonyi 96.1 1.5 2.4 100.0 274
Karongi 96.9 1.7 1.3 100.0 294
Rutsiro 97.8 1.6 0.7 100.0 265
Rubavu 90.9 3.1 6.0 100.0 332
Nyabihu 95.5 2.6 1.9 100.0 274
Ngororero 97.8 1.1 1.2 100.0 275
Rusizi 94.8 2.2 3.1 100.0 352
Nyamasheke 97.7 1.2 1.1 100.0 321
Rulindo 96.9 1.5 1.5 100.0 244
Gakenke 96.9 1.0 2.1 100.0 279
Musanze 93.3 2.1 4.6 100.0 342
Burera 96.0 1.4 2.6 100.0 299
Gicumbi 89.7 3.1 7.2 100.0 483
Rwamagana 93.6 2.4 4.0 100.0 263
Nyagatare 95.6 2.8 1.6 100.0 339
Gatsibo 97.1 1.7 1.3 100.0 400
Kayonza 96.4 1.8 1.7 100.0 268
Kirehe 97.1 1.4 1.4 100.0 267
Ngoma 96.4 1.7 1.8 100.0 260
Bugesera 95.0 1.9 3.1 100.0 311
Source: EICV3. Notes: Calculated only for persons aged six and above. The EICV3 survey assumes that illiterate people do not use computers.

EICV3 DISTRICT PROFILE - Gicumbi74
A.7 Vulnerable groups and gender issues
Table A.33 Percentage of persons with major disability
Major disability No major disability Total Total no. of persons (000s)
All Rwanda 4.5 95.6 100.0 10,762
Nyarugenge 2.7 97.3 100.0 282
Gasabo 2.2 97.8 100.0 476
Kicukiro 1.9 98.2 100.0 301
Nyanza 6.7 93.3 100.0 307
Gisagara 5.6 94.4 100.0 337
Nyaruguru 7.6 92.4 100.0 304
Huye 4.5 95.5 100.0 319
Nyamagabe 7.2 92.8 100.0 330
Ruhango 5.8 94.2 100.0 304
Muhanga 1.9 98.1 100.0 297
Kamonyi 4.2 95.8 100.0 329
Karongi 7.8 92.2 100.0 354
Rutsiro 7.6 92.4 100.0 326
Rubavu 2.5 97.5 100.0 423
Nyabihu 1.9 98.1 100.0 331
Ngororero 4.4 95.6 100.0 341
Rusizi 4.2 95.9 100.0 417
Nyamasheke 4.2 95.8 100.0 393
Rulindo 3.6 96.5 100.0 294
Gakenke 3.3 96.8 100.0 345
Musanze 3.1 96.9 100.0 416
Burera 8.2 91.8 100.0 354
Gicumbi 6.2 93.9 100.0 572
Rwamagana 5.4 94.6 100.0 318
Nyagatare 5.2 94.8 100.0 424
Gatsibo 3.0 97.1 100.0 491
Kayonza 2.3 97.7 100.0 332
Kirehe 3.8 96.2 100.0 329
Ngoma 3.3 96.7 100.0 323
Bugesera 4.1 95.9 100.0 391
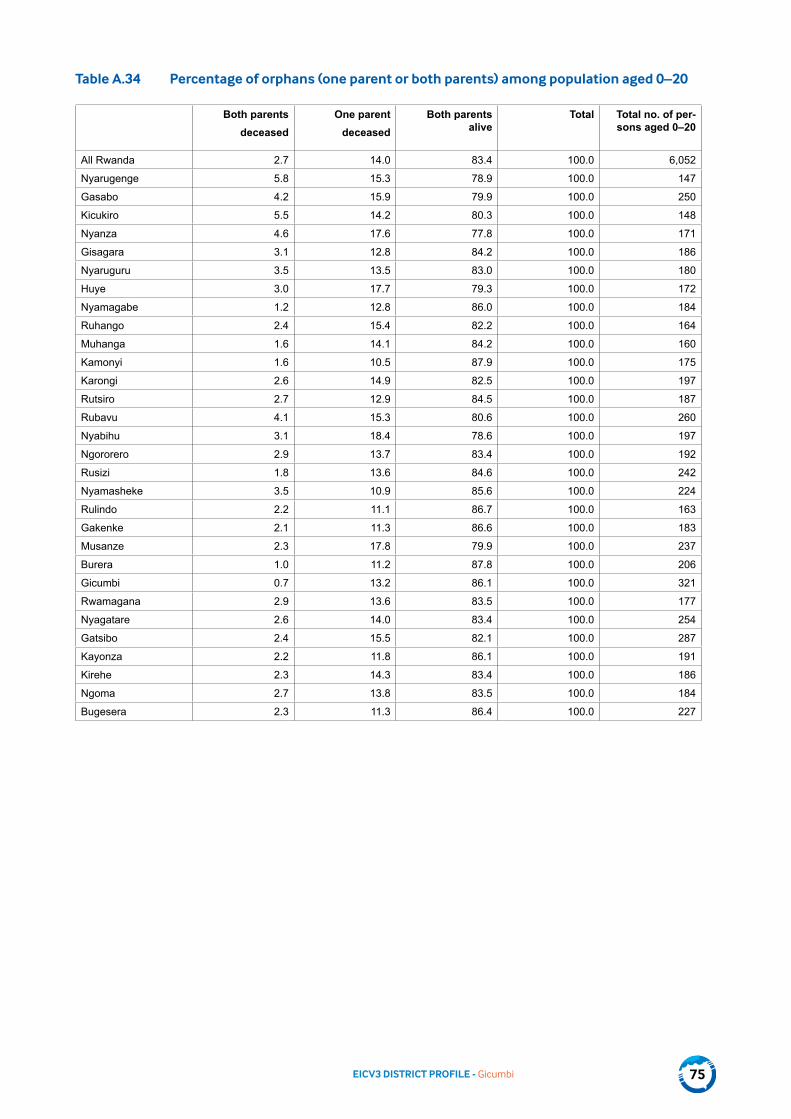
EICV3 DISTRICT PROFILE - Gicumbi 75
Table A.34 Percentage of orphans (one parent or both parents) among population aged 0–20
Both parents deceased
One parent deceased
Both parents alive
Total Total no. of per-sons aged 0–20
All Rwanda 2.7 14.0 83.4 100.0 6,052
Nyarugenge 5.8 15.3 78.9 100.0 147
Gasabo 4.2 15.9 79.9 100.0 250
Kicukiro 5.5 14.2 80.3 100.0 148
Nyanza 4.6 17.6 77.8 100.0 171
Gisagara 3.1 12.8 84.2 100.0 186
Nyaruguru 3.5 13.5 83.0 100.0 180
Huye 3.0 17.7 79.3 100.0 172
Nyamagabe 1.2 12.8 86.0 100.0 184
Ruhango 2.4 15.4 82.2 100.0 164
Muhanga 1.6 14.1 84.2 100.0 160
Kamonyi 1.6 10.5 87.9 100.0 175
Karongi 2.6 14.9 82.5 100.0 197
Rutsiro 2.7 12.9 84.5 100.0 187
Rubavu 4.1 15.3 80.6 100.0 260
Nyabihu 3.1 18.4 78.6 100.0 197
Ngororero 2.9 13.7 83.4 100.0 192
Rusizi 1.8 13.6 84.6 100.0 242
Nyamasheke 3.5 10.9 85.6 100.0 224
Rulindo 2.2 11.1 86.7 100.0 163
Gakenke 2.1 11.3 86.6 100.0 183
Musanze 2.3 17.8 79.9 100.0 237
Burera 1.0 11.2 87.8 100.0 206
Gicumbi 0.7 13.2 86.1 100.0 321
Rwamagana 2.9 13.6 83.5 100.0 177
Nyagatare 2.6 14.0 83.4 100.0 254
Gatsibo 2.4 15.5 82.1 100.0 287
Kayonza 2.2 11.8 86.1 100.0 191
Kirehe 2.3 14.3 83.4 100.0 186
Ngoma 2.7 13.8 83.5 100.0 184
Bugesera 2.3 11.3 86.4 100.0 227
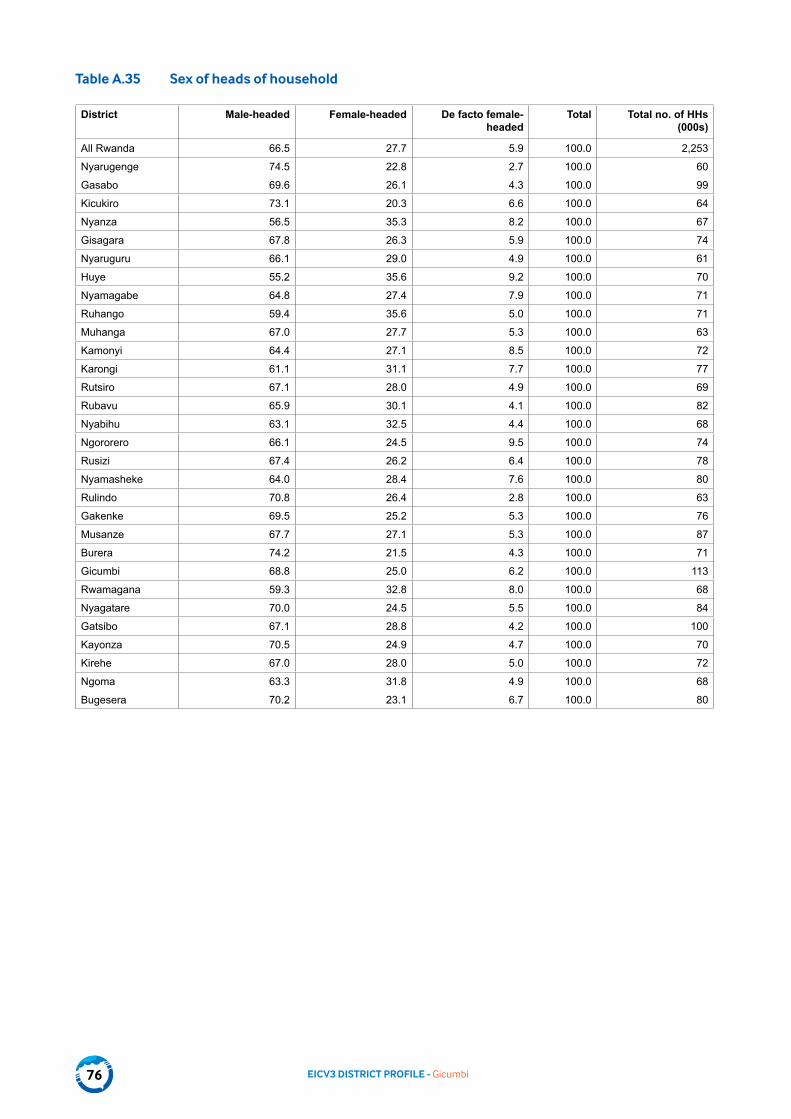
EICV3 DISTRICT PROFILE - Gicumbi76
Table A.35 Sex of heads of household
District Male-headed Female-headed De facto female-headed
Total Total no. of HHs (000s)
All Rwanda 66.5 27.7 5.9 100.0 2,253
Nyarugenge 74.5 22.8 2.7 100.0 60
Gasabo 69.6 26.1 4.3 100.0 99
Kicukiro 73.1 20.3 6.6 100.0 64
Nyanza 56.5 35.3 8.2 100.0 67
Gisagara 67.8 26.3 5.9 100.0 74
Nyaruguru 66.1 29.0 4.9 100.0 61
Huye 55.2 35.6 9.2 100.0 70
Nyamagabe 64.8 27.4 7.9 100.0 71
Ruhango 59.4 35.6 5.0 100.0 71
Muhanga 67.0 27.7 5.3 100.0 63
Kamonyi 64.4 27.1 8.5 100.0 72
Karongi 61.1 31.1 7.7 100.0 77
Rutsiro 67.1 28.0 4.9 100.0 69
Rubavu 65.9 30.1 4.1 100.0 82
Nyabihu 63.1 32.5 4.4 100.0 68
Ngororero 66.1 24.5 9.5 100.0 74
Rusizi 67.4 26.2 6.4 100.0 78
Nyamasheke 64.0 28.4 7.6 100.0 80
Rulindo 70.8 26.4 2.8 100.0 63
Gakenke 69.5 25.2 5.3 100.0 76
Musanze 67.7 27.1 5.3 100.0 87
Burera 74.2 21.5 4.3 100.0 71
Gicumbi 68.8 25.0 6.2 100.0 113
Rwamagana 59.3 32.8 8.0 100.0 68
Nyagatare 70.0 24.5 5.5 100.0 84
Gatsibo 67.1 28.8 4.2 100.0 100
Kayonza 70.5 24.9 4.7 100.0 70
Kirehe 67.0 28.0 5.0 100.0 72
Ngoma 63.3 31.8 4.9 100.0 68
Bugesera 70.2 23.1 6.7 100.0 80

EICV3 DISTRICT PROFILE - Gicumbi 77
Table A.36 Employment type by sex (usual main job)
Males Females
Wage farm
Wage non-farm
Small-scale
farmer
Indep. non-farm
Other Total Wage farm
Wage non-farm
Small-scale
farmer
Indep. non-farm
Other and n.i
Total
All Rwanda 10.2 27.4 49.4 11.7 1.4 100 9.7 8.3 71.8 8.0 2.1 100
Nyarugenge 2.1 63.5 7.2 23.8 3.3 100 3.5 40.6 22.6 26.8 6.5 100
Gasabo 3.7 61.6 13.5 17.8 3.5 100 6.3 35.0 36.4 18.1 4.3 100
Kicukiro 3.3 71.9 7.4 15.4 2.0 100 4.2 48.0 21.3 21.3 5.2 100
Nyanza 12.0 21.4 56.6 9.3 0.7 100 10.0 3.0 82.6 3.8 0.6 100
Gisagara 15.0 11.9 62.1 9.0 2.0 100 15.9 2.8 77.3 3.5 0.5 100
Nyaruguru 11.1 19.6 57.4 8.7 3.2 100 7.8 3.3 83.5 4.4 1.0 100
Huye 8.4 26.8 53.3 10.6 0.9 100 9.0 9.4 75.9 4.9 0.8 100
Nyamagabe 11.0 21.5 57.0 10.3 0.2 100 13.7 6.5 70.3 7.6 1.9 100
Ruhango 13.9 11.8 62.2 10.3 1.8 100 9.9 4.3 77.7 5.4 2.6 100
Muhanga 4.2 23.5 60.0 11.9 0.5 100 3.5 4.8 85.4 4.7 1.6 100
Kamonyi 6.8 22.0 57.4 13.1 0.7 100 4.6 7.1 83.0 3.8 1.5 100
Karongi 11.9 16.6 63.7 5.9 1.8 100 11.2 3.8 81.0 3.4 0.7 100
Rutsiro 14.2 23.7 47.5 12.6 2.1 100 14.1 4.9 74.5 4.5 2.0 100
Rubavu 12.0 41.4 29.6 16.4 0.6 100 10.5 10.3 44.1 29.6 5.6 100
Nyabihu 22.1 22.3 41.2 13.6 0.9 100 23.2 2.0 58.9 13.2 2.7 100
Ngororero 10.2 21.3 57.5 9.7 1.3 100 8.0 3.1 82.8 4.9 1.2 100
Rusizi 6.7 28.4 48.0 14.1 2.7 100 7.5 6.8 69.5 13.8 2.4 100
Nyamasheke 12.9 35.5 40.3 9.3 2.0 100 14.8 7.0 67.4 9.1 1.7 100
Rulindo 15.4 28.8 45.6 9.5 0.6 100 15.0 5.4 75.0 3.2 1.5 100
Gakenke 7.7 20.3 60.8 11.1 0.0 100 5.8 3.9 86.3 3.3 0.7 100
Musanze 9.4 41.7 36.9 11.8 0.2 100 10.1 6.1 73.3 9.8 0.8 100
Burera 16.0 21.3 50.6 11.3 0.7 100 12.7 1.7 77.5 6.4 1.7 100
Gicumbi 11.4 26.5 53.0 8.7 0.4 100 6.9 8.2 77.9 5.9 1.1 100
Rwamagana 7.2 21.0 57.5 12.1 2.3 100 5.9 5.7 77.6 7.8 3.0 100
Nyagatare 12.8 16.8 57.1 12.1 1.2 100 13.6 4.4 74.5 3.4 4.0 100
Gatsibo 13.6 13.6 63.9 8.8 0.1 100 11.3 5.2 78.7 3.3 1.5 100
Kayonza 6.4 18.0 60.6 13.4 1.5 100 6.4 4.7 79.7 5.8 3.4 100
Kirehe 7.8 12.8 68.7 9.4 1.3 100 9.0 2.4 84.2 2.6 1.8 100
Ngoma 9.7 15.0 61.0 12.4 1.9 100 4.7 4.9 83.2 5.2 2.1 100
Bugesera 7.9 21.9 61.3 7.4 1.5 100 8.8 7.0 74.6 7.5 2.1 100

EICV3 DISTRICT PROFILE - Gicumbi78
Table A.37 Youth population (000s)
14–19 years 20–24 years 25–29 years 30–35 years Non-youth Total population
All Rwanda (000s) 1,491 1,026 885 757 6,603 10,762
(%) 13.9 9.5 8.2 7.0 61.4 100.0
Nyarugenge (000s) 41 36 35 28 143 282
(%) 14.4 12.7 12.5 9.9 50.5 100.0
Gasabo (000s) 61 59 46 45 264 476
(%) 12.9 12.5 9.7 9.5 55.4 100.0
Kicukiro (000s) 35 38 40 32 156 301
(%) 11.6 12.7 13.2 10.5 52.0 100.0
Nyanza (000s) 40 26 23 18 200 307
(%) 13.1 8.4 7.5 5.8 65.1 100.0
Gisagara (000s) 45 28 27 27 211 337
(%) 13.2 8.2 8.0 7.9 62.7 100.0
Nyaruguru (000s) 48 26 22 18 190 304
(%) 15.9 8.4 7.3 5.8 62.6 100.0
Huye (000s) 42 31 24 21 201 319
(%) 13.2 9.7 7.5 6.5 63.2 100.0
Nyamagabe (000s) 47 27 24 18 214 330
(%) 14.1 8.3 7.2 5.4 64.9 100.0
Ruhango (000s) 39 26 28 19 193 304
(%) 12.8 8.5 9.1 6.2 63.4 100.0
Muhanga (000s) 39 26 22 24 186 297
(%) 13.3 8.8 7.3 8.0 62.6 100.0
Kamonyi (000s) 44 26 26 22 211 329
(%) 13.4 8.0 7.8 6.8 64.0 100.0
Karongi (000s) 53 33 24 23 221 354
(%) 15.1 9.2 6.7 6.5 62.5 100.0
Rutsiro (000s) 41 27 29 26 203 326
(%) 12.5 8.4 8.9 8.1 62.1 100.0
Rubavu (000s) 58 41 33 32 259 423
(%) 13.7 9.8 7.7 7.5 61.3 100.0
Nyabihu (000s) 50 37 22 21 199 331
(%) 15.3 11.3 6.6 6.5 60.4 100.0
Ngororero (000s) 43 30 29 24 216 341
(%) 12.5 8.7 8.6 6.9 63.3 100.0
Rusizi (000s) 68 43 27 26 254 417
(%) 16.2 10.3 6.4 6.1 60.9 100.0
Nyamasheke (000s) 58 35 34 27 240 393
(%) 14.8 8.9 8.7 6.8 60.9 100.0
Rulindo (000s) 40 24 22 23 184 294
(%) 13.5 8.3 7.6 7.9 62.7 100.0
Gakenke (000s) 40 32 36 27 210 345
(%) 11.7 9.3 10.4 7.7 60.9 100.0
Musanze (000s) 58 40 39 26 253 416
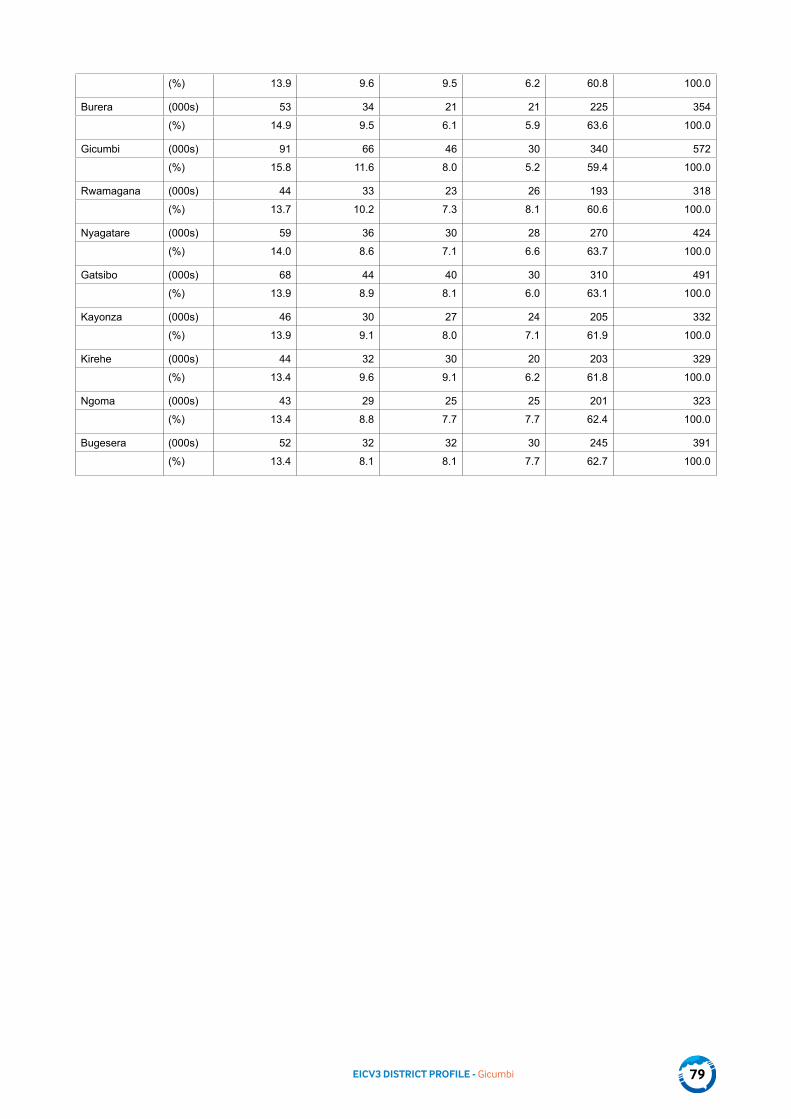
EICV3 DISTRICT PROFILE - Gicumbi 79
(%) 13.9 9.6 9.5 6.2 60.8 100.0
Burera (000s) 53 34 21 21 225 354
(%) 14.9 9.5 6.1 5.9 63.6 100.0
Gicumbi (000s) 91 66 46 30 340 572
(%) 15.8 11.6 8.0 5.2 59.4 100.0
Rwamagana (000s) 44 33 23 26 193 318
(%) 13.7 10.2 7.3 8.1 60.6 100.0
Nyagatare (000s) 59 36 30 28 270 424
(%) 14.0 8.6 7.1 6.6 63.7 100.0
Gatsibo (000s) 68 44 40 30 310 491
(%) 13.9 8.9 8.1 6.0 63.1 100.0
Kayonza (000s) 46 30 27 24 205 332
(%) 13.9 9.1 8.0 7.1 61.9 100.0
Kirehe (000s) 44 32 30 20 203 329
(%) 13.4 9.6 9.1 6.2 61.8 100.0
Ngoma (000s) 43 29 25 25 201 323
(%) 13.4 8.8 7.7 7.7 62.4 100.0
Bugesera (000s) 52 32 32 30 245 391
(%) 13.4 8.1 8.1 7.7 62.7 100.0

EICV3 DISTRICT PROFILE - Gicumbi80
NOTES


EICV3 DISTRICT PROFILE - Gicumbi82
National Institute of Statistics of Rwanda
P. O. Box 6139 Kigali - Rwanda
Website: www.statistics.gov.rw