EIA Short-Term Energy Outlook - December 2015
49
U.S. Energy Information Administration | Short-Term Energy Outlook December 2015 1 December 2015 Short-Term Energy Outlook (STEO) Highlights • North Sea Brent crude oil prices averaged $44/barrel (b) in November, a $4/b decrease from October. Global oil inventories are estimated to have increased by 1.3 million barrels per day (b/d) in November, putting downward pressure on Brent prices. • EIA forecasts that Brent crude oil prices will average $53/b in 2015 and $56/b in 2016. Forecast West Texas Intermediate (WTI) crude oil prices average $4/b lower than the Brent price in 2015 and $5/b lower in 2016. The current values of futures and options contracts for March 2016 delivery (Market Prices and Uncertainty Report) suggest the market expects WTI prices to range from $30/b to $63/b (at the 95% confidence interval). • The monthly average price of U.S. regular retail gasoline was $2.16/gallon (gal) in November, a decrease of 13 cents/gal from October and 75 cents/gal lower than in November 2014. EIA forecasts U.S. regular gasoline retail prices to average $2.04/gal in December 2015 and $2.36/gal for 2016. • EIA estimates that total U.S. crude oil production declined by about 60,000 b/d in November compared with October. Crude oil production is forecast to decrease through the third quarter of 2016 before growth resumes late in 2016. Projected U.S. crude oil production averages 9.3 million b/d in 2015 and 8.8 million b/d in 2016. • Natural gas working inventories were a record 4,009 billion cubic feet (Bcf) on November 20. On November 27, inventories were 16% higher than during the same week last year and 7% higher than the previous five-year average (2010-14) for that week. EIA expects the Henry Hub natural gas spot price to average $2.47/million British thermal units (MMBtu) this winter (October 2015–March 2016) compared with $3.35/MMBtu last winter. • Electricity generated from natural gas-fired power plants exceeded generation from coal- fired plants in September for the third month in a row. Before April 2015, the monthly share of total U.S. generation fueled by coal had always been larger than the natural gas share. Natural gas generation in September was 4% higher than the level generated by coal. This increased use of natural gas for electricity generation primarily reflects sustained low prices for the fuel.
-
Upload
marcellus-drilling-news -
Category
News & Politics
-
view
469 -
download
4
Transcript of EIA Short-Term Energy Outlook - December 2015
U.S. Energy Information Administration | Short-Term Energy Outlook December 2015 1
December 2015
Short-Term Energy Outlook (STEO) Highlights • North Sea Brent crude oil prices averaged $44/barrel (b) in November, a $4/b decrease from
October. Global oil inventories are estimated to have increased by 1.3 million barrels per day (b/d) in November, putting downward pressure on Brent prices.
• EIA forecasts that Brent crude oil prices will average $53/b in 2015 and $56/b in 2016. Forecast West Texas Intermediate (WTI) crude oil prices average $4/b lower than the Brent price in 2015 and $5/b lower in 2016. The current values of futures and options contracts for March 2016 delivery (Market Prices and Uncertainty Report) suggest the market expects WTI prices to range from $30/b to $63/b (at the 95% confidence interval).
• The monthly average price of U.S. regular retail gasoline was $2.16/gallon (gal) in November, a decrease of 13 cents/gal from October and 75 cents/gal lower than in November 2014. EIA forecasts U.S. regular gasoline retail prices to average $2.04/gal in December 2015 and $2.36/gal for 2016.
• EIA estimates that total U.S. crude oil production declined by about 60,000 b/d in November compared with October. Crude oil production is forecast to decrease through the third quarter of 2016 before growth resumes late in 2016. Projected U.S. crude oil production averages 9.3 million b/d in 2015 and 8.8 million b/d in 2016.
• Natural gas working inventories were a record 4,009 billion cubic feet (Bcf) on November 20. On November 27, inventories were 16% higher than during the same week last year and 7% higher than the previous five-year average (2010-14) for that week. EIA expects the Henry Hub natural gas spot price to average $2.47/million British thermal units (MMBtu) this winter (October 2015–March 2016) compared with $3.35/MMBtu last winter.
• Electricity generated from natural gas-fired power plants exceeded generation from coal-
fired plants in September for the third month in a row. Before April 2015, the monthly share of total U.S. generation fueled by coal had always been larger than the natural gas share. Natural gas generation in September was 4% higher than the level generated by coal. This increased use of natural gas for electricity generation primarily reflects sustained low prices for the fuel.

U.S. Energy Information Administration | Short-Term Energy Outlook December 2015 2
Global Petroleum and Other Liquids
Global petroleum and other liquids production continues to outpace consumption, leading to inventory builds throughout the forecast period. Global oil inventory builds in the third quarter of 2015 averaged 1.8 million b/d, down from 2.0 million b/d in the second quarter, which had the largest inventory builds since the fourth quarter of 2008. The pace of inventory builds is expected to slow in the fourth quarter to roughly 1.4 million b/d. In 2016, inventory builds are expected to slow further to an average of 0.6 million b/d.
Global Petroleum and Other Liquids Consumption. EIA estimates global consumption of petroleum and other liquids grew by 1.2 million b/d in 2014, averaging 92.4 million b/d for the year. EIA expects global consumption of petroleum and other liquids to grow by 1.4 million b/d in both 2015 and 2016. Forecast real gross domestic product (GDP) for the world weighted by oil consumption, which increased by 2.7% in 2014, rises by 2.3% in 2015 and by 2.6% in 2016.
Consumption of petroleum and other liquids in countries outside the Organization for Economic Cooperation and Development (OECD) increased by 1.4 million b/d in 2014 and is projected to grow by 0.8 million b/d in 2015 and by 1.1 million b/d in 2016. China continues to be the main driver of non-OECD oil consumption growth, despite the slowdown in the country’s economic growth that began in the second half of 2014. China’s liquid fuels consumption growth is forecast to average 0.3 million b/d in 2015 and in 2016, below the 0.4 million b/d growth in 2014.
After falling by 0.3 million b/d in 2014, OECD petroleum and other liquids consumption is expected to rise by 0.6 million b/d in 2015 and by 0.3 million b/d in 2016, reaching an average of 46.7 million b/d, the highest annual average level of OECD consumption since 2010. U.S. consumption is expected to grow by an average of 0.3 million b/d in 2015 and by 0.2 million b/d in 2016. In 2015, economic conditions improved in several OECD countries in Europe and Asia as they emerged from recessions, contributing to oil demand growth. Also, colder-than-normal weather in OECD Europe in early 2015 contributed to a forecast 0.3 million b/d increase in 2015 oil consumption. Consumption in OECD Europe is forecast to increase by 0.1 million b/d in 2016.
Non‐OPEC Petroleum and Other Liquids Supply. EIA estimates that petroleum and other liquids production in countries outside of the Organization of the Petroleum Exporting Countries (OPEC) grew by 2.5 million b/d in 2014, which mainly reflects production growth in the United States. EIA expects non-OPEC production to grow by 1.2 million b/d in 2015, and then to decline by 0.4 million b/d in 2016, which would be the first annual decline in non-OPEC production since 2008. Non-OPEC production growth in 2015 is largely attributable to investments committed to projects before the oil price decline that began in mid-2014. The declines in 2016 are mostly because of declines in U.S. onshore and North Sea production.
Production growth in Canada is expected to average 0.1 million b/d in both 2015 and 2016. Persistently low oil prices are leading to delays or cancellations of projects previously scheduled to come online during the forecast period, including Shell’s October cancellation of the 80,000

U.S. Energy Information Administration | Short-Term Energy Outlook December 2015 3
b/d Carmon Creek project. However, some projects continue as planned, including the Imperial Oil and Cenovus oil sands projects scheduled to come online by the end of 2016.
Unplanned supply disruptions among non-OPEC producers averaged 0.7 million b/d in November, an increase of almost 0.1 million b/d from the previous month. In early November, Brazilian oil workers from several unions began a strike, which lasted for more than three weeks and shut in roughly 0.1 million b/d of oil production. On November 23, Petrobras announced an agreement with the majority of striking unions, and production has resumed.
OPEC Petroleum and Other Liquids Supply. At its December 4 meeting, OPEC members announced they “should continue to closely monitor developments in the coming months.” This indicates OPEC producers, led by Saudi Arabia, are continuing the policy of defending market share in a low oil price environment. EIA estimates OPEC production averaged 31.4 million b/d in November 2015, 1.3 million b/d higher than in November 2014. Increased crude oil production in Saudi Arabia and Iraq is the main driver of higher OPEC production.
Also, at the December 4 meeting, OPEC members voted unanimously to reactivate Indonesia’s OPEC membership, despite its remaining a net importer of crude oil. Indonesia had suspended its membership in 2009 after it became a net importer of crude oil. Starting with the January 2016 STEO, EIA will include Indonesia’s output in the OPEC total for both history and the forecast.
EIA estimates that OPEC crude oil production averaged 30.1 million b/d in 2014. EIA forecasts OPEC crude oil production to increase by 0.9 million b/d in 2015, led by production growth in Iraq. Forecast OPEC crude oil production increases by 0.3 million b/d in 2016, with Iran forecast to increase production once international sanctions targeting its oil sector are suspended. Under the Joint Comprehensive Plan of Action (JCPOA) between Iran and the five permanent members of the United Nations Security Council and Germany (P5+1) that was announced on July 14, sanctions relief is contingent on verification by the International Atomic Energy Agency (IAEA) that Iran has complied with key nuclear-related steps.
Although uncertainty remains as to the timing of sanctions relief, EIA assumes the implementation occurs in the second quarter of 2016, clearing the way to ease sanctions at that time. As a result, EIA forecasts Iranian crude oil supplies will increase by more than 0.2 million b/d on average in 2016, reaching roughly 3.3 million b/d by the end of the year.
Iraq is producing at record levels, with estimated crude oil production averaging 4.5 million b/d in November 2015, 0.7 million b/d higher than the 3.8 million b/d average during the first half of 2015. The expansion of onshore pumping and storage infrastructure in the south, improvements in crude quality as Basra Light and Basra Heavy were marketed separately, and an increase to the Kurdistan Regional Government’s (KRG) pipeline capacity in the north have all contributed to production growth in Iraq. EIA expects Iraq’s production growth to slow in 2016 because of budgetary constraints that have prompted the Iraqi government to request international oil companies (IOCs) operating in the south to reduce spending plans. The KRG is also experiencing

U.S. Energy Information Administration | Short-Term Energy Outlook December 2015 4
budgetary constraints that contribute to payment delays to IOCs, which could also contribute to slowing production growth next year.
OPEC noncrude liquids production, which averaged 6.3 million b/d in 2014, is expected to increase by 0.2 million b/d in 2015 and by 0.3 million b/d in 2016, led by increases in Iran and Qatar.
In November, unplanned crude oil supply disruptions among OPEC producers averaged 2.7 million b/d, 0.2 million b/d lower than the previous month. Iraq’s production recovered in November after bad weather in the southern Basra Gulf caused a more than 0.2 million b/d disruption in October. In Libya, the Zueitina export terminal port was shut again in early November, after briefly reopening in October. This closure partially offset the reduction in Iraq’s disruptions. Kuwait and Saudi Arabia continue to have a total disruption of 0.5 million b/d at the Wafra and Khafji fields in the Neutral Zone that straddles the two countries.
EIA expects OPEC surplus crude oil production capacity to average 1.5 million b/d in 2015 and 2.0 million b/d in 2016, after averaging 2.0 million b/d in 2014. EIA estimates that Iran’s crude oil production capacity is 3.6 million b/d, which is 0.8 million b/d higher than its current estimated production level. EIA currently categorizes that 0.8 million b/d as a disruption because Iran’s production is restricted by sanctions that affect the country’s ability to sell its oil. However, if sanctions are lifted next year, any difference between its crude oil production capacity and its crude oil production level would henceforth be considered surplus capacity.
Surplus capacity is typically an indicator of market conditions, and surplus capacity below 2.5 million b/d indicates a relatively tight oil market. However, the high current and forecast levels of global inventory builds make the projected low surplus capacity level in 2016 less significant.
OECD Petroleum Inventories. EIA estimates that OECD commercial crude oil and other liquids inventories totaled 2.70 billion barrels at the end of 2014, equivalent to roughly 59 days of consumption. Forecast OECD inventories rise to 2.98 billion barrels at the end of 2015 and then to 3.03 billion barrels at the end of 2016.
Crude Oil Prices. Brent crude oil spot prices decreased by $4/b in November to a monthly average of $44/b, as global oil supply continued to outpace demand. Continuing increases in global liquids inventories have put significant downward pressure on oil prices. Inventories rose by an estimated 1.8 million b/d through the first three quarters of 2015, compared with an average build of 0.5 million b/d over the same period in 2014. Global liquid fuels inventory builds are expected to slow to an average 1.4 million b/d in the fourth quarter of 2015, and then slow further to an average of 0.6 million b/d in 2016.
The monthly average WTI crude oil spot price averaged $42/b in November. WTI prices in November were down $4/b from the average in October, as crude oil inventories at the Cushing, Oklahoma, storage hub increased in November despite rising refinery inputs of crude oil following seasonal maintenance.
U.S. Energy Information Administration | Short-Term Energy Outlook December 2015 5
EIA forecasts that Brent crude oil prices will average $53/b in 2015 and $56/b in 2016. The 2015 forecast is $1/b lower than last month’s STEO, and the 2016 forecast is unchanged. Forecast WTI crude oil prices average $4/b lower than the Brent price in 2015 and $5/b lower in 2016.
EIA’s crude oil price forecast remains subject to significant uncertainties as the oil market moves toward balance. During this period of price discovery, oil prices could continue to experience periods of heightened volatility. The oil market faces many uncertainties heading into 2016, including the pace and volume at which Iranian oil reenters the market, the strength of oil consumption growth, and the responsiveness of non-OPEC production to low oil prices.
The current values of futures and options contracts continue to suggest high uncertainty in the price outlook (Market Prices and Uncertainty Report). WTI futures contracts for March 2016 delivery, traded during the five-day period ending December 3, averaged $44/b, while implied volatility averaged 42%. These levels established the lower and upper limits of the 95% confidence interval for the market's expectations of monthly average WTI prices in March 2016 at $30/b and $63/b, respectively. The 95% confidence interval for market expectations widens over time, with lower and upper limits of $26/b and $90/b for prices in December 2016. Last year at this time, WTI for March 2015 delivery averaged $67/b, and implied volatility averaged 32%. The corresponding lower and upper limits of the 95% confidence interval were $51/b and $89/b.
U.S. Petroleum and Other Liquids
Monthly data show gasoline consumption in the United States increased by 3.0% during the first nine months of 2015 compared with same period in 2014. U.S. gasoline consumption growth reflects increases in employment and lower gasoline prices. Growing domestic consumption and strong gasoline consumption growth globally contributed to high refinery wholesale gasoline margins (the difference between the wholesale price of gasoline and the price of Brent crude oil) for most of 2015. Average wholesale gasoline margins reached 73 cents/gal in August, which was the highest monthly average since May 2007. Margins returned closer to typical seasonal levels in October but increased in November, a month in which they typically decline.
Despite the increasing wholesale gasoline margins, U.S. average regular gasoline retail prices fell from a monthly average of $2.29/gal in October to $2.16/gal in November because of lower crude oil prices. On November 23, the U.S. average regular gasoline retail price was $2.09/gal, the lowest price heading into the Thanksgiving holiday since 2008. Monthly average regional gasoline retail prices for November ranged from a low of $1.90/gal in PADD 3 (Gulf Coast) to a high of $2.62/gal in PADD 5 (West Coast). EIA expects gasoline prices to fall from current levels, with the U.S. regular gasoline price averaging $2.04/gal in December 2015.
Liquid Fuels Consumption. Total U.S. liquid fuels consumption is projected to increase by 290,000 b/d (1.5%) in 2015, higher than the 140,000 b/d (0.8%) increase in 2014. U.S. consumption has been stimulated by continuing employment and economic growth and lower petroleum product prices. Total liquid fuels consumption growth in 2016 is forecast to average 160,000 b/d (0.8%).
U.S. Energy Information Administration | Short-Term Energy Outlook December 2015 6
In 2015, liquid fuels consumption growth is led by motor gasoline, which is forecast to increase by 220,000 b/d (2.4%) to an average of 9.1 million b/d, the highest level since the record of 9.3 million b/d in 2007. Although total nonfarm employment and total highway travel have increased by 2.9% and 3.7%, respectively, over the past eight years, improving vehicle fuel economy continues to keep gasoline consumption below its previous peak. Gasoline consumption growth is forecast to slow to 10,000 b/d (0.1%) in 2016, as a long-term trend toward more-fuel-efficient vehicles continues to offset the effects of economic and population growth on highway travel.
Jet fuel consumption, which grew by 40,000 b/d (2.5%) in 2014, is forecast to rise by 60,000 b/d (4.3%) in 2015. Forecast jet fuel consumption is down slightly in 2016, with improvement in average airline fleet fuel economy offsetting growth in freight and passenger travel.
After increasing by 210,000 b/d (5.5%) in 2014, consumption of distillate fuel, which includes diesel fuel and heating oil, is forecast to fall by 30,000 b/d (0.9%) in 2015 and to increase by 40,000 b/d (1.0%) in 2016. The 2016 growth is driven by increases in manufacturing output, foreign trade, and marine fuel use.
Hydrocarbon gas liquids (HGL) consumption, which fell by 50,000 b/d (1.9%) in 2014, is projected to remain flat in 2015. Projected consumption rises by 100,000 b/d (4.1%) in 2016, as a return to more-normal temperatures increases heating consumption of propane and expanded petrochemical plant capacity increases the use of HGL, especially ethane, as a feedstock. New HGL export terminal capacity contributes to an increase in HGL net exports from an average of 560,000 b/d in 2014 to 1.1 million b/d in 2016.
Liquid Fuels Supply. U.S. crude oil production is projected to increase from an average of 8.7 million b/d in 2014 to 9.3 million b/d in 2015 and then decrease to 8.8 million b/d in 2016. This forecast is mostly unchanged from last month’s STEO.
According to the latest survey-based reporting of monthly crude oil production estimates, U.S. production averaged 9.4 million b/d through the first nine months of 2015. This level is 0.1 million b/d higher than the average production during the fourth quarter of 2014, despite a more than 60% decline in the total U.S. oil-directed rig count since October 2014. However, monthly crude oil production started to decrease in the second quarter of 2015. Lower 48 onshore output began declining in April 2015, and it has fallen from 7.6 million b/d in March to an estimated 7.1 million b/d in November. Total U.S. crude oil production began declining in May 2015, and has fallen from 9.6 million b/d in April to an estimated 9.2 million b/d in November.
EIA expects U.S. crude oil production declines to continue through September 2016, when total production is forecast to average 8.5 million b/d. This level of production would be 1.1 million b/d less than the recent monthly peak reached in April 2015. Forecast production begins increasing in late 2016, returning to an average of 8.7 million b/d in the fourth quarter.
U.S. Energy Information Administration | Short-Term Energy Outlook December 2015 7
Expected crude oil production declines through September 2016 are largely attributable to unattractive returns in some areas of both emerging and mature onshore oil production regions, as well as seasonal factors such as anticipated hurricane-related production disruptions in the Gulf of Mexico. Reductions in 2015 cash flows and capital expenditures have prompted companies to defer or redirect investment away from marginal exploration and research drilling to focus on core areas of major tight oil plays. Reduced investment has resulted in the lowest count of oil-directed rigs in five years and in well completions that are significantly lower than 2014 levels.
Projected oil prices below $60/b throughout the forecast period are expected to limit onshore drilling activity and well completion totals, despite continued increases in rig and well productivity and falling drilling and completion costs. The forecast remains sensitive to actual wellhead prices and rapidly changing drilling economics that vary across regions and operators.
Projected crude oil production in the Gulf of Mexico rises during the forecast period, and oil production in Alaska falls. Production in these areas is less sensitive to short-term price movements than onshore production in the Lower 48 states and reflects anticipated growth from new projects in the Gulf of Mexico and declines from legacy fields in Alaska. Twelve projects are scheduled to come online in the Gulf of Mexico in 2015 and 2016, pushing up production from an average of 1.4 million b/d in the fourth quarter of 2014 to 1.7 million b/d in the fourth quarter of 2016. It is possible some projects will start production later than expected, shifting some of the anticipated production gains from late 2016 into early 2017.
HGL production at natural gas processing plants reached 3.3 million b/d in September 2015, and it is projected to average 3.3 million b/d in 2015 and 3.5 million b/d in 2016. Expected additions of natural gas processing and distribution infrastructure contribute to forecast HGL production growing at a faster pace than the natural gas streams from which it is produced. Marketed natural gas, which is primarily produced at natural gas wells but also includes associated gas from oil wells, is forecast to increase by 6.3% in 2015 and by 1.9% in 2016, compared with 6.9% growth in 2014. EIA expects higher ethane recovery rates in 2016, following planned increases to petrochemical plant feedstock demand in the United States and abroad. In the forecast, terminal builds and expansions and a growing ship fleet allow more U.S. ethane, propane, and butanes to reach international markets, with forecast net HGL exports averaging 1.1 million b/d in 2016.
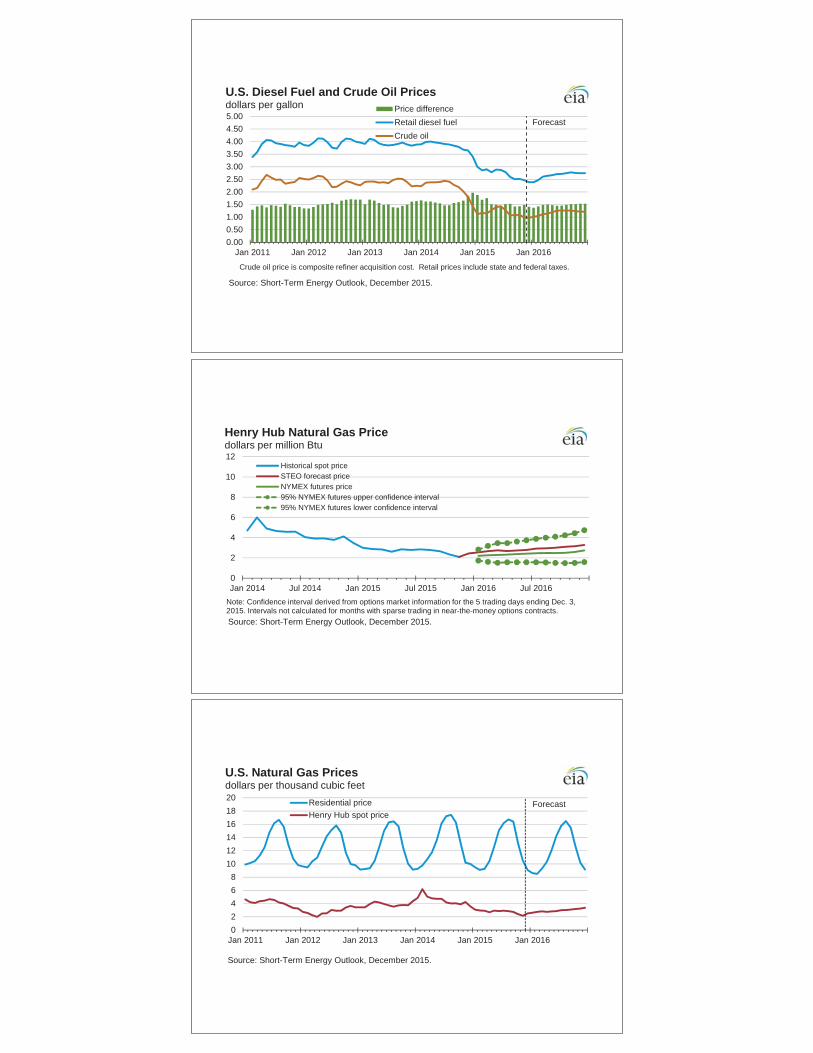
Petroleum Product Prices. Lower crude oil prices contributed to U.S. regular gasoline retail prices declining to an average of $2.16/gal in November, down from an average of $2.29/gal in October. EIA projects regular gasoline retail prices to average $2.04/gal in December 2015 and $2.14/gal in the first quarter of 2016.
The U.S. regular gasoline retail price, which averaged $3.36/gal in 2014, is projected to average $2.43/gal in 2015 and $2.36/gal in 2016. The diesel fuel retail price, which averaged $3.83/gal in 2014, is projected to average $2.71/gal in 2015 and $2.67/gal in 2016.

U.S. Energy Information Administration | Short-Term Energy Outlook December 2015 8
Lower projected crude oil prices this winter compared with last winter contribute to a reduction in the forecast residential heating oil price and average household heating oil expenditures. Households that use heating oil as a primary space heating fuel are expected to pay an average of $2.40/gal this winter, 64 cents/gal lower than last winter. The average household is now expected to spend $1,282 for heating oil this winter, $570 less than last winter. The reduction in expenditures also reflects lower forecast consumption because of warmer forecast temperatures this winter compared with last winter.
Propane prices this winter are expected to be 7% lower in the Northeast and 15% lower in the Midwest, contributing to households spending 18% and 25% less on propane in those regions, respectively.
Natural Gas
Working natural gas inventories on November 20 reached their highest recorded level at 4,009 billion cubic feet (Bcf), according to EIA’s Weekly Natural Gas Storage Report (WNGSR). Although the storage injection season is commonly considered to end on October 31, builds often continue into November. Looking to March 2016, EIA projects inventories will end the winter at 1,862 Bcf, which would be a smaller drawdown than typically seen during the winter.
On November 19, EIA updated the classification of natural gas storage regions in the WNGSR. Natural gas inventories are now reported for five new regions instead of the previous three regions. This STEO reflects those changes, and a more detailed discussion of the changes can be found in a supplemental analysis to this STEO.
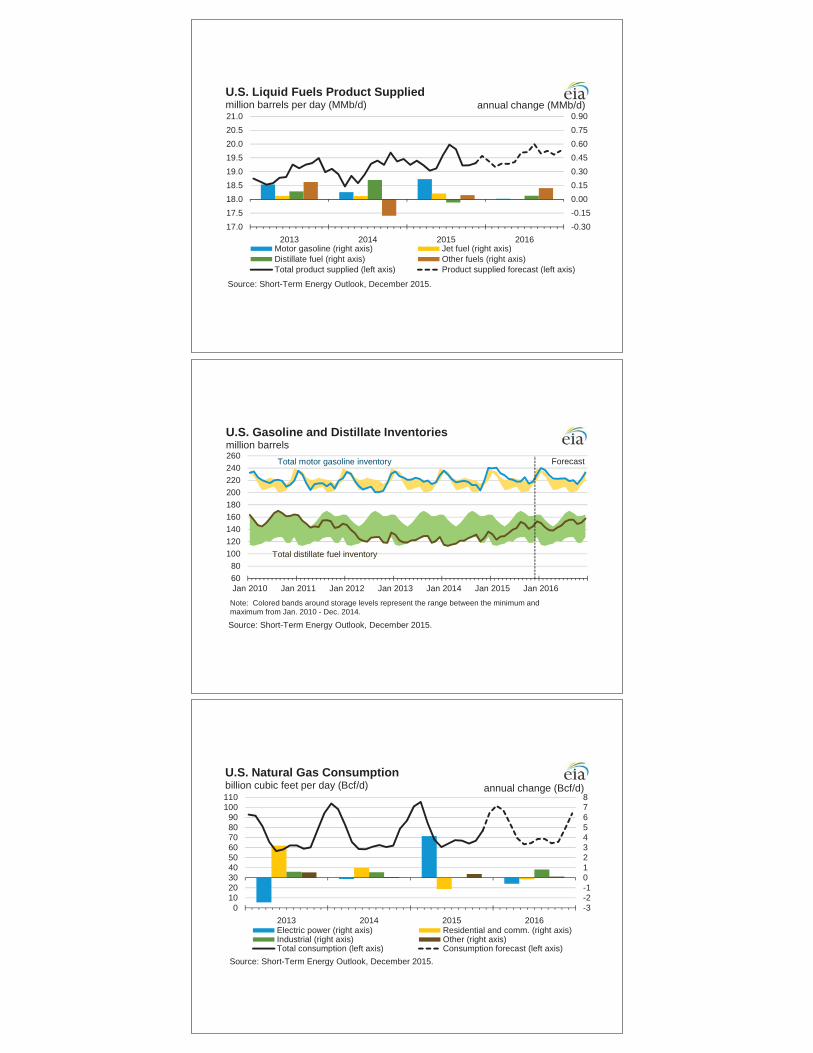
Strong inventory builds, continuing production growth, and expectations for warmer-than-normal winter temperatures have all contributed to low natural gas prices. Forecast Henry Hub spot prices for 2016 average $2.88 per million British thermal units (MMBtu), 12 cents/MMBtu lower than last month’s forecast.
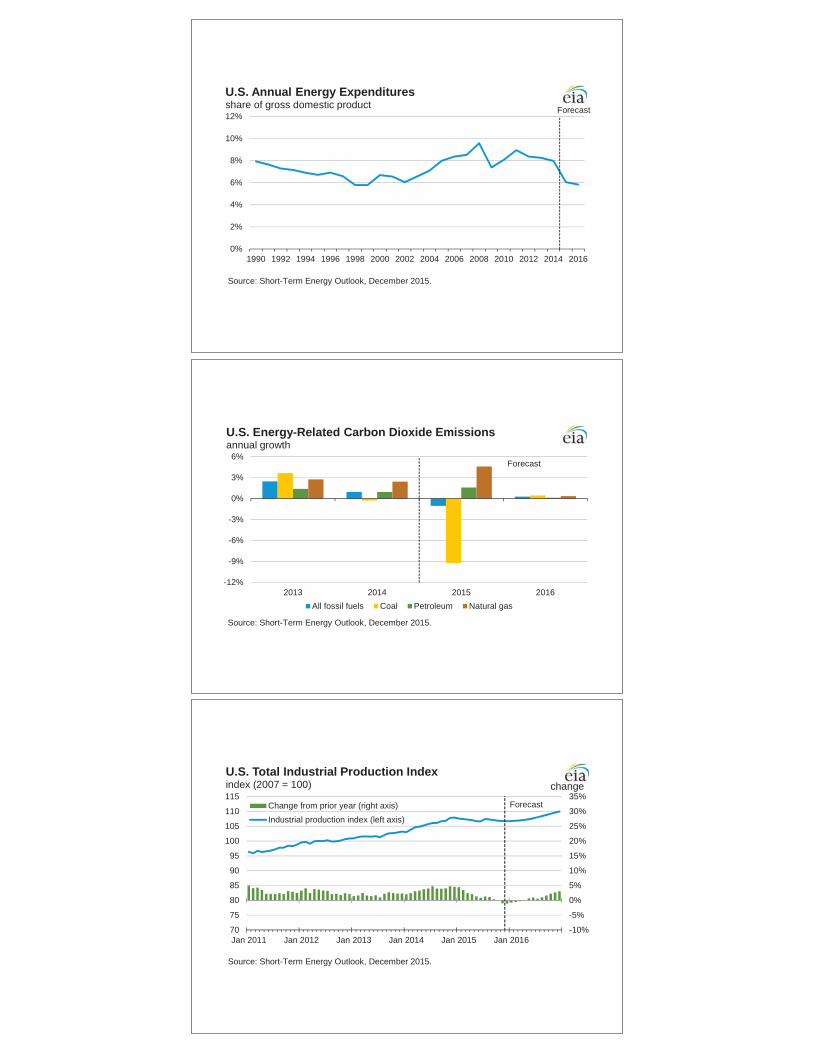
Based on lower forecast residential natural gas prices than last winter and a forecast of warmer temperatures across much of the United States, EIA expects heating expenditures for households using natural gas as their primary space heating fuel to average 13% lower this winter compared with last winter.
Natural Gas Consumption. EIA's forecast of U.S. total natural gas consumption averages 76.5 billion cubic feet/day (Bcf/d) in 2015 and 76.7 Bcf/d in 2016, compared with 73.1 Bcf/d in 2014. Increases in power sector consumption drive total consumption growth in 2015. EIA projects natural gas consumption in the power sector to increase by 18.6% in 2015 and then to decrease by 2.3% in 2016. Despite a projected decrease in 2016, EIA expects consumption of natural gas for power generation will remain more than 3 Bcf/d above 2014 levels. Natural gas spot prices, which are expected to remain below $3/MMBtu through August 2016, support high consumption of natural gas for electricity next year. Industrial sector consumption of natural gas remains flat in 2015 and increases by 3.9% in 2016, as new industrial projects, particularly in the fertilizer and chemicals sectors, come online. Natural gas consumption in the residential and

U.S. Energy Information Administration | Short-Term Energy Outlook December 2015 9
commercial sectors is projected to decline in both 2015 and 2016, largely reflecting lower heating demand this winter compared with last winter.
Natural Gas Production and Trade. In September, total marketed production hit a record high of 81.1 Bcf/d. EIA expects that marketed natural gas production will average 79.6 Bcf/d in 2015, an increase of 4.7 Bcf/d (6.3%) from 2014. Forecast marketed natural gas production increases by 1.5 Bcf/d (1.9%) in 2016. Increases in drilling efficiency will continue to support growing natural gas production in the forecast despite low natural gas prices and declining rig activity. Most of the growth is expected to come from the Marcellus Shale, as the backlog of uncompleted wells is reduced and as new pipelines come online to deliver Marcellus natural gas to markets in the Northeast. Several major projects have recently come online in the Marcellus, and a few others are set to begin service before the end of the year. In Pennsylvania, where most Marcellus drilling is located, production growth was flat earlier this year, but production reached a record level in September, according to EIA’s most recent production data.
Continuing increases in domestic natural gas production are expected to reduce demand for natural gas imports from Canada and to support growth in exports to Mexico. EIA expects natural gas exports to Mexico, particularly from the Eagle Ford Shale in South Texas, to increase because of growing demand from Mexico's electric power sector coupled with flat natural gas production in Mexico. EIA projects LNG gross exports will increase to an average of 0.7 Bcf/d in 2016, with the startup of Cheniere’s Sabine Pass LNG liquefaction plant planned for early 2016.
Natural Gas Inventories. On November 20, natural gas working inventories reached a record high 4,009 Bcf. Inventories declined for the first time in this heating season during the week ending November 27, but remained 543 Bcf (16%) above year-ago levels and 247 Bcf (7%) above the five-year (2010-14) average. Forecast end-of-March 2016 inventories are 1,862 Bcf, which would be 240 Bcf above the five-year average.
Natural Gas Prices. The Henry Hub natural gas spot price averaged $2.09/MMBtu in November, a decrease of 25 cents/MMBtu from the October price. Warmer-than-normal temperatures in November, record inventory levels, production growth, and forecasts for a warm winter contributed to spot prices remaining at low levels. Monthly average Henry Hub spot prices are forecast to remain less than $3/MMBtu through August 2016. The projected Henry Hub natural gas price averages $2.67/MMBtu in 2015 and $2.88/MMBtu in 2016.
Natural gas futures contracts for March 2016 delivery traded during the five-day period ending December 3 averaged $2.29/MMBtu. Current options and futures prices imply market participants place the lower and upper bounds for the 95% confidence interval for March 2016 contracts at $1.51/MMBtu and $3.45/MMBtu, respectively. At this time in 2014, the natural gas futures contract for March 2015 delivery averaged $3.84/MMBtu, and the corresponding lower and upper limits of the 95% confidence interval were $2.40/MMBtu and $6.13/MMBtu.

U.S. Energy Information Administration | Short-Term Energy Outlook December 2015 10
Coal
Coal Supply. Forecast U.S. coal production in 2015 declines by 97 million short tons (MMst) (10%). Forecast production decreases in all coal-producing regions, with the largest percentage decrease occurring in the Appalachian region (13%). Interior region production, which includes the Illinois Basin, declines by 8%, the first annual decline for that region since 2009. Western region production declines by 9%, dropping below 500 MMst for the first time since 1998.
U.S. coal production is expected to decline by an additional 29 MMst (3%) in 2016. Interior region production, which accounted for 16% of coal production in 2011, accounts for 21% of production in 2016. This increase reflects the region’s growing competitive advantages compared with the other coal-producing regions. These factors include the higher heat content of the coal, closer proximity to major markets than coal produced in the Western region, and lower mining costs than Appalachian-produced coal.
Electric power sector coal stockpiles were 162 MMst in September, a 4% increase from August, which is similar to the typical seasonal pattern. September coal inventories averaged 147 MMst during the previous 10 years (2005-14). Coal stockpiles are still relatively high because of the loss in market share to natural gas for power generation.
Coal Consumption. Forecast coal consumption decreases by 10% in 2015, mainly as a result of a 10% drop in electric power sector consumption. Lower natural gas prices are the primary driver of the decrease in coal consumption. Low natural gas prices make it more economical to increase generation at natural gas-fired units and to decrease generation at coal units. Retirements of coal-fired power plants, stemming from both increased competition with natural gas generation and the implementation of the Mercury and Air Toxics Standards (MATS), also reduce coal-fired capacity in the power sector, but the full effect will not be evident until 2016.
Higher forecast natural gas prices in 2016 are expected to contribute to higher utilization rates among the remaining coal-fired power plants, which mitigates the effect of lower consumption because of coal-plant retirements. Coal consumption in the electric power sector is forecast to increase by 1% in 2016, as electricity demand rises and electricity generation from natural gas and nuclear decline.
Coal Trade. Slower growth in world coal demand and lower international coal prices have contributed to a decline in U.S. coal exports. Lower mining costs, cheaper transportation costs, and favorable exchange rates will continue to provide an advantage to mines in other major coal-exporting countries compared with U.S. producers over the next few years. U.S. coal exports for the first nine months of 2015 were down 22% (16 MMst) compared with the same period in 2014. Forecast coal exports fall by 20 MMst (21%) to 77 MMst in 2015. The current global coal market trends are expected to continue, and coal exports are forecast to decline by an additional 6 MMst (8%) in 2016.
U.S. coal imports, which increased by 2 MMst in 2014 to more than 11 MMst, are expected to be largely unchanged in 2015 and 2016. Coal imports, primarily from Latin America, are forecast
U.S. Energy Information Administration | Short-Term Energy Outlook December 2015 11
to maintain their market share with power generators along the Atlantic and Gulf coasts, as imported coal’s delivered price in those markets remains competitive with prices for domestically produced coal.
Coal Prices. The annual average coal price to the electric power sector averaged $2.37/MMBtu in 2014. EIA expects the delivered coal price to average $2.24/MMBtu in 2015 and 2016.
Electricity
According to the latest available EIA data, electricity generated from natural gas-fired power plants exceeded generation from coal-fired plants in September for the third month in a row. Before April 2015, the monthly share of total U.S. generation fueled by coal had always been larger than the natural gas share. Natural gas generation in September was 123,248 gigawatthours, 4% higher than the level generated by coal. This increased use of natural gas for electricity generation primarily reflects sustained low prices for the fuel. The average Henry Hub spot price for natural gas was $2.09/MMBtu in November, the lowest price since April 2012.
Electricity Consumption. Retail sales of electricity to the residential sector during the first half of 2015 were 1.7% lower than the same period in 2014, primarily because of milder winter weather earlier this year compared with the previous year. However, residential sales in the third quarter this year were 5.4% higher than in 2014, as cooling degree days during that quarter were 13% higher than in the third quarter of 2014. Forecast annual average retail residential sales rise by 0.5% in 2015 and then decline at the same rate in 2016. Forecast retail electricity sales to the commercial sector rise by 0.6% and by 0.7% in 2015 and 2016, respectively. Forecast industrial sector sales fall by 3.6% in 2015 and then rise by 1.4% in 2016.
Electricity Generation. Total U.S. electricity generation in 2015 is expected to average 11.3 terawatthours per day, 0.5% higher than 2014 generation. Total generation grows by an additional 0.1% in 2016. Although EIA projects natural gas prices to begin rising slowly, they are forecast to remain at low levels, with the Henry Hub spot price remaining below $3/MMBtu through August 2016. These sustained low prices contribute to natural gas accounting for a historically large share of electricity generation. During 2015, EIA expects the share of total generation fueled by natural gas to average 32.4% compared with a share of 27.5% in 2014. Coal’s share of total electricity generation is forecast to average 34.1% in 2015 compared with 38.6% last year. In 2016, the natural gas share of generation is forecast to be 31.6%, with the coal share at 34.1%.
Electricity Retail Prices. The U.S. retail price of electricity to the residential sector is projected to average 12.6 cents per kilowatthour in 2015, 0.7% higher than the average price in 2014. The largest price increases are in New England, where residential electricity prices are forecast to increase by 9.6% in 2015. In percentage terms, the largest electricity residential sector price decrease in 2015 is expected to be in the West South Central region (1.9%). In 2016, the U.S. retail price of electricity to the residential sector is projected to average 12.7 cents per kilowatthour, a 0.7% increase from 2015.
U.S. Energy Information Administration | Short-Term Energy Outlook December 2015 12
Renewables and Carbon Dioxide Emissions
Electricity and Heat Generation from Renewables. EIA expects total renewables used in the electric power sector to decrease by 1.8% in 2015. Hydropower generation is forecast to decrease by 8.2%, and nonhydropower renewable power generation is forecast to increase by 4.2%. The 2015 decrease in hydropower generation reflects the effects of the California drought. Forecast hydropower generation in the electric power sector increases by 7.3% in 2016.
EIA expects continued growth in utility-scale solar power generation, which is projected to average 89 gigawatthours per day (GWh/d) in 2016. Because the growth is from a small base, utility-scale solar power averages 0.8% of total U.S. electricity generation in 2016. Although solar growth has historically been concentrated in customer-sited distributed generation installations (rooftop panels), EIA expects utility-scale solar capacity will increase by 123% (12 GW) between the end of 2014 and the end of 2016, with 4.7 GW of new capacity being built in California. Other states leading in utility-scale solar capacity additions include North Carolina and Nevada, which, combined with California, account for about two-thirds of the projected utility-scale capacity additions for 2015 and 2016.
Wind capacity, which starts from a significantly larger installed capacity base than solar, grew by 8% in 2014, and it is forecast to increase by 13% in 2015 and by 14% in 2016.
Liquid Biofuels. On November 30, the U.S. Environmental Protection Agency (EPA) finalized a rule setting Renewable Fuel Standard (RFS) volumes for 2014 through 2016. EIA used these finalized volumes to develop the current STEO forecast. Ethanol production, which averaged 934,000 b/d in 2014, is forecast to average about 960,000 b/d in both 2015 and 2016. Ethanol consumption, which averaged 877,000 b/d in 2014, is forecast to average 905,000 b/d in 2015 and 918,000 in 2016. The 2016 forecast is about 20,000 b/d higher than in last month’s STEO. This level of consumption results in the ethanol share of the total gasoline pool averaging 9.9% in 2015 and 10.0% in 2016. EIA does not expect significant increases in E15 or E85 consumption over the forecast period.
EIA expects the largest effect of the proposed RFS targets will be on biodiesel consumption, which helps to meet the RFS targets for use of biomass-based diesel, advanced biofuel, and total renewable fuel. Biodiesel production averaged 83,000 b/d in 2014 and is forecast to average 87,000 b/d in 2015 and 107,000 b/d in 2016, 4,000 b/d lower and 9,000 b/d higher than last month’s STEO, respectively. Net imports of biomass-based diesel are also expected to increase from 15,000 b/d in 2014 to 28,000 b/d in 2015, and to 47,000 b/d in 2016, 2,000 b/d higher and 12,000 b/d higher that in last month’s STEO, respectively.
Energy‐Related Carbon Dioxide Emissions. EIA estimates that emissions of CO2 grew by 0.9% in 2014. Emissions are projected to fall by 1.0% in 2015 and then increase by 0.3% in 2016. These forecasts are sensitive to assumptions about weather and economic growth.
U.S. Energy Information Administration | Short-Term Energy Outlook December 2015 13
U.S. Economic Assumptions
Recent Economic Indicators. The Bureau of Economic Analysis reported that real GDP increased at an annual rate of 2.1% in the third quarter of 2015, following growth of 3.9% in the second quarter of 2015. The third-quarter growth reflected positive contributions from personal consumption expenditures, state and local government spending, and residential fixed investment, and it was revised upward from the previous estimate of 1.5%.
EIA used the November 2015 version of the IHS macroeconomic model with EIA's energy price forecasts as model inputs to develop the economic projections in the STEO.
Production, Income, and Employment. Forecast real GDP growth is 2.4% in 2015 and 2.5% in 2016, below the 2.5% and 2.7% forecast last month. Real disposable income grows by 3.2% in 2015 and by 2.9% in 2016. Total industrial production grows by 1.3% in 2015 and by 0.9% in 2016. Projected growth in nonfarm employment averages 2.1% in 2015 and 1.4% in 2016.
Expenditures. Forecast private real fixed investment growth averages 4.3% and 6.2% in 2015 and 2016, respectively. Real consumption expenditures grow faster than real GDP, at 3.2% in 2015 and 2.8% in 2016. Durable goods expenditures drive consumption spending in both years. Export growth is 1.6% and 2.8% over the same two years, while import growth is 5.2% in 2015 and 5.1% in 2016. Total government expenditures rise 0.8% in 2015.
This report was prepared by the U.S. Energy Information Administration (EIA), the statistical and analytical agency within the U.S. Department of Energy. By law, EIA's data, analyses, and forecasts are independent of approval by any other officer or employee of the United States Government. The views in this report therefore should not be construed as representing those of the U.S. Department of Energy or other federal agencies.
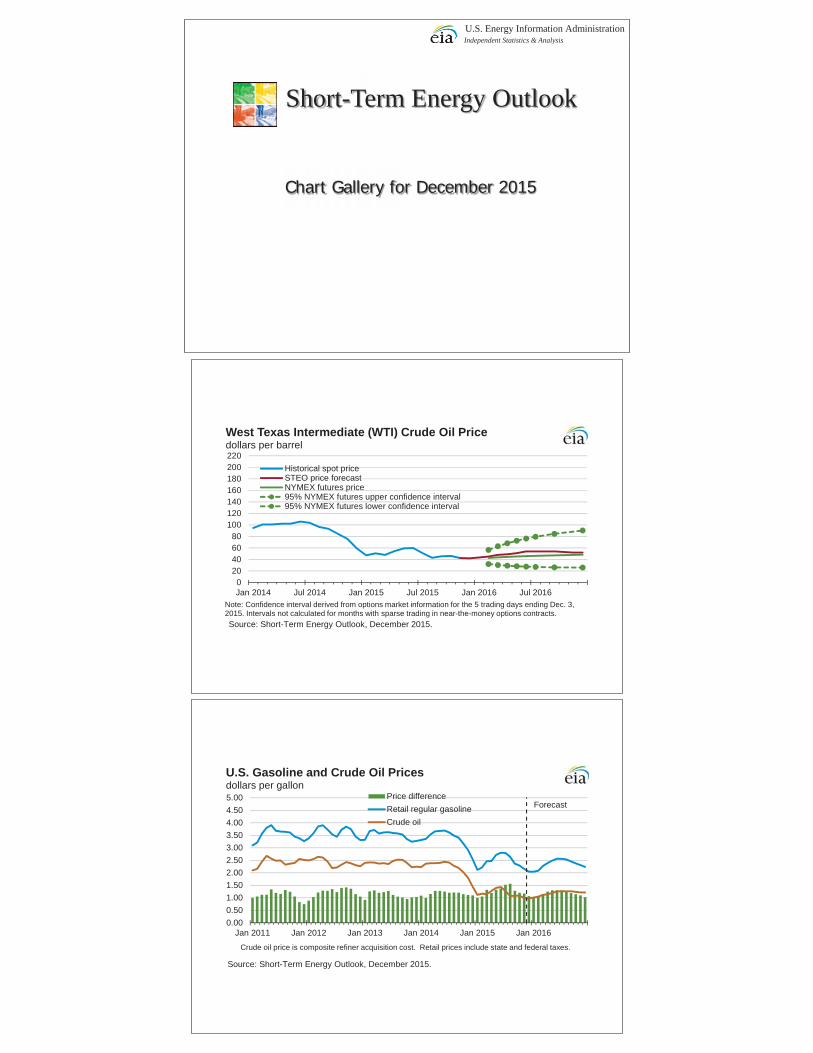
Chart Gallery for December 2015
Short-Term Energy Outlook
U.S. Energy Information Administration Independent Statistics & Analysis
020406080
100120140160180200220
Jan 2014 Jul 2014 Jan 2015 Jul 2015 Jan 2016 Jul 2016
West Texas Intermediate (WTI) Crude Oil Pricedollars per barrel
Historical spot priceSTEO price forecastNYMEX futures price95% NYMEX futures upper confidence interval95% NYMEX futures lower confidence interval
Source: Short-Term Energy Outlook, December 2015.
Note: Confidence interval derived from options market information for the 5 trading days ending Dec. 3, 2015. Intervals not calculated for months with sparse trading in near-the-money options contracts.
Forecast
0.000.501.001.502.002.503.003.504.004.505.00
Jan 2011 Jan 2012 Jan 2013 Jan 2014 Jan 2015 Jan 2016
U.S. Gasoline and Crude Oil Pricesdollars per gallon
Price differenceRetail regular gasolineCrude oil
Source: Short-Term Energy Outlook, December 2015.
Crude oil price is composite refiner acquisition cost. Retail prices include state and federal taxes.
Forecast
0.000.501.001.502.002.503.003.504.004.505.00
Jan 2011 Jan 2012 Jan 2013 Jan 2014 Jan 2015 Jan 2016
U.S. Diesel Fuel and Crude Oil Pricesdollars per gallon Price difference
Retail diesel fuelCrude oil
Source: Short-Term Energy Outlook, December 2015.
Crude oil price is composite refiner acquisition cost. Retail prices include state and federal taxes.
0
2
4
6
8
10
12
Jan 2014 Jul 2014 Jan 2015 Jul 2015 Jan 2016 Jul 2016
Henry Hub Natural Gas Pricedollars per million Btu
Historical spot priceSTEO forecast priceNYMEX futures price95% NYMEX futures upper confidence interval95% NYMEX futures lower confidence interval
Source: Short-Term Energy Outlook, December 2015.
Note: Confidence interval derived from options market information for the 5 trading days ending Dec. 3, 2015. Intervals not calculated for months with sparse trading in near-the-money options contracts.
Forecast
02468
101214161820
Jan 2011 Jan 2012 Jan 2013 Jan 2014 Jan 2015 Jan 2016
U.S. Natural Gas Pricesdollars per thousand cubic feet
Residential priceHenry Hub spot price
Source: Short-Term Energy Outlook, December 2015.

Forecast
-3-2-10123456
828486889092949698
100
2010-Q1 2011-Q1 2012-Q1 2013-Q1 2014-Q1 2015-Q1 2016-Q1
World Liquid Fuels Production andConsumption Balancemillion barrels per day (MMb/d)
Implied stock change and balance (right axis)
World production (left axis)
World consumption (left axis)
Source: Short-Term Energy Outlook, December 2015.
MMb/d
0.0
0.5
1.0
1.5
2.0
2.5
3.0
Jan 2012 Jul 2012 Jan 2013 Jul 2013 Jan 2014 Jul 2014 Jan 2015 Jul 2015
Estimated Historical Unplanned OPEC Crude Oil Production Outagesmillion barrels per day
Saudi ArabiaKuwaitIraqNigeriaLibyaIran
Source: Short-Term Energy Outlook, December 2015.
0.0
0.2
0.4
0.6
0.8
1.0
1.2
1.4
Jan 2012 Jan 2013 Jan 2014 Jan 2015
Estimated Historical Unplanned Non-OPEC Liquid Fuels Production Outagesmillion barrels per day Other
United States
Mexico
Canada
Sudan / S. Sudan
Colombia
Brazil
North Sea
Yemen
China
Syria
Source: Short-Term Energy Outlook, December 2015.

Forecast
-2-10123456789
767880828486889092949698
2008 2009 2010 2011 2012 2013 2014 2015 2016
World Liquid Fuels Consumptionmillion barrels per day (MMb/d)
Change in U.S. consumption (right axis)Change in China consumption (right axis)Change in other consumption (right axis)Total world consumption (left axis)
annual change (MMb/d)
Source: Short-Term Energy Outlook, December 2015.
-0.4
-0.2
0.0
0.2
0.4
0.6
0.8
1.0
2014 2015 2016
World Liquid Fuels Consumption Growthmillion barrels per day
OECD* Non-OECD Asia Former Soviet Union Other
Source: Short-Term Energy Outlook, December 2015.
* Countries belonging to the Organization for Economic Cooperation and Development
Forecast
-0.5
0.0
0.5
1.0
1.5
2.0
2.5
2014 2015 2016OPEC countries North America Russia and Caspian Sea
Latin America North Sea Other Non-OPEC
World Crude Oil and Liquid Fuels Production Growthmillion barrels per day
Source: Short-Term Energy Outlook, December 2015.
Forecast

-0.5
0.0
0.5
1.0
1.5
2.0
2.5
3.0
Uni
ted
Stat
es
Braz
il
Can
ada
Chi
na
Mal
aysi
a
Rus
sia
Kaza
khst
an
Om
an
Suda
n/S.
Sud
an
Aust
ralia
Indi
a
Col
ombi
a
Viet
nam
Azer
baija
n
Oth
er N
orth
Sea
Egy
pt
Nor
way
Gab
on
Syria
Uni
ted
King
dom
Mex
ico
201620152014
Non-OPEC Crude Oil and Liquid Fuels Production Growthmillion barrels per day
Source: Short-Term Energy Outlook, December 2015.
Forecast
-100
-80
-60
-40
-20
0
20
40
60
80
2012-Q1 2013-Q1 2014-Q1 2015-Q1 2016-Q1-1
0
1
2
3
4
5
6
7
8 World oil consumption growth (left axis)
Non-OPEC production growth (left axis)
Change in WTI price (right axis)
World Consumption and Non-OPEC Production Growthmillion barrels per day dollars per barrel
Source: Short-Term Energy Outlook, December 2015.
0
1
2
3
4
5
6
2004 2005 2006 2007 2008 2009 2010 2011 2012 2013 2014 2015 2016
OPEC surplus crude oil production capacitymillion barrels per day
Source: Short-Term Energy Outlook, December 2015.Note: Shaded area represents 2004-2014 average (2.2 million barrels per day).
Forecast

Forecast
45
50
55
60
65
70
Jan 2010 Jan 2011 Jan 2012 Jan 2013 Jan 2014 Jan 2015 Jan 2016
OECD Commercial Stocks of Crude Oil and Other Liquids (days of supply)
Source: Short-Term Energy Outlook, December 2015.
Note: Colored band around days of supply of crude oil and other liquids stocks represents the range between the minimum and maximum from Jan. 2010 - Dec. 2014.
-0.6-0.4-0.20.00.20.40.60.81.01.21.41.6
2013 2014 2015 20166789
1011121314151617
U.S. Crude Oil and Liquid Fuels Productionmillion barrels per day (MMb/d)
Crude oil (right axis) Natural gas plant liquids (right axis)Fuel ethanol (right axis) Biodiesel (right axis)Total production (left axis) Production forecast (left axis)
annual change (MMb/d)
Source: Short-Term Energy Outlook, December 2015.
Forecast
275300325350375400425450475500525
Jan 2010 Jan 2011 Jan 2012 Jan 2013 Jan 2014 Jan 2015 Jan 2016
U.S. Commercial Crude Oil Stocksmillion barrels
Source: Short-Term Energy Outlook, December 2015.
Note: Colored band around storage levels represents the range between the minimum and maximum from Jan. 2010 - Dec. 2014.
-0.30-0.150.000.150.300.450.600.750.90
2013 2014 2015 201617.017.518.018.519.019.520.020.521.0
U.S. Liquid Fuels Product Suppliedmillion barrels per day (MMb/d)
Motor gasoline (right axis) Jet fuel (right axis)Distillate fuel (right axis) Other fuels (right axis)Total product supplied (left axis) Product supplied forecast (left axis)
annual change (MMb/d)
Source: Short-Term Energy Outlook, December 2015.
Forecast
6080
100120140160180200220240260
Jan 2010 Jan 2011 Jan 2012 Jan 2013 Jan 2014 Jan 2015 Jan 2016
U.S. Gasoline and Distillate Inventoriesmillion barrels
Source: Short-Term Energy Outlook, December 2015.
Note: Colored bands around storage levels represent the range between the minimum and maximum from Jan. 2010 - Dec. 2014.
Total motor gasoline inventory
Total distillate fuel inventory
-3-2-1012345678
2013 2014 2015 20160
102030405060708090
100110
U.S. Natural Gas Consumptionbillion cubic feet per day (Bcf/d)
Electric power (right axis) Residential and comm. (right axis)Industrial (right axis) Other (right axis)Total consumption (left axis) Consumption forecast (left axis)
annual change (Bcf/d)
Source: Short-Term Energy Outlook, December 2015.

-2-10123456789
2013 2014 2015 2016626466687072747678808284
U.S. Natural Gas Production and Importsbillion cubic feet per day (Bcf/d)
Federal Gulf of Mexico production (right axis) U.S. non-Gulf of Mexico production (right axis)U.S. net imports (right axis) Total marketed production (left axis)Marketed production forecast (left axis)
annual change (Bcf/d)
Source: Short-Term Energy Outlook, December 2015.
Forecast
-60%-40%-20%0%20%40%60%80%100%120%
-4,000-3,000-2,000-1,000
01,0002,0003,0004,0005,000
Jan 2011 Jan 2012 Jan 2013 Jan 2014 Jan 2015 Jan 2016
U.S. Working Natural Gas in Storagebillion cubic feet
Deviation from averageStorage level
deviation from average
Source: Short-Term Energy Outlook, December 2015.
Note: Colored band around storage levels represents the range between the minimum and maximum from Jan. 2010 - Dec. 2014.
-100-80-60-40-20020406080100
2013 2014 2015 20160
102030405060708090
100
U.S. Coal Consumptionmillion short tons (MMst)
Electric power (right axis) Retail and general industry (right axis)Coke plants (right axis) Total consumption (left axis)Consumption forecast (left axis)
annual change (MMst)
Source: Short-Term Energy Outlook, December 2015.

-60
-30
0
30
60
90
2013 2014 2015 201650
60
70
80
90
100
U.S. Coal Productionmillion short tons (MMst)
Western region (right axis) Appalachian region (right axis)Interior region (right axis) Total production (left axis)Production forecast (left axis)
annual change (MMst)
Source: Short-Term Energy Outlook, December 2015.
Forecast
0255075
100125150175200225250
Jan 2007 Jan 2009 Jan 2011 Jan 2013 Jan 2015
U.S. Electric Power Coal Stocksmillion short tons
Source: Short-Term Energy Outlook, December 2015.
Note: Colored band around stock levels represents the range between the minimum and maximum from Jan. 2007 - Dec. 2014.
-150
-100
-50
0
50
100
150
200
2013 2014 2015 20160
2,000
4,000
6,000
8,000
10,000
12,000
14,000
U.S. Electricity Consumptionmillion kilowatthours per day (kWh/d)
Residential (right axis) Commercial and transportation (right axis)Industrial (right axis) Direct use (right axis)Total consumption (left axis) Consumption forecast (left axis)
annual change (million kWh/d)
Source: Short-Term Energy Outlook, December 2015.

2.6%
5.4%
10.3%
2.4%
5.7%
2.2%0.2%
1.6% 1.4% 2.1%3.3%
0.7% 0.7%
-3%
0%
3%
6%
9%
12%
15%
18%
2004 2005 2006 2007 2008 2009 2010 2011 2012 2013 2014 2015 20160
2
4
6
8
10
12
14
U.S. Residential Electricity Pricecents per kilowatthour
Annual growth (right axis) Residential electricity price Price forecast
Source: Short-Term Energy Outlook, December 2015.
21.6% 21.4% 23.3% 23.9% 24.7% 30.3% 27.7% 27.5% 32.4% 31.6%
48.5% 48.2% 44.4% 44.8% 42.3% 37.4% 38.9% 38.6% 34.1% 34.1%
Forecast
0
2,000
4,000
6,000
8,000
10,000
12,000
14,000
2007 2008 2009 2010 2011 2012 2013 2014 2015 2016
U.S. Electricity Generation by Fuel, All Sectorsthousand megawatthours per day
CoalNatural gasPetroleumNuclearHydropowerRenewablesOther sources
Source: Short-Term Energy Outlook, December 2015.
Note: Labels show percentage share of total generation provided by coal and natural gas.
Forecast
0
2
4
6
8
10
12
2007 2008 2009 2010 2011 2012 2013 2014 2015 2016
U.S. Renewable Energy Supplyquadrillion British thermal units (Btu)
SolarGeothermalOther biomassWind powerLiquid biofuelsWood biomassHydropower
Source: Short-Term Energy Outlook, December 2015.
Note: Hydropower excludes pumped storage generation. Liquid biofuels include ethanol and biodiesel. Other biomass includes municipal waste from biogenic sources, landfill gas, and other non-wood waste.
Forecast
0%
2%
4%
6%
8%
10%
12%
1990 1992 1994 1996 1998 2000 2002 2004 2006 2008 2010 2012 2014 2016
U.S. Annual Energy Expendituresshare of gross domestic product
Source: Short-Term Energy Outlook, December 2015.
Forecast
-12%
-9%
-6%
-3%
0%
3%
6%
2013 2014 2015 2016
U.S. Energy-Related Carbon Dioxide Emissionsannual growth
All fossil fuels Coal Petroleum Natural gas
Source: Short-Term Energy Outlook, December 2015.
-10%
-5%
0%
5%
10%
15%
20%
25%
30%
35%
70
75
80
85
90
95
100
105
110
115
Jan 2011 Jan 2012 Jan 2013 Jan 2014 Jan 2015 Jan 2016
U.S. Total Industrial Production Indexindex (2007 = 100)
Change from prior year (right axis)Industrial production index (left axis)
Source: Short-Term Energy Outlook, December 2015.
change
Forecast

-6%
-3%
0%
3%
6%
9%
12%
15%
18%
10,000
10,400
10,800
11,200
11,600
12,000
12,400
12,800
13,200
Jan 2011 Jan 2012 Jan 2013 Jan 2014 Jan 2015 Jan 2016
U.S. Disposable Incomebillion 2009 dollars, seasonally adjusted
Change from prior year (right axis)
Real disposable income (left axis)
Source: Short-Term Energy Outlook, December 2015.
change
0
50
100
150
200
250
300
350
400
April May June July August September
U.S. Summer Cooling Degree Dayspopulation-weighted
2013
2014
2015
2016
Source: Short-Term Energy Outlook, December 2015.
Note: EIA calculations based on from the National Oceanic and Atmospheric Administration data. Horizontal lines indicate each month's prior 10-year average (2006-2015). Projections reflect NOAA's 14-16 month outlook.
0100200300400500600700800900
1000
October November December January February March
U.S. Winter Heating Degree Dayspopulation-weighted
2012/132013/142014/152015/16
Source: Short-Term Energy Outlook, December 2015.
Note: EIA calculations based on National Oceanic and Atmospheric Administration (NOAA) data. Horizontal lines indicate each month's prior 10-year average (Oct 2005 - Mar 2015). Projections reflect NOAA's 14-16 month outlook.

U.S. Census Regions and Divisions
Source: Short-Term Energy Outlook, December 2015.

U.S. Energy Information Administration | Short-Term Energy Outlook - December 2015
08-09 09-10 10-11 11-12 12-13 13-14 14-15 15-16 % Change
Natural Gas Northeast Consumption (Mcf**) 80.3 75.7 80.7 66.4 76.1 84.1 84.7 74.1 -12.5 Price ($/mcf) 15.83 13.31 12.66 12.21 11.71 11.53 10.85 11.11 2.4 Expenditures ($) 1,272 1,007 1,022 812 891 969 919 823 -10.4 Midwest Consumption (Mcf) 80.7 78.6 80.2 65.4 77.6 88.1 83.1 72.9 -12.3 Price ($/mcf) 11.47 9.44 9.23 8.99 8.36 8.69 8.55 8.02 -6.3 Expenditures ($) 926 742 740 587 648 766 711 584 -17.8 South Consumption (Mcf) 47.3 53.3 49.3 40.9 46.5 52.1 50.5 46.0 -8.9 Price ($/mcf) 14.07 11.52 11.02 11.45 10.71 10.77 10.83 10.55 -2.6 Expenditures ($) 665 614 544 468 498 562 547 486 -11.2 West Consumption (Mcf) 47.8 49.9 49.4 49.1 48.6 46.3 41.3 44.5 7.7 Price ($/mcf) 10.86 9.91 9.67 9.35 9.13 9.96 10.67 9.21 -13.7 Expenditures ($) 519 494 478 459 443 461 441 410 -7.0 U.S. Average Consumption (Mcf) 64.2 64.4 65.0 55.7 62.5 68.0 64.7 59.3 -8.3 Price ($/mcf) 12.87 10.83 10.46 10.25 9.72 9.97 9.91 9.44 -4.7 Expenditures ($) 826 698 680 571 607 677 641 560 -12.7
Heating Oil U.S. Average Consumption (gallons) 576.7 544.8 580.7 471.2 545.5 607.0 609.1 533.1 -12.5 Price ($/gallon) 2.65 2.85 3.38 3.73 3.87 3.88 3.04 2.40 -20.9 Expenditures ($) 1,530 1,552 1,966 1,757 2,113 2,352 1,852 1,282 -30.8
Electricity Northeast Consumption (kWh***) 7,063 6,847 7,076 6,436 6,862 7,222 7,252 6,780 -6.5 Price ($/kwh) 0.152 0.152 0.154 0.154 0.152 0.163 0.168 0.170 1.2 Expenditures ($) 1,071 1,039 1,091 993 1,046 1,177 1,221 1,155 -5.4 Midwest Consumption (kWh) 8,751 8,660 8,733 7,897 8,588 9,169 8,860 8,326 -6.0 Price ($/kwh) 0.097 0.099 0.105 0.111 0.112 0.113 0.118 0.119 1.0 Expenditures ($) 851 856 914 875 958 1,032 1,043 989 -5.1 South Consumption (kWh) 8,057 8,486 8,224 7,470 7,977 8,385 8,290 7,903 -4.7 Price ($/kwh) 0.109 0.103 0.104 0.107 0.107 0.109 0.111 0.108 -2.5 Expenditures ($) 878 873 856 798 851 913 920 855 -7.1 West Consumption (kWh) 7,084 7,239 7,216 7,190 7,150 6,975 6,584 6,833 3.8 Price ($/kwh) 0.107 0.110 0.112 0.115 0.119 0.123 0.126 0.128 1.0 Expenditures ($) 755 799 809 825 848 860 833 873 4.8 U.S. Average Consumption (kWh) 7,725 7,937 7,844 7,253 7,672 7,982 7,804 7,519 -3.6 Price ($/kwh) 0.112 0.110 0.113 0.116 0.117 0.120 0.123 0.122 -0.6 Expenditures ($) 866 873 884 843 895 956 960 920 -4.2
Table WF01. Average Consumer Prices and Expenditures for Heating Fuels During the Winter
Fuel / RegionForecastWinter of
U.S. Energy Information Administration | Short-Term Energy Outlook - December 2015
08-09 09-10 10-11 11-12 12-13 13-14 14-15 15-16 % Change
Table WF01. Average Consumer Prices and Expenditures for Heating Fuels During the Winter
Fuel / RegionForecastWinter of
Propane Northeast Consumption (gallons) 714.7 672.0 717.5 595.6 675.8 745.3 751.6 663.7 -11.7 Price* ($/gallon) 2.84 2.98 3.24 3.34 3.00 3.56 3.00 2.78 -7.3 Expenditures ($) 2,031 2,004 2,321 1,990 2,031 2,653 2,255 1,845 -18.2 Midwest Consumption (gallons) 795.0 779.6 791.8 644.3 766.4 868.7 813.6 720.0 -11.5 Price* ($/gallon) 2.11 1.99 2.11 2.23 1.74 2.61 1.91 1.62 -15.2 Expenditures ($) 1,678 1,548 1,674 1,437 1,333 2,267 1,554 1,166 -24.9
Number of households by primary space heating fuel (thousands) Northeast Natural gas 10,889 10,992 11,118 11,236 11,345 11,484 11,612 11,681 0.6 Heating oil 6,280 6,016 5,858 5,701 5,458 5,218 5,084 4,931 -3.0 Propane 713 733 744 761 813 844 839 845 0.8 Electricity 2,563 2,645 2,776 2,894 3,011 3,028 3,064 3,149 2.8 Wood 474 501 512 548 582 579 581 596 2.6 Other/None 307 311 315 324 377 434 432 433 0.3 Midwest Natural gas 18,288 18,050 17,977 18,019 18,054 18,098 18,176 18,095 -0.4 Heating oil 491 451 419 393 360 337 316 291 -8.0 Propane 2,131 2,098 2,073 2,037 2,063 2,096 2,056 2,012 -2.2 Electricity 4,570 4,715 4,922 5,119 5,333 5,430 5,516 5,710 3.5 Wood 584 616 618 631 640 630 630 635 0.8 Other/None 264 283 289 282 319 354 348 348 0.0 South Natural gas 13,958 13,731 13,657 13,636 13,681 13,775 13,897 13,881 -0.1 Heating oil 956 906 853 790 738 700 662 614 -7.3 Propane 2,220 2,165 2,098 2,024 1,982 1,946 1,887 1,802 -4.5 Electricity 25,258 25,791 26,555 27,283 27,857 28,203 28,655 29,225 2.0 Wood 593 586 599 609 612 611 612 627 2.4 Other/None 314 314 309 304 367 420 395 387 -2.0 West Natural gas 15,027 14,939 15,020 15,021 15,008 15,043 15,198 15,251 0.3 Heating oil 294 289 279 261 247 234 226 219 -3.3 Propane 936 940 914 885 909 931 900 879 -2.3 Electricity 7,768 7,877 8,126 8,439 8,671 8,745 8,905 9,180 3.1 Wood 703 721 725 736 728 741 759 757 -0.3 Other/None 837 850 850 829 903 1,023 1,018 985 -3.2 U.S. Totals Natural gas 58,162 57,713 57,771 57,912 58,088 58,400 58,882 58,908 0.0 Heating oil 8,021 7,662 7,408 7,145 6,803 6,489 6,288 6,054 -3.7 Propane 5,999 5,936 5,829 5,707 5,766 5,816 5,682 5,538 -2.5 Electricity 40,159 41,029 42,380 43,734 44,872 45,405 46,139 47,264 2.4 Wood 2,353 2,424 2,454 2,524 2,563 2,561 2,583 2,616 1.3 Other/None 1,723 1,758 1,763 1,739 1,965 2,231 2,192 2,153 -1.8
Heating degree days Northeast 5,313 4,933 5,337 4,217 4,964 5,595 5,649 4,826 -14.6 Midwest 5,810 5,639 5,773 4,484 5,544 6,452 6,007 5,140 -14.4 South 2,493 2,870 2,632 2,023 2,430 2,787 2,697 2,380 -11.7 West 3,116 3,285 3,258 3,229 3,181 2,983 2,555 2,830 10.8 U.S. Average 3,869 3,937 3,939 3,224 3,721 4,108 3,883 3,496 -10.0
*** kilowatthour
* Prices exclude taxes** thousand cubic feet
Note: Winter covers the period October 1 through March 31. Fuel prices are nominal prices. Fuel consumption per household is based only on households that use that fuel as the primary space-heating fuel. Included in fuel consumption is consumption for water heating, appliances, and lighting (electricity). Per-household consumption based on an average of EIA 2005 and 2009 Residential Energy Consumption Surveys corrected for actual and projected heating degree days. Number of households using heating oil includes kerosene.
1st 2nd 3rd 4th 1st 2nd 3rd 4th 1st 2nd 3rd 4th 2014 2015 2016Energy Supply
Crude Oil Production (a)(million barrels per day) ......................... 8.11 8.61 8.84 9.24 9.37 9.41 9.37 9.17 8.95 8.80 8.56 8.75 8.70 9.33 8.76
Dry Natural Gas Production(billion cubic feet per day) ..................... 67.53 69.73 71.59 73.04 73.67 74.50 75.81 75.64 75.93 76.09 76.19 76.82 70.49 74.91 76.26
Coal Production(million short tons) ................................ 245 246 255 253 240 211 232 219 220 211 222 220 1,000 903 873
Energy Consumption
Liquid Fuels(million barrels per day) ......................... 18.82 18.77 19.31 19.51 19.29 19.25 19.68 19.37 19.29 19.44 19.79 19.71 19.11 19.40 19.56
Natural Gas(billion cubic feet per day) ..................... 94.87 60.83 61.32 75.86 96.68 64.09 66.11 79.39 94.04 65.71 67.23 79.71 73.14 76.49 76.66
Coal (b)(million short tons) ................................ 248 212 247 209 212 189 231 194 208 192 229 201 917 827 830
Electricity(billion kilowatt hours per day) ............... 10.95 10.14 11.58 10.08 10.74 10.03 11.78 9.98 10.57 10.14 11.87 10.11 10.69 10.64 10.68
Renewables (c)(quadrillion Btu) ..................................... 2.37 2.57 2.29 2.39 2.42 2.43 2.33 2.28 2.42 2.63 2.51 2.48 9.63 9.46 10.05
Total Energy Consumption (d)(quadrillion Btu) ..................................... 26.56 23.00 24.11 24.78 26.37 22.99 24.46 24.26 25.82 23.07 24.41 24.77 98.45 98.08 98.07
Energy Prices
Crude Oil West Texas Intermediate Spot(dollars per barrel) ................................. 98.68 103.35 97.87 73.21 48.48 57.85 46.55 43.59 45.61 51.38 54.00 52.33 93.17 49.08 50.89
Natural Gas Henry Hub Spot(dollars per million Btu) .......................... 5.21 4.61 3.96 3.80 2.90 2.75 2.76 2.29 2.65 2.73 2.96 3.17 4.39 2.67 2.88
Coal(dollars per million Btu) .......................... 2.33 2.39 2.38 2.38 2.27 2.25 2.22 2.23 2.22 2.26 2.26 2.22 2.37 2.24 2.24
Macroeconomic
Real Gross Domestic Product(billion chained 2009 dollars - SAAR) ..... 15,725 15,902 16,069 16,151 16,177 16,334 16,394 16,479 16,595 16,695 16,812 16,945 15,962 16,346 16,762
Percent change from prior year .............. 1.7 2.6 2.9 2.5 2.9 2.7 2.0 2.0 2.6 2.2 2.5 2.8 2.4 2.4 2.5
GDP Implicit Price Deflator(Index, 2009=100) ................................. 108.0 108.6 109.0 109.1 109.1 109.7 110.0 110.6 111.3 111.8 112.3 113.0 108.7 109.9 112.1
Percent change from prior year .............. 1.6 1.9 1.8 1.3 1.0 1.0 0.9 1.4 2.0 2.0 2.1 2.1 1.6 1.1 2.0
Real Disposable Personal Income(billion chained 2009 dollars - SAAR) ..... 11,699 11,785 11,863 11,999 12,115 12,151 12,256 12,346 12,438 12,510 12,614 12,706 11,836 12,217 12,567
Percent change from prior year .............. 2.3 2.4 2.5 3.6 3.6 3.1 3.3 2.9 2.7 2.9 2.9 2.9 2.7 3.2 2.9
Manufacturing Production Index(Index, 2012=100) ................................. 101.9 103.5 104.6 105.6 105.5 105.8 106.5 106.3 106.5 106.6 107.6 108.9 103.9 106.0 107.4
Percent change from prior year .............. 1.0 2.6 3.7 3.9 3.5 2.3 1.8 0.7 0.9 0.8 1.0 2.4 2.8 2.1 1.3
Weather
U.S. Heating Degree-Days .................... 2,450 480 80 1,541 2,342 443 50 1,421 2,074 464 74 1,532 4,551 4,256 4,144
U.S. Cooling Degree-Days .................... 34 393 775 95 46 433 873 116 39 394 852 96 1,298 1,468 1,381
EIA does not estimate or project end-use consumption of non-marketed renewable energy.
Table 1. U.S. Energy Markets Summary U.S. Energy Information Administration | Short-Term Energy Outlook - December 2015
2014 2015 2016 Year
- = no data availablePrices are not adjusted for inflation.(a) Includes lease condensate.(b) Total consumption includes Independent Power Producer (IPP) consumption.(c) Renewable energy includes minor components of non-marketed renewable energy that is neither bought nor sold, either directly or indirectly, as inputs to marketed energy.
Minor discrepancies with published historical data are due to independent rounding. Projections: EIA Regional Short-Term Energy Model. Macroeconomic projections are based on Global Insight Model of the U.S. Economy. Weather projections from National Oceanic and Atmospheric Administration.
(d) The conversion from physical units to Btu is calculated using a subset of conversion factors used in the calculations of gross energy consumption in EIA’s Monthly Energy Review Consequently, the historical data may not precisely match those published in the MER or the Annual Energy Review (AER).Notes: The approximate break between historical and forecast values is shown with historical data printed in bold; estimates and forecasts in italics.Historical data: Latest data available from Energy Information Administration databases supporting the following reports: Petroleum Supply Monthly , DOE/EIA-0109;Petroleum Supply Annual , DOE/EIA-0340/2; Weekly Petroleum Status Report , DOE/EIA-0208; Petroleum Marketing Monthly , DOE/EIA-0380; Natural Gas Monthly , DOE/EIA-0130; Electric Power Monthly , DOE/EIA-0226; Quarterly Coal Report , DOE/EIA-0121; and International Petroleum Monthly , DOE/EIA-0520.
1st 2nd 3rd 4th 1st 2nd 3rd 4th 1st 2nd 3rd 4th 2014 2015 2016Crude Oil (dollars per barrel) West Texas Intermediate Spot Average .............................. 98.68 103.35 97.87 73.21 48.48 57.85 46.55 43.59 45.61 51.38 54.00 52.33 93.17 49.08 50.89
Brent Spot Average ............................................................. 108.14 109.70 101.90 76.43 53.91 61.65 50.43 45.95 50.15 56.38 59.00 57.33 98.89 52.93 55.78
U.S. Imported Average ........................................................ 94.18 98.64 93.85 71.43 46.40 56.12 46.55 40.21 42.06 47.85 50.50 48.83 89.63 47.28 47.48
U.S. Refiner Average Acquisition Cost ................................ 97.60 101.08 96.45 73.48 47.98 57.47 48.02 42.67 44.52 50.36 53.00 51.32 92.05 49.06 49.89
U.S. Liquid Fuels (cents per gallon) Refiner Prices for Resale Gasoline ........................................................................... 272 298 276 203 159 201 184 141 145 178 180 158 262 172 165
Diesel Fuel ....................................................................... 303 300 288 240 176 189 161 146 157 172 181 178 282 168 172
Heating Oil ........................................................................ 303 289 276 228 178 180 150 140 152 160 171 175 274 161 163
Refiner Prices to End Users Jet Fuel ............................................................................. 297 295 289 234 172 186 156 143 154 166 175 173 278 164 167
No. 6 Residual Fuel Oil (a) ............................................... 249 244 243 194 137 154 123 112 111 121 131 128 231 130 122
Retail Prices Including Taxes Gasoline Regular Grade (b) ............................................. 340 368 350 288 227 267 260 216 214 248 252 231 336 243 236
Gasoline All Grades (b) .................................................... 348 375 358 296 236 275 269 226 223 257 260 240 344 252 245
On-highway Diesel Fuel ................................................... 396 394 384 358 292 285 263 246 249 267 275 275 383 271 267
Heating Oil ........................................................................ 397 382 369 330 288 276 247 233 245 251 254 262 372 267 252
Natural Gas Henry Hub Spot (dollars per thousand cubic feet) .............. 5.36 4.75 4.08 3.91 2.99 2.83 2.84 2.36 2.73 2.81 3.04 3.27 4.52 2.75 2.96
Henry Hub Spot (dollars per million Btu) ............................ 5.21 4.61 3.96 3.80 2.90 2.75 2.76 2.29 2.65 2.73 2.96 3.17 4.39 2.67 2.88
U.S. End-Use Prices (dollars per thousand cubic feet) Industrial Sector ............................................................... 6.19 5.64 5.08 5.18 4.57 3.68 3.65 3.55 3.88 3.64 3.94 4.36 5.55 3.88 3.96
Commercial Sector .......................................................... 8.65 9.66 9.69 8.51 7.94 8.13 8.41 7.65 7.50 7.96 8.66 8.01 8.87 7.94 7.85
Residential Sector ............................................................ 9.82 13.11 16.94 10.52 9.29 11.96 16.43 10.15 8.75 11.60 15.88 10.04 10.94 10.36 10.07
U.S. Electricity Power Generation Fuel Costs (dollars per million Btu) Coal .................................................................................. 2.33 2.39 2.38 2.38 2.27 2.25 2.22 2.23 2.22 2.26 2.26 2.22 2.37 2.24 2.24
Natural Gas ..................................................................... 6.82 4.94 4.25 4.30 4.09 3.12 3.09 3.34 3.79 3.43 3.46 4.20 4.98 3.37 3.69
Residual Fuel Oil (c) ......................................................... 19.97 20.44 19.75 14.70 10.82 11.64 11.05 9.67 9.43 11.01 11.43 11.36 19.19 10.79 10.78
Distillate Fuel Oil .............................................................. 23.40 22.77 21.89 18.69 15.39 15.18 13.61 13.25 13.99 14.84 15.49 15.95 22.33 14.64 14.99
End-Use Prices (cents per kilowatthour) Industrial Sector ............................................................... 7.05 7.02 7.51 6.85 6.78 6.81 7.31 6.82 6.84 6.89 7.42 6.89 7.11 6.94 7.02
Commercial Sector .......................................................... 10.55 10.67 11.14 10.57 10.47 10.53 10.95 10.45 10.58 10.72 11.18 10.67 10.74 10.62 10.80
Residential Sector ............................................................ 11.93 12.75 13.03 12.39 12.23 12.85 12.99 12.32 12.16 12.80 13.13 12.65 12.52 12.61 12.70
(c) Includes fuel oils No. 4, No. 5, No. 6, and topped crude.
Table 2. Energy PricesU.S. Energy Information Administration | Short-Term Energy Outlook - December 2015
2014 2015 2016 Year
- = no data availablePrices are not adjusted for inflation.(a) Average for all sulfur contents.(b) Average self-service cash price.
Projections: EIA Regional Short-Term Energy Model.
Notes: The approximate break between historical and forecast values is shown with historical data printed in bold; estimates and forecasts in italics.Prices exclude taxes unless otherwise noted.Historical data: Latest data available from Energy Information Administration databases supporting the following reports: Petroleum Marketing Monthly , DOE/EIA-0380;Weekly Petroleum Status Report , DOE/EIA-0208; Natural Gas Monthly , DOE/EIA-0130; Electric Power Monthly , DOE/EIA-0226; and Monthly Energy Review , DOE/EIA-0035.WTI and Brent crude oils, and Henry Hub natural gas spot prices from Reuter's News Service (http://www.reuters.com).Minor discrepancies with published historical data are due to independent rounding.

1st 2nd 3rd 4th 1st 2nd 3rd 4th 1st 2nd 3rd 4th 2014 2015 2016Supply (million barrels per day) (a) OECD ................................................. 25.09 25.52 25.80 26.72 26.57 26.34 26.70 26.50 26.19 26.06 26.02 26.38 25.79 26.53 26.16
U.S. (50 States) ............................... 13.12 13.97 14.37 14.81 14.70 15.02 15.07 14.93 14.69 14.68 14.60 14.85 14.07 14.93 14.71
Canada ............................................ 4.42 4.27 4.33 4.55 4.68 4.16 4.50 4.51 4.49 4.49 4.57 4.59 4.39 4.46 4.54
Mexico ............................................. 2.89 2.86 2.79 2.74 2.68 2.58 2.62 2.65 2.64 2.63 2.62 2.61 2.82 2.63 2.62
North Sea (b) ................................... 3.08 2.82 2.71 3.03 3.01 3.08 2.92 2.84 2.82 2.72 2.68 2.77 2.91 2.96 2.75
Other OECD .................................... 1.58 1.60 1.60 1.58 1.50 1.51 1.58 1.57 1.54 1.54 1.55 1.56 1.59 1.54 1.55
Non-OECD ......................................... 66.75 66.98 67.86 68.29 67.86 69.04 69.79 69.32 68.47 69.38 70.47 70.18 67.48 69.01 69.63
OPEC .............................................. 36.26 35.94 36.52 36.66 36.66 37.38 37.90 37.79 37.40 37.77 38.56 38.49 36.35 37.43 38.06
Crude Oil Portion .......................... 30.01 29.70 30.28 30.34 30.29 30.96 31.41 31.26 30.74 31.04 31.76 31.63 30.08 30.98 31.29
Other Liquids (c) ........................... 6.25 6.24 6.24 6.32 6.36 6.42 6.48 6.53 6.65 6.73 6.81 6.86 6.26 6.45 6.76
Eurasia ............................................ 13.90 13.83 13.85 14.01 14.01 13.99 14.02 13.93 13.89 13.91 13.93 13.95 13.90 13.99 13.92
China ............................................... 4.55 4.57 4.51 4.66 4.62 4.70 4.69 4.66 4.64 4.67 4.68 4.68 4.57 4.67 4.67
Other Non-OECD ............................ 12.05 12.64 12.98 12.96 12.58 12.96 13.19 12.94 12.55 13.04 13.31 13.05 12.66 12.92 12.99
Total World Supply ............................. 91.84 92.50 93.66 95.01 94.42 95.38 96.49 95.82 94.67 95.45 96.50 96.55 93.26 95.54 95.79
Non-OPEC Supply .............................. 55.58 56.56 57.15 58.35 57.77 58.00 58.60 58.04 57.27 57.68 57.93 58.06 56.92 58.10 57.74
Consumption (million barrels per day) (d) OECD ................................................. 45.75 44.84 45.97 46.44 46.53 45.54 46.51 46.74 46.92 45.82 46.71 47.17 45.75 46.33 46.66
U.S. (50 States) ............................... 18.82 18.77 19.31 19.51 19.29 19.25 19.68 19.37 19.29 19.44 19.79 19.71 19.11 19.40 19.56
U.S. Territories ................................ 0.35 0.35 0.35 0.35 0.37 0.37 0.37 0.37 0.40 0.40 0.40 0.40 0.35 0.37 0.40
Canada ............................................ 2.43 2.34 2.46 2.42 2.36 2.32 2.43 2.41 2.38 2.32 2.43 2.41 2.41 2.38 2.38
Europe ............................................. 12.98 13.38 13.86 13.52 13.55 13.46 13.91 13.86 13.74 13.47 13.92 13.87 13.44 13.69 13.75
Japan ............................................... 5.02 3.88 3.88 4.43 4.74 3.88 3.91 4.28 4.58 3.85 3.88 4.25 4.30 4.20 4.14
Other OECD .................................... 6.14 6.11 6.11 6.21 6.21 6.26 6.21 6.45 6.54 6.34 6.29 6.53 6.14 6.28 6.42
Non-OECD ......................................... 45.63 46.96 47.35 46.81 46.27 47.85 48.19 47.63 47.31 48.93 49.28 48.70 46.69 47.49 48.56
Eurasia ............................................ 4.82 4.76 4.98 4.96 4.71 4.65 4.92 4.90 4.73 4.66 4.93 4.92 4.88 4.80 4.81
Europe ............................................. 0.70 0.71 0.73 0.73 0.71 0.72 0.74 0.74 0.72 0.73 0.75 0.75 0.72 0.73 0.73
China ............................................... 10.45 11.03 10.98 10.94 10.77 11.36 11.32 11.27 11.08 11.69 11.64 11.59 10.85 11.18 11.50
Other Asia ........................................ 11.80 12.01 11.56 11.88 12.11 12.33 11.87 12.19 12.49 12.71 12.23 12.56 11.81 12.13 12.50
Other Non-OECD ............................ 17.86 18.46 19.10 18.31 17.96 18.79 19.35 18.53 18.30 19.15 19.73 18.89 18.43 18.66 19.02
Total World Consumption ................... 91.38 91.80 93.32 93.25 92.80 93.38 94.69 94.37 94.23 94.75 95.99 95.87 92.45 93.82 95.22
Total Crude Oil and Other Liquids Inventory Net Withdrawals (million barrels per day) U.S. (50 States) .................................. 0.03 -0.66 -0.22 -0.22 -0.54 -0.69 -0.32 0.26 0.10 -0.21 -0.05 0.59 -0.27 -0.32 0.11
Other OECD ....................................... -0.31 -0.02 -0.50 0.33 -0.19 -0.46 -0.53 -0.62 -0.20 -0.17 -0.16 -0.46 -0.12 -0.45 -0.25
Other Stock Draws and Balance ........ -0.17 -0.02 0.38 -1.88 -0.90 -0.84 -0.95 -1.09 -0.34 -0.32 -0.30 -0.81 -0.43 -0.94 -0.44
Total Stock Draw ............................. -0.46 -0.70 -0.35 -1.76 -1.63 -1.99 -1.80 -1.45 -0.44 -0.69 -0.51 -0.68 -0.82 -1.72 -0.58
End-of-period Commercial Crude Oil and Other Liquids Inventories U.S. Commercial Inventory ................ 1,063 1,128 1,149 1,169 1,217 1,277 1,306 1,282 1,273 1,292 1,296 1,241 1,169 1,282 1,241
OECD Commercial Inventory ............. 2,575 2,642 2,711 2,698 2,763 2,865 2,942 2,975 2,984 3,019 3,038 3,025 2,698 2,975 3,025
(a) Supply includes production of crude oil (including lease condensates), natural gas plant liquids, biofuels, other liquids, and refinery processing gains.
Table 3a. International Petroleum and Other Liquids Production, Consumption, and InventoriesU.S. Energy Information Administration | Short-Term Energy Outlook - December 2015
2014 2015 2016 Year
- = no data availableOECD = Organization for Economic Cooperation and Development: Australia, Austria, Belgium, Canada, Chile, the Czech Republic, Denmark, Estonia, Finland, France, Germany, Greece, Hungary, Iceland, Ireland, Israel, Italy, Japan, Luxembourg, Mexico, the Netherlands, New Zealand, Norway, Poland, Portugal, Slovakia, Slovenia, South Korea, Spain, Sweden, Switzerland, Turkey, the United Kingdom, and the United States.OPEC = Organization of Petroleum Exporting Countries: Algeria, Angola, Ecuador, Iran, Iraq, Kuwait, Libya, Nigeria, Qatar, Saudi Arabia, the United Arab Emirates, Venezuela.
Minor discrepancies with published historical data are due to independent rounding. Projections: EIA Regional Short-Term Energy Model.
(b) Includes offshore supply from Denmark, Germany, the Netherlands, Norway, and the United Kingdom.(c) Includes lease condensate, natural gas plant liquids, other liquids, and refinery prodessing gain. Includes other unaccounted-for liquids.(d) Consumption of petroleum by the OECD countries is synonymous with "petroleum product supplied," defined in the glossary of the EIA Petroleum Supply Monthly , DOE/EIA-0109. Consumption of petroleum by the non-OECD countries is "apparent consumption," which includes internal consumption, refinery fuel and loss, and bunkering.Notes: The approximate break between historical and forecast values is shown with historical data printed in bold; estimates and forecasts in italics.Historical data: Latest data available from Energy Information Administration international energy statistics.

1st 2nd 3rd 4th 1st 2nd 3rd 4th 1st 2nd 3rd 4th 2014 2015 2016
North America ..................................................... 20.43 21.10 21.48 22.11 22.06 21.75 22.20 22.09 21.83 21.80 21.79 22.05 21.29 22.03 21.87
Canada .................................................................. 4.42 4.27 4.33 4.55 4.68 4.16 4.50 4.51 4.49 4.49 4.57 4.59 4.39 4.46 4.54
Mexico ................................................................... 2.89 2.86 2.79 2.74 2.68 2.58 2.62 2.65 2.64 2.63 2.62 2.61 2.82 2.63 2.62
United States ......................................................... 13.12 13.97 14.37 14.81 14.70 15.02 15.07 14.93 14.69 14.68 14.60 14.85 14.07 14.93 14.71
Central and South America ............................... 4.54 5.16 5.55 5.39 4.95 5.43 5.69 5.38 4.99 5.50 5.75 5.47 5.16 5.36 5.43
Argentina ............................................................... 0.70 0.71 0.73 0.73 0.69 0.71 0.75 0.75 0.70 0.72 0.76 0.76 0.72 0.72 0.74
Brazil ..................................................................... 2.34 2.98 3.32 3.15 2.73 3.21 3.48 3.13 2.75 3.25 3.51 3.19 2.95 3.14 3.18
Colombia ............................................................... 1.02 0.99 1.02 1.03 1.06 1.05 0.99 1.03 1.05 1.04 0.99 1.02 1.02 1.03 1.03
Other Central and S. America ................................ 0.48 0.48 0.48 0.48 0.47 0.46 0.48 0.48 0.48 0.48 0.49 0.50 0.48 0.47 0.49
Europe ................................................................. 4.04 3.78 3.68 4.00 3.96 4.03 3.87 3.79 3.76 3.64 3.62 3.70 3.88 3.91 3.68
Norway .................................................................. 1.98 1.80 1.87 1.98 1.95 1.95 1.93 1.88 1.88 1.80 1.84 1.84 1.91 1.93 1.84
United Kingdom (offshore) ..................................... 0.93 0.85 0.66 0.84 0.88 0.94 0.81 0.79 0.77 0.74 0.67 0.74 0.82 0.86 0.73
Other North Sea .................................................... 0.18 0.16 0.18 0.20 0.18 0.18 0.17 0.17 0.18 0.18 0.18 0.19 0.18 0.18 0.18
Eurasia ................................................................. 13.91 13.85 13.86 14.02 14.02 14.01 14.03 13.95 13.90 13.92 13.94 13.97 13.91 14.00 13.93
Azerbaijan .............................................................. 0.85 0.86 0.88 0.84 0.86 0.86 0.88 0.88 0.88 0.88 0.87 0.87 0.86 0.87 0.87
Kazakhstan ............................................................ 1.73 1.66 1.71 1.78 1.76 1.71 1.69 1.69 1.70 1.70 1.71 1.74 1.72 1.71 1.71
Russia ................................................................... 10.86 10.83 10.79 10.93 10.92 10.94 10.96 10.88 10.83 10.84 10.87 10.87 10.85 10.92 10.85
Turkmenistan ......................................................... 0.27 0.28 0.28 0.26 0.27 0.27 0.28 0.27 0.28 0.29 0.29 0.28 0.28 0.28 0.28
Other Eurasia ........................................................ 0.20 0.21 0.21 0.21 0.21 0.23 0.23 0.22 0.21 0.21 0.21 0.21 0.21 0.22 0.21
Middle East ......................................................... 1.19 1.17 1.20 1.16 1.19 1.15 1.16 1.15 1.15 1.13 1.13 1.12 1.18 1.16 1.13
Oman .................................................................... 0.96 0.95 0.96 0.94 0.97 0.99 1.02 1.02 0.97 0.97 0.96 0.96 0.95 1.00 0.97
Syria ...................................................................... 0.03 0.03 0.03 0.03 0.03 0.04 0.04 0.04 0.01 0.01 0.00 0.00 0.03 0.04 0.01
Yemen ................................................................... 0.13 0.13 0.13 0.12 0.11 0.05 0.03 0.02 0.10 0.08 0.09 0.08 0.13 0.05 0.09
Asia and Oceania ............................................... 9.15 9.18 9.05 9.33 9.29 9.34 9.34 9.38 9.37 9.40 9.43 9.45 9.18 9.34 9.41
Australia ................................................................ 0.47 0.48 0.49 0.47 0.40 0.41 0.47 0.47 0.45 0.45 0.45 0.46 0.48 0.44 0.45
China ..................................................................... 4.55 4.57 4.51 4.66 4.62 4.70 4.69 4.66 4.64 4.67 4.68 4.68 4.57 4.67 4.67
India ...................................................................... 0.98 0.98 0.96 0.99 0.98 0.97 0.97 0.99 0.98 0.98 0.99 0.99 0.98 0.98 0.99
Indonesia ............................................................... 0.92 0.92 0.91 0.90 0.91 0.92 0.91 0.93 0.94 0.96 0.99 0.99 0.91 0.92 0.97
Malaysia ................................................................ 0.69 0.69 0.66 0.75 0.80 0.76 0.71 0.75 0.77 0.76 0.75 0.76 0.70 0.75 0.76
Vietnam ................................................................. 0.33 0.32 0.31 0.34 0.36 0.34 0.35 0.36 0.35 0.35 0.34 0.34 0.33 0.35 0.35
Africa ................................................................... 2.32 2.31 2.31 2.34 2.29 2.30 2.30 2.30 2.28 2.28 2.28 2.31 2.32 2.30 2.29
Egypt ..................................................................... 0.70 0.70 0.70 0.72 0.71 0.71 0.71 0.70 0.70 0.70 0.70 0.69 0.71 0.71 0.70
Equatorial Guinea .................................................. 0.29 0.29 0.29 0.29 0.27 0.27 0.27 0.27 0.25 0.25 0.25 0.25 0.29 0.27 0.25
Gabon ................................................................... 0.22 0.22 0.22 0.22 0.21 0.21 0.21 0.21 0.21 0.21 0.21 0.21 0.22 0.21 0.21
Sudan and South Sudan ........................................ 0.26 0.26 0.26 0.26 0.26 0.25 0.26 0.26 0.26 0.26 0.26 0.26 0.26 0.26 0.26
Total non-OPEC liquids ....................................... 55.58 56.56 57.15 58.35 57.77 58.00 58.60 58.04 57.27 57.68 57.93 58.06 56.92 58.10 57.74
OPEC non-crude liquids .................................... 6.25 6.24 6.24 6.32 6.36 6.42 6.48 6.53 6.65 6.73 6.81 6.86 6.26 6.45 6.76
Non-OPEC + OPEC non-crude .......................... 61.83 62.80 63.39 64.67 64.13 64.42 65.08 64.56 63.92 64.41 64.74 64.92 63.18 64.55 64.50
Unplanned non-OPEC Production Outages ....... 0.66 0.67 0.60 0.57 0.62 0.83 0.76 n/a n/a n/a n/a n/a 0.62 n/a n/a
Table 3b. Non-OPEC Petroleum and Other Liquids Supply (million barrels per day)U.S. Energy Information Administration | Short-Term Energy Outlook - December 2015
2014 2015 2016 Year
Minor discrepancies with published historical data are due to independent rounding. Projections: EIA Regional Short-Term Energy Model.
- = no data availableOPEC = Organization of Petroleum Exporting Countries: Algeria, Angola, Ecuador, Iran, Iraq, Kuwait, Libya, Nigeria, Qatar, Saudi Arabia, the United Arab Emirates, Venezuela.Notes: The approximate break between historical and forecast values is shown with historical data printed in bold; estimates and forecasts in italics.Supply includes production of crude oil (including lease condensates), natural gas plant liquids, biofuels, other liquids, and refinery processing gains.Not all countries are shown in each region and sum of reported country volumes may not equal regional volumes.Historical data: Latest data available from Energy Information Administration international energy statistics.
1st 2nd 3rd 4th 1st 2nd 3rd 4th 1st 2nd 3rd 4th 2014 2015 2016Crude Oil Algeria ........................................................... 1.15 1.15 1.15 1.15 1.10 1.10 1.10 - - - - - 1.15 - -
Angola ........................................................... 1.63 1.63 1.72 1.73 1.75 1.78 1.81 - - - - - 1.68 - -
Ecudaor ......................................................... 0.55 0.56 0.56 0.56 0.55 0.54 0.55 - - - - - 0.56 - -
Iran ................................................................ 2.80 2.80 2.80 2.80 2.80 2.80 2.80 - - - - - 2.80 - -
Iraq ................................................................ 3.26 3.29 3.28 3.53 3.57 4.03 4.33 - - - - - 3.34 - -
Kuwait ........................................................... 2.60 2.60 2.60 2.48 2.57 2.53 2.50 - - - - - 2.57 - -
Libya .............................................................. 0.38 0.23 0.58 0.69 0.40 0.45 0.38 - - - - - 0.47 - -
Nigeria ........................................................... 2.00 1.97 2.07 1.98 2.03 1.88 1.92 - - - - - 2.00 - -
Qatar ............................................................. 0.74 0.73 0.72 0.68 0.68 0.68 0.68 - - - - - 0.72 - -
Saudi Arabia .................................................. 9.80 9.65 9.70 9.63 9.73 10.07 10.25 - - - - - 9.70 - -
United Arab Emirates .................................... 2.70 2.70 2.70 2.70 2.70 2.70 2.70 - - - - - 2.70 - -
Venezuela ..................................................... 2.40 2.40 2.40 2.40 2.40 2.40 2.40 - - - - - 2.40 - -
OPEC Total ................................................ 30.01 29.70 30.28 30.34 30.29 30.96 31.41 31.26 30.74 31.04 31.76 31.63 30.08 30.98 31.29
Other Liquids (a) ............................................ 6.25 6.24 6.24 6.32 6.36 6.42 6.48 6.53 6.65 6.73 6.81 6.86 6.26 6.45 6.76
Total OPEC Supply ........................................ 36.26 35.94 36.52 36.66 36.66 37.38 37.90 37.79 37.40 37.77 38.56 38.49 36.35 37.43 38.06
Crude Oil Production Capacity Africa ............................................................. 5.15 4.97 5.51 5.53 5.28 5.18 5.19 5.21 5.17 5.22 5.28 5.35 5.29 5.22 5.26
South America ............................................... 2.95 2.95 2.95 2.95 2.94 2.93 2.94 2.97 2.86 2.85 2.85 2.88 2.95 2.94 2.86
Middle East ................................................... 23.93 23.88 23.85 23.76 23.87 24.21 24.53 24.56 24.64 24.92 25.63 25.53 23.85 24.29 25.18
OPEC Total ................................................ 32.02 31.80 32.31 32.25 32.09 32.33 32.66 32.74 32.68 33.00 33.76 33.75 32.09 32.46 33.30
Surplus Crude Oil Production Capacity Africa ............................................................. 0.00 0.00 0.00 0.00 0.02 0.00 0.00 0.00 0.00 0.00 0.00 0.00 0.00 0.01 0.00
South America ............................................... 0.00 0.00 0.00 0.00 0.00 0.00 0.00 0.00 0.00 0.00 0.00 0.00 0.00 0.00 0.00
Middle East ................................................... 2.01 2.09 2.03 1.91 1.78 1.36 1.25 1.48 1.93 1.96 2.00 2.13 2.01 1.47 2.01
OPEC Total ................................................ 2.01 2.09 2.03 1.91 1.80 1.37 1.25 1.48 1.93 1.96 2.00 2.13 2.01 1.47 2.01
Unplanned OPEC Production Outages ........ 2.32 2.57 2.26 2.43 2.57 2.64 2.73 n/a n/a n/a n/a n/a 2.40 n/a n/a
Table 3c. OPEC Crude Oil (excluding condensates) Supply (million barrels per day)U.S. Energy Information Administration | Short-Term Energy Outlook - December 2015
2014 2015 2016 Year
Projections: EIA Regional Short-Term Energy Model.
- = no data availableOPEC = Organization of Petroleum Exporting Countries: Algeria, Angola, Libya, and Nigeria (Africa); Ecuador and Venezuela (South America); Iran, Iraq, Kuwait, Qatar, Saudi Arabia, and the United Arab Emirate(Middle East).
(a) Includes lease condensate, natural gas plant liquids, other liquids, and refinery prodessing gain. Includes other unaccounted-for liquids.
Notes: The approximate break between historical and forecast values is shown with historical data printed in bold; estimates and forecasts in italics.Historical data: Latest data available from Energy Information Administration international energy statistics.Minor discrepancies with published historical data are due to independent rounding.

Q1 Q2 Q3 Q4 Q1 Q2 Q3 Q4 Q1 Q2 Q3 Q4 2014 2015 2016
North America ............................................................. 23.21 23.09 23.74 23.92 23.53 23.52 24.04 23.72 23.61 23.72 24.15 24.06 23.49 23.71 23.89Canada .......................................................................... 2.43 2.34 2.46 2.42 2.36 2.32 2.43 2.41 2.38 2.32 2.43 2.41 2.41 2.38 2.38Mexico ........................................................................... 1.95 1.97 1.96 1.98 1.87 1.95 1.92 1.93 1.93 1.95 1.92 1.93 1.97 1.92 1.93United States ................................................................. 18.82 18.77 19.31 19.51 19.29 19.25 19.68 19.37 19.29 19.44 19.79 19.71 19.11 19.40 19.56
Central and South America ..................................... 7.05 7.30 7.33 7.31 7.05 7.37 7.41 7.38 7.17 7.44 7.47 7.45 7.25 7.30 7.38Brazil .............................................................................. 3.03 3.14 3.21 3.20 3.03 3.14 3.21 3.20 3.06 3.18 3.24 3.23 3.15 3.15 3.18
Europe ......................................................................... 13.68 14.09 14.59 14.25 14.26 14.17 14.64 14.59 14.46 14.20 14.67 14.62 14.16 14.42 14.49
Eurasia ......................................................................... 4.85 4.79 5.01 4.99 4.74 4.67 4.95 4.93 4.76 4.69 4.97 4.95 4.91 4.83 4.84Russia ........................................................................... 3.49 3.45 3.65 3.63 3.39 3.34 3.54 3.53 3.35 3.30 3.50 3.48 3.56 3.45 3.41
Middle East ................................................................. 7.97 8.33 8.98 8.17 7.93 8.56 9.13 8.29 8.12 8.73 9.33 8.45 8.36 8.48 8.66
Asia and Oceania ...................................................... 30.88 30.48 29.99 30.91 31.39 31.20 30.68 31.60 32.07 31.95 31.41 32.33 30.56 31.22 31.94China ............................................................................. 10.45 11.03 10.98 10.94 10.77 11.36 11.32 11.27 11.08 11.69 11.64 11.59 10.85 11.18 11.50Japan ............................................................................. 5.02 3.88 3.88 4.43 4.74 3.88 3.91 4.28 4.58 3.85 3.88 4.25 4.30 4.20 4.14India ............................................................................... 3.88 3.86 3.54 3.83 4.08 4.06 3.72 4.02 4.25 4.23 3.88 4.19 3.78 3.97 4.14
Africa ........................................................................... 3.73 3.73 3.68 3.70 3.89 3.88 3.84 3.86 4.04 4.03 3.99 4.01 3.71 3.86 4.02
Total OECD Liquid Fuels Consumption .................. 45.75 44.84 45.97 46.44 46.53 45.54 46.51 46.74 46.92 45.82 46.71 47.17 45.75 46.33 46.66Total non-OECD Liquid Fuels Consumption .......... 45.63 46.96 47.35 46.81 46.27 47.85 48.19 47.63 47.31 48.93 49.28 48.70 46.69 47.49 48.56
Total World Liquid Fuels Consumption .................. 91.38 91.80 93.32 93.25 92.80 93.38 94.69 94.37 94.23 94.75 95.99 95.87 92.45 93.82 95.22
World Index, 2010 Q1 = 100 ........................................ 113.2 114.0 114.8 115.7 116.2 116.9 117.4 118.1 118.9 119.8 120.6 121.5 114.4 117.1 120.2 Percent change from prior year ................................. 2.8 2.7 2.7 2.6 2.6 2.5 2.2 2.1 2.3 2.5 2.7 2.9 2.7 2.3 2.6OECD Index, 2010 Q1 = 100 ....................................... 107.1 107.6 108.2 108.8 109.3 109.9 110.2 110.7 111.4 112.0 112.6 113.4 107.9 110.0 112.4 Percent change from prior year ................................. 1.8 1.9 1.9 1.8 2.0 2.2 1.8 1.8 1.9 1.9 2.2 2.4 1.9 2.0 2.1Non-OECD Index, 2010 Q1 = 100 ............................... 121.0 122.2 123.2 124.5 125.0 125.8 126.5 127.5 128.5 129.8 130.8 132.0 122.7 126.2 130.3 Percent change from prior year ................................. 3.9 3.7 3.6 3.6 3.3 2.9 2.7 2.4 2.8 3.2 3.4 3.6 3.7 2.8 3.2
Real U.S. Dollar Exchange Rate (a)Index, January 2010 = 100 ........................................... 108.09 107.86 109.04 113.63 119.28 119.52 122.96 124.59 127.17 127.02 126.86 126.75 109.65 121.59 126.95Percent change from prior year .................................... 3.8 2.0 1.9 6.7 10.4 10.8 12.8 9.6 6.6 6.3 3.2 1.7 3.6 10.9 4.4
Table 3d. World Petrioleum and Other Liquids Consumption (million barrels per day)U.S. Energy Information Administration | Short-Term Energy Outlook - December 2015
2014 2015 2016
Notes: The approximate break between historical and forecast values is shown with historical data printed in bold; estimates and forecasts in italics.Historical data: Latest data available from Energy Information Administration international energy statistics.Minor discrepancies with published historical data are due to independent rounding.
Projections: EIA Regional Short-Term Energy Model.
Oil-weighted Real Gross Domestic Product (a)
- = no data availableOECD = Organisation for Economic Co-operation and Development: Australia, Austria, Belgium, Canada, Chile, the Czech Republic, Denmark, Finland, France, Germany, Greece, Hungary, Iceland, Ireland, Israel, Italy, Japan, Luxembourg, Mexico, the Netherlands, New Zealand, Norway, Poland, Portugal, Slovakia, Slovenia, South Korea, Spain, Sweden, Switzerland, Turkey, the United Kingdom, and the United States.(a) Weighted geometric mean of real indices for various countries with weights equal to each country's share of world oil consumption in the base period. Exchange rate is measured in foreign currency per U.S. dollar.

1st 2nd 3rd 4th 1st 2nd 3rd 4th 1st 2nd 3rd 4th 2014 2015 2016Supply (million barrels per day) Crude Oil Supply Domestic Production (a) ......................................... 8.11 8.61 8.84 9.24 9.37 9.41 9.37 9.17 8.95 8.80 8.56 8.75 8.70 9.33 8.76
Alaska .................................................................. 0.53 0.52 0.43 0.51 0.50 0.48 0.44 0.49 0.49 0.48 0.43 0.47 0.50 0.48 0.47
Federal Gulf of Mexico (b) ................................... 1.32 1.42 1.43 1.42 1.46 1.47 1.64 1.60 1.62 1.65 1.55 1.67 1.40 1.54 1.62
Lower 48 States (excl GOM) ................................ 6.26 6.68 6.98 7.30 7.41 7.46 7.29 7.08 6.84 6.67 6.58 6.60 6.81 7.31 6.67
Crude Oil Net Imports (c) ........................................ 7.11 6.93 7.15 6.78 6.84 6.74 6.93 6.78 6.63 7.32 7.70 7.10 6.99 6.82 7.19
SPR Net Withdrawals ............................................. 0.00 0.05 0.00 0.00 0.00 -0.03 -0.01 0.00 0.00 0.00 0.00 0.00 0.01 -0.01 0.00
Commercial Inventory Net Withdrawals ................. -0.33 0.01 0.25 -0.33 -0.91 0.06 0.10 -0.12 -0.21 0.17 0.20 0.16 -0.10 -0.21 0.08
Crude Oil Adjustment (d) ........................................ 0.29 0.27 0.13 0.26 0.22 0.31 0.19 0.31 0.19 0.19 0.21 0.15 0.24 0.26 0.19
Total Crude Oil Input to Refineries ............................. 15.19 15.88 16.36 15.96 15.53 16.48 16.58 16.14 15.57 16.48 16.67 16.16 15.85 16.18 16.22
Other Supply Refinery Processing Gain ....................................... 1.05 1.07 1.10 1.10 0.99 1.02 1.08 1.10 1.03 1.07 1.10 1.11 1.08 1.05 1.08
Natural Gas Plant Liquids Production .................... 2.75 3.00 3.15 3.16 3.09 3.27 3.31 3.35 3.40 3.50 3.61 3.68 3.01 3.26 3.55
Renewables and Oxygenate Production (e) ........... 1.01 1.06 1.06 1.08 1.05 1.10 1.10 1.10 1.10 1.09 1.11 1.09 1.05 1.09 1.10
Fuel Ethanol Production ...................................... 0.91 0.94 0.93 0.96 0.96 0.96 0.96 0.96 0.97 0.96 0.97 0.95 0.93 0.96 0.96
Petroleum Products Adjustment (f) ........................ 0.20 0.23 0.22 0.24 0.20 0.21 0.21 0.22 0.21 0.22 0.23 0.23 0.22 0.21 0.22
Product Net Imports (c) ........................................... -1.73 -1.74 -2.11 -2.13 -1.89 -2.12 -2.20 -2.91 -2.33 -2.55 -2.68 -2.99 -1.93 -2.28 -2.64
Hydrocarbon Gas Liquids .................................... -0.36 -0.57 -0.66 -0.64 -0.68 -0.80 -0.93 -0.98 -1.04 -1.12 -1.22 -1.21 -0.56 -0.85 -1.15
Unfinished Oils .................................................... 0.34 0.43 0.34 0.37 0.26 0.28 0.38 0.35 0.36 0.27 0.36 0.38 0.37 0.32 0.34
Other HC/Oxygenates .......................................... -0.09 -0.09 -0.08 -0.09 -0.08 -0.09 -0.06 -0.07 -0.07 -0.05 -0.03 -0.03 -0.09 -0.07 -0.04
Motor Gasoline Blend Comp. .............................. 0.30 0.58 0.46 0.39 0.41 0.52 0.60 0.38 0.48 0.63 0.48 0.42 0.44 0.48 0.50
Finished Motor Gasoline ...................................... -0.40 -0.37 -0.33 -0.47 -0.44 -0.32 -0.40 -0.66 -0.51 -0.50 -0.39 -0.63 -0.39 -0.46 -0.51
Jet Fuel ................................................................ -0.07 -0.02 -0.09 -0.09 -0.06 0.01 -0.05 -0.08 -0.03 -0.05 -0.01 -0.03 -0.07 -0.04 -0.03
Distillate Fuel Oil ................................................. -0.67 -1.00 -1.07 -0.89 -0.67 -1.05 -1.12 -1.05 -0.75 -0.95 -1.07 -1.07 -0.91 -0.98 -0.96
Residual Fuel Oil ................................................. -0.23 -0.18 -0.17 -0.18 -0.13 -0.21 -0.11 -0.19 -0.24 -0.26 -0.25 -0.22 -0.19 -0.16 -0.24
Other Oils (g) ....................................................... -0.55 -0.52 -0.50 -0.53 -0.50 -0.46 -0.50 -0.61 -0.54 -0.51 -0.55 -0.60 -0.53 -0.52 -0.55
Product Inventory Net Withdrawals ........................ 0.35 -0.72 -0.47 0.11 0.36 -0.72 -0.41 0.38 0.30 -0.38 -0.25 0.44 -0.18 -0.10 0.03
Total Supply ............................................................... 18.82 18.77 19.31 19.51 19.32 19.25 19.68 19.37 19.29 19.44 19.79 19.71 19.11 19.40 19.56
Consumption (million barrels per day) Hydrocarbon Gas Liquids ....................................... 2.70 2.12 2.32 2.66 2.72 2.27 2.29 2.56 2.73 2.33 2.39 2.77 2.45 2.46 2.56
Unfinished Oils ....................................................... -0.07 -0.03 -0.03 -0.02 -0.05 0.05 -0.03 0.04 0.00 0.00 0.01 0.02 -0.04 0.00 0.01
Motor Gasoline ....................................................... 8.54 9.01 9.13 9.00 8.81 9.26 9.39 9.08 8.85 9.25 9.38 9.09 8.92 9.14 9.15
Fuel Ethanol blended into Motor Gasoline .......... 0.84 0.89 0.89 0.90 0.87 0.92 0.93 0.90 0.89 0.93 0.94 0.92 0.88 0.91 0.92
Jet Fuel ................................................................... 1.39 1.47 1.52 1.50 1.45 1.54 1.59 1.55 1.45 1.53 1.58 1.53 1.47 1.53 1.53
Distillate Fuel Oil .................................................... 4.19 3.95 3.89 4.12 4.27 3.88 3.93 3.94 4.13 4.01 3.96 4.07 4.04 4.00 4.04
Residual Fuel Oil .................................................... 0.25 0.25 0.25 0.28 0.24 0.19 0.31 0.20 0.22 0.20 0.21 0.21 0.26 0.24 0.21
Other Oils (g) .......................................................... 1.83 2.01 2.24 1.96 1.85 2.06 2.20 1.99 1.90 2.11 2.25 2.01 2.01 2.02 2.07
Total Consumption .................................................... 18.82 18.77 19.31 19.51 19.29 19.25 19.68 19.37 19.29 19.44 19.79 19.71 19.11 19.40 19.56
Total Petroleum and Other Liquids Net Imports .... 5.38 5.20 5.04 4.65 4.95 4.61 4.74 3.87 4.30 4.78 5.02 4.11 5.07 4.54 4.55
End-of-period Inventories (million barrels) Commercial Inventory Crude Oil (excluding SPR) ...................................... 386.7 386.0 363.3 393.3 474.8 469.5 460.8 471.4 490.0 474.2 455.8 441.2 393.3 471.4 441.2
Hydrocarbon Gas Liquids ....................................... 99.5 166.1 211.7 175.4 138.8 196.3 228.7 191.6 159.5 198.6 223.4 176.3 175.4 191.6 176.3
Unfinished Oils ....................................................... 91.9 87.6 84.3 78.3 84.7 86.0 88.8 80.4 91.0 88.5 86.6 81.3 78.3 80.4 81.3
Other HC/Oxygenates ............................................. 22.7 23.3 22.4 23.3 26.7 25.0 23.8 25.7 27.8 26.6 25.8 26.1 23.3 25.7 26.1
Total Motor Gasoline .............................................. 221.6 219.3 212.5 240.4 231.5 221.0 225.1 229.4 228.8 223.0 220.2 232.5 240.4 229.4 232.5
Finished Motor Gasoline ...................................... 34.4 28.8 28.4 31.2 26.9 25.7 29.0 28.6 26.3 26.1 25.6 27.1 31.2 28.6 27.1
Motor Gasoline Blend Comp. .............................. 187.2 190.5 184.1 209.1 204.6 195.4 196.1 200.8 202.4 196.9 194.6 205.5 209.1 200.8 205.5
Jet Fuel ................................................................... 36.4 37.1 39.8 38.3 37.2 43.7 40.4 37.9 38.1 39.2 42.0 38.4 38.3 37.9 38.4
Distillate Fuel Oil .................................................... 115.2 121.6 131.4 136.3 128.3 139.4 148.8 153.0 138.8 146.0 155.8 157.5 136.3 153.0 157.5
Residual Fuel Oil .................................................... 36.0 36.6 36.6 33.7 38.1 41.8 41.3 41.7 40.8 40.1 37.8 38.2 33.7 41.7 38.2
Other Oils (g) .......................................................... 52.9 50.6 46.7 49.6 57.3 54.6 48.3 51.0 58.2 55.7 48.7 49.9 49.6 51.0 49.9
Total Commercial Inventory ....................................... 1,063 1,128 1,149 1,169 1,217 1,277 1,306 1,282 1,273 1,292 1,296 1,241 1,169 1,282 1,241
Crude Oil in SPR ....................................................... 696 691 691 691 691 694 695 695 695 695 695 695 691 695 695
(e) Renewables and oxygenate production includes pentanes plus, oxygenates (excluding fuel ethanol), and renewable fuels.
Table 4a. U.S. Petroleum and Other Liquids Supply, Consumption, and InventoriesU.S. Energy Information Administration | Short-Term Energy Outlook - December 2015
2014 2015 2016 Year
- = no data available(a) Includes lease condensate.(b) Crude oil production from U.S. Federal leases in the Gulf of Mexico (GOM).(c) Net imports equals gross imports minus gross exports.(d) Crude oil adjustment balances supply and consumption and was previously referred to as "Unaccounted for Crude Oil."
Petroleum Supply Annual , DOE/EIA-0340/2; and Weekly Petroleum Status Report , DOE/EIA-0208. Minor discrepancies with published historical data are due to independent rounding. Projections: EIA Regional Short-Term Energy Model.
(f) Petroleum products adjustment includes hydrogen/oxygenates/renewables/other hydrocarbons, motor gasoline blend components, and finished motor gasoline.(g) "Other Oils" inludes aviation gasoline blend components, finished aviation gasoline, kerosene, petrochemical feedstocks, special naphthas, lubricants, waxes, petroleum coke, asphalt and road oil, still gas, and miscellaneous products.Notes: The approximate break between historical and forecast values is shown with historical data printed in bold; estimates and forecasts in italics.SPR: Strategic Petroleum ReserveHC: HydrocarbonsHistorical data: Latest data available from Energy Information Administration databases supporting the following reports: Petroleum Supply Monthly , DOE/EIA-0109;

1st 2nd 3rd 4th 1st 2nd 3rd 4th 1st 2nd 3rd 4th 2014 2015 2016HGL Production Natural Gas Processing Plants Ethane ............................................................. 1.05 1.11 1.11 1.09 1.05 1.10 1.09 1.14 1.22 1.23 1.27 1.32 1.09 1.09 1.26 Propane ........................................................... 0.88 0.96 1.03 1.06 1.07 1.12 1.13 1.13 1.13 1.17 1.19 1.24 0.98 1.11 1.18 Butanes ........................................................... 0.48 0.53 0.57 0.59 0.58 0.62 0.64 0.63 0.63 0.65 0.66 0.66 0.54 0.62 0.65 Natural Gasoline (Pentanes Plus) ................... 0.34 0.39 0.43 0.42 0.39 0.44 0.46 0.44 0.42 0.45 0.48 0.46 0.39 0.43 0.45 Refinery and Blender Net Production Ethane/Ethylene .............................................. 0.01 0.01 0.01 0.01 0.01 0.01 0.01 0.01 0.00 0.01 0.01 0.00 0.01 0.01 0.01 Propane/Propylene ......................................... 0.57 0.60 0.59 0.59 0.54 0.58 0.56 0.58 0.59 0.61 0.60 0.60 0.59 0.57 0.60 Butanes/Butylenes .......................................... -0.05 0.27 0.21 -0.18 -0.08 0.27 0.19 -0.18 -0.03 0.26 0.18 -0.17 0.06 0.05 0.06 Renewable Fuels and Oxygenate Plant Net Production Natural Gasoline (Pentanes Plus) ................... -0.02 -0.02 -0.02 -0.02 -0.02 -0.02 -0.02 -0.02 -0.02 -0.02 -0.02 -0.02 -0.02 -0.02 -0.02
HGL Net Imports Ethane ................................................................ -0.02 -0.02 -0.05 -0.06 -0.06 -0.07 -0.06 -0.07 -0.10 -0.11 -0.15 -0.17 -0.04 -0.07 -0.13 Propane/Propylene ............................................ -0.17 -0.34 -0.36 -0.39 -0.40 -0.49 -0.56 -0.61 -0.58 -0.65 -0.69 -0.69 -0.32 -0.51 -0.65 Butanes/Butylenes ............................................. -0.04 -0.06 -0.09 -0.03 -0.06 -0.09 -0.11 -0.10 -0.15 -0.17 -0.17 -0.15 -0.06 -0.09 -0.16 Natural Gasoline (Pentanes Plus) ...................... -0.13 -0.16 -0.16 -0.15 -0.17 -0.15 -0.21 -0.20 -0.20 -0.19 -0.21 -0.20 -0.15 -0.18 -0.20
HGL Refinery and Blender Net Inputs Butanes/Butylenes ............................................. 0.37 0.28 0.30 0.48 0.40 0.27 0.32 0.44 0.36 0.29 0.30 0.43 0.36 0.35 0.35 Natural Gasoline (Pentanes Plus) ...................... 0.14 0.16 0.16 0.16 0.15 0.14 0.16 0.16 0.17 0.18 0.18 0.18 0.15 0.15 0.18
HGL Consumption Ethane/Ethylene ................................................. 1.04 0.99 1.10 1.06 1.03 1.02 1.02 1.09 1.10 1.09 1.14 1.19 1.05 1.04 1.13 Propane/Propylene ............................................ 1.46 0.91 1.01 1.30 1.43 0.92 0.96 1.18 1.40 0.98 0.99 1.29 1.17 1.12 1.16 Butanes/Butylenes ............................................. 0.15 0.18 0.17 0.22 0.16 0.24 0.22 0.22 0.19 0.22 0.21 0.23 0.18 0.21 0.21 Natural Gasoline (Pentanes Plus) ...................... 0.05 0.04 0.04 0.08 0.10 0.09 0.09 0.07 0.04 0.05 0.05 0.06 0.05 0.09 0.05
HGL Inventories (million barrels) Ethane/Ethylene ................................................. 30.03 37.15 38.95 36.45 31.38 31.65 31.86 32.57 31.99 36.17 36.83 34.16 35.67 31.87 34.79 Propane/Propylene ............................................ 28.81 57.90 81.41 77.95 58.10 84.20 100.20 92.74 68.67 82.25 93.05 79.55 77.95 92.74 79.55 Butanes/Butylenes ............................................. 26.31 52.35 72.40 41.95 32.46 59.42 76.52 48.87 40.12 59.93 73.18 44.09 41.95 48.87 44.09 Natural Gasoline (Pentanes Plus) ...................... 13.99 15.77 20.39 20.61 17.16 20.51 19.00 18.28 17.59 19.31 20.69 19.85 20.61 18.28 19.85
Refinery and Blender Net Inputs Crude OIl .............................................................. 15.19 15.88 16.36 15.96 15.53 16.48 16.58 16.14 15.57 16.48 16.67 16.16 15.85 16.18 16.22
Hydrocarbon Gas Liquids .................................... 0.52 0.43 0.46 0.64 0.54 0.40 0.47 0.60 0.52 0.47 0.48 0.62 0.51 0.51 0.52
Other Hydrocarbons/Oxygenates ........................ 1.09 1.16 1.16 1.14 1.12 1.18 1.19 1.19 1.18 1.23 1.27 1.24 1.14 1.17 1.23
Unfinished Oils ..................................................... 0.26 0.51 0.41 0.45 0.24 0.22 0.38 0.40 0.24 0.30 0.36 0.41 0.41 0.31 0.33
Motor Gasoline Blend Components ..................... 0.55 1.00 0.80 0.33 0.72 0.91 0.75 0.52 0.66 0.89 0.70 0.49 0.67 0.72 0.68
Aviation Gasoline Blend Components ................. 0.00 0.00 0.00 0.00 0.00 0.00 0.00 0.00 0.00 0.00 0.00 0.00 0.00 0.00 0.00
Total Refinery and Blender Net Inputs .................... 17.60 18.98 19.18 18.51 18.14 19.18 19.38 18.85 18.18 19.36 19.50 18.92 18.57 18.89 18.99
Refinery Processing Gain .................................. 1.05 1.07 1.10 1.10 0.99 1.02 1.08 1.10 1.03 1.07 1.10 1.11 1.08 1.05 1.08
Refinery and Blender Net Production Hydrocarbon Gas Liquids .................................... 0.53 0.87 0.80 0.41 0.47 0.86 0.76 0.41 0.56 0.87 0.78 0.43 0.65 0.62 0.66
Finished Motor Gasoline ...................................... 9.11 9.77 9.71 9.69 9.48 9.83 9.97 9.94 9.53 9.93 9.95 9.91 9.57 9.80 9.83
Jet Fuel ................................................................. 1.45 1.50 1.64 1.57 1.50 1.61 1.60 1.60 1.49 1.60 1.62 1.53 1.54 1.58 1.56
Distillate Fuel ........................................................ 4.69 4.97 5.00 5.00 4.82 4.99 5.08 4.98 4.67 4.98 5.08 5.10 4.92 4.97 4.96
Residual Fuel ....................................................... 0.46 0.44 0.42 0.43 0.43 0.44 0.41 0.40 0.45 0.45 0.44 0.43 0.44 0.42 0.44
Other Oils (a) ........................................................ 2.42 2.50 2.70 2.52 2.44 2.48 2.63 2.63 2.51 2.60 2.73 2.62 2.54 2.55 2.62
Total Refinery and Blender Net Production ............ 18.65 20.05 20.28 19.62 19.13 20.20 20.45 19.95 19.21 20.43 20.60 20.02 19.65 19.94 20.07
Refinery Distillation Inputs ................................ 15.52 16.18 16.65 16.26 15.78 16.69 16.85 16.41 15.89 16.68 16.94 16.44 16.16 16.43 16.49
Refinery Operable Distillation Capacity ........... 17.93 17.91 17.83 17.82 17.88 17.98 18.08 18.07 18.10 18.10 18.26 18.34 17.87 18.00 18.20
Refinery Distillation Utilization Factor .............. 0.87 0.90 0.93 0.91 0.88 0.93 0.93 0.91 0.88 0.92 0.93 0.90 0.90 0.91 0.91
Table 4b. U.S. Hydrocarbon Gas Liquids (HGL) and Petroleum Refinery Balances (million barrels per day, except inventories and utilization factor)U.S. Energy Information Administration | Short-Term Energy Outlook - December 2015
2014 2015 2016 Year
Projections: EIA Regional Short-Term Energy Model.
- = no data available(a) "Other Oils" includes aviation gasoline blend components, finished aviation gasoline, kerosene, petrochemical feedstocks, special naphthas, lubricants, waxes, petroleum coke, asphalt and road oil, still gas, and miscellaneous products.Notes: The approximate break between historical and forecast values is shown with historical data printed in bold; estimates and forecasts in italics.Historical data: Latest data available from Energy Information Administration databases supporting the following reports: Petroleum Supply Monthly , DOE/EIA-0109; Petroleum Supply Annual , DOE/EIA-0340/2; Weekly Petroleum Status Report , DOE/EIA-0208.Minor discrepancies with published historical data are due to independent rounding.

1st 2nd 3rd 4th 1st 2nd 3rd 4th 1st 2nd 3rd 4th 2014 2015 2016Prices (cents per gallon) Refiner Wholesale Price ...................... 272 298 276 203 159 201 184 141 145 178 180 158 262 172 165
Gasoline Regular Grade Retail Prices Including Taxes PADD 1 .............................................. 344 365 348 292 228 259 247 212 215 245 249 234 337 237 236
PADD 2 .............................................. 337 365 343 279 216 256 253 211 207 246 248 224 331 234 232
PADD 3 .............................................. 318 345 329 265 204 240 228 191 194 227 229 208 314 216 215
PADD 4 .............................................. 326 351 363 297 207 261 277 218 199 237 251 228 335 241 229
PADD 5 .............................................. 362 401 386 315 271 328 327 260 243 280 284 260 366 297 267
U.S. Average ................................... 340 368 350 288 227 267 260 216 214 248 252 231 336 243 236
Gasoline All Grades Including Taxes 348 375 358 296 236 275 269 226 223 257 260 240 344 252 245
End-of-period Inventories (million barrels) Total Gasoline Inventories PADD 1 .............................................. 57.7 63.1 55.7 62.1 64.5 61.3 62.6 60.7 61.0 62.0 57.8 61.0 62.1 60.7 61.0
PADD 2 .............................................. 49.1 49.7 47.1 52.4 52.9 50.4 47.0 51.1 51.4 48.8 49.4 50.6 52.4 51.1 50.6
PADD 3 .............................................. 78.5 73.2 74.9 84.2 78.4 74.6 78.1 79.5 79.5 77.5 78.3 81.6 84.2 79.5 81.6
PADD 4 .............................................. 6.4 6.1 7.4 7.9 6.5 6.8 7.1 7.2 7.1 6.8 6.9 7.6 7.9 7.2 7.6
PADD 5 .............................................. 29.9 27.1 27.3 33.7 29.2 28.0 30.3 30.8 29.9 27.8 27.9 31.7 33.7 30.8 31.7
U.S. Total ........................................ 221.6 219.3 212.5 240.4 231.5 221.0 225.1 229.4 228.8 223.0 220.2 232.5 240.4 229.4 232.5
Finished Gasoline Inventories U.S. Total ........................................ 34.4 28.8 28.4 31.2 26.9 25.7 29.0 28.6 26.3 26.1 25.6 27.1 31.2 28.6 27.1
Gasoline Blending Components Inventories U.S. Total ........................................ 187.2 190.5 184.1 209.1 204.6 195.4 196.1 200.8 202.4 196.9 194.6 205.5 209.1 200.8 205.5
Table 4c. U.S. Regional Motor Gasoline Prices and InventoriesU.S. Energy Information Administration | Short-Term Energy Outlook - December 2015
2014 2015 2016 Year
Petroleum Supply Monthly , DOE/EIA-0109; Petroleum Supply Annual , DOE/EIA-0340/2; and Weekly Petroleum Status Report , DOE/EIA-0208.Minor discrepancies with published historical data are due to independent rounding. Projections: EIA Regional Short-Term Energy Model.
- = no data availablePrices are not adjusted for inflation.Notes: The approximate break between historical and forecast values is shown with historical data printed in bold; estimates and forecasts in italics.Regions refer to Petroleum Administration for Defense Districts (PADD).See “Petroleum for Administration Defense District” in EIA’s Energy Glossary (http://www.eia.doe.gov/glossary/index.html) for a list of States in each region.Historical data : Latest data available from Energy Information Administration databases supporting the following reports: Petroleum Marketing Monthly , DOE/EIA-0380;
1st 2nd 3rd 4th 1st 2nd 3rd 4th 1st 2nd 3rd 4th 2014 2015 2016Supply (billion cubic feet per day) Total Marketed Production ............ 71.75 74.09 76.06 77.60 78.11 79.20 80.57 80.39 80.70 80.87 80.98 81.65 74.89 79.58 81.05
Alaska ...................................... 0.99 0.93 0.87 0.99 0.99 0.93 0.86 0.94 0.98 0.84 0.76 0.92 0.95 0.93 0.87
Federal GOM (a) ....................... 3.31 3.52 3.51 3.43 3.37 3.68 3.95 3.30 3.35 3.30 3.13 3.09 3.44 3.58 3.22
Lower 48 States (excl GOM) ..... 67.45 69.64 71.68 73.19 73.75 74.58 75.75 76.15 76.36 76.72 77.09 77.64 70.51 75.07 76.96
Total Dry Gas Production ............. 67.53 69.73 71.59 73.04 73.67 74.50 75.81 75.64 75.93 76.09 76.19 76.82 70.49 74.91 76.26
LNG Gross Imports ..................... 0.17 0.17 0.15 0.16 0.43 0.08 0.26 0.17 0.14 0.16 0.17 0.15 0.16 0.23 0.15
LNG Gross Exports ..................... 0.03 0.02 0.09 0.03 0.06 0.06 0.09 0.00 0.19 0.62 0.72 1.07 0.04 0.05 0.65
Pipeline Gross Imports ................ 8.44 6.52 6.47 7.47 8.36 6.69 6.69 6.67 7.03 6.02 6.34 6.52 7.22 7.10 6.48
Pipeline Gross Exports ................ 4.67 3.89 3.85 4.02 4.86 4.36 4.81 5.40 5.35 5.06 5.19 5.32 4.10 4.86 5.23
Supplemental Gaseous Fuels ...... 0.16 0.16 0.17 0.17 0.17 0.16 0.14 0.17 0.17 0.17 0.17 0.17 0.16 0.16 0.17
Net Inventory Withdrawals ........... 22.75 -12.71 -12.96 0.54 18.48 -12.99 -10.50 2.66 16.71 -9.45 -9.50 2.34 -0.69 -0.66 0.01
Total Supply ................................... 94.35 59.96 61.47 77.33 96.19 64.00 67.50 79.90 94.43 67.30 67.46 79.60 73.20 76.83 77.18
Balancing Item (b) .......................... 0.52 0.87 -0.15 -1.47 0.49 0.09 -1.39 -0.51 -0.39 -1.59 -0.22 0.11 -0.06 -0.33 -0.52
Total Primary Supply ....................... 94.87 60.83 61.32 75.86 96.68 64.09 66.11 79.39 94.04 65.71 67.23 79.71 73.14 76.49 76.66
Consumption (billion cubic feet per day) Residential ................................... 28.78 7.53 3.69 16.01 27.53 6.90 3.47 15.22 25.24 7.34 3.81 16.44 13.94 13.22 13.19
Commercial ................................. 16.48 6.26 4.61 10.77 16.01 5.85 4.45 10.13 14.52 5.99 4.62 10.69 9.50 9.08 8.95
Industrial ..................................... 22.85 19.94 19.55 21.24 22.69 19.62 19.19 21.98 23.08 20.66 20.44 22.54 20.89 20.86 21.68
Electric Power (c) ......................... 19.72 21.06 27.30 21.11 23.05 25.28 32.41 25.03 23.66 25.12 31.71 22.93 22.32 26.46 25.86
Lease and Plant Fuel ................... 3.94 4.07 4.17 4.26 4.29 4.35 4.42 4.41 4.43 4.44 4.44 4.48 4.11 4.37 4.45
Pipeline and Distribution Use ....... 3.01 1.88 1.90 2.37 3.03 2.01 2.07 2.52 3.02 2.06 2.11 2.53 2.29 2.40 2.43
Vehicle Use ................................. 0.10 0.10 0.10 0.10 0.09 0.09 0.10 0.10 0.10 0.10 0.10 0.10 0.10 0.09 0.10
Total Consumption ......................... 94.87 60.83 61.32 75.86 96.68 64.09 66.11 79.39 94.04 65.71 67.23 79.71 73.14 76.49 76.66
End-of-period Inventories (billion cubic feet) Working Gas Inventory ................ 857 2,005 3,187 3,141 1,483 2,658 3,626 3,382 1,862 2,721 3,595 3,380 3,141 3,382 3,380
East Region (d) ........................ 168 475 806 743 243 573 855 764 335 606 862 744 743 764 744
Midwest Region (d) ................... 143 472 936 855 252 567 974 921 431 658 1,007 883 855 921 883
South Central Region (d) .......... 338 666 929 1,045 575 1,005 1,212 1,158 712 941 1,110 1,179 1,045 1,158 1,179
Mountain Region (d) ................. 84 122 175 152 113 155 204 179 109 146 203 183 152 179 183
Pacific Region (d) ..................... 105 249 318 323 275 334 357 335 251 346 388 366 323 335 366
Alaska ...................................... 21 22 24 25 24 24 25 25 24 24 25 25 25 25 25
Table 5a. U.S. Natural Gas Supply, Consumption, and InventoriesU.S. Energy Information Administration | Short-Term Energy Outlook - December 2015
2014 2015 2016 Year
LNG: liquefied natural gas.Historical data: Latest data available from Energy Information Administration databases supporting the following reports: Natural Gas Monthly , DOE/EIA-0130; and Electric Power Monthly , DOE/EIA-0226.Minor discrepancies with published historical data are due to independent rounding. Projections: EIA Regional Short-Term Energy Model.
- = no data available(a) Marketed production from U.S. Federal leases in the Gulf of Mexico.(b) The balancing item represents the difference between the sum of the components of natural gas supply and the sum of components of natural gas demand.(c) Natural gas used for electricity generation and (a limited amount of) useful thermal output by electric utilities and independent power producers.(d) For a list of States in each inventory region refer to Weekly Natural Gas Storage Report, Notes and Definitions (http://ir.eia.gov/ngs/notes.html) .Notes: The approximate break between historical and forecast values is shown with historical data printed in bold; estimates and forecasts in italics.

1st 2nd 3rd 4th 1st 2nd 3rd 4th 1st 2nd 3rd 4th 2014 2015 2016Wholesale/Spot Henry Hub Spot Price ........ 5.36 4.75 4.08 3.91 2.99 2.83 2.84 2.36 2.73 2.81 3.04 3.27 4.52 2.75 2.96
Residential New England ..................... 13.67 15.99 18.04 14.41 13.09 13.33 16.09 12.67 11.88 13.62 16.54 13.07 14.53 13.20 12.81
Middle Atlantic ................... 10.71 13.08 17.38 11.10 9.53 11.20 16.36 11.52 10.24 12.72 17.18 11.71 11.58 10.67 11.47
E. N. Central ...................... 8.67 12.89 16.94 8.97 7.78 10.58 16.71 8.57 7.38 10.79 16.47 8.36 9.70 8.81 8.63
W. N. Central ..................... 9.02 11.78 18.17 10.04 8.66 11.85 17.60 9.23 7.31 9.79 16.64 9.04 10.13 9.68 8.65
S. Atlantic .......................... 11.25 16.24 22.79 12.70 10.70 16.68 22.69 12.69 10.75 15.88 22.08 12.58 12.91 12.61 12.56
E. S. Central ...................... 9.63 14.12 19.75 11.14 9.34 14.36 18.75 10.83 8.75 12.83 18.18 10.88 11.02 10.70 10.32
W. S. Central ..................... 8.60 14.35 20.45 11.69 8.45 13.94 19.88 11.35 8.08 12.72 18.43 10.90 10.92 10.63 10.15
Mountain ........................... 9.09 11.23 15.15 9.88 9.57 10.87 14.54 9.41 8.40 9.35 13.20 8.59 10.14 10.10 8.97
Pacific ................................ 10.95 11.69 12.38 11.21 11.46 11.40 12.02 9.65 9.20 9.98 10.66 9.96 11.35 10.93 9.76
U.S. Average .................. 9.82 13.11 16.94 10.52 9.29 11.96 16.43 10.15 8.75 11.60 15.88 10.04 10.94 10.36 10.07
Commercial New England ..................... 11.54 12.94 11.86 11.43 10.77 10.11 9.65 10.00 10.25 9.99 10.07 10.37 11.78 10.38 10.23
Middle Atlantic ................... 9.31 9.03 8.05 8.05 7.91 7.48 6.65 7.06 7.50 7.28 7.31 8.08 8.78 7.51 7.60
E. N. Central ...................... 7.96 9.95 10.10 7.55 6.95 7.51 8.80 6.85 6.74 7.93 8.88 7.13 8.26 7.13 7.18
W. N. Central ..................... 8.24 9.21 10.18 8.31 7.65 7.98 8.99 7.10 6.99 7.45 8.68 7.34 8.53 7.62 7.29
S. Atlantic .......................... 9.27 10.59 10.94 9.52 8.48 9.21 9.66 8.75 8.61 9.32 10.09 9.24 9.73 8.79 9.09
E. S. Central ...................... 8.86 10.68 11.15 9.54 8.54 9.62 9.81 8.57 7.86 8.80 9.66 8.94 9.52 8.82 8.51
W. S. Central ..................... 7.58 9.33 9.35 8.33 7.15 7.21 8.00 7.12 6.59 7.21 7.94 7.36 8.32 7.27 7.08
Mountain ........................... 7.79 8.72 9.89 8.46 8.27 8.34 9.03 7.70 7.09 7.22 8.43 7.45 8.38 8.17 7.36
Pacific ................................ 9.29 9.32 9.53 9.26 9.20 8.43 8.69 8.49 8.51 8.49 9.02 8.76 9.32 8.73 8.67
U.S. Average .................. 8.65 9.66 9.69 8.51 7.94 8.13 8.41 7.65 7.50 7.96 8.66 8.01 8.87 7.94 7.85
Industrial New England ..................... 10.14 10.05 8.13 9.14 9.10 7.61 6.10 7.54 8.10 7.71 7.76 8.84 9.53 7.95 8.15
Middle Atlantic ................... 9.85 9.24 8.73 8.58 8.31 7.56 7.53 7.41 7.54 6.87 7.36 8.10 9.33 7.89 7.53
E. N. Central ...................... 8.03 8.86 7.75 6.85 6.41 5.65 5.54 5.44 5.89 5.69 6.00 6.17 7.80 5.92 5.95
W. N. Central ..................... 7.29 6.25 5.91 6.32 5.81 4.59 4.41 4.66 4.79 4.17 4.44 5.02 6.54 4.95 4.64
S. Atlantic .......................... 6.90 6.37 5.91 6.00 5.46 4.50 4.50 4.59 4.74 4.76 5.04 5.40 6.32 4.79 4.99
E. S. Central ...................... 6.34 6.11 5.37 5.55 5.15 4.28 4.02 4.20 4.52 4.36 4.64 5.02 5.87 4.45 4.63
W. S. Central ..................... 5.15 4.92 4.52 4.26 3.21 2.92 3.07 2.60 2.79 2.95 3.34 3.49 4.72 2.94 3.14
Mountain ........................... 6.66 6.79 6.90 6.76 6.61 6.22 6.11 5.77 5.16 4.90 5.56 5.71 6.76 6.20 5.33
Pacific ................................ 7.79 7.68 7.63 7.48 7.32 6.57 6.62 6.17 5.64 5.60 6.21 6.43 7.65 6.67 5.97
U.S. Average .................. 6.19 5.64 5.08 5.18 4.57 3.68 3.65 3.55 3.88 3.64 3.94 4.36 5.55 3.88 3.96
Table 5b. U.S. Regional Natural Gas Prices (dollars per thousand cubic feetU.S. Energy Information Administration | Short-Term Energy Outlook - December 2015
2014 2015 2016 Year
Natural gas Henry Hub spot price from Reuter's News Service (http://www.reuters.com).Minor discrepancies with published historical data are due to independent rounding. Projections: EIA Regional Short-Term Energy Model.
- = no data availablePrices are not adjusted for inflation.Notes: The approximate break between historical and forecast values is shown with historical data printed in bold; estimates and forecasts in italics.Regions refer to U.S. Census divisions. See "Census division" in EIA’s Energy Glossary (http://www.eia.doe.gov/glossary/index.html) for a list of States in each region.Historical data: Latest data available from Energy Information Administration databases supporting the Natural Gas Monthly , DOE/EIA-0130.
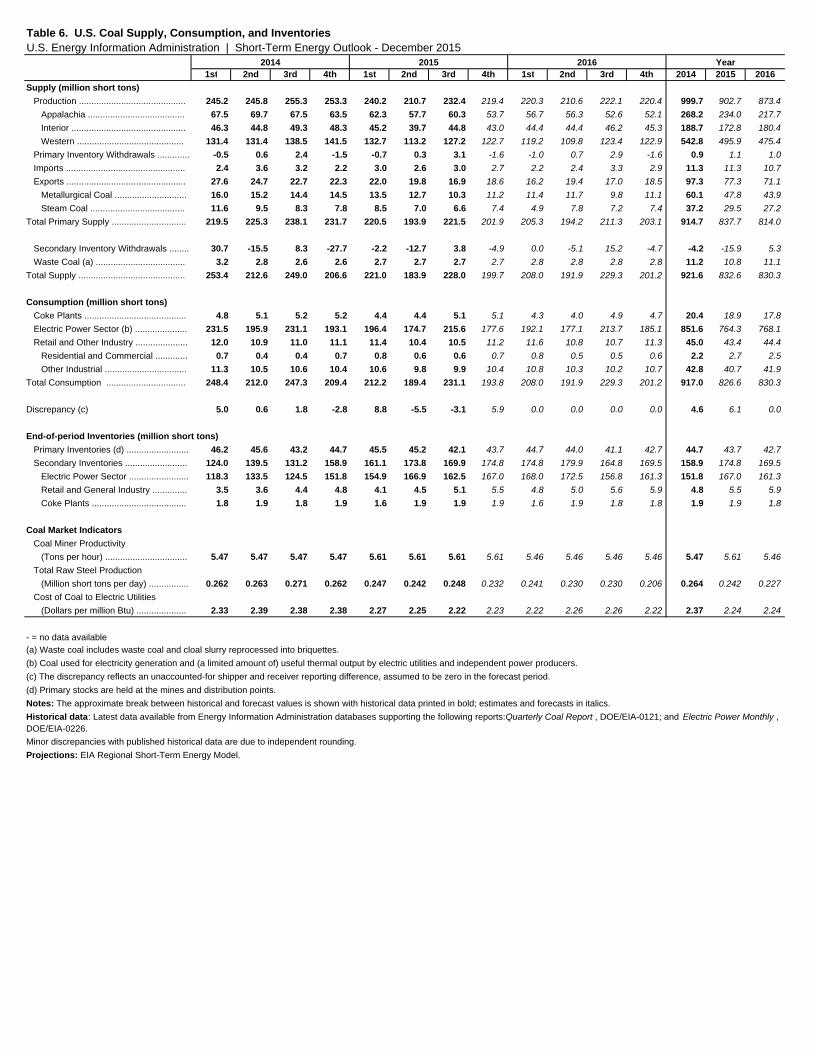
1st 2nd 3rd 4th 1st 2nd 3rd 4th 1st 2nd 3rd 4th 2014 2015 2016Supply (million short tons) Production ........................................... 245.2 245.8 255.3 253.3 240.2 210.7 232.4 219.4 220.3 210.6 222.1 220.4 999.7 902.7 873.4
Appalachia ....................................... 67.5 69.7 67.5 63.5 62.3 57.7 60.3 53.7 56.7 56.3 52.6 52.1 268.2 234.0 217.7
Interior .............................................. 46.3 44.8 49.3 48.3 45.2 39.7 44.8 43.0 44.4 44.4 46.2 45.3 188.7 172.8 180.4
Western ........................................... 131.4 131.4 138.5 141.5 132.7 113.2 127.2 122.7 119.2 109.8 123.4 122.9 542.8 495.9 475.4
Primary Inventory Withdrawals ............. -0.5 0.6 2.4 -1.5 -0.7 0.3 3.1 -1.6 -1.0 0.7 2.9 -1.6 0.9 1.1 1.0
Imports ................................................ 2.4 3.6 3.2 2.2 3.0 2.6 3.0 2.7 2.2 2.4 3.3 2.9 11.3 11.3 10.7
Exports ................................................ 27.6 24.7 22.7 22.3 22.0 19.8 16.9 18.6 16.2 19.4 17.0 18.5 97.3 77.3 71.1
Metallurgical Coal ............................. 16.0 15.2 14.4 14.5 13.5 12.7 10.3 11.2 11.4 11.7 9.8 11.1 60.1 47.8 43.9
Steam Coal ...................................... 11.6 9.5 8.3 7.8 8.5 7.0 6.6 7.4 4.9 7.8 7.2 7.4 37.2 29.5 27.2
Total Primary Supply .............................. 219.5 225.3 238.1 231.7 220.5 193.9 221.5 201.9 205.3 194.2 211.3 203.1 914.7 837.7 814.0
Secondary Inventory Withdrawals ........ 30.7 -15.5 8.3 -27.7 -2.2 -12.7 3.8 -4.9 0.0 -5.1 15.2 -4.7 -4.2 -15.9 5.3
Waste Coal (a) .................................... 3.2 2.8 2.6 2.6 2.7 2.7 2.7 2.7 2.8 2.8 2.8 2.8 11.2 10.8 11.1
Total Supply ........................................... 253.4 212.6 249.0 206.6 221.0 183.9 228.0 199.7 208.0 191.9 229.3 201.2 921.6 832.6 830.3
Consumption (million short tons) Coke Plants ......................................... 4.8 5.1 5.2 5.2 4.4 4.4 5.1 5.1 4.3 4.0 4.9 4.7 20.4 18.9 17.8
Electric Power Sector (b) ..................... 231.5 195.9 231.1 193.1 196.4 174.7 215.6 177.6 192.1 177.1 213.7 185.1 851.6 764.3 768.1
Retail and Other Industry ..................... 12.0 10.9 11.0 11.1 11.4 10.4 10.5 11.2 11.6 10.8 10.7 11.3 45.0 43.4 44.4
Residential and Commercial ............. 0.7 0.4 0.4 0.7 0.8 0.6 0.6 0.7 0.8 0.5 0.5 0.6 2.2 2.7 2.5
Other Industrial ................................. 11.3 10.5 10.6 10.4 10.6 9.8 9.9 10.4 10.8 10.3 10.2 10.7 42.8 40.7 41.9
Total Consumption ................................ 248.4 212.0 247.3 209.4 212.2 189.4 231.1 193.8 208.0 191.9 229.3 201.2 917.0 826.6 830.3
Discrepancy (c) 5.0 0.6 1.8 -2.8 8.8 -5.5 -3.1 5.9 0.0 0.0 0.0 0.0 4.6 6.1 0.0
End-of-period Inventories (million short tons) Primary Inventories (d) ......................... 46.2 45.6 43.2 44.7 45.5 45.2 42.1 43.7 44.7 44.0 41.1 42.7 44.7 43.7 42.7
Secondary Inventories ......................... 124.0 139.5 131.2 158.9 161.1 173.8 169.9 174.8 174.8 179.9 164.8 169.5 158.9 174.8 169.5
Electric Power Sector ........................ 118.3 133.5 124.5 151.8 154.9 166.9 162.5 167.0 168.0 172.5 156.8 161.3 151.8 167.0 161.3
Retail and General Industry .............. 3.5 3.6 4.4 4.8 4.1 4.5 5.1 5.5 4.8 5.0 5.6 5.9 4.8 5.5 5.9
Coke Plants ...................................... 1.8 1.9 1.8 1.9 1.6 1.9 1.9 1.9 1.6 1.9 1.8 1.8 1.9 1.9 1.8
Coal Market Indicators Coal Miner Productivity (Tons per hour) ................................. 5.47 5.47 5.47 5.47 5.61 5.61 5.61 5.61 5.46 5.46 5.46 5.46 5.47 5.61 5.46
Total Raw Steel Production (Million short tons per day) ................ 0.262 0.263 0.271 0.262 0.247 0.242 0.248 0.232 0.241 0.230 0.230 0.206 0.264 0.242 0.227
Cost of Coal to Electric Utilities (Dollars per million Btu) .................... 2.33 2.39 2.38 2.38 2.27 2.25 2.22 2.23 2.22 2.26 2.26 2.22 2.37 2.24 2.24
Table 6. U.S. Coal Supply, Consumption, and InventoriesU.S. Energy Information Administration | Short-Term Energy Outlook - December 2015
2014 2015 2016 Year
Historical data: Latest data available from Energy Information Administration databases supporting the following reports: Quarterly Coal Report , DOE/EIA-0121; and Electric Power Monthly , DOE/EIA-0226.Minor discrepancies with published historical data are due to independent rounding. Projections: EIA Regional Short-Term Energy Model.
- = no data available(a) Waste coal includes waste coal and cloal slurry reprocessed into briquettes.(b) Coal used for electricity generation and (a limited amount of) useful thermal output by electric utilities and independent power producers.(c) The discrepancy reflects an unaccounted-for shipper and receiver reporting difference, assumed to be zero in the forecast period.(d) Primary stocks are held at the mines and distribution points.Notes: The approximate break between historical and forecast values is shown with historical data printed in bold; estimates and forecasts in italics.

1st 2nd 3rd 4th 1st 2nd 3rd 4th 1st 2nd 3rd 4th 2014 2015 2016
Electricity Generation ......................... 11.48 10.77 12.07 10.54 11.36 10.77 12.44 10.53 11.03 10.91 12.48 10.71 11.22 11.27 11.29
Electric Power Sector (a) ................ 11.05 10.36 11.62 10.12 10.93 10.36 11.99 10.09 10.61 10.51 12.04 10.27 10.79 10.84 10.86
Comm. and Indus. Sectors (b) ....... 0.43 0.41 0.45 0.43 0.43 0.41 0.45 0.44 0.42 0.41 0.45 0.44 0.43 0.43 0.43
Net Imports ....................................... 0.12 0.14 0.18 0.15 0.17 0.20 0.19 0.15 0.16 0.16 0.19 0.14 0.15 0.18 0.16
Total Supply ....................................... 11.60 10.91 12.24 10.69 11.52 10.96 12.63 10.68 11.19 11.07 12.67 10.85 11.36 11.45 11.45
Losses and Unaccounted for (c) ...... 0.65 0.77 0.66 0.61 0.78 0.93 0.85 0.69 0.61 0.93 0.80 0.73 0.67 0.81 0.77
Retail Sales ........................................ 10.58 9.78 11.19 9.71 10.36 9.68 11.39 9.60 10.20 9.79 11.48 9.73 10.31 10.26 10.30
Residential Sector ........................... 4.32 3.36 4.27 3.47 4.20 3.35 4.51 3.45 4.01 3.41 4.50 3.50 3.86 3.88 3.86
Commercial Sector ......................... 3.61 3.63 4.03 3.54 3.60 3.65 4.11 3.54 3.60 3.67 4.16 3.58 3.70 3.73 3.75
Industrial Sector .............................. 2.62 2.76 2.87 2.68 2.54 2.66 2.75 2.59 2.56 2.70 2.79 2.64 2.73 2.63 2.67
Transportation Sector ..................... 0.02 0.02 0.02 0.02 0.02 0.02 0.02 0.02 0.02 0.02 0.02 0.02 0.02 0.02 0.02
Direct Use (d) ..................................... 0.37 0.36 0.39 0.37 0.37 0.36 0.39 0.38 0.37 0.35 0.39 0.38 0.38 0.38 0.37
Total Consumption ............................ 10.95 10.14 11.58 10.08 10.74 10.03 11.78 9.98 10.57 10.14 11.87 10.11 10.69 10.64 10.68
Average residential electricity usage per customer (kWh) ................ 3,032 2,379 3,054 2,472 2,923 2,349 3,189 2,437 2,796 2,368 3,158 2,446 10,937 10,898 10,768
Prices
Coal ................................................. 2.33 2.39 2.38 2.38 2.27 2.25 2.22 2.23 2.22 2.26 2.26 2.22 2.37 2.24 2.24
Natural Gas ..................................... 6.82 4.94 4.25 4.30 4.09 3.12 3.09 3.34 3.79 3.43 3.46 4.20 4.98 3.37 3.69
Residual Fuel Oil ............................. 19.97 20.44 19.75 14.70 10.82 11.64 11.05 9.67 9.43 11.01 11.43 11.36 19.19 10.79 10.78
Distillate Fuel Oil .............................. 23.40 22.77 21.89 18.69 15.39 15.18 13.61 13.25 13.99 14.84 15.49 15.95 22.33 14.64 14.99
Residential Sector ........................... 11.93 12.75 13.03 12.39 12.23 12.85 12.99 12.32 12.16 12.80 13.13 12.65 12.52 12.61 12.70
Commercial Sector ......................... 10.55 10.67 11.14 10.57 10.47 10.53 10.95 10.45 10.58 10.72 11.18 10.67 10.74 10.62 10.80
Industrial Sector .............................. 7.05 7.02 7.51 6.85 6.78 6.81 7.31 6.82 6.84 6.89 7.42 6.89 7.11 6.94 7.02
Prices are not adjusted for inflation.
Table 7a. U.S. Electricity Industry OverviewU.S. Energy Information Administration | Short-Term Energy Outlook - December 2015
2014 2015 2016 Year
Electricity Supply (billion kilowatthours per day)
Electricity Consumption (billion kilowatthours per day unless noted)
Power Generation Fuel Costs (dollars per million Btu)
End-Use Prices (cents per kilowatthour)
- = no data available. kWh = kilowatthours. Btu = British thermal units.
Historical data: Latest data available from Energy Information Administration databases supporting the following reports: Electric Power Monthly , DOE/EIA-0226; and Electric Power Annual , DOE/EIA-0348.Minor discrepancies with published historical data are due to independent rounding. Projections: EIA Regional Short-Term Energy Model.
(a) Generation supplied by electricity-only and combined-heat-and-power (CHP) plants operated by electric utilities and independent power producers.(b) Generation supplied by CHP and electricity-only plants operated by businesses in the commercial and industrial sectors, primarily for onsite use.(c) Includes transmission and distribution losses, data collection time-frame differences, and estimation error.(d) Direct Use represents commercial and industrial facility use of onsite net electricity generation; and electrical sales or transfers to adjacent or colocated facilities for which revenue information is not available. See Table 7.6 of the EIA Monthly Energy Review .Notes: The approximate break between historical and forecast values is shown with historical data printed in bold; estimates and forecasts in italics.

1st 2nd 3rd 4th 1st 2nd 3rd 4th 1st 2nd 3rd 4th 2014 2015 2016Residential Sector New England ............... 153 111 136 118 152 112 144 118 142 114 141 120 129 131 129
Middle Atlantic ............. 423 315 386 323 423 321 423 321 389 323 420 324 362 372 364
E. N. Central ................ 619 447 515 481 587 428 556 466 548 443 575 479 515 509 511
W. N. Central ............... 357 250 296 270 325 232 309 264 318 240 315 271 293 283 286
S. Atlantic .................... 1,083 860 1,092 864 1,078 889 1,137 863 1,015 879 1,139 874 975 991 977
E. S. Central ................ 404 277 364 290 390 275 384 282 358 283 384 286 334 333 328
W. S. Central ............... 615 500 731 499 602 503 782 513 574 532 759 505 587 600 593
Mountain ...................... 237 242 320 228 235 240 333 231 245 244 346 236 257 260 268
Pacific contiguous ....... 418 346 421 382 396 337 425 379 409 337 412 387 392 384 386
AK and HI ..................... 14 12 12 13 13 12 13 14 13 12 13 14 13 13 13
Total .......................... 4,322 3,361 4,275 3,468 4,202 3,348 4,505 3,452 4,013 3,406 4,504 3,497 3,855 3,877 3,856
Commercial Sector New England ............... 149 139 155 140 147 139 159 137 144 140 157 138 145 146 145
Middle Atlantic ............. 444 414 463 411 443 417 477 404 437 415 477 406 433 435 434
E. N. Central ................ 510 490 524 480 509 489 543 478 507 496 557 487 501 505 512
W. N. Central ............... 280 267 291 266 281 269 305 269 284 274 312 277 276 281 287
S. Atlantic .................... 804 843 921 794 805 859 939 795 800 848 950 800 841 850 850
E. S. Central ................ 241 240 274 228 235 239 279 229 236 239 283 232 246 245 247
W. S. Central ............... 498 526 617 510 496 530 625 520 504 539 630 523 538 543 549
Mountain ...................... 239 257 286 247 240 256 289 245 247 262 300 250 257 258 265
Pacific contiguous ....... 432 440 484 448 424 433 479 449 428 439 478 448 451 446 448
AK and HI ..................... 16 16 16 17 16 16 17 17 16 16 17 17 16 16 17
Total .......................... 3,612 3,631 4,032 3,540 3,598 3,646 4,114 3,543 3,603 3,668 4,161 3,578 3,705 3,726 3,753
Industrial Sector New England ............... 51 52 55 52 49 50 52 51 48 51 52 51 52 50 50
Middle Atlantic ............. 204 201 208 197 198 196 204 195 204 198 204 198 202 198 201
E. N. Central ................ 543 550 564 540 520 525 531 504 522 526 536 514 549 520 525
W. N. Central ............... 245 256 269 254 237 240 252 245 245 251 261 253 256 243 252
S. Atlantic .................... 371 396 403 383 375 406 406 376 370 399 401 382 388 391 388
E. S. Central ................ 287 295 304 291 279 287 290 279 279 292 297 288 294 284 289
W. S. Central ............... 464 501 509 480 427 456 485 459 439 476 493 462 489 457 468
Mountain ...................... 212 240 254 221 217 235 251 225 220 241 260 231 232 232 238
Pacific contiguous ....... 232 260 285 247 227 251 266 238 223 249 272 243 256 246 247
AK and HI ..................... 13 14 14 14 13 13 15 14 13 13 15 14 14 14 14
Total .......................... 2,622 2,764 2,865 2,679 2,541 2,660 2,751 2,585 2,564 2,695 2,791 2,636 2,733 2,635 2,672
Total All Sectors (a) New England ............... 354 303 347 311 350 302 357 308 337 306 352 310 329 329 326
Middle Atlantic ............. 1,082 941 1,068 941 1,076 944 1,115 930 1,042 947 1,113 939 1,008 1,016 1,010
E. N. Central ................ 1,674 1,489 1,604 1,502 1,618 1,444 1,632 1,450 1,579 1,466 1,669 1,482 1,567 1,536 1,549
W. N. Central ............... 882 772 856 790 843 742 866 779 847 765 888 801 825 807 825
S. Atlantic .................... 2,261 2,102 2,420 2,045 2,262 2,158 2,486 2,037 2,189 2,130 2,494 2,059 2,207 2,236 2,218
E. S. Central ................ 932 812 943 809 904 801 953 790 874 813 965 806 874 862 864
W. S. Central ............... 1,578 1,528 1,858 1,489 1,525 1,490 1,892 1,493 1,518 1,548 1,883 1,491 1,614 1,601 1,610
Mountain ...................... 688 739 861 696 692 731 874 701 712 748 906 718 746 750 771
Pacific contiguous ....... 1,084 1,049 1,193 1,080 1,050 1,023 1,172 1,069 1,063 1,026 1,164 1,081 1,102 1,079 1,084
AK and HI ..................... 44 41 43 44 43 41 44 44 43 41 44 44 43 43 43
Total .......................... 10,579 9,777 11,193 9,707 10,364 9,675 11,390 9,601 10,203 9,790 11,477 9,731 10,314 10,258 10,302
Table 7b. U.S. Regional Electricity Retail Sales (Million Kilowatthours per Day)U.S. Energy Information Administration | Short-Term Energy Outlook - December 2015
2014 2015 2016 Year
Historical data: Latest data available from Energy Information Administration databases supporting the following reports: Electric Power Monthly , DOE/EIA-0226; and Electric Power Annual , DOE/EIA-0348. Minor discrepancies with published historical data are due to independent rounding. Projections: EIA Regional Short-Term Energy Model.
- = no data available(a) Total retail sales to all sectors includes residential, commercial, industrial, and transportation sector sales.Notes: The approximate break between historical and forecast values is shown with historical data printed in bold; estimates and forecasts in italics.Retail Sales represents total retail electricity sales by electric utilities and power marketers. Regions refer to U.S. Census divisions. See "Census division" in EIA’s Energy Glossary (http://www.eia.doe.gov/glossary/index.html) for a list of States in each region.

1st 2nd 3rd 4th 1st 2nd 3rd 4th 1st 2nd 3rd 4th 2014 2015 2016Residential Sector New England .............. 17.44 18.03 17.63 18.35 20.41 20.27 18.34 19.17 19.45 19.12 18.90 20.12 17.82 19.53 19.38
Middle Atlantic ............ 16.25 16.55 16.72 16.02 15.76 16.06 16.47 16.20 16.19 16.45 16.99 16.78 16.39 16.12 16.61
E. N. Central ............... 11.74 13.14 13.17 12.85 12.22 13.20 13.15 12.85 12.39 13.39 13.50 13.45 12.66 12.83 13.17
W. N. Central .............. 9.99 11.75 12.27 10.62 10.25 12.16 12.46 10.83 10.45 12.36 12.77 11.12 11.09 11.39 11.65
S. Atlantic ................... 11.29 11.96 12.12 11.59 11.37 11.90 12.14 11.31 11.05 11.60 11.99 11.36 11.74 11.70 11.52
E. S. Central ............... 10.30 11.22 10.98 10.66 10.34 11.16 10.90 10.60 10.53 11.39 11.39 11.23 10.76 10.73 11.12
W. S. Central .............. 10.46 11.48 11.45 11.11 10.67 11.36 11.04 10.57 10.28 11.03 11.13 10.91 11.13 10.91 10.86
Mountain ..................... 10.92 11.96 12.30 11.25 11.30 12.21 12.33 11.41 11.53 12.50 12.67 11.76 11.67 11.87 12.17
Pacific ......................... 12.90 12.75 15.50 13.16 13.69 13.47 15.76 13.38 13.64 13.61 15.49 13.31 13.64 14.14 14.04
U.S. Average ........... 11.93 12.75 13.03 12.39 12.23 12.85 12.99 12.32 12.16 12.80 13.13 12.65 12.52 12.61 12.70
Commercial Sector New England .............. 15.70 14.28 14.45 14.36 16.92 15.18 14.89 14.98 17.69 16.13 15.99 16.12 14.70 15.49 16.48
Middle Atlantic ............ 14.29 13.30 13.97 12.96 13.18 12.98 13.70 13.14 13.38 13.26 14.02 13.49 13.65 13.27 13.56
E. N. Central ............... 9.81 10.13 10.18 10.04 9.75 9.94 10.04 10.00 9.82 10.03 10.14 10.02 10.04 9.93 10.01
W. N. Central .............. 8.69 9.49 9.98 8.80 8.57 9.52 9.95 8.88 8.73 9.76 10.24 9.12 9.25 9.25 9.48
S. Atlantic ................... 9.73 9.60 9.83 9.56 9.66 9.45 9.59 9.19 9.54 9.49 9.72 9.29 9.68 9.48 9.52
E. S. Central ............... 10.26 10.50 10.39 10.21 10.22 10.35 10.27 10.79 10.82 10.78 10.62 11.02 10.34 10.40 10.80
W. S. Central .............. 8.15 8.36 8.34 8.18 8.04 7.89 7.94 7.76 7.93 7.93 8.06 7.90 8.26 7.91 7.96
Mountain ..................... 9.11 9.87 10.16 9.33 9.37 9.96 10.21 9.48 9.57 10.21 10.47 9.72 9.65 9.78 10.02
Pacific ......................... 11.73 13.13 15.62 13.63 12.23 13.31 15.60 13.27 12.52 13.59 15.97 13.61 13.60 13.67 13.98
U.S. Average ........... 10.55 10.67 11.14 10.57 10.47 10.53 10.95 10.45 10.58 10.72 11.18 10.67 10.74 10.62 10.80
Industrial Sector New England .............. 13.05 11.58 11.58 11.22 13.18 11.83 11.85 12.09 14.12 12.46 12.36 12.57 11.84 12.22 12.86
Middle Atlantic ............ 8.73 7.35 7.30 7.08 7.87 7.20 7.36 7.33 7.90 7.29 7.46 7.49 7.61 7.44 7.54
E. N. Central ............... 7.23 7.06 7.26 6.99 6.87 6.77 7.06 6.99 6.96 6.90 7.21 7.09 7.14 6.92 7.04
W. N. Central .............. 6.52 6.68 7.36 6.32 6.49 6.88 7.51 6.54 6.67 7.04 7.67 6.64 6.73 6.86 7.01
S. Atlantic ................... 6.83 6.70 6.97 6.52 6.55 6.38 6.90 6.46 6.61 6.51 7.05 6.51 6.75 6.58 6.68
E. S. Central ............... 6.08 6.14 6.69 5.60 5.78 5.95 6.58 5.87 5.93 6.02 6.66 5.87 6.14 6.05 6.12
W. S. Central .............. 5.91 6.08 6.40 5.96 5.66 5.50 5.70 5.32 5.42 5.43 5.72 5.36 6.10 5.54 5.49
Mountain ..................... 6.21 6.69 7.37 6.30 6.17 6.65 7.17 6.25 6.26 6.78 7.32 6.37 6.68 6.59 6.71
Pacific ......................... 7.88 8.70 10.29 9.16 8.00 8.94 10.46 9.41 8.26 9.12 10.43 9.40 9.08 9.26 9.36
U.S. Average ........... 7.05 7.02 7.51 6.85 6.78 6.81 7.31 6.82 6.84 6.89 7.42 6.89 7.11 6.94 7.02
All Sectors (a) New England .............. 16.05 15.16 15.22 15.32 17.89 16.49 15.82 16.09 17.88 16.60 16.59 17.05 15.45 16.58 17.03
Middle Atlantic ............ 13.99 13.11 13.66 12.76 13.20 12.82 13.58 12.96 13.33 13.08 13.91 13.34 13.41 13.16 13.44
E. N. Central ............... 9.68 9.90 10.11 9.84 9.72 9.75 10.13 9.86 9.76 9.92 10.36 10.11 9.88 9.87 10.04
W. N. Central .............. 8.61 9.29 9.95 8.62 8.63 9.49 10.14 8.80 8.78 9.68 10.38 9.02 9.12 9.28 9.48
S. Atlantic ................... 10.00 10.01 10.38 9.84 9.96 9.88 10.31 9.58 9.74 9.80 10.33 9.65 10.07 9.95 9.90
E. S. Central ............... 8.99 9.17 9.42 8.71 8.90 9.05 9.40 8.98 9.14 9.28 9.70 9.25 9.08 9.09 9.36
W. S. Central .............. 8.39 8.64 9.03 8.45 8.41 8.33 8.65 7.97 8.09 8.23 8.68 8.13 8.65 8.36 8.31
Mountain ..................... 8.85 9.53 10.13 9.00 9.02 9.63 10.14 9.08 9.22 9.85 10.41 9.31 9.42 9.51 9.75
Pacific ......................... 11.35 11.90 14.29 12.43 11.85 12.27 14.48 12.44 12.04 12.50 14.49 12.54 12.55 12.82 12.94
U.S. Average ........... 10.25 10.35 10.93 10.20 10.28 10.31 10.88 10.14 10.26 10.39 11.03 10.35 10.45 10.42 10.53
Table 7c. U.S. Regional Electricity Prices (Cents per Kilowatthour)U.S. Energy Information Administration | Short-Term Energy Outlook - December 2015
2014 2015 2016 Year
Historical data: Latest data available from Energy Information Administration databases supporting the following reports: Electric Power Monthly , DOE/EIA-0226; and Electric Power Annual , DOE/EIA-0348.Minor discrepancies with published historical data are due to independent rounding. Projections: EIA Regional Short-Term Energy Model.
- = no data availablePrices are not adjusted for inflation.(a) Volume-weighted average of retail prices to residential, commercial, industrial, and transportation sectors.Notes: The approximate break between historical and forecast values is shown with historical data printed in bold; estimates and forecasts in italics.Regions refer to U.S. Census divisions. See "Census division" in EIA’s Energy Glossary (http://www.eia.doe.gov/glossary/index.html) for a list of States in each region.
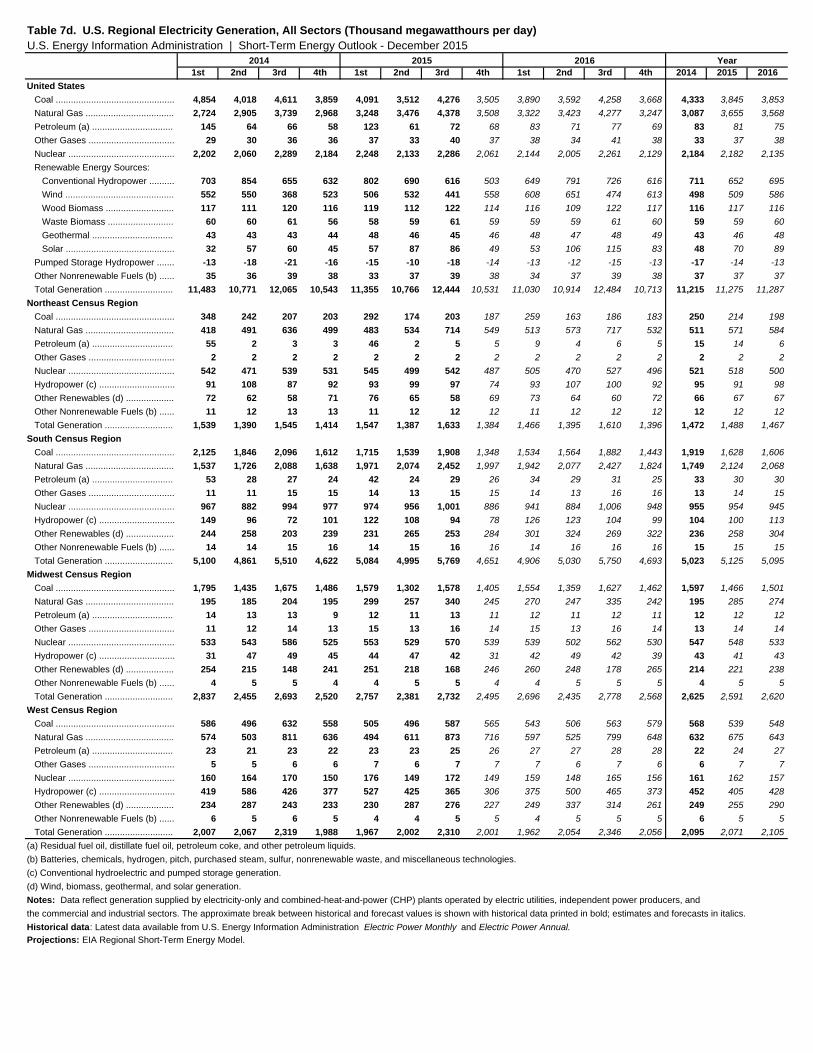
1st 2nd 3rd 4th 1st 2nd 3rd 4th 1st 2nd 3rd 4th 2014 2015 2016United States Coal ............................................... 4,854 4,018 4,611 3,859 4,091 3,512 4,276 3,505 3,890 3,592 4,258 3,668 4,333 3,845 3,853
Natural Gas ................................... 2,724 2,905 3,739 2,968 3,248 3,476 4,378 3,508 3,322 3,423 4,277 3,247 3,087 3,655 3,568
Petroleum (a) ................................ 145 64 66 58 123 61 72 68 83 71 77 69 83 81 75
Other Gases .................................. 29 30 36 36 37 33 40 37 38 34 41 38 33 37 38
Nuclear .......................................... 2,202 2,060 2,289 2,184 2,248 2,133 2,286 2,061 2,144 2,005 2,261 2,129 2,184 2,182 2,135
Renewable Energy Sources: Conventional Hydropower .......... 703 854 655 632 802 690 616 503 649 791 726 616 711 652 695
Wind ........................................... 552 550 368 523 506 532 441 558 608 651 474 613 498 509 586
Wood Biomass ........................... 117 111 120 116 119 112 122 114 116 109 122 117 116 117 116
Waste Biomass .......................... 60 60 61 56 58 59 61 59 59 59 61 60 59 59 60
Geothermal ................................ 43 43 43 44 48 46 45 46 48 47 48 49 43 46 48
Solar ........................................... 32 57 60 45 57 87 86 49 53 106 115 83 48 70 89
Pumped Storage Hydropower ....... -13 -18 -21 -16 -15 -10 -18 -14 -13 -12 -15 -13 -17 -14 -13
Other Nonrenewable Fuels (b) ...... 35 36 39 38 33 37 39 38 34 37 39 38 37 37 37
Total Generation ........................... 11,483 10,771 12,065 10,543 11,355 10,766 12,444 10,531 11,030 10,914 12,484 10,713 11,215 11,275 11,287
Northeast Census Region Coal ............................................... 348 242 207 203 292 174 203 187 259 163 186 183 250 214 198
Natural Gas ................................... 418 491 636 499 483 534 714 549 513 573 717 532 511 571 584
Petroleum (a) ................................ 55 2 3 3 46 2 5 5 9 4 6 5 15 14 6
Other Gases .................................. 2 2 2 2 2 2 2 2 2 2 2 2 2 2 2
Nuclear .......................................... 542 471 539 531 545 499 542 487 505 470 527 496 521 518 500
Hydropower (c) .............................. 91 108 87 92 93 99 97 74 93 107 100 92 95 91 98
Other Renewables (d) ................... 72 62 58 71 76 65 58 69 73 64 60 72 66 67 67
Other Nonrenewable Fuels (b) ...... 11 12 13 13 11 12 12 12 11 12 12 12 12 12 12
Total Generation ........................... 1,539 1,390 1,545 1,414 1,547 1,387 1,633 1,384 1,466 1,395 1,610 1,396 1,472 1,488 1,467
South Census Region Coal ............................................... 2,125 1,846 2,096 1,612 1,715 1,539 1,908 1,348 1,534 1,564 1,882 1,443 1,919 1,628 1,606
Natural Gas ................................... 1,537 1,726 2,088 1,638 1,971 2,074 2,452 1,997 1,942 2,077 2,427 1,824 1,749 2,124 2,068
Petroleum (a) ................................ 53 28 27 24 42 24 29 26 34 29 31 25 33 30 30
Other Gases .................................. 11 11 15 15 14 13 15 15 14 13 16 16 13 14 15
Nuclear .......................................... 967 882 994 977 974 956 1,001 886 941 884 1,006 948 955 954 945
Hydropower (c) .............................. 149 96 72 101 122 108 94 78 126 123 104 99 104 100 113
Other Renewables (d) ................... 244 258 203 239 231 265 253 284 301 324 269 322 236 258 304
Other Nonrenewable Fuels (b) ...... 14 14 15 16 14 15 16 16 14 16 16 16 15 15 15
Total Generation ........................... 5,100 4,861 5,510 4,622 5,084 4,995 5,769 4,651 4,906 5,030 5,750 4,693 5,023 5,125 5,095
Midwest Census Region Coal ............................................... 1,795 1,435 1,675 1,486 1,579 1,302 1,578 1,405 1,554 1,359 1,627 1,462 1,597 1,466 1,501
Natural Gas ................................... 195 185 204 195 299 257 340 245 270 247 335 242 195 285 274
Petroleum (a) ................................ 14 13 13 9 12 11 13 11 12 11 12 11 12 12 12
Other Gases .................................. 11 12 14 13 15 13 16 14 15 13 16 14 13 14 14
Nuclear .......................................... 533 543 586 525 553 529 570 539 539 502 562 530 547 548 533
Hydropower (c) .............................. 31 47 49 45 44 47 42 31 42 49 42 39 43 41 43
Other Renewables (d) ................... 254 215 148 241 251 218 168 246 260 248 178 265 214 221 238
Other Nonrenewable Fuels (b) ...... 4 5 5 4 4 5 5 4 4 5 5 5 4 5 5
Total Generation ........................... 2,837 2,455 2,693 2,520 2,757 2,381 2,732 2,495 2,696 2,435 2,778 2,568 2,625 2,591 2,620
West Census Region Coal ............................................... 586 496 632 558 505 496 587 565 543 506 563 579 568 539 548
Natural Gas ................................... 574 503 811 636 494 611 873 716 597 525 799 648 632 675 643
Petroleum (a) ................................ 23 21 23 22 23 23 25 26 27 27 28 28 22 24 27
Other Gases .................................. 5 5 6 6 7 6 7 7 7 6 7 6 6 7 7
Nuclear .......................................... 160 164 170 150 176 149 172 149 159 148 165 156 161 162 157
Hydropower (c) .............................. 419 586 426 377 527 425 365 306 375 500 465 373 452 405 428
Other Renewables (d) ................... 234 287 243 233 230 287 276 227 249 337 314 261 249 255 290
Other Nonrenewable Fuels (b) ...... 6 5 6 5 4 4 5 5 4 5 5 5 6 5 5
Total Generation ........................... 2,007 2,067 2,319 1,988 1,967 2,002 2,310 2,001 1,962 2,054 2,346 2,056 2,095 2,071 2,105
Table 7d. U.S. Regional Electricity Generation, All Sectors (Thousand megawatthours per day) U.S. Energy Information Administration | Short-Term Energy Outlook - December 2015
2014 2015 2016 Year
Historical data: Latest data available from U.S. Energy Information Administration Electric Power Monthly and Electric Power Annual.
Projections: EIA Regional Short-Term Energy Model.
(a) Residual fuel oil, distillate fuel oil, petroleum coke, and other petroleum liquids.(b) Batteries, chemicals, hydrogen, pitch, purchased steam, sulfur, nonrenewable waste, and miscellaneous technologies.(c) Conventional hydroelectric and pumped storage generation.(d) Wind, biomass, geothermal, and solar generation.Notes: Data reflect generation supplied by electricity-only and combined-heat-and-power (CHP) plants operated by electric utilities, independent power producers, andthe commercial and industrial sectors. The approximate break between historical and forecast values is shown with historical data printed in bold; estimates and forecasts in italics.

1st 2nd 3rd 4th 1st 2nd 3rd 4th 1st 2nd 3rd 4th 2014 2015 2016Fuel Consumption for Electricity Generation, All Sectors United States Coal (thousand st/d) ................... 2,577 2,159 2,518 2,104 2,187 1,923 2,349 1,936 2,115 1,952 2,330 2,019 2,339 2,099 2,105
Natural Gas (million cf/d) ........... 20,729 22,128 28,499 22,209 24,028 26,271 33,510 26,145 24,630 26,041 32,718 24,003 23,409 27,511 26,856
Petroleum (thousand b/d) .......... 254 113 117 105 215 108 126 122 150 127 135 124 147 143 134
Residual Fuel Oil ..................... 84 25 29 24 76 26 33 31 37 30 33 31 40 41 33
Distillate Fuel Oil ..................... 87 24 23 26 66 26 24 28 37 29 29 29 40 36 31
Petroleum Coke (a) ................. 68 61 62 51 61 52 65 58 68 63 68 59 60 59 64
Other Petroleum Liquids (b) .... 16 3 3 4 12 4 4 5 8 5 5 5 6 6 6
Northeast Census Region Coal (thousand st/d) ................... 162 115 105 98 134 82 100 87 118 74 86 84 120 101 90
Natural Gas (million cf/d) ........... 3,221 3,736 4,951 3,772 3,638 4,102 5,595 4,174 3,873 4,369 5,563 3,988 3,924 4,382 4,450
Petroleum (thousand b/d) .......... 91 4 5 5 75 5 9 9 17 8 11 8 26 24 11
South Census Region Coal (thousand st/d) ................... 1,084 960 1,113 854 888 819 1,023 731 816 833 1,008 780 1,002 865 859
Natural Gas (million cf/d) ........... 11,664 13,117 15,846 12,143 14,410 15,633 18,665 14,819 14,310 15,757 18,461 13,418 13,201 15,891 15,489
Petroleum (thousand b/d) .......... 99 51 50 45 79 45 53 51 66 55 58 48 61 57 57
Midwest Census Region Coal (thousand st/d) ................... 1,002 809 949 838 881 742 896 793 871 762 919 825 899 828 844
Natural Gas (million cf/d) ........... 1,614 1,482 1,665 1,568 2,329 2,010 2,725 1,892 2,072 1,953 2,720 1,847 1,582 2,239 2,149
Petroleum (thousand b/d) .......... 28 25 25 18 24 23 26 22 23 20 22 22 24 24 22
West Census Region Coal (thousand st/d) ................... 329 274 352 314 285 280 331 324 310 283 318 330 318 305 310
Natural Gas (million cf/d) ........... 4,229 3,793 6,038 4,725 3,650 4,526 6,526 5,260 4,375 3,963 5,973 4,750 4,701 4,999 4,768
Petroleum (thousand b/d) .......... 37 33 37 36 37 36 39 41 44 43 45 45 36 38 44
End-of-period U.S. Fuel Inventories Held by Electric Power Sector Coal (million short tons) ................ 118.3 133.5 124.5 151.8 154.9 166.9 162.5 167.0 168.0 172.5 156.8 161.3 151.8 167.0 161.3
Residual Fuel Oil (mmb) ............... 10.6 10.7 10.5 12.8 10.2 10.5 10.6 11.9 12.3 12.1 11.7 11.9 12.8 11.9 11.9
Distillate Fuel Oil (mmb) ............... 16.1 16.6 16.9 18.3 16.6 16.7 17.1 17.4 17.4 17.2 17.1 17.3 18.3 17.4 17.3
Petroleum Coke (mmb) ................. 1.7 2.0 1.9 4.1 4.1 5.2 5.5 5.4 5.3 5.2 5.1 5.0 4.1 5.4 5.0
Table 7e. U.S. Regional Fuel Consumption for Electricity Generation, All SectorsU.S. Energy Information Administration | Short-Term Energy Outlook - December 2015
2014 2015 2016 Year
Historical data: Latest data available from U.S. Energy Information Administration Electric Power Monthly and Electric Power Annual.
Projections: EIA Regional Short-Term Energy Model.
(a) Petroleum coke consumption converted from short tons to barrels by multiplying by five.(b) Other petroleum liquids include jet fuel, kerosene, and waste oil.Notes: Data reflect generation supplied by electricity-only and combined-heat-and-power (CHP) plants operated by electric utilities, independent power producers, andthe commercial and industrial sectors. Data include fuel consumed only for generation of electricity. Values do not include consumption by CHP plants for useful thermal output.The approximate break between historical and forecast values is shown with historical data printed in bold; estimates and forecasts in italics.Physical Units: st/d = short tons per day; b/d = barrels per day; cf/d = cubic feet per day; mmb = million barrels.
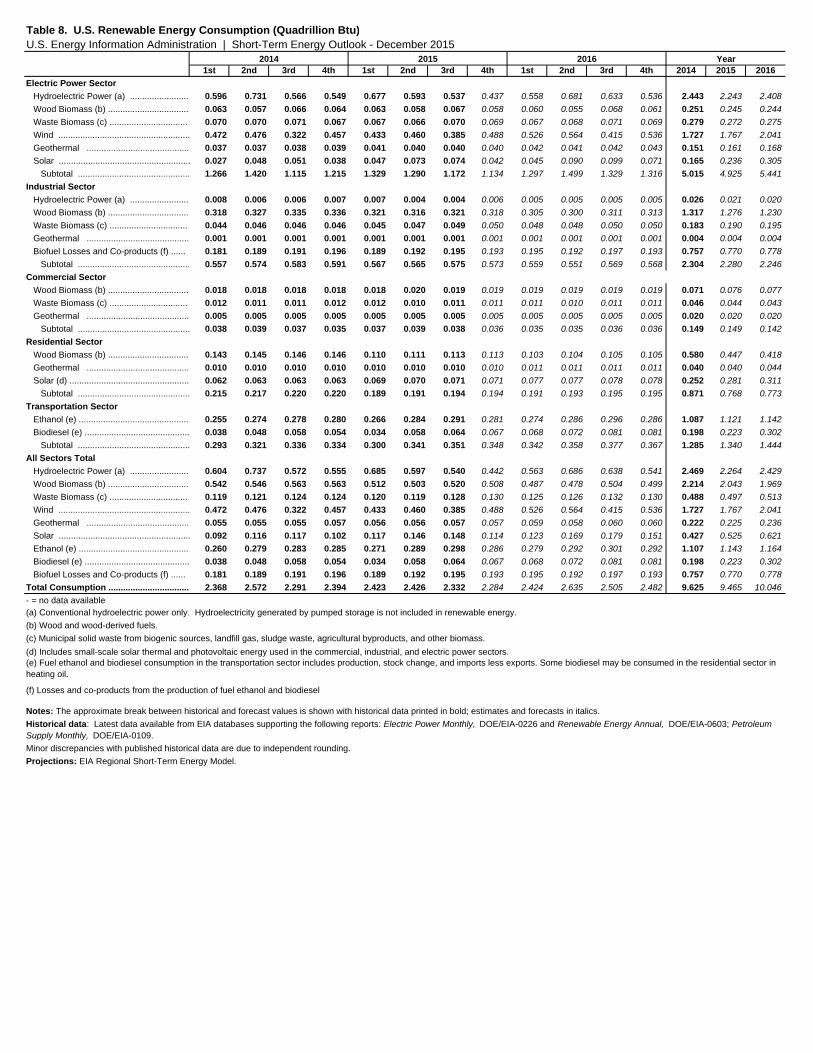
1st 2nd 3rd 4th 1st 2nd 3rd 4th 1st 2nd 3rd 4th 2014 2015 2016Electric Power Sector Hydroelectric Power (a) ........................ 0.596 0.731 0.566 0.549 0.677 0.593 0.537 0.437 0.558 0.681 0.633 0.536 2.443 2.243 2.408
Wood Biomass (b) ................................. 0.063 0.057 0.066 0.064 0.063 0.058 0.067 0.058 0.060 0.055 0.068 0.061 0.251 0.245 0.244
Waste Biomass (c) ................................ 0.070 0.070 0.071 0.067 0.067 0.066 0.070 0.069 0.067 0.068 0.071 0.069 0.279 0.272 0.275
Wind ...................................................... 0.472 0.476 0.322 0.457 0.433 0.460 0.385 0.488 0.526 0.564 0.415 0.536 1.727 1.767 2.041
Geothermal .......................................... 0.037 0.037 0.038 0.039 0.041 0.040 0.040 0.040 0.042 0.041 0.042 0.043 0.151 0.161 0.168
Solar ...................................................... 0.027 0.048 0.051 0.038 0.047 0.073 0.074 0.042 0.045 0.090 0.099 0.071 0.165 0.236 0.305
Subtotal .............................................. 1.266 1.420 1.115 1.215 1.329 1.290 1.172 1.134 1.297 1.499 1.329 1.316 5.015 4.925 5.441
Industrial Sector Hydroelectric Power (a) ........................ 0.008 0.006 0.006 0.007 0.007 0.004 0.004 0.006 0.005 0.005 0.005 0.005 0.026 0.021 0.020
Wood Biomass (b) ................................. 0.318 0.327 0.335 0.336 0.321 0.316 0.321 0.318 0.305 0.300 0.311 0.313 1.317 1.276 1.230
Waste Biomass (c) ................................ 0.044 0.046 0.046 0.046 0.045 0.047 0.049 0.050 0.048 0.048 0.050 0.050 0.183 0.190 0.195
Geothermal .......................................... 0.001 0.001 0.001 0.001 0.001 0.001 0.001 0.001 0.001 0.001 0.001 0.001 0.004 0.004 0.004
Biofuel Losses and Co-products (f) ...... 0.181 0.189 0.191 0.196 0.189 0.192 0.195 0.193 0.195 0.192 0.197 0.193 0.757 0.770 0.778
Subtotal .............................................. 0.557 0.574 0.583 0.591 0.567 0.565 0.575 0.573 0.559 0.551 0.569 0.568 2.304 2.280 2.246
Commercial Sector Wood Biomass (b) ................................. 0.018 0.018 0.018 0.018 0.018 0.020 0.019 0.019 0.019 0.019 0.019 0.019 0.071 0.076 0.077
Waste Biomass (c) ................................ 0.012 0.011 0.011 0.012 0.012 0.010 0.011 0.011 0.011 0.010 0.011 0.011 0.046 0.044 0.043
Geothermal .......................................... 0.005 0.005 0.005 0.005 0.005 0.005 0.005 0.005 0.005 0.005 0.005 0.005 0.020 0.020 0.020
Subtotal .............................................. 0.038 0.039 0.037 0.035 0.037 0.039 0.038 0.036 0.035 0.035 0.036 0.036 0.149 0.149 0.142
Residential Sector Wood Biomass (b) ................................. 0.143 0.145 0.146 0.146 0.110 0.111 0.113 0.113 0.103 0.104 0.105 0.105 0.580 0.447 0.418
Geothermal .......................................... 0.010 0.010 0.010 0.010 0.010 0.010 0.010 0.010 0.011 0.011 0.011 0.011 0.040 0.040 0.044
Solar (d) ................................................. 0.062 0.063 0.063 0.063 0.069 0.070 0.071 0.071 0.077 0.077 0.078 0.078 0.252 0.281 0.311
Subtotal .............................................. 0.215 0.217 0.220 0.220 0.189 0.191 0.194 0.194 0.191 0.193 0.195 0.195 0.871 0.768 0.773
Transportation Sector Ethanol (e) ............................................. 0.255 0.274 0.278 0.280 0.266 0.284 0.291 0.281 0.274 0.286 0.296 0.286 1.087 1.121 1.142
Biodiesel (e) ........................................... 0.038 0.048 0.058 0.054 0.034 0.058 0.064 0.067 0.068 0.072 0.081 0.081 0.198 0.223 0.302
Subtotal .............................................. 0.293 0.321 0.336 0.334 0.300 0.341 0.351 0.348 0.342 0.358 0.377 0.367 1.285 1.340 1.444
All Sectors Total Hydroelectric Power (a) ........................ 0.604 0.737 0.572 0.555 0.685 0.597 0.540 0.442 0.563 0.686 0.638 0.541 2.469 2.264 2.429
Wood Biomass (b) ................................. 0.542 0.546 0.563 0.563 0.512 0.503 0.520 0.508 0.487 0.478 0.504 0.499 2.214 2.043 1.969
Waste Biomass (c) ................................ 0.119 0.121 0.124 0.124 0.120 0.119 0.128 0.130 0.125 0.126 0.132 0.130 0.488 0.497 0.513
Wind ...................................................... 0.472 0.476 0.322 0.457 0.433 0.460 0.385 0.488 0.526 0.564 0.415 0.536 1.727 1.767 2.041
Geothermal .......................................... 0.055 0.055 0.055 0.057 0.056 0.056 0.057 0.057 0.059 0.058 0.060 0.060 0.222 0.225 0.236
Solar ...................................................... 0.092 0.116 0.117 0.102 0.117 0.146 0.148 0.114 0.123 0.169 0.179 0.151 0.427 0.525 0.621
Ethanol (e) ............................................. 0.260 0.279 0.283 0.285 0.271 0.289 0.298 0.286 0.279 0.292 0.301 0.292 1.107 1.143 1.164
Biodiesel (e) ........................................... 0.038 0.048 0.058 0.054 0.034 0.058 0.064 0.067 0.068 0.072 0.081 0.081 0.198 0.223 0.302
Biofuel Losses and Co-products (f) ...... 0.181 0.189 0.191 0.196 0.189 0.192 0.195 0.193 0.195 0.192 0.197 0.193 0.757 0.770 0.778
Total Consumption ................................. 2.368 2.572 2.291 2.394 2.423 2.426 2.332 2.284 2.424 2.635 2.505 2.482 9.625 9.465 10.046
(e) Fuel ethanol and biodiesel consumption in the transportation sector includes production, stock change, and imports less exports. Some biodiesel may be consumed in the residential sector in heating oil.
Table 8. U.S. Renewable Energy Consumption (Quadrillion Btu)U.S. Energy Information Administration | Short-Term Energy Outlook - December 2015
2014 2015 2016 Year
- = no data available(a) Conventional hydroelectric power only. Hydroelectricity generated by pumped storage is not included in renewable energy.(b) Wood and wood-derived fuels.(c) Municipal solid waste from biogenic sources, landfill gas, sludge waste, agricultural byproducts, and other biomass.(d) Includes small-scale solar thermal and photovoltaic energy used in the commercial, industrial, and electric power sectors.
(f) Losses and co-products from the production of fuel ethanol and biodiesel
Notes: The approximate break between historical and forecast values is shown with historical data printed in bold; estimates and forecasts in italics.Historical data: Latest data available from EIA databases supporting the following reports: Electric Power Monthly, DOE/EIA-0226 and Renewable Energy Annual, DOE/EIA-0603; Petroleum Supply Monthly, DOE/EIA-0109. Minor discrepancies with published historical data are due to independent rounding. Projections: EIA Regional Short-Term Energy Model.
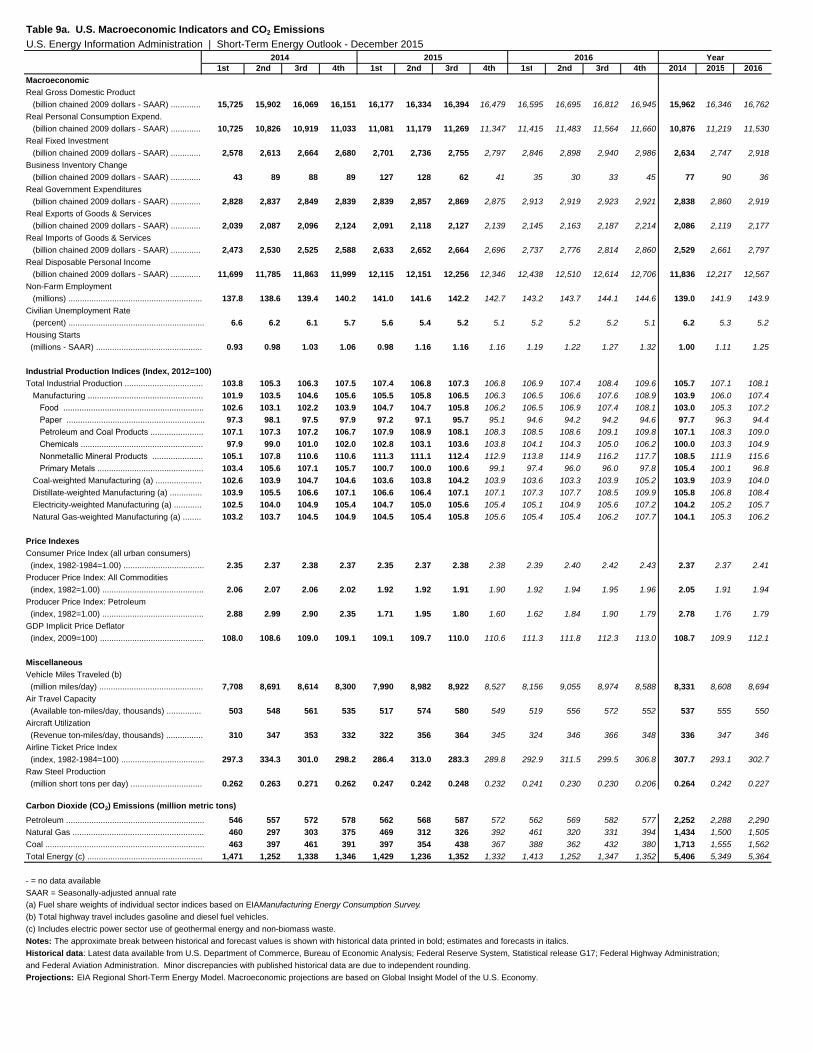
1st 2nd 3rd 4th 1st 2nd 3rd 4th 1st 2nd 3rd 4th 2014 2015 2016MacroeconomicReal Gross Domestic Product (billion chained 2009 dollars - SAAR) ............. 15,725 15,902 16,069 16,151 16,177 16,334 16,394 16,479 16,595 16,695 16,812 16,945 15,962 16,346 16,762
Real Personal Consumption Expend. (billion chained 2009 dollars - SAAR) ............. 10,725 10,826 10,919 11,033 11,081 11,179 11,269 11,347 11,415 11,483 11,564 11,660 10,876 11,219 11,530
Real Fixed Investment (billion chained 2009 dollars - SAAR) ............. 2,578 2,613 2,664 2,680 2,701 2,736 2,755 2,797 2,846 2,898 2,940 2,986 2,634 2,747 2,918
Business Inventory Change (billion chained 2009 dollars - SAAR) ............. 43 89 88 89 127 128 62 41 35 30 33 45 77 90 36
Real Government Expenditures (billion chained 2009 dollars - SAAR) ............. 2,828 2,837 2,849 2,839 2,839 2,857 2,869 2,875 2,913 2,919 2,923 2,921 2,838 2,860 2,919
Real Exports of Goods & Services (billion chained 2009 dollars - SAAR) ............. 2,039 2,087 2,096 2,124 2,091 2,118 2,127 2,139 2,145 2,163 2,187 2,214 2,086 2,119 2,177
Real Imports of Goods & Services (billion chained 2009 dollars - SAAR) ............. 2,473 2,530 2,525 2,588 2,633 2,652 2,664 2,696 2,737 2,776 2,814 2,860 2,529 2,661 2,797
Real Disposable Personal Income (billion chained 2009 dollars - SAAR) ............. 11,699 11,785 11,863 11,999 12,115 12,151 12,256 12,346 12,438 12,510 12,614 12,706 11,836 12,217 12,567
Non-Farm Employment (millions) .......................................................... 137.8 138.6 139.4 140.2 141.0 141.6 142.2 142.7 143.2 143.7 144.1 144.6 139.0 141.9 143.9
Civilian Unemployment Rate (percent) ........................................................... 6.6 6.2 6.1 5.7 5.6 5.4 5.2 5.1 5.2 5.2 5.2 5.1 6.2 5.3 5.2
Housing Starts (millions - SAAR) .............................................. 0.93 0.98 1.03 1.06 0.98 1.16 1.16 1.16 1.19 1.22 1.27 1.32 1.00 1.11 1.25
Industrial Production Indices (Index, 2012=100)Total Industrial Production .................................. 103.8 105.3 106.3 107.5 107.4 106.8 107.3 106.8 106.9 107.4 108.4 109.6 105.7 107.1 108.1
Manufacturing .................................................. 101.9 103.5 104.6 105.6 105.5 105.8 106.5 106.3 106.5 106.6 107.6 108.9 103.9 106.0 107.4
Food ............................................................. 102.6 103.1 102.2 103.9 104.7 104.7 105.8 106.2 106.5 106.9 107.4 108.1 103.0 105.3 107.2
Paper ............................................................ 97.3 98.1 97.5 97.9 97.2 97.1 95.7 95.1 94.6 94.2 94.2 94.6 97.7 96.3 94.4
Petroleum and Coal Products ....................... 107.1 107.3 107.2 106.7 107.9 108.9 108.1 108.3 108.5 108.6 109.1 109.8 107.1 108.3 109.0
Chemicals ..................................................... 97.9 99.0 101.0 102.0 102.8 103.1 103.6 103.8 104.1 104.3 105.0 106.2 100.0 103.3 104.9
Nonmetallic Mineral Products ...................... 105.1 107.8 110.6 110.6 111.3 111.1 112.4 112.9 113.8 114.9 116.2 117.7 108.5 111.9 115.6
Primary Metals .............................................. 103.4 105.6 107.1 105.7 100.7 100.0 100.6 99.1 97.4 96.0 96.0 97.8 105.4 100.1 96.8
Coal-weighted Manufacturing (a) .................... 102.6 103.9 104.7 104.6 103.6 103.8 104.2 103.9 103.6 103.3 103.9 105.2 103.9 103.9 104.0
Distillate-weighted Manufacturing (a) .............. 103.9 105.5 106.6 107.1 106.6 106.4 107.1 107.1 107.3 107.7 108.5 109.9 105.8 106.8 108.4
Electricity-weighted Manufacturing (a) ............ 102.5 104.0 104.9 105.4 104.7 105.0 105.6 105.4 105.1 104.9 105.6 107.2 104.2 105.2 105.7
Natural Gas-weighted Manufacturing (a) ........ 103.2 103.7 104.5 104.9 104.5 105.4 105.8 105.6 105.4 105.4 106.2 107.7 104.1 105.3 106.2
Price IndexesConsumer Price Index (all urban consumers) (index, 1982-1984=1.00) ................................... 2.35 2.37 2.38 2.37 2.35 2.37 2.38 2.38 2.39 2.40 2.42 2.43 2.37 2.37 2.41
Producer Price Index: All Commodities (index, 1982=1.00) ............................................ 2.06 2.07 2.06 2.02 1.92 1.92 1.91 1.90 1.92 1.94 1.95 1.96 2.05 1.91 1.94
Producer Price Index: Petroleum (index, 1982=1.00) ............................................ 2.88 2.99 2.90 2.35 1.71 1.95 1.80 1.60 1.62 1.84 1.90 1.79 2.78 1.76 1.79
GDP Implicit Price Deflator (index, 2009=100) ............................................. 108.0 108.6 109.0 109.1 109.1 109.7 110.0 110.6 111.3 111.8 112.3 113.0 108.7 109.9 112.1
MiscellaneousVehicle Miles Traveled (b) (million miles/day) ............................................. 7,708 8,691 8,614 8,300 7,990 8,982 8,922 8,527 8,156 9,055 8,974 8,588 8,331 8,608 8,694
Air Travel Capacity (Available ton-miles/day, thousands) ............... 503 548 561 535 517 574 580 549 519 556 572 552 537 555 550
Aircraft Utilization (Revenue ton-miles/day, thousands) ................ 310 347 353 332 322 356 364 345 324 346 366 348 336 347 346
Airline Ticket Price Index (index, 1982-1984=100) .................................... 297.3 334.3 301.0 298.2 286.4 313.0 283.3 289.8 292.9 311.5 299.5 306.8 307.7 293.1 302.7
Raw Steel Production (million short tons per day) ............................... 0.262 0.263 0.271 0.262 0.247 0.242 0.248 0.232 0.241 0.230 0.230 0.206 0.264 0.242 0.227
Carbon Dioxide (CO2) Emissions (million metric tons)Petroleum ............................................................ 546 557 572 578 562 568 587 572 562 569 582 577 2,252 2,288 2,290
Natural Gas ......................................................... 460 297 303 375 469 312 326 392 461 320 331 394 1,434 1,500 1,505
Coal ..................................................................... 463 397 461 391 397 354 438 367 388 362 432 380 1,713 1,555 1,562
Total Energy (c) .................................................. 1,471 1,252 1,338 1,346 1,429 1,236 1,352 1,332 1,413 1,252 1,347 1,352 5,406 5,349 5,364
SAAR = Seasonally-adjusted annual rate
Table 9a. U.S. Macroeconomic Indicators and CO2 EmissionsU.S. Energy Information Administration | Short-Term Energy Outlook - December 2015
2014 2015 2016 Year
and Federal Aviation Administration. Minor discrepancies with published historical data are due to independent rounding. Projections: EIA Regional Short-Term Energy Model. Macroeconomic projections are based on Global Insight Model of the U.S. Economy.
- = no data available
(a) Fuel share weights of individual sector indices based on EIA Manufacturing Energy Consumption Survey.(b) Total highway travel includes gasoline and diesel fuel vehicles.(c) Includes electric power sector use of geothermal energy and non-biomass waste.Notes: The approximate break between historical and forecast values is shown with historical data printed in bold; estimates and forecasts in italics.Historical data: Latest data available from U.S. Department of Commerce, Bureau of Economic Analysis; Federal Reserve System, Statistical release G17; Federal Highway Administration;
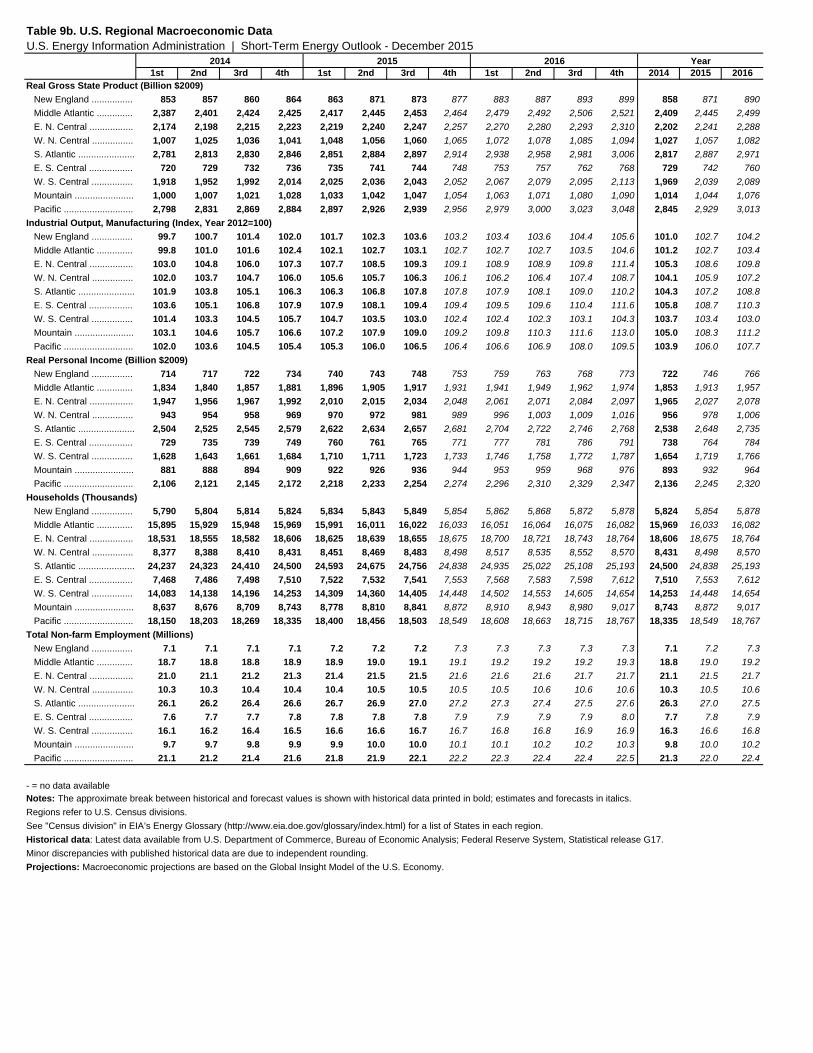
1st 2nd 3rd 4th 1st 2nd 3rd 4th 1st 2nd 3rd 4th 2014 2015 2016Real Gross State Product (Billion $2009) New England ................ 853 857 860 864 863 871 873 877 883 887 893 899 858 871 890
Middle Atlantic .............. 2,387 2,401 2,424 2,425 2,417 2,445 2,453 2,464 2,479 2,492 2,506 2,521 2,409 2,445 2,499
E. N. Central ................. 2,174 2,198 2,215 2,223 2,219 2,240 2,247 2,257 2,270 2,280 2,293 2,310 2,202 2,241 2,288
W. N. Central ................ 1,007 1,025 1,036 1,041 1,048 1,056 1,060 1,065 1,072 1,078 1,085 1,094 1,027 1,057 1,082
S. Atlantic ...................... 2,781 2,813 2,830 2,846 2,851 2,884 2,897 2,914 2,938 2,958 2,981 3,006 2,817 2,887 2,971
E. S. Central ................. 720 729 732 736 735 741 744 748 753 757 762 768 729 742 760
W. S. Central ................ 1,918 1,952 1,992 2,014 2,025 2,036 2,043 2,052 2,067 2,079 2,095 2,113 1,969 2,039 2,089
Mountain ....................... 1,000 1,007 1,021 1,028 1,033 1,042 1,047 1,054 1,063 1,071 1,080 1,090 1,014 1,044 1,076
Pacific ........................... 2,798 2,831 2,869 2,884 2,897 2,926 2,939 2,956 2,979 3,000 3,023 3,048 2,845 2,929 3,013
Industrial Output, Manufacturing (Index, Year 2012=100) New England ................ 99.7 100.7 101.4 102.0 101.7 102.3 103.6 103.2 103.4 103.6 104.4 105.6 101.0 102.7 104.2
Middle Atlantic .............. 99.8 101.0 101.6 102.4 102.1 102.7 103.1 102.7 102.7 102.7 103.5 104.6 101.2 102.7 103.4
E. N. Central ................. 103.0 104.8 106.0 107.3 107.7 108.5 109.3 109.1 108.9 108.9 109.8 111.4 105.3 108.6 109.8
W. N. Central ................ 102.0 103.7 104.7 106.0 105.6 105.7 106.3 106.1 106.2 106.4 107.4 108.7 104.1 105.9 107.2
S. Atlantic ...................... 101.9 103.8 105.1 106.3 106.3 106.8 107.8 107.8 107.9 108.1 109.0 110.2 104.3 107.2 108.8
E. S. Central ................. 103.6 105.1 106.8 107.9 107.9 108.1 109.4 109.4 109.5 109.6 110.4 111.6 105.8 108.7 110.3
W. S. Central ................ 101.4 103.3 104.5 105.7 104.7 103.5 103.0 102.4 102.4 102.3 103.1 104.3 103.7 103.4 103.0
Mountain ....................... 103.1 104.6 105.7 106.6 107.2 107.9 109.0 109.2 109.8 110.3 111.6 113.0 105.0 108.3 111.2
Pacific ........................... 102.0 103.6 104.5 105.4 105.3 106.0 106.5 106.4 106.6 106.9 108.0 109.5 103.9 106.0 107.7
Real Personal Income (Billion $2009) New England ................ 714 717 722 734 740 743 748 753 759 763 768 773 722 746 766
Middle Atlantic .............. 1,834 1,840 1,857 1,881 1,896 1,905 1,917 1,931 1,941 1,949 1,962 1,974 1,853 1,913 1,957
E. N. Central ................. 1,947 1,956 1,967 1,992 2,010 2,015 2,034 2,048 2,061 2,071 2,084 2,097 1,965 2,027 2,078
W. N. Central ................ 943 954 958 969 970 972 981 989 996 1,003 1,009 1,016 956 978 1,006
S. Atlantic ...................... 2,504 2,525 2,545 2,579 2,622 2,634 2,657 2,681 2,704 2,722 2,746 2,768 2,538 2,648 2,735
E. S. Central ................. 729 735 739 749 760 761 765 771 777 781 786 791 738 764 784
W. S. Central ................ 1,628 1,643 1,661 1,684 1,710 1,711 1,723 1,733 1,746 1,758 1,772 1,787 1,654 1,719 1,766
Mountain ....................... 881 888 894 909 922 926 936 944 953 959 968 976 893 932 964
Pacific ........................... 2,106 2,121 2,145 2,172 2,218 2,233 2,254 2,274 2,296 2,310 2,329 2,347 2,136 2,245 2,320
Households (Thousands) New England ................ 5,790 5,804 5,814 5,824 5,834 5,843 5,849 5,854 5,862 5,868 5,872 5,878 5,824 5,854 5,878
Middle Atlantic .............. 15,895 15,929 15,948 15,969 15,991 16,011 16,022 16,033 16,051 16,064 16,075 16,082 15,969 16,033 16,082
E. N. Central ................. 18,531 18,555 18,582 18,606 18,625 18,639 18,655 18,675 18,700 18,721 18,743 18,764 18,606 18,675 18,764
W. N. Central ................ 8,377 8,388 8,410 8,431 8,451 8,469 8,483 8,498 8,517 8,535 8,552 8,570 8,431 8,498 8,570
S. Atlantic ...................... 24,237 24,323 24,410 24,500 24,593 24,675 24,756 24,838 24,935 25,022 25,108 25,193 24,500 24,838 25,193
E. S. Central ................. 7,468 7,486 7,498 7,510 7,522 7,532 7,541 7,553 7,568 7,583 7,598 7,612 7,510 7,553 7,612
W. S. Central ................ 14,083 14,138 14,196 14,253 14,309 14,360 14,405 14,448 14,502 14,553 14,605 14,654 14,253 14,448 14,654
Mountain ....................... 8,637 8,676 8,709 8,743 8,778 8,810 8,841 8,872 8,910 8,943 8,980 9,017 8,743 8,872 9,017
Pacific ........................... 18,150 18,203 18,269 18,335 18,400 18,456 18,503 18,549 18,608 18,663 18,715 18,767 18,335 18,549 18,767
Total Non-farm Employment (Millions) New England ................ 7.1 7.1 7.1 7.1 7.2 7.2 7.2 7.3 7.3 7.3 7.3 7.3 7.1 7.2 7.3
Middle Atlantic .............. 18.7 18.8 18.8 18.9 18.9 19.0 19.1 19.1 19.2 19.2 19.2 19.3 18.8 19.0 19.2
E. N. Central ................. 21.0 21.1 21.2 21.3 21.4 21.5 21.5 21.6 21.6 21.6 21.7 21.7 21.1 21.5 21.7
W. N. Central ................ 10.3 10.3 10.4 10.4 10.4 10.5 10.5 10.5 10.5 10.6 10.6 10.6 10.3 10.5 10.6
S. Atlantic ...................... 26.1 26.2 26.4 26.6 26.7 26.9 27.0 27.2 27.3 27.4 27.5 27.6 26.3 27.0 27.5
E. S. Central ................. 7.6 7.7 7.7 7.8 7.8 7.8 7.8 7.9 7.9 7.9 7.9 8.0 7.7 7.8 7.9
W. S. Central ................ 16.1 16.2 16.4 16.5 16.6 16.6 16.7 16.7 16.8 16.8 16.9 16.9 16.3 16.6 16.8
Mountain ....................... 9.7 9.7 9.8 9.9 9.9 10.0 10.0 10.1 10.1 10.2 10.2 10.3 9.8 10.0 10.2
Pacific ........................... 21.1 21.2 21.4 21.6 21.8 21.9 22.1 22.2 22.3 22.4 22.4 22.5 21.3 22.0 22.4
Table 9b. U.S. Regional Macroeconomic DataU.S. Energy Information Administration | Short-Term Energy Outlook - December 2015
2014 2015 2016 Year
Projections: Macroeconomic projections are based on the Global Insight Model of the U.S. Economy.
- = no data availableNotes: The approximate break between historical and forecast values is shown with historical data printed in bold; estimates and forecasts in italics.Regions refer to U.S. Census divisions. See "Census division" in EIA’s Energy Glossary (http://www.eia.doe.gov/glossary/index.html) for a list of States in each region.Historical data: Latest data available from U.S. Department of Commerce, Bureau of Economic Analysis; Federal Reserve System, Statistical release G17.Minor discrepancies with published historical data are due to independent rounding.

1st 2nd 3rd 4th 1st 2nd 3rd 4th 1st 2nd 3rd 4th 2014 2015 2016Heating Degree Days New England ................. 3,562 882 146 2,081 3,853 822 58 2,087 3,123 834 135 2,218 6,672 6,820 6,309
Middle Atlantic ............... 3,437 704 100 1,966 3,582 613 41 1,848 2,842 655 91 2,016 6,206 6,084 5,603
E. N. Central .................. 3,937 729 168 2,366 3,696 661 76 2,021 3,033 717 129 2,259 7,199 6,454 6,138
W. N. Central ................. 3,863 755 177 2,512 3,375 652 95 2,189 3,144 679 153 2,434 7,306 6,310 6,410
South Atlantic ................ 1,714 196 14 1,039 1,676 156 9 925 1,461 211 17 1,002 2,962 2,766 2,691
E. S. Central .................. 2,267 229 17 1,411 2,146 185 14 1,211 1,861 265 22 1,331 3,924 3,556 3,479
W. S. Central ................. 1,479 93 4 848 1,400 69 2 775 1,262 96 5 783 2,424 2,246 2,145
Mountain ........................ 2,121 709 149 1,758 1,895 703 122 1,793 2,187 659 130 1,805 4,736 4,513 4,780
Pacific ............................ 1,253 468 57 986 1,078 524 77 1,045 1,269 464 75 1,107 2,764 2,723 2,916
U.S. Average ............. 2,450 480 80 1,541 2,342 443 50 1,421 2,074 464 74 1,532 4,551 4,256 4,144
Heating Degree Days, Prior 10-year Average New England ................. 3,152 836 134 2,167 3,166 838 134 2,147 3,212 824 133 2,134 6,289 6,285 6,303
Middle Atlantic ............... 2,905 660 88 1,983 2,935 666 90 1,976 2,983 651 90 1,957 5,636 5,667 5,681
E. N. Central .................. 3,117 690 120 2,243 3,192 694 123 2,262 3,247 690 125 2,233 6,170 6,272 6,295
W. N. Central ................. 3,209 686 149 2,404 3,273 691 150 2,433 3,298 693 150 2,415 6,449 6,546 6,556
South Atlantic ................ 1,465 194 14 1,006 1,481 196 14 1,013 1,502 185 14 1,001 2,679 2,704 2,703
E. S. Central .................. 1,810 236 19 1,336 1,853 236 19 1,358 1,898 225 19 1,340 3,402 3,465 3,483
W. S. Central ................. 1,157 85 5 827 1,188 86 5 834 1,221 83 5 830 2,075 2,113 2,139
Mountain ........................ 2,267 728 156 1,887 2,258 730 150 1,872 2,230 724 147 1,872 5,038 5,011 4,972
Pacific ............................ 1,554 625 96 1,236 1,533 621 92 1,205 1,493 609 88 1,196 3,511 3,452 3,387
U.S. Average ............. 2,161 492 77 1,569 2,182 493 77 1,567 2,199 483 76 1,551 4,298 4,319 4,310
Cooling Degree Days New England ................. 0 76 342 0 0 70 486 0 0 92 416 0 419 556 509
Middle Atlantic ............... 0 157 434 5 0 184 610 1 0 171 557 5 596 795 733
E. N. Central .................. 0 230 377 2 0 220 497 7 0 217 542 8 609 724 767
W. N. Central ................. 0 262 538 12 3 266 660 13 3 273 684 11 812 943 971
South Atlantic ................ 107 642 1,058 194 136 760 1,154 269 113 619 1,140 228 2,001 2,319 2,101
E. S. Central .................. 6 505 924 65 23 579 1,018 77 27 495 1,039 67 1,501 1,697 1,627
W. S. Central ................. 34 779 1,441 219 50 856 1,570 257 70 824 1,489 209 2,473 2,733 2,592
Mountain ........................ 31 439 871 95 47 437 926 88 19 446 989 89 1,436 1,497 1,543
Pacific ............................ 41 225 692 111 54 227 676 115 31 205 599 75 1,068 1,072 911
U.S. Average ............. 34 393 775 95 46 433 873 116 39 394 852 96 1,298 1,468 1,381
Cooling Degree Days, Prior 10-year Average New England ................. 0 83 417 1 0 85 420 1 0 81 419 1 500 505 501
Middle Atlantic ............... 0 167 558 5 0 168 557 5 0 168 548 5 730 731 721
E. N. Central .................. 3 230 546 6 3 234 545 6 3 229 528 6 785 787 765
W. N. Central ................. 7 277 678 9 7 282 683 9 7 279 674 9 972 981 969
South Atlantic ................ 110 636 1,154 213 110 635 1,154 210 113 659 1,143 215 2,112 2,108 2,130
E. S. Central .................. 35 528 1,045 57 33 526 1,053 52 32 541 1,038 54 1,666 1,664 1,666
W. S. Central ................. 102 882 1,506 190 94 883 1,519 184 90 890 1,518 190 2,680 2,679 2,688
Mountain ........................ 18 420 922 70 17 424 930 75 21 430 931 76 1,431 1,446 1,458
Pacific ............................ 26 166 589 58 26 170 601 65 29 180 612 71 839 863 892
U.S. Average ............. 41 393 843 83 40 396 849 83 42 404 845 87 1,361 1,369 1,377
Table 9c. U.S. Regional Weather DataU.S. Energy Information Administration | Short-Term Energy Outlook - December 2015
2014 2015 2016 Year
Historical data: Latest data available from U.S. Department of Commerce, National Oceanic and Atmospheric Association (NOAA).Projections: Based on forecasts by the NOAA Climate Prediction Center (http://www.cpc.ncep.noaa.gov/pacdir/DDdir/NHOME3.shtml).
- = no data availableNotes: Regional degree days for each period are calculated by EIA as contemporaneous period population-weighted averages ofstate degree day data published by the National Oceanic and Atmospheric Administration (NOAA).See Change in Regional and U.S. Degree-Day Calculations (http://www.eia.gov/forecasts/steo/special/pdf/2012_sp_04.pdf) for more information.The approximate break between historical and forecast values is shown with historical data printed in bold; estimates and forecasts in italics.Regions refer to U.S. Census divisions. See "Census division" in EIA’s Energy Glossary (http://www.eia.gov/tools/glossary/) for a list of states in each region.