EIA REPORT FOR PROPOSED CAPACITY …environmentclearance.nic.in/writereaddata/online/...EIA REPORT...
31
EIA REPORT FOR PROPOSED CAPACITY EXPANSION OF PIYALA POL TERMINAL AT PIYALA, NEAR FARIDABAD, HARYANA SECTION-3 3-13 BPCL DEVELOPMENT CONSULTANTS 3.2.4 Air Environment (Meteorology and Air Quality) The permanent meteorological station, closest to the proposed site, is at Gurgaon. Thirty years (1971-2000) climatological data for Gurgaon observatory, as published by India Meteorological Department is furnished as EXHIBIT 3.1(A). Summary of the salient meteorological conditions observed from the table are presented as follows: Predominant wind direction (Wind from) : Annual overall : North West Summer : North West Post Monsoon : North West Winter : North West Mean wind speed : : 4.1 kmph. Temperature : Maximum (average) : 44.9 o C Maximum (recorded) : 49.0 o C Minimum (average) : 1.9 o C Minimum (recorded) : -0.4 o C Rainfall : Rainy Season (June to September) Annual Rainfall (avg.) : 712.0 mm Highest Rainfall in a month : 617.4 mm Highest Rainfall in 24 hours : 282.2 mm Monthly Relative Humidity : Maximum : 81 percent Minimum : 26 percent It is seen from the climatological table that the area experiences moderately hot and humid summer, very cold and dry winter, reasonable rainfall. Wind speed is moderate throughout the year.
Transcript of EIA REPORT FOR PROPOSED CAPACITY …environmentclearance.nic.in/writereaddata/online/...EIA REPORT...
EIA REPORT FOR PROPOSED CAPACITY EXPANSION OF PIYALA POL TERMINAL AT PIYALA, NEAR FARIDABAD, HARYANA
SECTION-3 3-13 BPCL
DEVELOPMENT CONSULTANTS
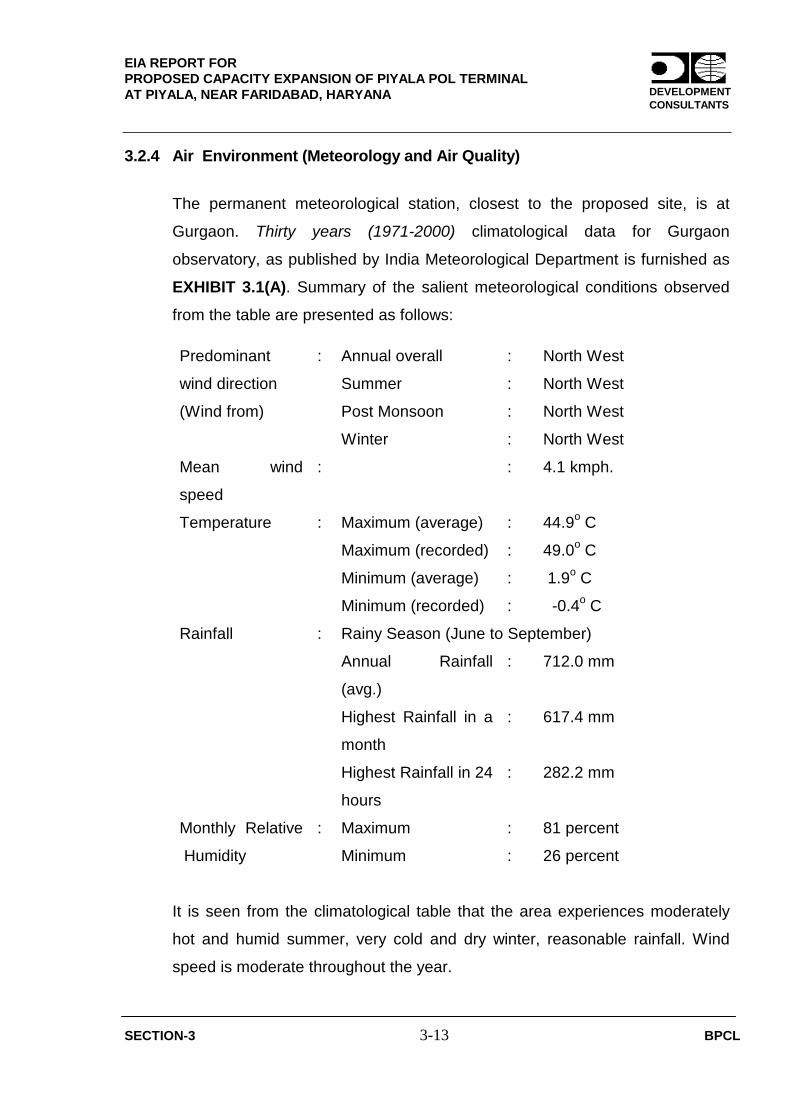
3.2.4 Air Environment (Meteorology and Air Quality)
The permanent meteorological station, closest to the proposed site, is at
Gurgaon. Thirty years (1971-2000) climatological data for Gurgaon
observatory, as published by India Meteorological Department is furnished as
EXHIBIT 3.1(A). Summary of the salient meteorological conditions observed
from the table are presented as follows: Predominant
wind direction
(Wind from)
: Annual overall : North West
Summer : North West
Post Monsoon : North West
Winter : North West
Mean wind
speed
: : 4.1 kmph.
Temperature : Maximum (average) : 44.9o C
Maximum (recorded) : 49.0o C
Minimum (average) : 1.9o C
Minimum (recorded) : -0.4o C
Rainfall : Rainy Season (June to September)
Annual Rainfall
(avg.)
: 712.0 mm
Highest Rainfall in a
month
: 617.4 mm
Highest Rainfall in 24
hours
: 282.2 mm
Monthly Relative
Humidity
: Maximum : 81 percent
Minimum : 26 percent
It is seen from the climatological table that the area experiences moderately
hot and humid summer, very cold and dry winter, reasonable rainfall. Wind
speed is moderate throughout the year.
EIA REPORT FOR PROPOSED CAPACITY EXPANSION OF PIYALA POL TERMINAL AT PIYALA, NEAR FARIDABAD, HARYANA
SECTION-3 3-14 BPCL
DEVELOPMENT CONSULTANTS
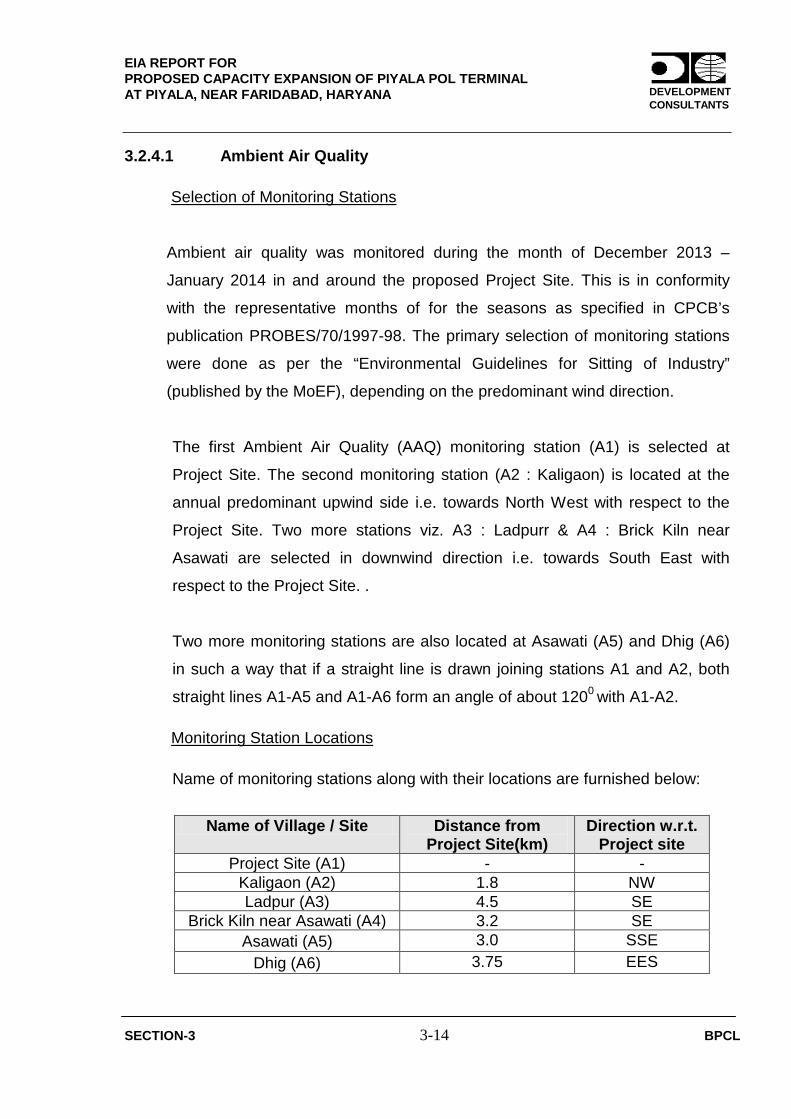
3.2.4.1 Ambient Air Quality
Selection of Monitoring Stations
Ambient air quality was monitored during the month of December 2013 –
January 2014 in and around the proposed Project Site. This is in conformity
with the representative months of for the seasons as specified in CPCB’s
publication PROBES/70/1997-98. The primary selection of monitoring stations
were done as per the “Environmental Guidelines for Sitting of Industry”
(published by the MoEF), depending on the predominant wind direction.
The first Ambient Air Quality (AAQ) monitoring station (A1) is selected at
Project Site. The second monitoring station (A2 : Kaligaon) is located at the
annual predominant upwind side i.e. towards North West with respect to the
Project Site. Two more stations viz. A3 : Ladpurr & A4 : Brick Kiln near
Asawati are selected in downwind direction i.e. towards South East with
respect to the Project Site. .
Two more monitoring stations are also located at Asawati (A5) and Dhig (A6)
in such a way that if a straight line is drawn joining stations A1 and A2, both
straight lines A1-A5 and A1-A6 form an angle of about 1200 with A1-A2.
Monitoring Station Locations
Name of monitoring stations along with their locations are furnished below:
Name of Village / Site Distance from
Project Site(km) Direction w.r.t.
Project site Project Site (A1) - -
Kaligaon (A2) 1.8 NW Ladpur (A3) 4.5 SE
Brick Kiln near Asawati (A4) 3.2 SE Asawati (A5) 3.0 SSE
Dhig (A6) 3.75 EES

EIA REPORT FOR PROPOSED CAPACITY EXPANSION OF PIYALA POL TERMINAL AT PIYALA, NEAR FARIDABAD, HARYANA
SECTION-3 3-15 BPCL
DEVELOPMENT CONSULTANTS
Location of AAQ monitoring stations is furnished as Fig. 3.1.
Micro-meteorological data, which comprise wind speed, wind direction, air
temperature, relative humidity, cloud cover and rainfall, are furnished as
Exhibit – 3.1(B).
The windrose diagram based on micrometeorological data collected at site is
given in Fig. 3.2. It is evident from the diagram that the predominant wind
direction during the period of ambient air quality as well as micro-meteorology
monitoring was from North. This is generally in conformity with the wind rose
pattern of Gurgaon observatory.
Parameters Monitored during Ambient Air Monitoring
The following parameters have been monitored during ambient air quality
monitoring, which is in accordance with the requirement prescribed by the
State Expert Appraisal Committee (SEAC), Haryana :
Respirable Particulate Matter (Size less than 10 µm) or PM10
Respirable Particulate Matter (Size less than 2.5 µm) or PM2.5
Sulphur Dioxide (SO2)
Nitrogen dioxide (NO2)
Hydrocarbon as methane
Non-methane hydrocarbon
VOC
Methods of Measurement
Air samplings are done by deploying Respirable Dust Samplers. Analytical
methods for measurement of concentrations of SO2, NOx, and PM10 have been

EIA REPORT FOR PROPOSED CAPACITY EXPANSION OF PIYALA POL TERMINAL AT PIYALA, NEAR FARIDABAD, HARYANA
SECTION-3 3-16 BPCL
DEVELOPMENT CONSULTANTS
adopted from IS: 5182 published by Bureau of Indian Standards while the
same for PM2.5 is as per USEPA 1997a 40CFR Part – 50. VOC is measured by USEPA TO-14A. Methane is measured by IS 5182 (Part
XVII) 1979 and Non-Methane HC is measured by IS 5182 (Part 21) 2001 as
described in the “Guidelines for Ambient Air Quality Monitoring” of CPCB.
Frequency and duration of Monitoring
The frequency of monitoring in each station was twice a week for a period of
one (1) month. PM2.5, PM10, SO2 and NO2, HC as methane and HC as non-
methane reading were of 24-hour average value.
Observations on Ambient Air Quality
The results of ambient air quality monitoring, as obtained from all the
monitoring stations for the different months of monitoring have been furnished
in Table 3.1.
Summary of the Ambient Air Quality data has been furnished in Table 3.2.
The table shows maximum, minimum and average values corresponding to
each of the pollutants viz. PM2.5, PM10, SO2, NO2, HC as methane and HC as
non-methane for the individual monitoring stations.
The following observations are made from Table 3.2:
Particulate Matter2.5 (PM2.5)
The 24-hour values of Particulate Matters 2.5 (PM2.5) varied between
58.2 µg/m3 and 38.2 µg/m3 during monitoring. The average value of PM2.5 is
46 µg/m3. These measured values are within the limit set for Industrial,
Residential, Rural and Other areas (60 µg/m3) as well as Ecologically
Sensitive Area (60 µg/m3) as per the Ambient Air Quality Standards based on
CPCB notification, 18th November, 2009 (Schedule-VII).

EIA REPORT FOR PROPOSED CAPACITY EXPANSION OF PIYALA POL TERMINAL AT PIYALA, NEAR FARIDABAD, HARYANA
SECTION-3 3-17 BPCL
DEVELOPMENT CONSULTANTS
Particulate Matter10 (PM10)
The 24-hour values of Particulate Matters10 (PM10) varied between 108.2
µg/m3 and 73.2 µg/m3 during monitoring. The average value of PM10 is 88.1
µg/m3. These average value is within the limit set for Industrial, Residential,
Rural and Other areas (100 µg/m3) as well as Ecologically Sensitive Area (100
µg/m3) as per the Ambient Air Quality Standards based on CPCB notification,
18th November, 2009 (Schedule-VII). However, the maximum value is
marginally higher than the specified CPCB limit, as mentioned above. The
same can be attributed to the nearby brick kilns and unmetalled road around
the plant site
Sulfur Dioxide (SO2)
The 24-hour values of Sulfur-di-Oxides (SO2) reveals that the maximum value
as 7.89 µg/m3 and minimum is 7.0 µg/m3 during monitoring. The average
value of SO2 is 7.3 µg/m3. These measured values are within the limit set for
Industrial, Residential, Rural and Other areas (80 µg/m3) as well as
Ecologically Sensitive Area (80 µg/m3) as per the Ambient Air Quality
Standards based on CPCB notification, 18th November, 2009 (Schedule-VII).
Nitrogen Oxides (NO2)
The 24-hour values of Nitrogen dioxide (NO2) varied between 32.56 µg/m3 and
20.50 µg/m3. The Average value of Nitrogen Oxide (NOx) is 24.4 µg/m3. These
measured values are within the limit set for Industrial, Residential, Rural and
Other areas (80 µg/m3) as well as Ecologically Sensitive Area (80 µg/m3) as
per the Ambient Air Quality Standards based on CPCB notification, 18th
November, 2009 (Schedule-VII).
EIA REPORT FOR PROPOSED CAPACITY EXPANSION OF PIYALA POL TERMINAL AT PIYALA, NEAR FARIDABAD, HARYANA
SECTION-3 3-18 BPCL
DEVELOPMENT CONSULTANTS
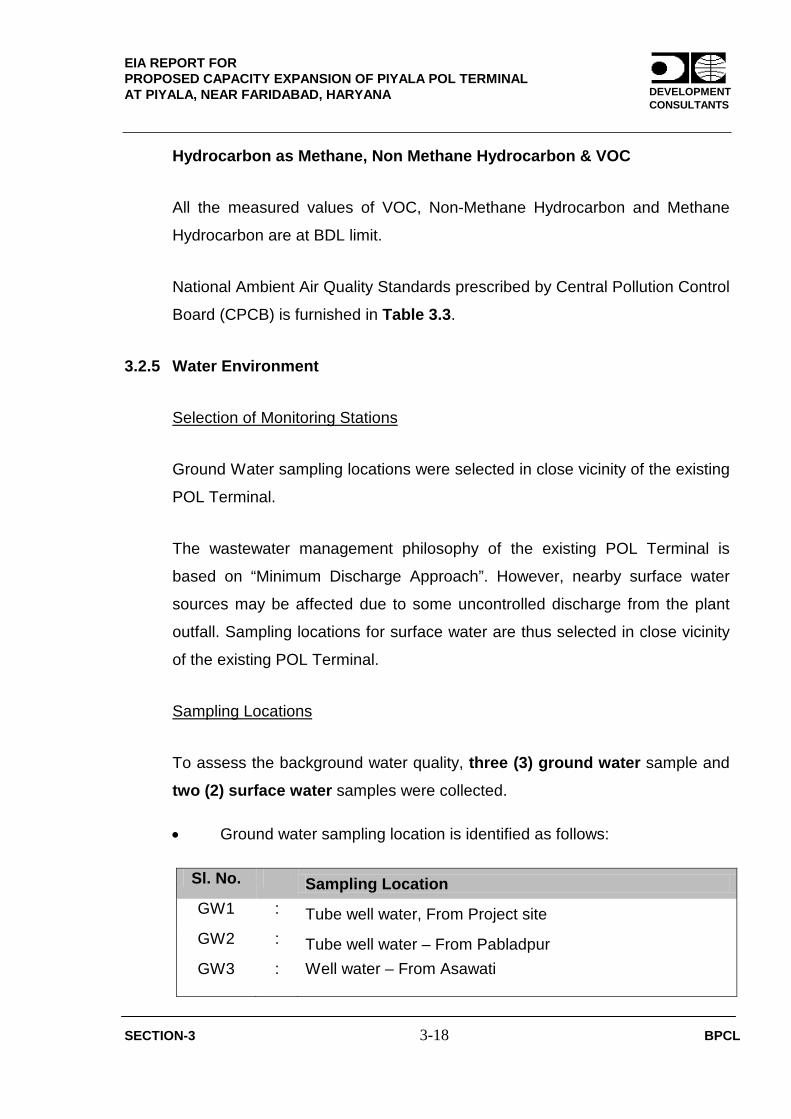
Hydrocarbon as Methane, Non Methane Hydrocarbon & VOC
All the measured values of VOC, Non-Methane Hydrocarbon and Methane
Hydrocarbon are at BDL limit.
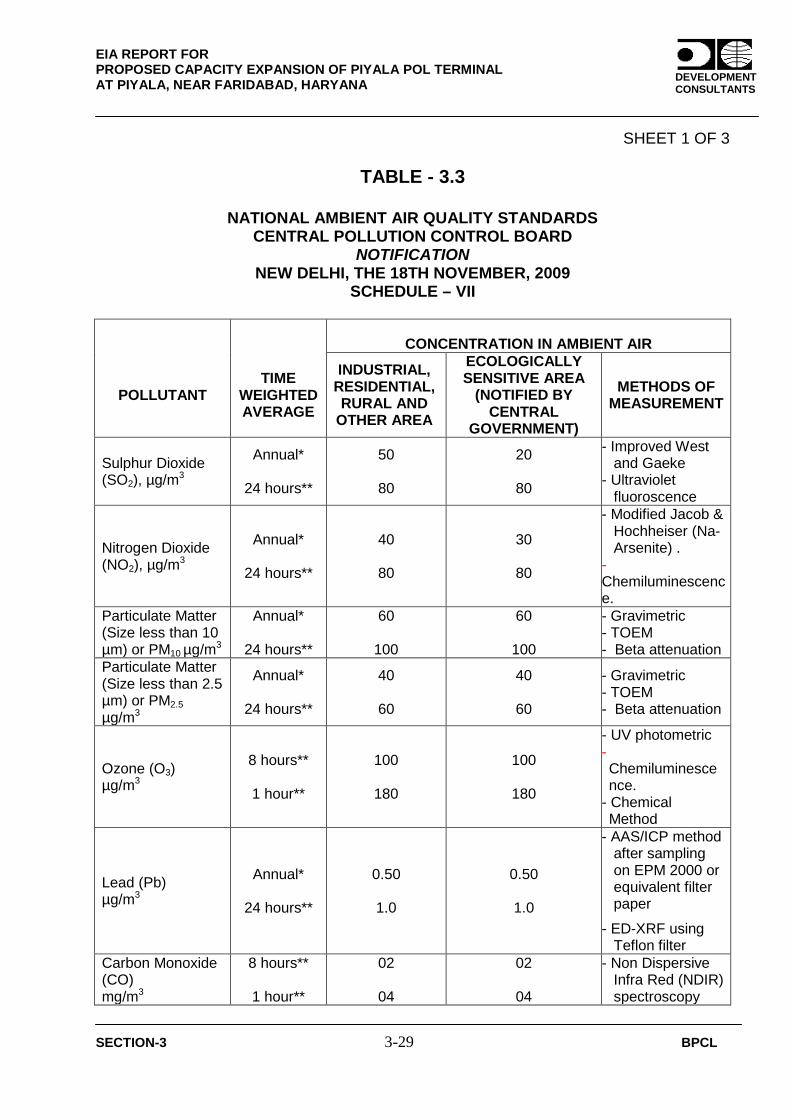
National Ambient Air Quality Standards prescribed by Central Pollution Control
Board (CPCB) is furnished in Table 3.3.
3.2.5 Water Environment
Selection of Monitoring Stations
Ground Water sampling locations were selected in close vicinity of the existing
POL Terminal.
The wastewater management philosophy of the existing POL Terminal is
based on “Minimum Discharge Approach”. However, nearby surface water
sources may be affected due to some uncontrolled discharge from the plant
outfall. Sampling locations for surface water are thus selected in close vicinity
of the existing POL Terminal.
Sampling Locations
To assess the background water quality, three (3) ground water sample and
two (2) surface water samples were collected.
• Ground water sampling location is identified as follows:
Sl. No. Sampling Location GW1 : Tube well water, From Project site GW2 : Tube well water – From Pabladpur GW3 : Well water – From Asawati

EIA REPORT FOR PROPOSED CAPACITY EXPANSION OF PIYALA POL TERMINAL AT PIYALA, NEAR FARIDABAD, HARYANA
SECTION-3 3-19 BPCL
DEVELOPMENT CONSULTANTS
• Surface water sampling points are identified as follows:
Sl. No. Sampling Location
SW1 : Pond Water, Aswati Village SW2 : Agra Nahar, Dhig Village
Methodology and Results
Methodology adopted for sampling and analysis of the two (2) ground and two
(2) surface water samples, to establish the background water quality for this
study, was as per IS: 3026, APHA, AWWA and WPCF. Parameters
recommended by the Ministry of Environment & Forests, Government of India
were analyzed.
The results of ground water and surface water are furnished in Table 3.4 and
Table 3.5 respectively.
Observations on the Surface Water and Ground Water Quality
a) Ground Water Quality
Analyses of all ground water samples reveal that the water is acceptable.
Water of these tube wells / wells can be considered as safe sources of
Drinking Water.
b) Surface Water Quality
The results of analysis of water Samples collected from Surface water sources
generally conform to Class-C of the Indian Standards for Inland Surface water
subject to Pollution, which means the water is suitable for outdoor bathing as
drinking water source after conventional treatment and disinfection.

EIA REPORT FOR PROPOSED CAPACITY EXPANSION OF PIYALA POL TERMINAL AT PIYALA, NEAR FARIDABAD, HARYANA
SECTION-3 3-20 BPCL
DEVELOPMENT CONSULTANTS
3.2.6 Noise Level Data
Selection of Monitoring Stations
Noise level was measured (in dBA) in and around the proposed site at the
following locations:
Name of Village / Site Distance from Project Site(km)
Direction w.r.t. Project site
Project Site (N1) - -
Kaligaon (N2) 1.8 NW
Ladpur (N3) 4.5 SE
Brick Kiln near Asawati (N4) 3.2 SE
Asawati Hospital (N5) 3.0 SSE
Dhig Primary School (N6) 3.75 EES
Aswati Hospital and Primary School at Dhig were selected considering the
same as Sensitive Receptor.
Results
The results of noise level monitoring have been furnished in Table 3.6
representing the background noise level data.
Observations on the Surface Water and Ground Water Quality
It was observed that the day time as well as night time ambient noise levels in
residential and sensitive areas within the Study Area, were mostly within the
prescribed standards.

EIA REPORT FOR PROPOSED CAPACITY EXPANSION OF PIYALA POL TERMINAL AT PIYALA, NEAR FARIDABAD, HARYANA
SECTION-3 3-21 BPCL
DEVELOPMENT CONSULTANTS
3.2.7 Background Soil Quality
Selection of Monitoring Stations
To assess the background soil quality, top soil samples were collected from
the Project site as well as agricultural fields / road side locations around the
project site and were analyzed subsequently.
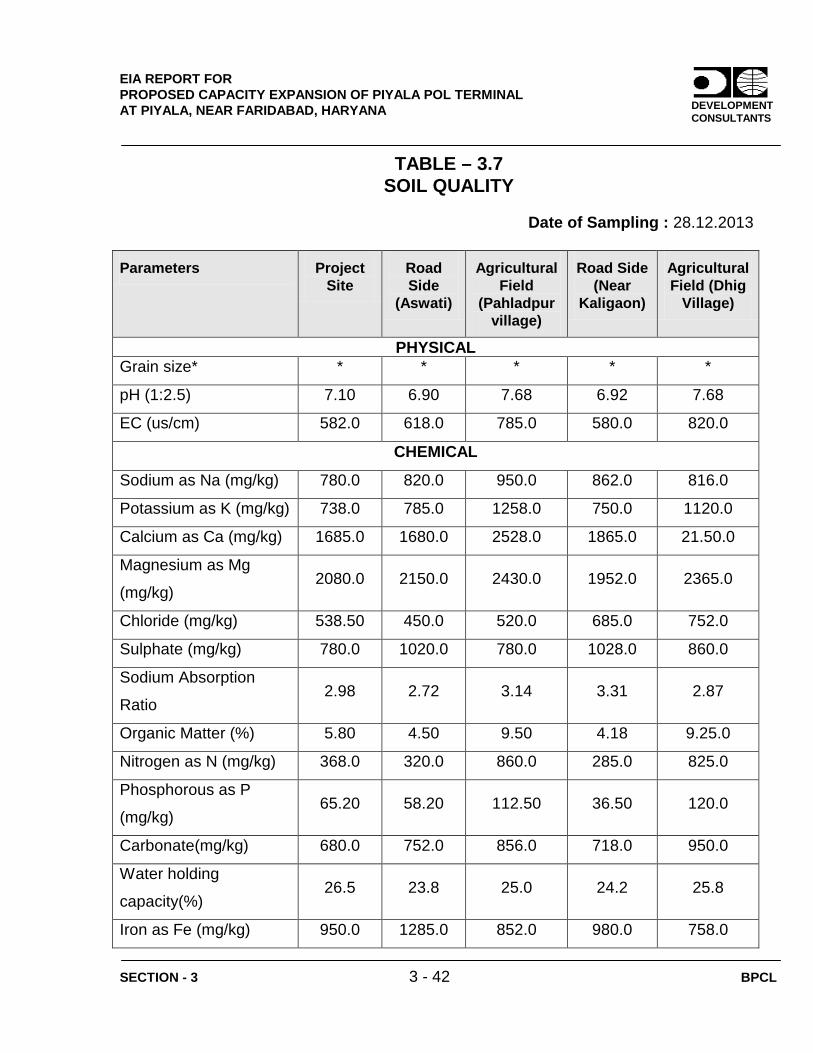
Results
The results have been furnished in Table 3.7 representing the background soil
quality of the project site and its surroundings.
Observations on the Surface Water and Ground Water Quality
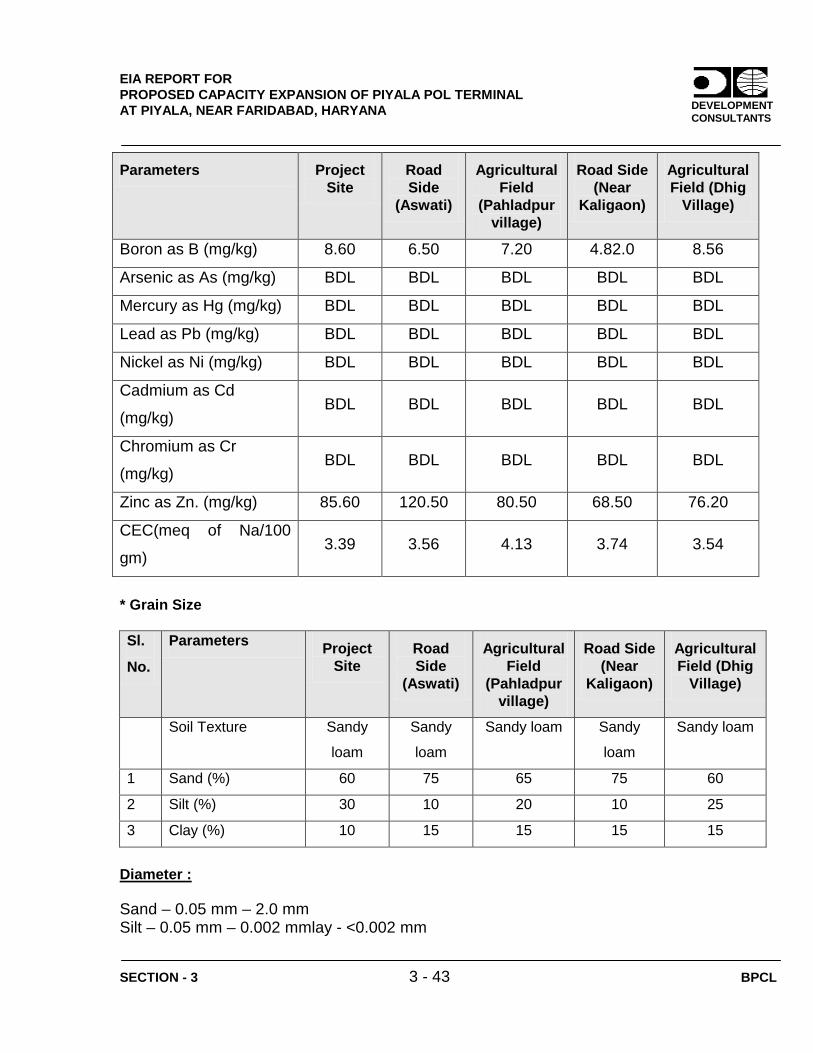
The important physico-chemical characteristics and nutrient levels of the soils
in the study area presented in Table 3.7. The soil samples are sandy loamy.
3.2.8 Satellite Imagery
A report on site details covering 10 km radius around the proposed site based
on Satellite Imagery & Geographic Information System (GIS) is furnished as
EXHIBIT – 3.2.
--------Ω--------

EIA REPORT FOR PROPOSED CAPACITY EXPANSION OF PIYALA POL TERMINAL AT PIYALA, NEAR FARIDABAD, HARYANA
________________________________________________________________________________________________________
SECTION - 3 3-22 BPCL
DEVELOPMENT CONSULTANTS
SHEET 1 OF 6 TABLE – 3.1
AMBIENT AIR QUALITY DATA
STATION A1 : PROJECT SITE
SL. NO.
DATE OF SAMPLING
CONCENTRATION IN µg/m3 (24 hrs) CONCENTRATION IN (24 hrs)
Respirable Particulate
Matter (RPM2.5)
Respirable Particulate
Matter (RPM10)
Sulphur Di-
Oxide (SO2)
Oxides of
Nitrogen (NOx)
VOC Methane
HC Non
MethaneHC
(ppb) (ppm) (ppb)
1 04.12.13 46.20 108.20 7.89 30.03 <1.0 <1.0 <1.0
2 08.12.13 48.50 103.50 7.61 28.51 <1.0 <1.0 <1.0
3 12.12.13 46.20 91.50 7.21 25.05 <1.0 <1.0 <1.0
4 16.12.13 48.60 93.50 7.21 23.79 <1.0 <1.0 <1.0
5 20.12.13 43.80 92.60 7.34 23.11 <1.0 <1.0 <1.0
6 24.12.13 51.20 85.20 7.07 25.05 <1.0 <1.0 <1.0
7 28.12.13 47.50 81.20 7.07 23.11 <1.0 <1.0 <1.0
8 01.01.14 41.20 86.30 7.07 22.52 <1.0 <1.0 <1.0
NOTE: PM 2.5: Respirable Particulate Matter (Size less than 2.5 µm) PM 10: Respirable Particulate Matter (Size less than 10 µm) SO2: Sulphur di Oxide NOx: Oxides of Nitrogen VOC Volatile Organic Carbon Methane HC Methane Hydro Carbon Non Methane HC Non Methane Hydro Carbon

EIA REPORT FOR PROPOSED CAPACITY EXPANSION OF PIYALA POL TERMINAL AT PIYALA, NEAR FARIDABAD, HARYANA
________________________________________________________________________________________________________
SECTION - 3 3-23 BPCL
DEVELOPMENT CONSULTANTS
SHEET 2 OF 6 TABLE – 3.1
AMBIENT AIR QUALITY DATA
STATION A2 : KALIGAON
SL. NO.
DATE OF SAMPLING
CONCENTRATION IN µg/m3 (24 hrs) CONCENTRATION IN (24 hrs)
Respirable Particulate
Matter (RPM2.5)
Respirable Particulate
Matter (RPM10)
Sulphur Di-
Oxide (SO2)
Oxides of
Nitrogen (NOx)
VOC Methane
HC Non
MethaneHC
(ppb) (ppm) (ppb)
1 04.12.13 46.20 81.50 7.21 26.23 <1.0 <1.0 <1.0
2 08.12.13 41.80 86.20 7.07 21.51 <1.0 <1.0 <1.0
3 12.12.13 38.50 78.50 7.07 23.87 <1.0 <1.0 <1.0
4 16.12.13 42.80 73.20 7.34 23.11 <1.0 <1.0 <1.0
5 20.12.13 46.50 81.20 7.21 21.85 <1.0 <1.0 <1.0
6 24.12.13 41.20 96.50 7.61 25.05 <1.0 <1.0 <1.0
7 28.12.13 48.50 89.20 7.21 21.85 <1.0 <1.0 <1.0
8 01.01.14 42.80 76.50 7.00 21.51 <1.0 <1.0 <1.0 NOTE: PM 2.5: Respirable Particulate Matter (Size less than 2.5 µm)
PM 10: Respirable Particulate Matter (Size less than 10 µm) SO2: Sulphur di Oxide NOx: Oxides of Nitrogen VOC Volatile Organic Carbon Methane HC Methane Hydro Carbon Non Methane HC Non Methane Hydro Carbon

EIA REPORT FOR PROPOSED CAPACITY EXPANSION OF PIYALA POL TERMINAL AT PIYALA, NEAR FARIDABAD, HARYANA
________________________________________________________________________________________________________
SECTION - 3 3-24 BPCL
DEVELOPMENT CONSULTANTS
SHEET 3 OF 6 TABLE – 3.1
AMBIENT AIR QUALITY DATA
STATION A3 : LADPUR
SL. NO.
DATE OF SAMPLING
CONCENTRATION IN µg/m3 (24 hrs) CONCENTRATION IN (24 hrs)
Respirable Particulate
Matter (RPM2.5)
Respirable Particulate
Matter (RPM10)
Sulphur Di-
Oxide (SO2)
Oxides of
Nitrogen (NOx)
VOC Methane
HC Non
MethaneHC
(ppb) (ppm) (ppb)
1 04.12.13 51.20 105.60 7.89 32.56 <1.0 <1.0 <1.0
2 08.12.13 48.50 91.20 7.61 30.03 <1.0 <1.0 <1.0
3 12.12.13 43.20 90.80 7.21 25.05 <1.0 <1.0 <1.0
4 16.12.13 46.80 82.50 7.75 26.82 <1.0 <1.0 <1.0
5 20.12.13 43.80 86.20 7.21 25.05 <1.0 <1.0 <1.0
6 24.12.13 51.20 93.50 7.48 26.23 <1.0 <1.0 <1.0
7 28.12.13 46.50 91.20 7.34 23.79 <1.0 <1.0 <1.0
8 01.01.14 51.20 90.20 7.48 28.51 <1.0 <1.0 <1.0
NOTE: PM 2.5: Respirable Particulate Matter (Size less than 2.5 µm)
PM 10: Respirable Particulate Matter (Size less than 10 µm) SO2: Sulphur di Oxide NOx: Oxides of Nitrogen VOC Volatile Organic Carbon Methane HC Methane Hydro Carbon Non Methane HC Non Methane Hydro Carbon

EIA REPORT FOR PROPOSED CAPACITY EXPANSION OF PIYALA POL TERMINAL AT PIYALA, NEAR FARIDABAD, HARYANA
________________________________________________________________________________________________________
SECTION - 3 3-25 BPCL
DEVELOPMENT CONSULTANTS
SHEET 4 OF 6 TABLE – 3.1
AMBIENT AIR QUALITY DATA
STATION A4 : BRICK KILN NEAR ASAWATI
SL. NO.
DATE OF SAMPLING
CONCENTRATION IN µg/m3 (24 hrs) CONCENTRATION IN (24 hrs)
Respirable Particulate
Matter (RPM2.5)
Respirable Particulate
Matter (RPM10)
Sulphur Di-
Oxide (SO2)
Oxides of
Nitrogen (NOx)
VOC Methane
HC Non
MethaneHC
(ppb) (ppm) (ppb)
1 06.12.13 58.20 106.50 7.89 26.23 <1.0 <1.0 <1.0
2 10.12.13 46.20 91.50 7.21 25.05 <1.0 <1.0 <1.0
3 14.12.13 52.80 102.60 7.48 23.79 <1.0 <1.0 <1.0
4 18.12.13 51.60 91.20 7.61 26.82 <1.0 <1.0 <1.0
5 22.12.13 47.60 86.50 7.21 23.53 <1.0 <1.0 <1.0
6 26.12.13 46.50 86.50 7.21 21.85 <1.0 <1.0 <1.0
7 30.12.13 42.80 82.50 7.07 21.85 <1.0 <1.0 <1.0
8 03.01.14 43.80 81.60 7.07 21.59 <1.0 <1.0 <1.0
NOTE: PM 2.5: Respirable Particulate Matter (Size less than 2.5 µm)
PM 10: Respirable Particulate Matter (Size less than 10 µm) SO2: Sulphur di Oxide NOx: Oxides of Nitrogen VOC Volatile Organic Carbon Methane HC Methane Hydro Carbon Non Methane HC Non Methane Hydro Carbon

EIA REPORT FOR PROPOSED CAPACITY EXPANSION OF PIYALA POL TERMINAL AT PIYALA, NEAR FARIDABAD, HARYANA
________________________________________________________________________________________________________
SECTION - 3 3-26 BPCL
DEVELOPMENT CONSULTANTS
SHEET 5 OF 6 TABLE – 3.1
AMBIENT AIR QUALITY DATA
STATION A5 : ASAWATI
SL. NO.
DATE OF SAMPLING
CONCENTRATION IN µg/m3 (24 hrs) CONCENTRATION IN (24 hrs)
Respirable Particulate
Matter (RPM2.5)
Respirable Particulate
Matter (RPM10)
Sulphur Di-
Oxide (SO2)
Oxides of
Nitrogen (NOx)
VOC Methane
HC Non
MethaneHC
(ppb) (ppm) (ppb)
1 06.12.13 46.32 93.50 7.48 26.23 <1.0 <1.0 <1.0
2 10.12.13 43.20 91.20 7.21 25.05 <1.0 <1.0 <1.0
3 14.12.13 41.80 76.50 7.07 23.11 <1.0 <1.0 <1.0
4 18.12.13 42.50 81.50 7.07 21.85 <1.0 <1.0 <1.0
5 22.12.13 38.20 76.20 7.07 21.51 <1.0 <1.0 <1.0
6 26.12.13 48.50 82.60 7.34 23.11 <1.0 <1.0 <1.0
7 30.12.13 52.80 91.20 7.61 24.80 <1.0 <1.0 <1.0
8 03.01.14 46.20 91.50 7.34 23.53 <1.0 <1.0 <1.0
NOTE: PM 2.5: Respirable Particulate Matter (Size less than 2.5 µm)
PM 10: Respirable Particulate Matter (Size less than 10 µm) SO2: Sulphur di Oxide NOx: Oxides of Nitrogen VOC Volatile Organic Carbon Methane HC Methane Hydro Carbon Non Methane HC Non Methane Hydro Carbon

EIA REPORT FOR PROPOSED CAPACITY EXPANSION OF PIYALA POL TERMINAL AT PIYALA, NEAR FARIDABAD, HARYANA
________________________________________________________________________________________________________
SECTION - 3 3-27 BPCL
DEVELOPMENT CONSULTANTS
SHEET 6 OF 6
TABLE – 3.1 AMBIENT AIR QUALITY DATA
STATION A6 : DHIG
SL. NO.
DATE OF SAMPLING
CONCENTRATION IN µg/m3 (24 hrs) CONCENTRATION IN (24 hrs)
Respirable Particulate
Matter (RPM2.5)
Respirable Particulate
Matter (RPM10)
Sulphur Di-
Oxide (SO2)
Oxides of
Nitrogen (NOx)
VOC Methane
HC Non
MethaneHC
(ppb) (ppm) (ppb)
1 06.12.13 46.20 78.20 7.48 25.05 <1.0 <1.0 <1.0
2 10.12.13 38.50 76.50 7.07 20.50 <1.0 <1.0 <1.0
3 14.12.13 45.20 85.30 7.34 23.11 <1.0 <1.0 <1.0
4 18.12.13 42.60 86.50 7.21 21.85 <1.0 <1.0 <1.0
5 22.12.13 47.50 92.50 7.48 25.05 <1.0 <1.0 <1.0
6 26.12.13 43.50 85.60 7.61 23.53 <1.0 <1.0 <1.0
7 30.12.13 43.50 91.60 7.21 23.53 <1.0 <1.0 <1.0
8 03.01.14 46.20 81.50 7.34 25.00 <1.0 <1.0 <1.0 NOTE: PM 2.5: Respirable Particulate Matter (Size less than 2.5 µm)
PM 10: Respirable Particulate Matter (Size less than 10 µm) SO2: Sulphur di Oxide NOx: Oxides of Nitrogen VOC Volatile Organic Carbon Methane HC Methane Hydro Carbon Non Methane HC Non Methane Hydro Carbon

EIA REPORT FOR PROPOSED CAPACITY EXPANSION OF PIYALA POL TERMINAL AT PIYALA, NEAR FARIDABAD, HARYANA
SECTION-3 3-28 BPCL
DEVELOPMENT CONSULTANTS
TABLE – 3.2
SUMMARY OF AMBIENT AIR QUALITY
POLLUTANT MAXIMUM MINIMUM AVERAGE
RPM2.5 58.2 38.2 46.0
RPM 10 108.2 73.2 88.1
SO2 7.89 7.0 7.3
NO2 32.56 20.50 24.40
NOTE All the values of VOC and Non-Methane Hydrocarbon are below 1.0 ppb (i.e.
BDL). Hence the same is not included in the above table.
All the values of Methane Hydrocarbon are below 1.0 ppm (i.e. BDL). Hence the
same is not included in the above table.
Sheet 1 of 1
EIA REPORT FOR PROPOSED CAPACITY EXPANSION OF PIYALA POL TERMINAL AT PIYALA, NEAR FARIDABAD, HARYANA
SECTION-3 3-29 BPCL
DEVELOPMENT CONSULTANTS
SHEET 1 OF 3
TABLE - 3.3
NATIONAL AMBIENT AIR QUALITY STANDARDS CENTRAL POLLUTION CONTROL BOARD
NOTIFICATION NEW DELHI, THE 18TH NOVEMBER, 2009
SCHEDULE – VII
POLLUTANT
TIME WEIGHTED AVERAGE
CONCENTRATION IN AMBIENT AIR
INDUSTRIAL, RESIDENTIAL, RURAL AND
OTHER AREA
ECOLOGICALLY SENSITIVE AREA
(NOTIFIED BY CENTRAL
GOVERNMENT)
METHODS OF MEASUREMENT
Sulphur Dioxide (SO2), µg/m3
Annual*
24 hours**
50
80
20
80
- Improved West and Gaeke
- Ultraviolet fluoroscence
Nitrogen Dioxide (NO2), µg/m3
Annual*
24 hours**
40
80
30
80
- Modified Jacob & Hochheiser (Na-Arsenite) .
- Chemiluminescence.
Particulate Matter (Size less than 10 µm) or PM10 µg/m3
Annual*
24 hours**
60
100
60
100
- Gravimetric - TOEM - Beta attenuation
Particulate Matter (Size less than 2.5 µm) or PM2.5 µg/m3
Annual*
24 hours**
40
60
40
60
- Gravimetric - TOEM - Beta attenuation
Ozone (O3) µg/m3
8 hours**
1 hour**
100
180
100
180
- UV photometric - Chemiluminescence.
- Chemical Method
Lead (Pb) µg/m3
Annual*
24 hours**
0.50
1.0
0.50
1.0
- AAS/ICP method after sampling on EPM 2000 or equivalent filter paper
- ED-XRF using Teflon filter
Carbon Monoxide (CO) mg/m3
8 hours**
1 hour**
02
04
02
04
- Non Dispersive Infra Red (NDIR) spectroscopy

EIA REPORT FOR PROPOSED CAPACITY EXPANSION OF PIYALA POL TERMINAL AT PIYALA, NEAR FARIDABAD, HARYANA
SECTION-3 3-30 BPCL
DEVELOPMENT CONSULTANTS
SHEET 2 OF 3
TABLE - 3.3
NATIONAL AMBIENT AIR QUALITY STANDARDS CENTRAL POLLUTION CONTROL BOARD
NOTIFICATION NEW DELHI, THE 18TH NOVEMBER, 2009
SCHEDULE – VII
POLLUTANT
TIME
WEIGHTED AVERAGE
CONCENTRATION IN AMBIENT AIR
INDUSTRIAL, RESIDENTIAL, RURAL AND
OTHER AREA
ECOLOGICALLY SENSITIVE AREA
(NOTIFIED BY CENTRAL
GOVERNMENT)
METHODS OF MEASUREMENT
Ammonia (NH3) µg/m3
Annual*
24 hours**
100
400
100
400
-Chemiluminescence - Indophenol blue
method
Benzene (C6H6) µg/m3
Annual* 05 05
- Gas chromatography based continuous
analyzer - Adsorption and
Desorption followed by GC analysis
Benzo (a) Pyrene (BaP) –
Particulate phase only,
ng/m3
Annual* 01 01
- Solvent Extraction followed by HPLC/ GC analysis
Arsenic (As), ng/m3
Annual* 06 06
- AAS/ICP method after sampling on EPM 2000 or equivalent filter paper
Nickel (Ni), ng/m3
Annual* 20 20
- AAS/ICP method after sampling on EPM 2000 or equivalent filter paper

EIA REPORT FOR PROPOSED CAPACITY EXPANSION OF PIYALA POL TERMINAL AT PIYALA, NEAR FARIDABAD, HARYANA
SECTION-3 3-31 BPCL
DEVELOPMENT CONSULTANTS
TABLE - 3.3 SHEET 3 OF 3
NATIONAL AMBIENT AIR QUALITY STANDARDS
CENTRAL POLLUTION CONTROL BOARD NOTIFICATION
NEW DELHI, THE 18TH NOVEMBER, 2009 SCHEDULE – VII
* Annual arithmetic mean of minimum 104 measurements in a year at a particular
site taken ** twice a week 24 hourly at uniform intervals.
** 24 hourly 08 hourly or 01 hourly monitored values, as applicable, shall be
complied with 98% of the time in a year. 2% of the time, they may exceed the limits but not on two consecutive days on monitoring.
Note : Whenever and wherever monitoring results on two consecutive days of monitoring
exceed the limits specified above for the respective category, it shall be considered adequate reason to institute regular or continuous monitoring and further investigation.

EIA REPORT FOR PROPOSED CAPACITY EXPANSION OF PIYALA POL TERMINAL AT PIYALA, NEAR FARIDABAD, HARYANA
SECTION - 3 3 - 32 BPCL
DEVELOPMENT CONSULTANTS
TABLE – 3.4 GROUND WATER QUALITY
LOCATION OF SAMPLING DATE OF SAMPLING : 24.12.2014 GW1 : Tube well water, From Project Site
GW2 : Tube well water – From Pabladpur
GW3 : Well water – From Asawati
SL.NO. PARAMETERS GW – 1 GW – 2 GW – 3
1 pH 7.06 7.40 6.47
2 Temperature (°C) 12.50 12.0 12.50
3 Turbidity ( NTU) 1.20 3.50 12.80
4 Total Alkalinity, as CaCO3 (ppm) 780.0 600.0 540.0
5 Total Dissolved solid ( ppm) 1421.0 1735.0 2272.0
6 Total Hardness, as CaCO3 (ppm) 380.0 448.0 880.0
7 Calcium Hardness, as CaCO3 (ppm) 88.18 112.22 196.39
8 Magnesium Hardness, as CaCO3 (ppm) 38.40 40.32 93.6
9 Chloride, as Cl (ppm) 148.99 196.14 480.91
10 Sulphate , as SO4 (ppm) 27.50 55.0 45.0
11 Nitrate , as NO3 (ppm) 10.52 15.01 23.50
12 Fluoride , as F (ppm) <0.1 <0.1 <0.1
13 Sodium , as Na (ppm) 180.0 230.0 270.0
14 Potassium , as K (ppm) 28.25 55.50 62.00
15 Total Nitrogen , as N (ppm), Kjeldahl <0.2 <0.2 12.50
16 Total Phosphorous , as PO4 (ppm) 3.20 4.80 8.25
17 Phenol , (ppm) <0.1 <0.1 <0.1
18 Boron (ppm) <0.1 <0.1 <0.1
19 Arsenic, as As (ppm) <0.01 <0.01 <0.01
20 Selenium (ppm) <0.05 <0.05 <0.05
SHEET 1 of 2

EIA REPORT FOR PROPOSED CAPACITY EXPANSION OF PIYALA POL TERMINAL AT PIYALA, NEAR FARIDABAD, HARYANA
SECTION - 3 3 - 33 BPCL
DEVELOPMENT CONSULTANTS
SL.NO. PARAMETERS GW – 1 GW – 2 GW – 3
21 Oil & Grease (ppm) <1.0 <1.0 <1.0
22 Cadmium , as Cd (ppm) <0.05 <0.05 <0.05
23 Lead , as Pb (ppm) <0.2 <0.2 <0.2
24 Copper , as Cu (ppm) <0.04 <0.04 <0.04
25 Chromium , as Cr (ppm) <0.06 <0.06 <0.06
26 Murcury , as Hg (ppm) <0.001 <0.001 <0.001
27 Nickel , as Ni (ppm) <0.2 <0.2 <0.2
28 Zinc , as Zn (ppm) 0.15 0.15 0.60
29 Iron , as Fe (ppm) 0.67 1.47 0.69
30 Total Coliforms / 100ml <1,<10,<100
<1,<10,<100 800
31 Fecal Coliform/ 100 ml <1,<10, <100
<1,<10, <100
260
<1 indicate No Colony developed in 1 ml. Sample. <10 indicate No Colony developed in 0.1 ml. Sample. <100 indicate No Colony developed in 0.01 ml. Sample.

EIA REPORT FOR PROPOSED CAPACITY EXPANSION OF PIYALA POL TERMINAL AT PIYALA, NEAR FARIDABAD, HARYANA
SECTION - 3 3-34 BPCL
DEVELOPMENT CONSULTANTS
TABLE – 3.5
SURFACE WATER QUALITY LOCATION OF SAMPLING : DATE OF SAMPLING : 24.12.2013
SW1 – Pond Water, Aswati Village SW2 – Agra Nahar, Dhig Village
Sl. No. Parameters SW1 SW2
1. Colour (Hazen) Slightly hazy Slightly hazy
2. PH 7.26 7.30
3. Temperature (0C) 16.0 15.5
4. Total Dissolved Solid (mg./l) 286.0 325.0
5. Total Suspended Solid (mg./l) 23.50 28.0
6. Dissolved Oxygen (mg./l) 5.6 5.6
7. BOD, 3 days at 270C (mg./l) 7.0 8.0
8. COD (mg./l) 30.0 35.0
9. Oil & Grease (mg./l) <1.0 <1.0
10. Chlorides as Cl (mg./l) 32.06 35.83
11. Alkalinity (mg/l) 124.00 132.00
12. Total Hardness (mg/l) 92.0 112.0
13. Calcium (mg/l) 20.84 32.06
14. Magnesium (mg/l) 9.6 7.68
15. Phenolic Compounds (mg/l) <0.1 <0.1
16. Cyanides as CN (mg/l) <0.05 <0.05
17. Sulphides as S (mg/l) <1.0 <1.0
18. Sulphates as SO4 (mg/l) 8.50 7.20
19. Total Nitrogen as N (mg/l) 6.22 6.83
SHEET 1 of 2

EIA REPORT FOR PROPOSED CAPACITY EXPANSION OF PIYALA POL TERMINAL AT PIYALA, NEAR FARIDABAD, HARYANA
SECTION - 3 3-35 BPCL
DEVELOPMENT CONSULTANTS
Sl. No. Parameters SW1 SW2
20. Ammonical Nitrogen (mg/l) 2.50 2.32
21. Total Phosphate (mg/l) 3.50 3.80
22. Fluorides as F (mg/l) <0.1 <0.1
23. Boron as B (mg/l) <0.1 <0.1
24. Arsenic as As (mg/l) <0.001 <0.001
25 Sodium as Na (mg/l) 26.50 25.0
26. Cadmium as Cd (mg./l) <0.01 <0.01
27. Lead as Pb (mg/l) <0.088 <0.088
28. Copper as Cu (mg/l) <0.04 <0.04
29. Chromium as Cr (mg/l) <0.06 <0.06
30. Mercury as Hg (mg/l) <0.001 <0.001
31. Nickel as Ni (mg/l) <0.2 <0.2
32. Zinc as Zn (mg/l) 0.56 0.68
33. Iron as Fe (mg/l) 0.68 0.78
34. Coliform Organism (M.P.N/100 ml) 680 680
35. Fecal Coliform (M.P.N/100 ml) 280 360

EIA REPORT FOR PROPOSED CAPACITY EXPANSION OF PIYALA POL TERMINAL AT PIYALA, NEAR FARIDABAD, HARYANA
________________________________________________________________________________________________________
SECTION - 3 3 - 36 BPCL
DEVELOPMENT CONSULTANTS
SHEET 1 OF 6 TABLE – 3.6
NOISE LEVEL MONITORING
STATION N1 : PROJECT SITE
Date Time Lmin dB(A) Lmax dB(A) Leq dB(A)
04.12.13 – 05.12.13 Day 51.2 62.5 58.23
Night 43.5 53.2 47.12
08.12.13 – 09.12.13 Day 50.8 61.5 56.20
Night 41.8 52.5 45.23
12.12.13 – 13.12.13 Day 52.8 62.5 56.80
Night 43.5 51.6 45.28
16.12.13 – 17.12.13 Day 56.2 63.5 58.10
Night 42.5 50.2 43.20
20.12.13 – 21.12.13 Day 56.2 60.1 58.18
Night 41.8 52.6 42.16
24.12.13 – 25.12.13 Day 53.2 62.5 57.10
Night 42.8 46.5 43.50
28.12.13 – 29.12.13 Day 51.8 56.2 53.28
Night 41.8 45.2 42.50
01.01.14 – 02.01.14 Day 54.8 61.5 56.20
Night 41.2 53.8 42.68 Lmin : Minimum Noise level Lmax :Maximum Noise level Leq :Equivalent sound energy
Day Time : Between 06:00 am to 09:00 pm; Night Time : Between 09:00 pm to 06:00 am.

EIA REPORT FOR PROPOSED CAPACITY EXPANSION OF PIYALA POL TERMINAL AT PIYALA, NEAR FARIDABAD, HARYANA
________________________________________________________________________________________________________
SECTION - 3 3 - 37 BPCL
DEVELOPMENT CONSULTANTS
SHEET 2 OF 6 TABLE – 3.6
NOISE LEVEL MONITORING
STATION N2 : KALIGAON
Date Time Lmin dB(A) Lmax dB(A) Leq dB(A)
04.12.13 – 05.12.13 Day 56.2 68.5 65.20
Night 57.5 65.3 63.28
08.12.13 – 09.12.13 Day 61.5 68.8 65.12
Night 56.2 64.2 63.80
12.12.13 – 13.12.13 Day 62.5 72.3 68.58
Night 53.8 62.8 60.20
16.12.13 – 17.12.13 Day 57.2 71.5 68.26
Night 53.6 65.2 61.50
20.12.13 – 21.12.13 Day 63.5 68.5 65.28
Night 53.6 67.5 61.23
24.12.13 – 25.12.13 Day 58.2 73.5 71.48
Night 46.2 68.5 64.50
28.12.13 – 29.12.13 Day 63.5 73.2 70.12
Night 53.8 68.5 62.18
01.01.14 – 02.01.14 Day 62.5 68.3 65.20
Night 56.2 65.8 63.28
Lmin : Minimum Noise level Lmax :Maximum Noise level Leq :Equivalent sound energy
Day Time : Between 06:00 am to 09:00 pm; Night Time : Between 09:00 pm to 06:00 am.

EIA REPORT FOR PROPOSED CAPACITY EXPANSION OF PIYALA POL TERMINAL AT PIYALA, NEAR FARIDABAD, HARYANA
________________________________________________________________________________________________________
SECTION - 3 3 - 38 BPCL
DEVELOPMENT CONSULTANTS
SHEET 3 OF 6 TABLE – 3.6
NOISE LEVEL MONITORING
STATION N3 : LADPUR VILLAGE
Date Time Lmin dB(A) Lmax dB(A) Leq dB(A)
04.12.13 – 05.12.13 Day 52.8 56.2 53.78
Night 46.4 51.8 48.23
08.12.13 – 09.12.13 Day 51.9 58.6 53.12
Night 41.2 45.8 43.18
12.12.13 – 13.12.13 Day 48.5 56.8 53.48
Night 42.6 48.5 45.12
16.12.13 – 17.12.13 Day 51.2 56.8 52.26
Night 43.8 48.6 46.50
20.12.13 – 21.12.13 Day 52.8 56.3 53.18
Night 42.5 46.8 43.10
24.12.13 – 25.12.13 Day 48.2 52.3 50.26
Night 38.5 46.2 42.50
28.12.13 – 29.12.13 Day 51.2 53.8 52.16
Night 37.5 42.8 41.20
01.01.14 – 02.01.14 Day 52.6 56.8 53.68
Night 41.4 52.8 45.12 Lmin : Minimum Noise level Lmax :Maximum Noise level Leq :Equivalent sound energy
Day Time : Between 06:00 am to 09:00 pm; Night Time : Between 09:00 pm to 06:00 am.

EIA REPORT FOR PROPOSED CAPACITY EXPANSION OF PIYALA POL TERMINAL AT PIYALA, NEAR FARIDABAD, HARYANA
________________________________________________________________________________________________________
SECTION - 3 3 - 39 BPCL
DEVELOPMENT CONSULTANTS
SHEET 4 OF 6
TABLE – 3.6 NOISE LEVEL MONITORING
STATION A4 : BRICK KILN NEAR ASAWATI
Date Time Lmin dB(A) Lmax dB(A) Leq dB(A)
06.12.13 – 07.12.13 Day 56.5 63.8 61.76
Night 46.2 51.8 50.18
10.12.13 – 11.12.13 Day 53.8 62.5 61.28
Night 47.5 53.2 51.20
14.12.13 – 15.12.13 Day 56.2 63.5 61.74
Night 49.8 51.6 50.12
18.12.13 – 19.12.13 Day 56.5 67.5 63.18
Night 46.1 53.8 52.80
22.12.13 – 23.12.13 Day 51.2 72.5 62.10
Night 42.8 53.6 45.28
26.12.13 – 27.12.13 Day 56.8 68.5 61.50
Night 43.8 53.5 52.89
30.12.13 – 31.12.13 Day 56.2 65.4 63.18
Night 43.8 51.5 48.20
03.01.14 – 04.01.14 Day 58.6 68.5 65.18
Night 46.5 53.2 48.50 Lmin : Minimum Noise level Lmax :Maximum Noise level Leq :Equivalent sound energy
Day Time : Between 06:00 am to 09:00 pm; Night Time : Between 09:00 pm to 06:00 am.

EIA REPORT FOR PROPOSED CAPACITY EXPANSION OF PIYALA POL TERMINAL AT PIYALA, NEAR FARIDABAD, HARYANA
________________________________________________________________________________________________________
SECTION - 3 3 - 40 BPCL
DEVELOPMENT CONSULTANTS
SHEET 5 OF 6 TABLE – 3.6
NOISE LEVEL MONITORING
STATION N5 : ASWATI HOSPITAL
Date Time Lmin dB(A) Lmax dB(A) Leq dB(A)
06.12.13 – 07.12.13 Day 56.5 61.5 58.23
Night 43.1 57.3 53.80
10.12.13 – 11.12.13 Day 56.4 62.5 58.28
Night 48.6 58.3 51.26
14.12.13 – 15.12.13 Day 58.5 65.2 62.67
Night 48.6 61.8 50.26
18.12.13 – 19.12.13 Day 56.1 67.3 62.18
Night 48.6 53.2 51.26
22.12.13 – 23.12.13 Day 58.5 62.5 60.10
Night 43.2 52.6 48.50
26.12.13 – 27.12.13 Day 58.1 63.5 61.28
Night 48.2 53.6 52.18
30.12.13 – 31.12.13 Day 56.8 64.6 63.50
Night 43.2 51.6 48.38
03.01.14 – 04.01.14 Day 58.5 65.8 63.16
Night 43.5 51.2 48.50 Lmin : Minimum Noise level Lmax :Maximum Noise level Leq :Equivalent sound energy
Day Time : Between 06:00 am to 09:00 pm; Night Time : Between 09:00 pm to 06:00 am.

EIA REPORT FOR PROPOSED CAPACITY EXPANSION OF PIYALA POL TERMINAL AT PIYALA, NEAR FARIDABAD, HARYANA
________________________________________________________________________________________________________
SECTION - 3 3 - 41 BPCL
DEVELOPMENT CONSULTANTS
SHEET 6 OF 6 TABLE – 3.6
NOISE LEVEL MONITORING
STATION N6 : DHIG PRIMARY SCHOOL
Date Time Lmin dB(A) Lmax dB(A) Leq dB(A)
06.12.13 – 07.12.13 Day 56.1 63.5 62.16
Night 43.9 51.2 48.50
10.12.13 – 11.12.13 Day 56.2 63.5 60.10
Night 46.2 58.6 51.28
14.12.13 – 15.12.13 Day 58.1 65.8 62.50
Night 58.6 67.3 61.58
18.12.13 – 19.12.13 Day 56.7 56.2 53.20
Night 42.5 52.5 48.12
22.12.13 – 23.12.13 Day 53.8 62.8 58.23
Night 41.2 52.6 46.26
26.12.13 – 27.12.13 Day 58.6 67.5 61.80
Night 43.5 53.8 50.12
30.12.13 – 31.12.13 Day 58.6 62.5 61.78
Night 45.2 51.8 48.50
03.01.14 – 04.01.14 Day 53.5 62.5 60.18
Night 47.5 56.5 52.68
Lmin : Minimum Noise level Lmax :Maximum Noise level Leq :Equivalent sound energy
Day Time : Between 06:00 am to 09:00 pm; Night Time : Between 09:00pm to 06:00 am.
EIA REPORT FOR PROPOSED CAPACITY EXPANSION OF PIYALA POL TERMINAL AT PIYALA, NEAR FARIDABAD, HARYANA
SECTION - 3 3 - 42 BPCL
DEVELOPMENT CONSULTANTS
TABLE – 3.7 SOIL QUALITY
Date of Sampling : 28.12.2013
Parameters Project
Site Road Side
(Aswati)
Agricultural Field
(Pahladpur village)
Road Side (Near
Kaligaon)
Agricultural Field (Dhig
Village)
PHYSICAL Grain size* * * * * *
pH (1:2.5) 7.10 6.90 7.68 6.92 7.68
EC (us/cm) 582.0 618.0 785.0 580.0 820.0
CHEMICAL
Sodium as Na (mg/kg) 780.0 820.0 950.0 862.0 816.0
Potassium as K (mg/kg) 738.0 785.0 1258.0 750.0 1120.0
Calcium as Ca (mg/kg) 1685.0 1680.0 2528.0 1865.0 21.50.0
Magnesium as Mg
(mg/kg) 2080.0 2150.0 2430.0 1952.0 2365.0
Chloride (mg/kg) 538.50 450.0 520.0 685.0 752.0
Sulphate (mg/kg) 780.0 1020.0 780.0 1028.0 860.0
Sodium Absorption
Ratio 2.98 2.72 3.14 3.31 2.87
Organic Matter (%) 5.80 4.50 9.50 4.18 9.25.0
Nitrogen as N (mg/kg) 368.0 320.0 860.0 285.0 825.0
Phosphorous as P
(mg/kg) 65.20 58.20 112.50 36.50 120.0
Carbonate(mg/kg) 680.0 752.0 856.0 718.0 950.0
Water holding
capacity(%) 26.5 23.8 25.0 24.2 25.8
Iron as Fe (mg/kg) 950.0 1285.0 852.0 980.0 758.0
EIA REPORT FOR PROPOSED CAPACITY EXPANSION OF PIYALA POL TERMINAL AT PIYALA, NEAR FARIDABAD, HARYANA
SECTION - 3 3 - 43 BPCL
DEVELOPMENT CONSULTANTS
Parameters Project Site
Road Side
(Aswati)
Agricultural Field
(Pahladpur village)
Road Side (Near
Kaligaon)
Agricultural Field (Dhig
Village)
Boron as B (mg/kg) 8.60 6.50 7.20 4.82.0 8.56
Arsenic as As (mg/kg) BDL BDL BDL BDL BDL
Mercury as Hg (mg/kg) BDL BDL BDL BDL BDL
Lead as Pb (mg/kg) BDL BDL BDL BDL BDL
Nickel as Ni (mg/kg) BDL BDL BDL BDL BDL
Cadmium as Cd
(mg/kg) BDL BDL BDL BDL BDL
Chromium as Cr
(mg/kg) BDL BDL BDL BDL BDL
Zinc as Zn. (mg/kg) 85.60 120.50 80.50 68.50 76.20
CEC(meq of Na/100
gm) 3.39 3.56 4.13 3.74 3.54
* Grain Size
Sl.
No.
Parameters Project Site
Road Side
(Aswati)
Agricultural Field
(Pahladpur village)
Road Side (Near
Kaligaon)
Agricultural Field (Dhig
Village)
Soil Texture Sandy
loam
Sandy
loam
Sandy loam Sandy
loam
Sandy loam
1 Sand (%) 60 75 65 75 60
2 Silt (%) 30 10 20 10 25
3 Clay (%) 10 15 15 15 15
Diameter :
Sand – 0.05 mm – 2.0 mm Silt – 0.05 mm – 0.002 mmlay - <0.002 mm