EHS Stock profile and condition 2017 - GOV.UK
57
English Housing Survey Stock profile and condition, 2017
Transcript of EHS Stock profile and condition 2017 - GOV.UK

English Housing Survey Stock profile and condition, 2017
Contents
Introduction and main findings
Chapter 1: Profile of the English housing stock
Chapter 2: Condition of the English housing stock
Chapter 3: Fire safety measures
Chapter 4: Focus on high rise dwellings
Technical notes and glossary

Introduction and main findings | 3
Introduction and main findings
1. The English Housing Survey (EHS) is a national survey of people's housing circumstances and the condition and energy efficiency of housing in England. It is one the longest standing government surveys and was first run in 1967.
2. This report examines the English housing stock. It is split into four chapters. The first provides an overview of the age, type, size and location of the housing stock by tenure and reports on the rates of vacant homes.
3. Chapter 2 examines the condition of the English housing stock. The first part of this chapter provides an overview of the condition and safety of the housing stock examining three key indicators (Decent Homes Standard, Housing Health and Safety Rating System (HHSRS) and electrical safety). The second part investigates relationships between damp, inadequate ventilation and overheating.
4. Chapter 3 examines the characteristics of homes assessed as having a significantly higher than average risk of harm from fire under the HHSRS. It then looks at the prevalence of working smoke alarms in homes and how this varies by dwelling characteristics and dwelling location. The final section explores the presence of fire precaution measures for flats with shared common areas.
5. Chapter 4 focuses on the profile, condition and safety, including fire safety, of high rise flats. High rise flats in blocks of six or more storeys are compared to flats in four to five storey blocks, low rise flats and houses. Stock condition and safety are examined by tenure and by region.
Main findings
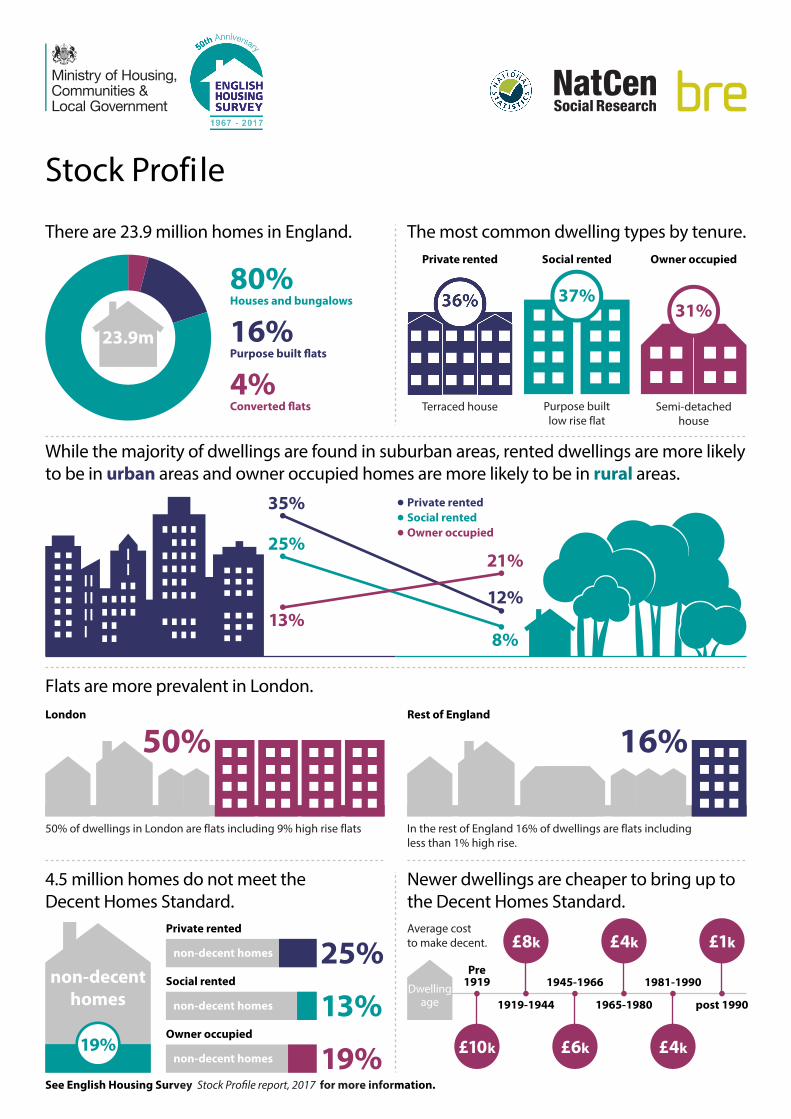
In 2017, there were 23.9 million homes in England.
Most homes (63%) were owner occupied, 20% were privately rented and 7% and 10% were owned by local authorities and housing associations respectively.
Houses and bungalows predominated (80%), 16% of homes were purpose built flats and 4% were converted flats.
Dwellings that were either converted flats or purpose built high rise flats, and homes in the private rented sector were the most likely to be vacant (all 10%). The EHS counts properties between lets as vacant therefore the EHS vacancy rate is higher than the other estimate produced by MHCLG, which is based on Council Taxbase figures supplied by local authorities1.
1 https://www.gov.uk/government/statistical-data-sets/live-tables-on-dwelling-stock-including-vacants

4 | English Housing Survey Stock profile and condition, 2017
Rented homes are concentrated in urban areas. Social homes are particularly concentrated in the most deprived areas.
Around a third (35%) of privately rented and 25% of social rented homes were located in urban centres compared with 13% of owner occupied homes.
Almost half (46%) of socially rented homes were in the most deprived 20% of areas in England, compared to 11% of owner occupied homes. In contrast a quarter (25%) of owner occupied homes and just 4% of socially rented homes were located in the least deprived 20% of areas. Private rented homes were more evenly distributed across areas.
Almost a fifth (19% or 4.5 million) of homes did not meet the Decent Homes Standard.
Private rented homes were most likely to be non-decent (25%) while the social sector (13%), particularly housing association homes (11%), had the lowest proportion of non-decent homes.
Over a third (36%) of homes built before 1919 were non-decent and would cost on average £9,991 to bring up to the standard. Only 2% of homes built after 1990 failed the Standard with an average cost of £1,209 to make them decent.
HHSRS Category 1 hazards were found in 11% of homes, making it the most common reason for failing the Decent Homes Standard.
The three most common Category 1 hazards were falls (falls on stairs, falls on the level, and falls between levels) followed by fire.
Private rented homes (14%) were more likely to have Category 1 hazards than homes in other tenures, particularly social rented homes (6%).
Houses (12%) were more likely to have Category 1 hazards than flats (8%) but converted flats (21%) were more likely to have such hazards than all other dwelling types.
1.1 million homes (5%) had a serious fire hazard, including 118,000 homes with a Category 1 fire hazard.
Serious fire hazards (such as a no smoke alarms, old or faulty electrical systems, or missing fire doors) were more common in privately rented homes (7%) and were least common among housing association homes (1%).
Serious fire hazards were present in 10% of homes built before 1919, and just 1% of the newest homes built post 1990.
Flats were less likely to have a serious fire hazard than houses (3% and 5% respectively).
90% of all households had at least one working smoke alarm, housing association tenants (96%) and households living in the newest homes built after 1990 (96%) were highly more likely to have a working smoke alarm.
Introduction and main findings | 5
High rise flats comprise just 2% of the housing stock, and were more common in the rented sectors.
There were around 487,000 flats in blocks of six or more storeys, of which around 203,000 were in blocks of 10 or more storeys.
Only 1% of owner occupied homes were in high rise flats, compared with 6% of local authority, 4% of private rented and 3% of housing association homes.
Half (50%) of London homes were flats including 9% which were high rise flats.
High rise flats were no more likely to be non-decent than other homes, and had lower repair costs.
15% of high rise flats were non-decent, similar to the overall rate (19%), and less than flats in blocks of three or less storeys (21%).
The average cost of disrepair was lower for high rise flats (£7/m²) and flats in blocks of four to five storeys (£9/m²), compared with flats in blocks of three storeys or less and houses (both £16/m²).
Acknowledgements and further queries
6. Each year the English Housing Survey relies on the contributions of a large number of people and organisations. The Ministry for Housing, Communities and Local Government (MHCLG) would particularly like to thank the following people and organisations, without whom the 2017-18 survey and this report, would not have been possible: all the households who gave up their time to take part in the survey, NatCen Social Research, the Building Research Establishment (BRE) and CADS Housing Surveys.
7. This report was produced by Helen Garrett, Maggie Davidson and Ana Slater at BRE in collaboration with NatCen Social Research and MHCLG.
8. If you have any queries about this report, would like any further information or have suggestions for analyses you would like to see included in future EHS reports, please contact [email protected].
9. The responsible analyst for this report is: Reannan Rottier, Housing and Planning Analysis Division, MHCLG. Contact via [email protected]
Stock Profile
See English Housing Survey Stock Pro�le report, 2017 for more information.
There are 23.9 million homes in England. The most common dwelling types by tenure.
While the majority of dwellings are found in suburban areas, rented dwellings are more likely to be in urban areas and owner occupied homes are more likely to be in rural areas.
Flats are more prevalent in London.
4.5 million homes do not meet the Decent Homes Standard.
Newer dwellings are cheaper to bring up to the Decent Homes Standard.
80%
16%
Converted �ats
Purpose built �ats
Houses and bungalows
4%
23.9m
London
Private rentedSocial rentedOwner occupied
Semi-detached house
Owner occupied
31%
Terraced house
Private rented
35%
25%
13%
21%
12%
8%
50%Rest of England
16%
50% of dwellings in London are flats including 9% high rise flats In the rest of England 16% of dwellings are flats including less than 1% high rise.
Average cost to make decent.
non-decenthomes
Private rented
Pre 1919
1919-1944
1945-1966 1981-1990
1965-1980 post 1990
non-decent homes
Social rented
non-decent homes
Owner occupied
non-decent homes
Dwelling age
£10k
£8k £4k £1k
£6k £4k19%
Purpose built low rise flat
Social rented
37%
25%
13%
19%

Chapter 1 Profile of the English housing stock | 7
Chapter 1 Profile of the English housing stock
1.1 This chapter provides an overview of the housing stock in 2017, examining the age, type, size and location of homes by tenure. The second section reports on the prevalence of vacant homes by tenure and other dwelling characteristics.
Stock profile
1.2 In 2017, there were 23.9 million dwellings in England including vacant homes. Of these, 63% (15.1 million) were owner occupied, 20% (4.8 million) were privately rented, 7% (1.6 million) were owned by local authorities and 10% (2.5 million) were owned by housing associations, Annex Table 1.1.
1.3 Overall one fifth (21%) of the housing stock was built before 1919 while 17% of homes have been built since 1990.
1.4 The housing stock mainly comprised of houses and bungalows (80%), while purpose built low rise flats were by far the most common type of flat (14% of all dwellings). The remaining 6% of dwellings were purpose built high rise (2%) and converted flats (4%).
1.5 Homes most commonly had three bedrooms (41%) and the average (mean) usable floor area of dwellings was 94m². The largest homes of 110m² or more comprised 24% of all the housing stock while the smallest homes of less than 50m² were less common (10%).
Dwelling age, type and size by tenure
1.6 Owner occupied homes were generally larger than rented homes and had a higher proportion of detached houses (25%) and four bedroom dwellings (29%). Only a relatively small proportion of homes in this tenure were less than 50m² (3%) and just 8% were flats, Annex Table 1.1 and Figure 1.1.
1.7 Private and social rented homes had very different age, dwelling type and size profiles to each other and to owner occupied homes. Private rented homes, which most commonly comprised of two bedrooms, were more likely to be older with 35% built before 1919. The private rented sector had a higher proportion of terraced houses (36%) and converted flats (11%) than all other tenures but it did have a higher proportion of detached homes (6%) than the social rented stock (less than 1%).

8 | English Housing Survey Stock profile and condition, 2017
1.8 Most local authority homes (73%) were built between 1945 and 1980. Housing associations had a higher proportion of newer homes built after 1990 (26%) than all other tenures, particularly local authority homes (3%).
1.9 The most common dwelling type among social rented homes was a purpose built flat (41%), with local authorities owning the highest proportion of purpose built high rise flats (6%). Social rented homes tended to be smaller, 66m² on average, with around a third (31%) having one bedroom compared with 16% of private rented and 3% of owner occupied homes.
Figure 1.1: Number of bedrooms, by tenure, 2017
Base: all dwellings Note: underlying data are presented in Annex Table 1.1 Source: English Housing Survey, dwelling sample
Dwelling location by tenure
1.10 Most dwellings were located in suburban residential areas but owner occupied homes were more likely to be located in rural areas than rented homes. Around a fifth (21%) of owner occupied dwellings were located in rural areas compared with 12% of privately rented and 8% of social homes. In contrast 35% of privately rented and 25% of social rented homes were located in city centres compared with 13% of owner occupied homes, Annex Table 1.1.
0
10
20
30
40
50
60
pe
rce
nta
ge
owner occupied
0
10
20
30
40
50
60
one two three four orover
pe
rce
nta
ge
number of bedrooms
local authority
0
10
20
30
40
50
60p
erc
en
tag
e
private rented
0
10
20
30
40
50
60
one two three four orover
pe
rce
nta
ge
number of bedrooms
housing association

Chapter 1 Profile of the English housing stock | 9
1.11 A quarter of local authority (25%) and 21% of privately rented homes were located in London compared with 16% of housing association and 11% of owner occupied homes. A notably higher proportion of housing association homes (20%) were located in the North West region than all other tenures, Annex Table 1.1.
1.12 Overall, social rented homes were more likely to be located in the most deprived areas. Over half (52%) of local authority and 42% of housing association homes were located in the most deprived 20% of areas in England compared with 24% of privately rented and 11% of owner occupied dwellings. In contrast a quarter (25%) of owner occupied homes were located in the least deprived 20% of areas compared with just 3% of those owned by local authorities and 5% owned by housing associations. Private rented homes were more evenly distributed among areas, Figure 1.2.
Figure 1.2: Deprivation, by tenure, 2017
Base: all dwellings Note: underlying data are presented in Annex Table 1.1 Source: English Housing Survey, dwelling sample
0
10
20
30
40
50
60
pe
rce
nta
ge
owner occupied
0
10
20
30
40
50
60
mostdeprived
20%
2nd 3rd 4th leastdeprived
20%
pe
rce
nta
ge
local authority
0
10
20
30
40
50
60
pe
rce
nta
ge
private rented
0
10
20
30
40
50
60
mostdeprived
20%
2nd 3rd 4th leastdeprived
20%
pe
rce
nta
ge
housing association

10 | English Housing Survey Stock profile and condition, 2017
Vacant homes
1.13 There were an estimated 1.1 million vacant homes in England in 2017 which represented 5% of the total stock2, Annex Table 1.1. The EHS classifies properties between lets as vacant as well as those in long term vacancy. This estimate is higher than the more commonly reported estimate produced by MHCLG. The latter is based on Council Taxbase figures supplied by local authorities3.
1.14 Some types of homes were more likely to be vacant, including privately rented homes (10%), which tend to have a relatively higher turnover of occupants. Other dwellings more likely to be vacant include those built before 1919, purpose build high rise flats, converted flats, homes located in city centres and the smallest sized homes. These findings are perhaps not surprising given that the private rented sector has a notably larger proportion of these homes (bar the smallest sized homes) than other tenures, Figure 1.3.
Figure 1.3: Characteristics of homes more likely to be vacant, 2017
Base: all dwellings Notes:
1) percentages are within each group. For example, 10% of private rented dwellings were vacant 2) underlying data are presented in Annex Table 1.2.
Source: English Housing Survey, dwelling sample
2 Derelict homes are not surveyed as part of the EHS. 3 https://www.gov.uk/government/statistical-data-sets/live-tables-on-dwelling-stock-including-vacants
0 2 4 6 8 10 12
purpose built high rise flat
converted flats
private rented
less than 50 m²
one bedroom
city centres
built pre 1919
percentage

Chapter 2 Condition of the English housing stock | 11
Chapter 2 Condition of the English housing stock
2.1 The first part of this chapter provides an overview of the dwelling condition and safety of the housing stock in 2017. Three key indicators of housing quality are examined: Decent Homes Standard, Housing Health and Safety Rating System (HHSRS)4 and electrical safety.
2.2 The second part examines the prevalence of damp, inadequate ventilation and overheating in homes, investigating the relationship between these. The section on damp explores the findings from the physical survey and the prevalence of damp reported by households as part of the interview survey.
2.3 The chapter uses a 15-hazard model of HHSRS to analyse Decent Homes, and a 26-hazard model of HHSRS to analyse health and safety hazards. This is to maintain consistency with how these topics have been reported by MHCLG since 20085.
Decent Homes
2.4 For a dwelling to be considered ‘decent’ it must:
meet the statutory minimum standard for housing under the HHSRS. Homes with a Category 1 hazard under the HHSRS are considered non-decent
be in a reasonable state of repair
have reasonably modern facilities and services
provide a reasonable degree of thermal comfort
2.5 Through tenure, dwelling age, dwelling type and regional comparisons, this section examines which homes were less likely to meet the Standard, which criterion, or criteria, were most commonly not attained, and the extent to which the reasons for non-decency co-existed. Finally, it reports on the estimated cost to make non-decent homes meet the Standard and how this varied among different dwellings.
4 See HHSRS section of this chapter or the glossary for more detail on the HHSRS 5 From 2008 the EHS has assessed 26 of the 29 HHSRS hazards (see Live Table DA4101 for published data), but to maintain consistency and avoid a break in the time series, Decent Homes estimates published by MHCLG have always been based on the 15 hazards collected by the survey from 2006 onwards. See the glossary for further information on the Decent Homes Standard.

12 | English Housing Survey Stock profile and condition, 2017
2.6 In 2017, almost a fifth (19% or 4.5 million) of homes did not meet the Decent Homes Standard. From 2007 to 2017 there was a reduction in the prevalence of non-decent homes overall and for each criterion except modernisation. The most notable decreases were for the HHSRS (down from 22% to 11%) and thermal comfort (down from 15% to 7%) components, Live Table DA3201 and Annex Table 2.1.
2.7 Overall, homes owned by social landlords were less likely to fail than those in the private sector for each criterion except for modernisation. Privately rented homes were more likely than all other tenures to fail each criterion, apart from modernisation, Figure 2.1.
2.8 Owner occupied, private rented and local authority homes were more likely to be non-decent due to the HHSRS criterion. Housing association homes were, however, equally likely to fail the Standard due to the HHSRS or thermal comfort criteria.
Figure 2.1: Reasons for failing the Decent Homes Standard, by tenure, 2017
Base: all dwellings Note: underlying data are presented in Live Table DA3201 Source: English Housing Survey, dwelling sample
2.9 Although most non-decent homes failed due to one criterion (79%) for the remaining 21% of non-decent homes, reasons for failing the Standard co-
0
5
10
15
20
pe
rce
nta
ge
owner occupied
0
5
10
15
20
HHSRS repair modernfacilities
andservices
thermal comfort
pe
rce
nta
ge
local authority
0
5
10
15
20
pe
rce
nta
ge
private rented
0
5
10
15
20
HHSRS repair modernfacilities
andservices
thermal comfort
pe
rce
nta
ge
housing association

Chapter 2 Condition of the English housing stock | 13
existed; 18% failed two criteria (most commonly HHSRS and lack of thermal comfort) and 3% failed three or four criteria, Annex Table 2.4.
2.10 To examine the nature of overlapping criteria, non-decent homes failing either the disrepair or modernisation criteria have been combined into a single criterion due to smaller sample sizes. Where multiple criteria were failed, the most common overlap was between HHSRS and thermal comfort (13%)6, Figure 2.2.
Figure 2.2: Non-decent homes, by Decent Homes Standard criteria failed, 2017
Base: all non-decent dwellings Notes:
1) underlying data are presented in Annex Table 2.2. 2) for ease of analysis, modernisation and disrepair criteria have been combined to form a single criterion. For this reason, the figures for 'fails all criteria' will not match that for fails all four criteria as given in Annex Table 2.4
Source: English Housing Survey, dwelling sample
Characteristics of the non-decent stock
2.11 The proportion of non-decent homes within the stock varied by tenure and other dwelling characteristics. Private rented homes were most likely to be non-decent (25%) while the social sector (13%), particularly housing
6 This is created by adding the proportion of non-decent dwellings failing both HHSRS and thermal comfort (11%) with those failing all three criteria (3%). This equates to 13%, as the proportions presented in figure 2.2 are rounded.
HHSRS (39%)
thermal comfort (20%)
disrepair or modernisation (20%)
11%5%
1%
3%
14 | English Housing Survey Stock profile and condition, 2017
association homes (11%) had the lowest proportion of such homes, Live Table DA3201.
2.12 Overall, the older the dwelling, the more likely it was to be non-decent; over a third (36%) of dwellings built before 1919 were non-decent while only 2% of newer homes built after 1990 failed the Standard. An exception to the trend exists for dwellings built between 1981 and 1990. This may be partly due to a cyclical effect as these aged homes are crossing some Decent Homes modernisation age thresholds and may have yet to receive improvements7. Homes build between 1981 to 1990 also had a relatively lower proportion of wall insulation evident at the time of the physical survey, compared with other homes built from 1945 to 1980, likely contributing to a higher prevalence of thermal discomfort8.
2.13 Converted flats were more likely to be non-decent than all other types of dwellings. A third of converted flats (33%) failed the Standard. Among houses, terraced homes (21%) were most likely to be non-decent , Live Table DA3201.
2.14 There were also regional variations in the prevalence of non-decent homes. For example, homes located in the West Midlands (24%), Yorkshire and Humber (22%) and the East Midlands (21%) were more likely to be non-decent than those located in London (17%) and the South East (16%). Conversely homes in the North East were less likely to be non-decent (11%) than all other regions, Annex Table 2.3. These findings reflect the varied distribution of tenures, ages and types of dwellings in each region.
Reason(s) for failing the Decent Homes Standard
2.15 For most dwelling ages and types, failing the HHSRS criterion was the main reason for non-decency; the exceptions being those homes built from 1981 to 1990 (13%) and purpose built flats (11% purpose built low rise, 7% purpose built high rise) which most commonly failed because of a lack of thermal comfort. The proportion of each age and type of homes failing each criterion varied, Figure 2.3 and Live Table DA3201.
7 See EHS 2017-18 Technical report, Chapter 5, Annex 5.5 for more information on Decent Homes modernisation criteria. 8 Live Tables DA6210 for wall insulation data and Figure 2.2 for the prevalence of thermal discomfort.

Chapter 2 Condition of the English housing stock | 15
Figure 2.3: Reason for failing the Decent Homes Standard, by dwelling age, 2017
Base: all dwellings Notes:
1) uses 15-hazard HHSRS model 2) underlying data are presented in Live Table DA3201 3) the data for post 1990 repair, modernisation and thermal comfort have been presented as zero due to small sample sizes
Source: English Housing Survey, dwelling sample
2.16 There were some regional variations for the most common criterion failed.
The HHSRS criterion was the main reason for non-decency for most regions but homes in London, the South East and South West were equally likely to fail due to a lack of thermal comfort. The proportion of homes failing each criterion within each region also varied due to different profile of dwelling ages and dwelling types, Annex Table 2.3.
2.17 Private rented homes, those built before 1919 and converted flats were more likely to fail on at least two criteria, Annex Table 2.4. These homes ware also among those more likely to have failed on a single criterion only.
Lack of thermal comfort
2.18 Overall, of the 4.5 million homes that failed to meet the Standard, 80% failed because they failed the HHSRS, repair or modernisation criteria, while the remaining 20% or 916,000 failed due to a lack of thermal comfort, but passed all other criteria. These proportions varied by tenure and dwelling characteristics, Annex Table 2.5.
2.19 Including dwellings failing multiple criteria a total of 1.6 million dwellings failed the thermal comfort criterion. Of these 64% failed on insulation measures only, 21% failed on heating measures only and 15% failed on both heating and insulation measures, Annex Table 2.6.
0
5
10
15
20
25
30
HHSRS repair modernisation thermal comfort
pe
rce
nta
ge
pre-1919 1919-44 1945-64 1965-80 1981-90 post 1990

16 | English Housing Survey Stock profile and condition, 2017
2.20 Around 1.4 million private sector homes failed the thermal comfort criterion as did 177,000 social sector homes. The reasons for failing thermal comfort varied between private and social homes. Private sector dwellings were more likely to have thermal discomfort because of heating measures only (23% compared with 7% of social homes). In contrast social homes were more likely to fail due to insulation measures only (76% compared to 62% of private sector homes).
Cost to make homes decent
2.21 In 2017, the estimated average cost to make non-decent homes meet the Decent Homes Standard was £7,211. Average costs varied by tenure and other dwelling characteristics, Annex Table 2.7.
2.22 Overall, the average cost was higher for non-decent homes in the private sector (£7,484) than for those in the social sector (£5,102).
2.23 Generally speaking, the older the dwelling the more expensive it would be to undertake repair work to meet the Standard: for non-decent pre-1919 homes, the average cost was £9,991 compared with £1,209 for homes built after 1990.
2.24 Houses (£7,519) were more expensive to make decent on average than flats (£6,112). Dwelling size may be a factor for some variations in average costs as the largest homes with a floor area of 110m² or over had a higher average cost (£9,820) than homes less than 90m² (range £6,083 to £6,256). Converted flats (£8,972) had the highest average costs among flats.
HHSRS
2.25 The HHSRS9 is the Government’s risk-based assessment tool that identifies hazards in dwellings and evaluates their potential harmful effects (both likelihood and severity) on the health and safety of occupants and their visitors. The system provides a means of rating the seriousness of any hazard so that it is possible to differentiate between minor hazards and those where there is an imminent threat of major harm10. The most serious hazards are called Category 1 hazards.
2.26 In making HHSRS assessments surveyors are instructed to ignore the current occupancy at the dwelling and assume that a member of the age group most vulnerable to the particular hazard lives there, for example, for falls on stairs
9 For more information on the HHSRS see the EHS Technical Report 2017-18, Chapter 5, Annex 5.5. 10 The HHSRS has a scoring procedure (a mathematical formula) that uses the surveyor’s assessment of the likelihood of a harmful event occurring due to the hazard and the likely severity of health outcome(s) or harms which would result from that event. The scoring procedure generates a numerical hazard score; the higher the score, the greater the severity of that hazard.

Chapter 2 Condition of the English housing stock | 17
and falls on the level the vulnerable group is defined as persons over 60 years. A worked example of an HHSRS assessment for the risk of harm from a fall on stairs is provided at the end of this section.
2.27 This section examines the prevalence of Category 1 hazards in the stock before reporting on the most common types of hazards where the risks to health and safety were assessed as significantly higher than average (such risks include Category 1 hazards).
2.28 In 2017, 11% of homes had at least one Category 1 hazard, down from 23% in 200811. This proportion varied by tenure and dwelling characteristics, Live Table DA4101.
2.29 Private rented homes (14%) were more likely to have Category 1 hazards than homes in other tenures, particularly social rented homes (6%). Within the social sector, housing association homes (4%) were less likely to have such hazards than local authority homes (8%).
2.30 There was a general relationship between the age of dwelling and the prevalence of Category 1 hazards; the older the home, the more likely it was to have at least one of these hazards. The only exception is that homes built between 1981 and 1990 were equally likely to have a Category 1 hazard than those built between 1965 and 1980.
2.31 Overall, houses (12%) were more likely to have Category 1 hazards than flats (8%) but converted flats (21%) were more likely to have such hazards than all other dwelling types.
2.32 Although not detailed here there were also regional variations in the prevalence of Category 1 hazards, reflecting the distribution of tenures, ages and types of dwellings, Annex Table 2.8.
2.33 The most common Category 1 hazards were: falls on stairs, falls on the level, and falls between levels, followed by fire. Of those hazards assessed as having a significantly higher than average risk of harm, only a minority were severe enough to be classified as Category 1. For hazards relating to: domestic hygiene, personal hygiene, and falls associated with baths, less than 5% of homes with a significantly higher than average risk of harm had a Category 1 hazard, Figure 2.4.
11 Live Table DA3201

18 | English Housing Survey Stock profile and condition, 2017
Figure 2.4: Dwellings with Category 1 hazards and hazards with a significantly higher than average risk of harm, 2017
Base: all dwellings Notes:
1) uses 26 hazard HHSRS model 2) underlying data are presented in Annex Table 2.9 3) Category 1 hazards for falls associated with baths presented as zero due to small sample size
Source: English Housing Survey, dwelling sample
0 200 400 600 800 1,000 1,200 1,400 1,600 1,800
falls on stairs
falls on the level
falls between levels
fire
damp and mould growth
flames and hot surfaces
electrical safety
domestic hygiene
personal hygiene
falls associated with baths
thousands of dwellings
Category 1 hazard
significantly higherthan average risk(but not Category 1 hazard)

Chapter 2 Condition of the English housing stock | 19
Worked example of HHSRS assessment - falls on stairs
2.34 This dwelling is a two bedroom Victorian terraced house with a stair case providing access from the ground floor to the first floor bedrooms12.
2.35 There are features which result in the home having a significantly higher than average risk of a harmful event occurring from a fall. These are:
Missing guarding on the right-hand side and no hand rail which could lead to a fall from height
Steep stairs
Bedroom doors open straight onto the top step of the stairs
Tiled floor at base of stairs (a hard surface to fall on)
Landing light switch at the base of the stairs only, giving a greater risk of a fall, particularly at night.
2.36 The most vulnerable person to consider is 60 years or over. The probability of someone of this age incurring harm from fall within the next 12 months is higher than the national average13. Furthermore, the probability of having the most severe harm outcome (e.g. permanent paralysis) is higher than average, as is the risk of serious outcomes such as a hip fracture or less serious outcomes such as bruises and sprains.
2.37 The home would be assessed as a Category 1 hazard and so would fail to meet the statutory minimum standard for housing. To remedy the Category 1 hazard so that the risk of a harmful event is no higher than average, the EHS surveyor would recommend that a handrail, balustrade and additional lighting all be installed14.
12 Pictures are from BRE photo library 13 As set out in national guidance https://www.gov.uk/government/collections/housing-health-and-safety-rating-system-hhsrs-guidance 14 Recommendations are recorded on the EHS form; the surveyor does not offer advice to the resident.

20 | English Housing Survey Stock profile and condition, 2017
Electrical safety
2.38 In 2017, 62% of homes had all five electrical safety features15 but provision varied among dwellings. All five measures were more likely to be present in social rented homes (73%) while a similar proportion of owner occupied (60%) and private rented homes (61%) had all five safety features, Live Table DA5201.
2.39 Perhaps not surprisingly, the newest homes built after 1990 were most likely to have all five safety features (76%) compared with 58% to 62% of other homes depending on the age band.
2.40 Purpose built low rise flats (65%) were more likely to have all five features than terraced houses, semi-detached houses, bungalows (all 61%) and converted flats (57%). Converted flats (57%) were also less likely to have all five features compared with high rise flats (67%) and detached houses (64%).
2.41 There were also regional variations in the prevalence of all five electrical safety features. Homes in the South East (71%) were more likely to have all five features than homes in all other regions. Homes in the Yorkshire and Humber and the South West (both 55%) were less likely to have all five features than many other regions, Annex Table 2.8.
Damp
2.42 This final part of the chapter has several sections. It reports on;
the presence of damp in homes using the surveyor findings from the physical survey and the prevalence of damp reported by households as part of the interview survey
the characteristics of dwellings with a higher prevalence of damp
damp and ventilation
characteristics of households that were more likely to live in damp homes
subjective overheating
subjective overheating and ventilation
Damp in homes
15 These are: modern PVC wiring, modern earthing, modern consumer unit casing, miniature circuit breakers and residual current devices. It may not be possible for the surveyor to identify the presence of each electrical safety feature (e.g. problems in accessing the garage) so there will be some unknown cases within the dwelling stock.

Chapter 2 Condition of the English housing stock | 21
2.43 This section compares the surveyors assessment of damp on the day of survey to the household’s experience of damp and mould. We would not expect these reports to be the same since the surveyors report a snapshot observation whilst householders report more generally. The analysis in this section has used two years of combined physical and interview survey data to examine two different measures.
2.44 In 2017, according to the physical survey, 4% of homes (897,000 dwellings, including vacant homes) had problems with damp, most commonly condensation or mould (510,000 or 2%). A smaller proportion of homes had penetrating damp (309,000 or 1%) and rising damp (307,000 or 1%)16.
2.45 In contrast, around 7.0 million (30%) households reported an issue with condensation, damp or mould in their home; 15% reported that the problems occurred in the winter only, 13% reported that damp occurred all year round and 2% reported the problems occurred at some other time, Annex Table 2.10.
2.46 Among the 7.0 million households who reported damp problems, the vast majority (90%) said the damp had been present since they started living in their home, while 7% said the problems started after the property was insulated, and 3% said the problems got worse after the property was insulated.
2.47 Households were more likely to report damp than surveyors were to assess it, however almost a quarter (23%) of households who lived in a damp home, according to a surveyor assessment, did not report a problem with damp, Annex Table 2.11.
Characteristics of the homes with damp
2.48 There was a relationship between the energy efficiency of the dwelling and the presence of damp; the higher the energy efficiency rating (EER)17, the lower the likelihood of damp being present. Just 2% of homes in EER bands A to C had damp compared with 11% of homes in EER bands F or G. This trend was evident for the both rising damp and penetrating damp, suggesting that dwelling age is a key driver for the findings; older homes tend to have higher levels of disrepair (potentially contributing to these types of damp) and are generally less energy efficient, Figure 2.518.
16 EHS Headline report, 2017-18, Annex Table 2.4 17 See glossary for further information. 18 The EHS Energy Report 2014, Chapter 4, reports on exploratory analysis on the relationship between energy efficiency measures and condensation and mould growth https://www.gov.uk/government/statistics/english-housing-survey-2014-energy-report

22 | English Housing Survey Stock profile and condition, 2017
2.49 Damp was present in 5% of homes without wall insulation19 compared with 2% of homes with insulated walls. Furthermore, insulated walls were less likely to have all three types of damp.
2.50 Dwellings were less likely to have damp problems if they had double glazing. Damp was present in 3% of homes with at least 80% of windows double glazed compared with 7% of other homes. While the trend was similar for both rising and penetrating damp, this was not the case for serious condensation and mould.
Figure 2.5: Damp, by energy efficiency rating and measures, 2017
Base: all dwellings Note: underlying data are presented in Annex Table 2.12 Source: English Housing Survey, dwelling sample
2.51 There was no difference in the likelihood of a dwelling having damp by the type of heating system (central heating, storage heating or fixed room heaters)20, Annex Table 2.12.
2.52 Overall, rented homes were more likely to have damp problems than owner occupied homes. Some 7% of private rented homes had some type of damp
19 See glossary for more information on types of wall insulation. 20 See glossary for more information on heating systems.
0 2 4 6 8 10 12
A-C
D
E
F-G
less than 80% double glazed
80% or more double glazed
uninsulated wall
insulated wall
other wall type
percentage

Chapter 2 Condition of the English housing stock | 23
compared with 6% of social rented dwellings and 2% of owner occupied dwellings, Live Table DA5101.
2.53 The oldest homes built before 1919 were most likely to have damp (8%) as were terraced houses (6%) and converted flats (7%), both of which contained a relatively higher proportion of the oldest homes.
Damp and ventilation21
2.54 Around 154,000 dwellings (less than 1% of the housing stock) had problems with room ventilation in one or more of the surveyed rooms. This small sample size limits the level of detail possible in analysing homes with this issue, Annex Table 2.13.
2.55 There is some indication of a relationship between damp problems and inadequate room ventilation, although it is important to bear in mind that the sample size for homes with inadequate ventilation is small. Some 26% of homes with ventilation problems had damp compared with just 4% of other dwellings.
2.56 Homes with working extractor fans in the kitchen and/or bathroom were less likely to have problems with damp in the home. Some 3% of homes with a working extractor fan in the kitchen had problems with damp compared with 5% of those without this feature. The figures were very similar for having a working extractor fan in the bathroom.
2.57 Those households who reported having damp problems were asked about using ventilation to mitigate against the damp; the vast majority (92%) opened windows, 35% used extractor fans and 18% used trickle vents, Annex Table 2.14.
Characteristics of the households living in damp homes22
2.58 In 2017, 871,000 households (4%) lived in a home with some form of damp problem. Certain types of households were more likely to live in a damp home; these included younger households, larger households, overcrowded households, and those with lower incomes, Annex Table 2.15 and Table 2.1.
2.59 Households with a Black HRP23 (7%) were more likely to live in a damp home than households with a white HRP (4%). The reasons for the difference are
21 In the EHS survey, a room is assessed as having inadequate ventilation where windows are permanently fixed (painted, screwed or nailed shut) and there is no other adequate form of ventilation to the room. This also includes rooms where window openings are too small or too poorly positioned to allow proper ventilation. 22 This analysis uses the surveyors’ assessment of damp in the home. 23 The HRP is the ‘householder’ in whose name the accommodation is owned or rented (see the glossary for further information).

24 | English Housing Survey Stock profile and condition, 2017
likely to be complex and will reflect the interrelated tenure and socio-economic differences of each group.
Table 2.1: Characteristics of households who were more, or less, likely to live in a damp home, 2017
Notes:
1) percentages are within each group. For example, 5% of households with the lowest 20% of incomes had a damp problem while 95% of them do not. 2) underlying data are presented in Annex Table 2.15 and Live Table DA5103. 3) income measure is before housing costs (see Glossary)
Source: English Housing Survey, household sub-sample
2.60 Households who found it more difficult to keep their living room warm (1.9 million) and those who found it fairly difficult (2.0 million) or very difficult (656,000) to meet their heating costs were more likely to live in damp homes, Annex Table 2.16.
2.61 Damp was more prevalent in households who could not keep their living room warm (9%) compared with other households (3%).
2.62 Overall, 9% of households who found it very difficult to meet their heating costs had damp as did 7% who found it fairly difficult compared with 2% of households who found it very easy to meet their heating costs. This trend was evident for each type of damp.
all households
household characteristicsbelow the bedroom standard 10 above the bedroom standard 3
six person households 8 single person households 4five person households 7 two person households 3black HRP households 7 white HRP households 4
age of HRP 25-34 years 5 age of HRP 65 -74 years 2age of HRP 35-44 years 5 age of HRP 75 years or over 2
lowest 20% incomes 5 highest 20% incomes 1
households in receipt of means tested benefits
5households not in receipt of means
tested benefits3
dampness more prevalent
dampnessless prevalent
percentages
Chapter 2 Condition of the English housing stock | 25
Overheating
2.63 The EHS collects data on the prevalence of overheating in homes in two different ways. Firstly, the survey assesses the potential risk of harm from excessively high indoors temperatures as part of the HHSRS24. In 2017, the EHS estimated that around 57,000 occupied homes had a significantly higher than average risk of harm from excess heat, Annex Table 2.17.
2.64 Secondly, during the physical survey of the home, occupants were asked whether their home got uncomfortably hot even when their heating was turned off and the windows were open. Some 1.6 million (7%) households stated that at least one part of their home got uncomfortably hot in such conditions, Annex Table 2.18.
2.65 In roughly half of homes (51%) where the surveyor assessed that the risks of harm from excess heat were higher than average, the occupants also reported an issue with overheating Annex Table 2.17.
2.66 As the sample size for homes with a serious risk of harm from excess heat is small, the next section focuses on the subjective overheating reported by households.
Dwelling characteristics
2.67 Subjective overheating did not vary by tenure or by dwelling type but there were variations by dwelling age and some energy efficiency characteristics of homes.
2.68 Homes built after 1980 (9%) and those built between 1965 and 1980 (8%) were more likely to be reported as uncomfortably hot compared with all other aged homes (6%)25.
2.69 Households living in the most energy efficient homes (EER rating A-C) were more likely to report that their home got uncomfortably hot (8%) than households living in homes with an EER rating of E or lower (6%), Annex Table 2.18.
2.70 Homes with wall types other than solid or cavity walls (for example, timber framed, concrete or steel) were more likely to feel uncomfortably hot (9%) than either insulated (8%) or uninsulated walls (6%).
24 For this assessment surveyors are required to ignore the current occupancy at the dwelling and assume that a member of the group most vulnerable to excess heat, people aged 65 years or over, live at property. Surveyors consider several building characteristics that affect the potential harm from excess heat including; orientation of the glazing, thermal insulation, ventilation provision to dissipate heat, any defects to the heating system or heating controls. 25 EHS Headline report, 2017-18, Annex Table 2.15.

26 | English Housing Survey Stock profile and condition, 2017
2.71 There were no differences in the prevalence of reported overheating according to the extent of double glazing and key types of primary heating controls (overall on/off switch and boiler thermostat control).
Household characteristics
2.72 Overall, subjective overheating was equally likely to be reported among most types of households but the youngest, oldest and ethnic minority households were less likely to report that their home got uncomfortably hot.
2.73 Households where the HRP was aged 16 to 24 years (6%) and 75 years or over (4%) were less likely to report overheating than other age groups, Annex Table 2.19.
2.74 Some 4% of households with an Asian HRP and 5% of households with a black HRP reported overheating compared with 7% of households with a white HRP.
Overheating and ventilation
2.75 One quarter (25%) of homes with inadequate room ventilation were reported as uncomfortably hot by households compared with 7% of those whose homes were assessed as having adequate ventilation. The findings, however, need to be considered with caution as the sample size for homes with inadequate room ventilation was small, Annex Table 2.18.

Chapter 3 Fire safety measures | 27
Chapter 3 Fire safety measures
3.1 The first part of this chapter examines the characteristics of homes that were assessed as having a significantly higher than average risk of harm from fire under the HHSRS. It then looks at the prevalence of working smoke alarms in homes and how this varied by dwelling characteristics and dwelling location. The final section explores the presence of fire precaution measures for flats with common areas.
Fire hazards
3.2 An assessment of fire hazards under the HHSRS26 covers the threat of harm to an individual from exposure to uncontrolled fire and associated smoke at the dwelling. EHS surveyors assess many factors which impact on both the likelihood of any harm arising from a fire and on the likely severity of this potential harm. The source of fire, the chances of fire spreading and means of escape are all components of their assessment.
3.3 In making HHSRS fire assessments, surveyors ignore the current occupancy at the dwelling and assume that the property is occupied by a person of the most vulnerable age group (over 60 years). A worked example of an HHSRS fire assessment is provided at the end of this chapter27.
3.4 For this report, a serious fire hazard exists where the risk of harm from fire is assessed to be significantly higher than average as part of the HHSRS assessment.
3.5 In 2017, around 5% of homes (1.1 million) had a serious fire hazard (such as no smoke alarms, old or faulty electrical systems, or missing fire doors), including 0.5% (118,000) of homes that had the most serious risk of harm; a Category 1 fire hazard, Annex Table 3.1.
3.6 Serious fire hazards were most likely to be present in privately rented homes (7%) but were least common among housing association homes (1%). These findings partly reflect the different mix of dwelling age and dwelling type profiles by tenure, Annex Table 3.2.
26 See EHS Technical Report 2017-18, Chapter 5, Annex 5.5 for more information on the HHSRS. 27 Another worked example is provided in the EHS Technical Report 2017-18, Chapter 5, Annex 5.5.

28 | English Housing Survey Stock profile and condition, 2017
3.7 The oldest homes were most likely to have serious fire hazards. Homes built before 1919 (10%) were more likely to have such hazards than all other aged homes. Furthermore, homes built from 1919 to 1944 were more likely to have a serious fire hazard than homes built from 1945 onwards. Just 1% of the homes built post 1990 had a serious fire hazard.
3.8 The prevalence of serious fire hazards varied by the type of dwelling with houses (5%) generally more likely to have these than flats (3%).
3.9 Mid terraced houses (8%) were more likely to have serious fire hazards than other types of houses (apart from end terraces) and purpose built flats. Conversely, bungalows and detached homes (both 2%) were less likely to have such hazards than other types of houses, Figure 3.1.
Figure 3.1: Serious fire hazards, by dwelling type, 2017
Base: all dwellings Note: underlying data are presented in Annex Table 3.2 Source: English Housing Survey, dwelling sample
0 2 4 6 8 10
mid terrace
converted flat
end terrace
semi detached
purpose built flat, low rise
detached
purpose built flat, high rise
bungalow
percentage

Chapter 3 Fire safety measures | 29
Smoke alarms28
3.10 Smoke alarms are critical for the early detection of fire and EHS surveyors consider the presence of these alarms as part of their HHSRS fire assessments.
3.11 In 2017-18, 90% of all households had at least one working smoke alarm although this proportion varied by tenure. Housing association tenants (96%) were most likely to have at least one working smoke alarm compared with 93% of local authority renters, 89% of owner occupiers and 89% of private renters29.
3.12 Generally speaking, households living in older homes were less likely to have a working smoke alarm. Some 87% of households in homes built before 1919 or between 1919 and 1944 had at least one working smoke alarm compared with 96% of households living in the newest homes built after 1990, Live Table DA2301.
3.13 There were also some regional variations in the prevalence of working smoke alarms; for example, households living in London were less likely to have at least one working smoke alarm (87%) than households living in many other regions including those in the East (92%), East Midlands (91%) North West (90%), South East (91%) and the South West (92%) Annex Table 3.3.
Fire safety measures in communal areas
3.14 In 2017, there were 3.6 million flats with common parts (such as corridors, lifts, lobbies)30 and for 3.2 million of these, the escape route from the dwelling to the final exit was through these common parts31. This section reports on the presence of some communal fire precautions32 for these 3.2 million flats and on how this varied by the type and tenure of the flat, Annex Table 3.4.
28 The analysis for the overall prevalence of working smoke alarms and how this varied by tenure uses the EHS 2017-18 full household sample. Analysis for the age, type and location of home uses the combined year physical and interview data. 29 EHS Headline Report 2017-18, Annex Table 2.16. 30 In most cases the flat that has been surveyed will be in a module which has common parts and for these flats the survey collects data on fire safety features. However, some flats will be situated in modules where some or all flats have their own private access, and, in such cases, no common parts will exist. 31 This also includes flats with an escape route through another flat and common parts, although this was far less common. For the remaining 419,000 flats without common parts, the means of escape is directly from the dwelling without going through common parts. 32 The EHS is a non-intrusive survey and surveyors do not do any testing of fire protection materials or measures. Furthermore, the surveyor’s assessment of fire safety for flats with common parts is not a full assessment of the suitability or adequacy of the fire safety measures against current Building Regulations or standards adopted by local authorities under their statutory obligations.
30 | English Housing Survey Stock profile and condition, 2017
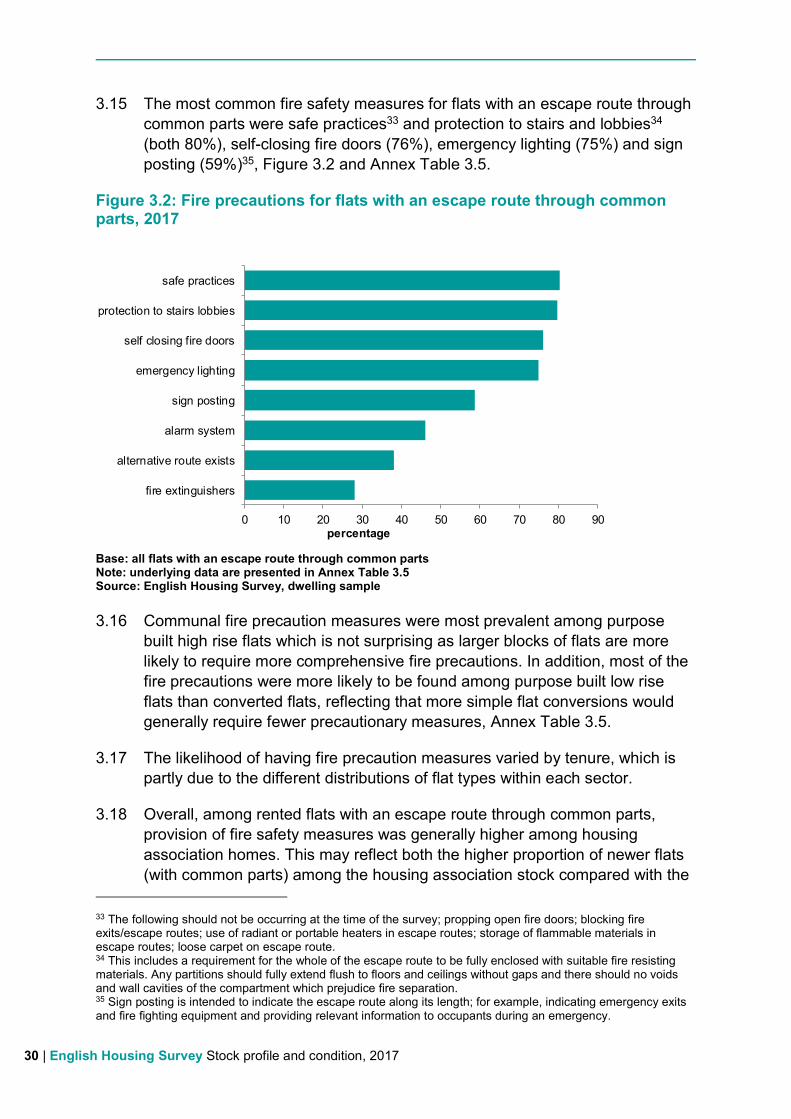
3.15 The most common fire safety measures for flats with an escape route through common parts were safe practices33 and protection to stairs and lobbies34 (both 80%), self-closing fire doors (76%), emergency lighting (75%) and sign posting (59%)35, Figure 3.2 and Annex Table 3.5.
Figure 3.2: Fire precautions for flats with an escape route through common parts, 2017
Base: all flats with an escape route through common parts Note: underlying data are presented in Annex Table 3.5 Source: English Housing Survey, dwelling sample
3.16 Communal fire precaution measures were most prevalent among purpose
built high rise flats which is not surprising as larger blocks of flats are more likely to require more comprehensive fire precautions. In addition, most of the fire precautions were more likely to be found among purpose built low rise flats than converted flats, reflecting that more simple flat conversions would generally require fewer precautionary measures, Annex Table 3.5.
3.17 The likelihood of having fire precaution measures varied by tenure, which is partly due to the different distributions of flat types within each sector.
3.18 Overall, among rented flats with an escape route through common parts, provision of fire safety measures was generally higher among housing association homes. This may reflect both the higher proportion of newer flats (with common parts) among the housing association stock compared with the
33 The following should not be occurring at the time of the survey; propping open fire doors; blocking fire exits/escape routes; use of radiant or portable heaters in escape routes; storage of flammable materials in escape routes; loose carpet on escape route. 34 This includes a requirement for the whole of the escape route to be fully enclosed with suitable fire resisting materials. Any partitions should fully extend flush to floors and ceilings without gaps and there should no voids and wall cavities of the compartment which prejudice fire separation. 35 Sign posting is intended to indicate the escape route along its length; for example, indicating emergency exits and fire fighting equipment and providing relevant information to occupants during an emergency.
0 10 20 30 40 50 60 70 80 90
fire extinguishers
alternative route exists
alarm system
sign posting
emergency lighting
self closing fire doors
protection to stairs lobbies
safe practices
percentage

Chapter 3 Fire safety measures | 31
local authority stock, and the far higher proportion of converted flats in the private rented stock, Table 3.6.
3.19 For most of the measures, provision was similar among private rented and local authority flats. There was also similar provision among owner occupied and housing association homes.
Table 3.1: Fire safety measures for flats with an escape route through common parts, by tenure, 2017
Notes:
1) multiple responses possible and these measures only apply where the escape route goes through common areas 2) underlying data are presented in Annex Table 3.6
Source: English Housing Survey, dwelling sample
all flats with an escape route through common areas
owner occupied
private rented
local authority
housing association
all dwellings
percentages
fire safety in communal areassafe practices 80.0 78.1 77.8 86.2 80.3protection to stairs/lobbies 87.0 74.6 73.0 84.2 79.7self closing fire doors 85.2 70.6 67.2 80.1 76.0emergency lighting 78.5 73.6 67.3 78.3 74.9sign posting 61.5 55.8 48.9 66.7 58.6alarm system 46.5 50.8 24.8 53.0 46.1alternative route 43.6 31.3 40.5 40.7 38.0fire extinguishers 33.4 28.0 18.2 29.1 28.1
all dwellings in group (thousands) 838 1,156 510 713 3,217

32 | English Housing Survey Stock profile and condition, 2017
Worked example of HHSRS fire assessment
3.20 This is a mid-terrace property with a third floor attic bedroom36. The staircase is accessed from the kitchen. The heating is from room heaters. Gas fires heat the ground floor rooms while heating for the bedrooms is provided by portable electric heaters. There are no smoke detectors.
3.21 The most vulnerable age group to consider is people of 60 years or over. There are features which result in the home having a significantly higher than average risk of a harmful event occurring from fire. These are:
No smoke detectors so the occupiers will not be aware of a fire starting and the severity of harm would likely be increased.
There is no means of escape from the bedrooms without passing through the kitchen where a fire is most likely to start. The probability of harm is therefore higher to reflect an increased risk of death or serious injury.
The design of the windows mean that they are difficult to escape through and the bedroom on the third floor would present occupiers with a reduced chance of an early escape.
There is a reliance on room heaters.
Insufficient electrical sockets in the bedrooms.
3.22 The home would be assessed as a Category 1 hazard. In order to remedy the Category 1 hazard so that the risk of a harmful event is no higher than average, the EHS surveyor would recommend the following37; provision of additional electrical sockets to the bedrooms, replacement of the heaters to the living rooms, installation of smoke detectors and providing windows which allow means of escape to the main bedrooms.
36 Pictures are from BRE photo library. 37 Recommendations are recorded on the EHS form; the surveyor does not offer advice to the resident.

Chapter 4 Focus on high rise dwellings | 33
Chapter 4 Focus on high rise dwellings
4.1 This chapter focuses on the stock profile, condition and safety, including fire safety, of high rise flats (i.e. flats in a block with six or more storeys). It compares high rise flats with houses and two types of low rise flats; those in a block of three storeys or less, and those in a block of four to five storeys. Basement flats and converted flats are mainly located in blocks of three storeys or less. This approach follows that undertaken for the EHS Households Report 2017-18 which examines the profile and well-being of households living in high rise homes.
4.2 Findings for stock condition and safety are examined by tenure and by the regional location of dwellings. As the number of high rise flats is relatively small, the analysis is based on data collected over three years (2015-16, 2016-17 and 2017-18), but for ease of reporting is referred to as ‘2017’.
Overview
4.3 In 2017, there were around 487,000 high rise flats (those in blocks of six or more storeys), comprising just 2% of the total dwelling stock. Around 203,000 of these were in blocks of 10 or more storeys, Annex Tables 4.138.
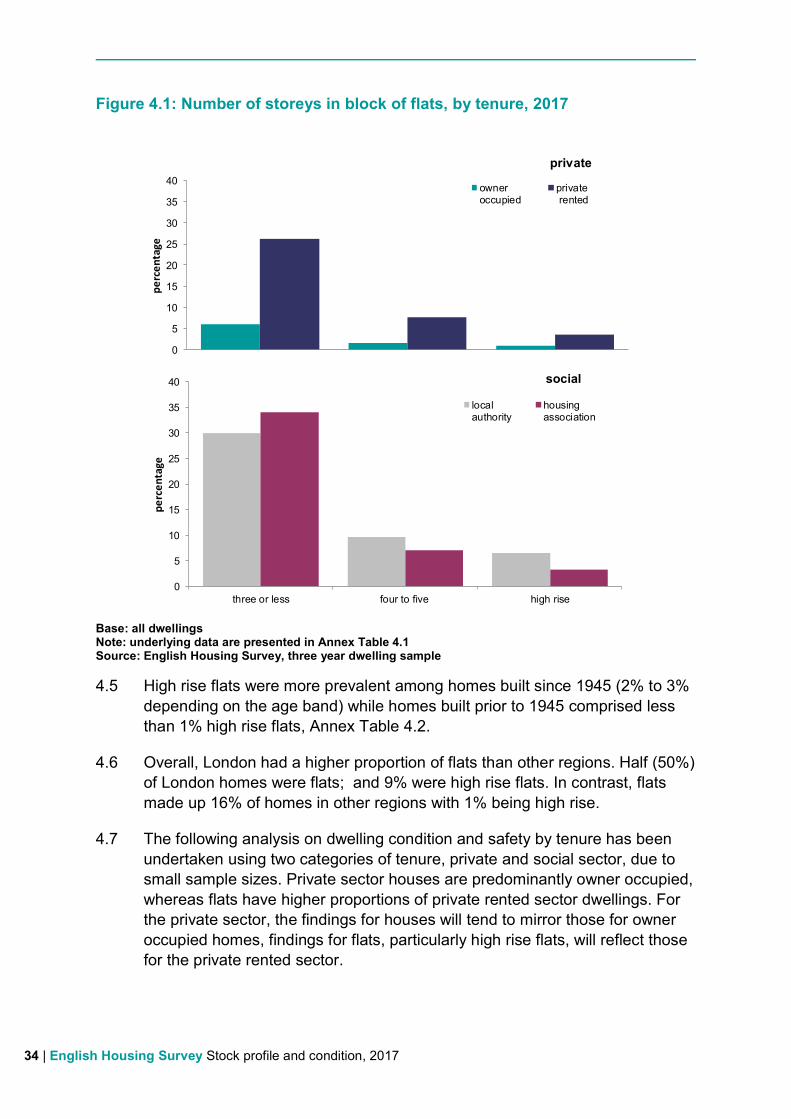
4.4 Some 6% (105,000) of local authority homes were high rise flats compared with 4% (171,000) of private rented and 3% (79,000) of housing association homes. Just 9% of owner occupied dwellings were flats and just 1% (133,000) were high rise flats, Figure 4.1.
38 The data for the number and percentage of high rise flats in the stock will differ from AT1.1 of this report and EHS Headline Report 2017-18, AT2.1, both of which use two years of physical survey data. For this chapter, high rise flats in blocks of six or more storeys will also include a small number of converted flats.
34 | English Housing Survey Stock profile and condition, 2017
Figure 4.1: Number of storeys in block of flats, by tenure, 2017
Base: all dwellings Note: underlying data are presented in Annex Table 4.1 Source: English Housing Survey, three year dwelling sample
4.5 High rise flats were more prevalent among homes built since 1945 (2% to 3% depending on the age band) while homes built prior to 1945 comprised less than 1% high rise flats, Annex Table 4.2.
4.6 Overall, London had a higher proportion of flats than other regions. Half (50%) of London homes were flats; and 9% were high rise flats. In contrast, flats made up 16% of homes in other regions with 1% being high rise.
4.7 The following analysis on dwelling condition and safety by tenure has been undertaken using two categories of tenure, private and social sector, due to small sample sizes. Private sector houses are predominantly owner occupied, whereas flats have higher proportions of private rented sector dwellings. For the private sector, the findings for houses will tend to mirror those for owner occupied homes, findings for flats, particularly high rise flats, will reflect those for the private rented sector.
0
5
10
15
20
25
30
35
40
percen
tage
private
owneroccupied
private rented
0
5
10
15
20
25
30
35
40
three or less four to five high rise
percen
tage
social
localauthority
housingassociation

Chapter 4 Focus on high rise dwellings | 35
Dwelling condition
4.8 The following section examines the condition and safety of high rise flats and compares this with other homes using key housing quality indicators: Decent Homes Standard, damp, disrepair, HHSRS and electrical safety. Overall the findings demonstrate that high rise flats were no more likely to be in poorer condition than other types of homes. Furthermore, they were less likely to have serious disrepair than houses and low rise flats in blocks of three storeys or less, Figure 4.2.
Figure 4.2: Dwelling condition and safety, by dwelling type, 2017
Base: all dwellings Note: underlying data are presented in Annex Table 4.3 Source: English Housing Survey, three year dwelling sample
4.9 Although the private sector as a whole, and the private rented sector in particular, had a higher proportion of homes with poorer housing conditions
0
5
10
15
20
25
30
pe
rce
nta
ge
non-decent
0
5
10
15
20
25
30
house threeor less
four tofive
high rise
pe
rce
nta
ge
seriousdisrepair
0
5
10
15
20
25
30
pe
rce
nta
ge
damp
0
5
10
15
20
25
30
house threeor less
four tofive
high rise
pe
rce
nta
ge
Category 1 hazard

36 | English Housing Survey Stock profile and condition, 2017
than the social sector, this was not the case for high rise flats. As the following sections show, private sector high rise flats were either equally likely, or less likely, to have each indicator of poorer housing than social sector high rise flats. The findings may reflect the different age profiles of high rise flats in each tenure39.
Decent Homes
4.10 Around a fifth (19%) of all dwellings failed to meet the Decent Homes Standard in 201740. Overall, high rise flats were no more likely to be non-decent than houses or low rise flats.
4.11 Across the whole stock 15% of all high rise flats were non-decent, and were as likely to fail the Standard as houses (19%) or flats in blocks of four to five storeys (17%)41. Furthermore, high rise flats were less likely to be non-decent than flats in blocks of three or less storeys (21%). These findings were also observed in the private sector42 and may be due to the higher proportion of converted flats among the private rented stock; converted flats being more likely to be non-decent than all other types of dwelling43.
4.12 In contrast, there was no difference in the proportion of non-decent homes by dwelling type among social rented homes, Annex Table 4.5.
4.13 Although social rented homes were generally less likely to be non-decent than those in the private sector, this was not the case for high rise flats. Some 15% of high rise flats in both the private and social sector failed to meet the Standard, Annex Tables 4.4 and 4.5.
4.14 Overall, dwellings in London were less likely to be non-decent (16%) than those located in other regions (20%); the main driver behind this difference was the varied prevalence of non-decent flats in blocks of four to five storeys (12% in London, 26% outside London), Annex Tables 4.6 and 4.7.
4.15 High rise flats in London were less likely to be non-decent (12%) than flats in blocks with three storeys or less (22%). Outside of London all dwelling types were equally likely to be non-decent44, Annex Tables 4.6 and 4.7.
39 See Annex Table 4.9 40 EHS Headline Report 2017-18, Annex Table 2.2 41 The apparent differences between the three types of dwellings were not statistically significant. 42 Annex Table 4.4. 43 Live Table DA3201 44 The apparent differences between the three types of dwellings were not statistically significant.

Chapter 4 Focus on high rise dwellings | 37
Damp
4.16 There was no notable variation in the presence of damp for each type of dwelling. Due to small sample sizes it was not possible to undertake further analysis by tenure or region.
Disrepair
4.17 To provide comparative levels of disrepair for each dwelling, the following analysis uses EHS standardised basic repair costs in square metres (£/m²)45. Overall, flats in blocks of four or more storeys tended to have less disrepair than houses and flats in blocks with fewer storeys. This was the case for both average and banded repair costs.
4.18 The average cost of disrepair among all dwellings was £15/m². The average cost was notably lower for high rise flats (£7/m²) and flats in blocks of four to five storeys (£9/m²), compared with flats in blocks of three storeys or less and houses (both £16/m²), Annex Table 4.3.
4.19 Similarly, high rise flats were less likely to have serious disrepair of £35/m² or over (5%) and were also more likely to require no repairs (48%) than both houses (13% and 42% respectively) and flats in blocks of three storeys or less (12% and 37% respectively), Annex Table 4.3.
4.20 Although average levels of disrepair were generally lower for social rented homes (£13/m² compared with £16/m² for the private sector), average repair costs were higher among social rented high rise flats (£11/m²) and those in blocks of four to five storeys (£12/m²) than equivalent flats in the private sector (£5/m² and £7/m² respectively), Figure 4.3.
45 See English Housing Survey Technical Report, 2017-18, Chapter 5 Annex 5.5 for further information. This repair cost indicator is different to that used to calculate whether a home meets the repair criterion of the Decent Homes Standard.

38 | English Housing Survey Stock profile and condition, 2017
Figure 4.3: Average basic standardised repair costs (£/m²), by dwelling type and by tenure, 2017
Base: all dwellings Note: underlying data are presented in Annex Tables 4.4 and 4.5 Source: English Housing Survey, three year dwelling sample
4.21 The findings for banded repair cost also demonstrate that private sector high rise flats generally had less disrepair than those in the social sector. Over half of high rise flats in the private sector had no repair costs (57%) compared with 34% of those in the social rented sector, Annex Tables 4.4 and 4.5. This finding likely reflects the different age profile of high rise flats between the two tenures; 57% of private sector high rise flats were built after 1980 compared with 14% of high rise flats in the social sector, Annex Table 4.9.
4.22 High rise flats in the private sector were more likely to require no repairs, and were less likely to have serious disrepair, than other types of homes in that tenure. Among social rented homes, however, there was less variation in the level of disrepair among different dwelling types.
4.23 The level of disrepair for high rise flats was generally similar in London and outside London, Annex Tables 4.6 and 4.7.
0
5
10
15
20
25
house threeor less
four tofive
high rise
me
an (
£/m²)
private social

Chapter 4 Focus on high rise dwellings | 39
Dwelling safety
HHSRS46
4.24 Overall, Category 1 hazards were equally likely to be found in flats in block of all heights (7% to 8% depending on the number of storeys), and less likely to be found in flats than houses (13%), Annex Table 4.3. These findings were mirrored in the private sector, but differed for social homes Annex Tables 4.4 and 4.5.
4.25 Both high rise flats (10%) and houses (7%) in the social sector were more likely to have at least one Category 1 hazard than all lower storey flats (4%), Annex Table 4.5.
4.26 Compared with other regions (12%), London homes (8%) were less likely to have Category 1 hazards. This variation was due to the different proportion of houses (and not flats) with at least one Category 1 hazard between the two locations (13% outside London, 7% in London), Annex Table 4.6 and 4.7.
4.27 There was also no difference in the likelihood of high rise flats having Category 1 hazards compared with flats in blocks with fewer levels in both London or outside the capital.
4.28 High rise flats were less likely to have hazards relating to falls on the stairs (3%), falls on the level (1%) and fire (2%) than houses (13%, 7% and 5% respectively). The proportion of Category 1 hazards for falls between levels was, however, similar for high rise flats (7%) and houses (8%), Annex Table 4.8.
Electrical Safety
4.29 The provision of all five electrical safety features47 varied between dwelling types. High rise flats (70%) and flats in four or five storey blocks (69%) were more likely to have all five safety features compared with other flats (64%) and houses (61%), Annex Table 4.3.
4.30 This trend was also evident for private sector homes, but among social rented dwellings all five safety features were equally prevalent among all dwelling types, Annex Tables 4.4 and 4.5.
4.31 Overall, provision of all electrical safety features was markedly higher among social rented homes than private sector homes. However, this was not the case for high rise flats where provision was similar in both tenures (69% private sector, 71% social sector).
46 see Chapter 2 of this report for more information on the HHSRS. 47 see Chapter 2 of this report for more detail on electrical safety features.

40 | English Housing Survey Stock profile and condition, 2017
4.32 Provision of electrical safety features was slightly higher in London (65%) than in other regions (62%). This was due to the higher prevalence of electrical safety in London houses (65%) than in houses located in other regions (61%). All five safety features were equally likely to be present in each type of flat in London and outside the capital, Annex Tables 4.6 and 4.7.
4.33 Within the capital, high rise flats (71%) were more likely to have all five electrical safety features than flats in blocks of three storeys or less (61%) but this difference was not found outside the London region.

Technical notes and glossary | 41
Technical notes and glossary
Technical notes
1. Results in the majority of this report, which relate to the physical dwelling, are presented for ‘2017’ and are based on fieldwork carried out between April 2016 and March 2018 (a mid-point of April 2017). The sample comprises 12,320 occupied or vacant dwellings where a physical inspection was carried out. Throughout the report, this is referred to as the ‘dwelling sample’.
2. Results in Chapter 2, for self-report damp and overheating measures, are presented for ‘2017-18’ and are based on fieldwork carried out between April 2017 and March 2018 on a sample of 13,395 households where an interview was carried out. Throughout the report, this is referred to as the ‘full household sample’.
3. Results in Chapter 2, for comparisons of self-report and surveyor measures of damp and overheating, and results in Chapter 3 for working smoke alarms are presented for ‘2017’. These are based only on occupied dwellings within the dwelling sample. This sample contains 11889 dwellings where a physical inspection and an interview were carried out. Throughout the report this is referred to as the ‘household sub sample’
4. Results for Chapter 4 ‘Focus on high rise dwellings’ are presented for 2017. Due to the small numbers of high rise flats in the sample these are based on fieldwork carried out over three years (2015-16, 2016-17 and 2017-18). These are based on 18568 dwellings where a physical inspection was carried out. In this chapter this is referred to as the ‘three year dwelling sample’.
5. The reliability of the results of sample surveys, including the English Housing Survey, is positively related to the unweighted sample size. Results based on small sample sizes should therefore be treated as indicative only because inference about the national picture cannot be drawn. To alert readers to those results, percentages based on a row or column total with unweighted total sample size of less than 30 are italicised. To safeguard against data disclosure, the cell contents of cells where the cell count is less than 5 are replaced with a “u”.
6. Where comparative statements have been made in the text, these have been significance tested to a 95% confidence level. This means we are 95% confident that the statements we are making are true.
7. Additional annex tables, including the data underlying the figures and charts in this report are published on the website: https://www.gov.uk/government/collections/english-housing-survey alongside many supplementary live tables, which are updated each year (in the summer)

42 | English Housing Survey Stock profile and condition, 2017
but are too numerous to include in our reports. Further information on the technical details of the survey, and information and past reports on the Survey of English Housing and the English House Condition Survey, can also be accessed via this link.
Glossary
Area type in the household sample: All households are classified in the household sample according to the 2011 Rural-Urban Classification for Small Area Geographies: urban: includes a built up area with a population of more than 10,000 people rural: includes town and fringe, village, hamlets and isolated dwellings
Area type in the dwelling sample: At the physical inspection, the surveyor makes an assessment of the area surrounding the dwelling and classifies it according to the following categories: city or other urban centre which includes
o city centre: the area around the core of a large city. o other urban centre: the area around towns and small cities, and also
older urban suburban residential: the outer area of a town or city; characterised by large
planned housing estates.
rural which includes: o rural residential: a suburban area of a village, often meeting the
housing needs of people who work in nearby towns and cities. o village centre: the traditional village or the old heart of a village which
has been suburbanised. o rural: an area which is predominantly rural e.g. mainly agricultural land
with isolated dwellings or small hamlets.
Basic repair costs: Basic repairs include urgent work required in the short term to tackle problems presenting a risk to health, safety, security or further significant deterioration plus any additional work that will become necessary within the next five years. See Chapter 5, Annex 5 of the Technical Report for more information about how these are calculated and assumptions made.
Bedroom standard: The ‘bedroom standard’ is used by government as an indicator of occupation density. A standard number of bedrooms is calculated for each household in accordance with its age/sex/marital status composition and the relationship of the members to one another. A separate bedroom is allowed for each

Technical notes and glossary | 43
married or cohabiting couple, any other person aged 21 or over, each pair of adolescents aged 10-20 of the same sex, and each pair of children under 10. Any unpaired person aged 10-20 is notionally paired, if possible, with a child under 10 of the same sex, or, if that is not possible, he or she is counted as requiring a separate bedroom, as is any unpaired child under 10.
This notional standard number of bedrooms is then compared with the actual number of bedrooms (including bed-sitters) available for the sole use of the household, and differences are tabulated. Bedrooms converted to other uses are not counted as available unless they have been denoted as bedrooms by the respondents; bedrooms not actually in use are counted unless uninhabitable.
Households are said to be overcrowded if they have fewer bedrooms available than the notional number needed. Households are said to be under-occupying if they have two or more bedrooms more than the notional needed.
Category 1 hazard: The most serious type of hazard under the Housing Health and Safety Rating System (HHSRS). Where such a hazard exists the dwelling fails to reach the statutory minimum standard for housing in England.
Comprehensive repair costs: Comprehensive repairs include urgent work required in the short term to tackle problems presenting a risk to health, safety, security or further significant deterioration plus any additional work, including replacement of elements that will become necessary within the next 10 years. See Chapter 5, Annex 5 of the Technical Report for more information about how these are calculated and assumptions made.
Conversion: An alteration to the original construction which affects the total number of dwellings in the housing stock, for example, conversion of a house into two or more flats.
Cost to make decent: The cost of carrying out all works required to ensure that the dwelling meets the Decent Homes standard. This is the estimated required expenditure which includes access equipment (e.g. scaffolding and prelims). It is adjusted to reflect regional and tenure variations in building prices.
Damp and mould: There are three main categories of damp and mould covered in this report:
rising damp: where the surveyor has noted the presence of rising damp in at least one of the rooms surveyed during the physical survey. Rising damp occurs when water from the ground rises up into the walls or floors because damp proof courses in walls or damp proof membranes in floors are either not present or faulty.
penetrating damp: where the surveyor has noted the presence of penetrating damp in at least one of the rooms surveyed during the physical survey.

44 | English Housing Survey Stock profile and condition, 2017
Penetrating damp is caused by leaks from faulty components of the external fabric e.g. roof covering, gutters etc. or leaks from internal plumbing, e.g. water pipes, radiators etc.
condensation or mould: caused by water vapour generated by activities like cooking and bathing condensing on cold surfaces like windows and walls. Virtually all dwellings have some level of condensation. Only serious levels of condensation or mould are considered as a problem in this report, namely where there are extensive patches of mould growth on walls and ceilings and/or mildew on soft furnishings.
Decent home: A home that meets all of the following four criteria:
it meets the current statutory minimum standard for housing as set out in the Housing Health and Safety Rating System (HHSRS – see below).
it is in a reasonable state of repair (related to the age and condition of a range of building components including walls, roofs, windows, doors, chimneys, electrics and heating systems).
it has reasonably modern facilities and services (related to the age, size and layout/location of the kitchen, bathroom and WC and any common areas for blocks of flats, and to noise insulation).
it provides a reasonable degree of thermal comfort (related to insulation and heating efficiency).
The detailed definition for each of these criteria is included in A Decent Home: Definition and guidance for implementation, Department for Communities and Local Government, June 200648.
Deprived local areas: These are Lower Layer Super Output Areas (LSOAs) scored and ranked by the 2015 Index of Multiple Deprivation (IMD).
Seven domains of deprivation which can be experienced by people are combined to produce the overall IMD. These seven domains relate to:
Income deprivation Employment deprivation Health deprivation and disability Education skills and training deprivation Barriers to housing and services Crime Living environment deprivation
48 https://www.gov.uk/government/publications/a-decent-home-definition-and-guidance

Technical notes and glossary | 45
LSOAs are statistical geography providing uniformity of size. There are 32,844 in England and on average each contains around 1500 people or 650 households. These ranked areas have been placed into five groups of equal numbers of areas, from the 20% most deprived area on the index, to the 20% least deprived.
Double glazing: This covers factory made sealed window units only. It does not include windows with secondary glazing or external doors with double or secondary glazing (other than double glazed patio doors, which are surveyed as representing two windows).
Dwelling: A unit of accommodation which may comprise one or more household spaces (a household space is the accommodation used or available for use by an individual household). A dwelling may be classified as shared or unshared. A dwelling is shared if:
the household spaces it contains are ‘part of a converted or shared house’, or
not all of the rooms (including kitchen, bathroom and toilet, if any) are behind a door that only that household can use, and
there is at least one other such household space at the same address with which it can be combined to form the shared dwelling.
Dwellings that do not meet these conditions are unshared dwellings.
The EHS definition of dwelling is consistent with the Census 2011.
Dwelling age: The date of construction of the oldest part of the building.
Dwelling type: Dwellings are classified, on the basis of the surveyor’s inspection, into the following categories:
small terraced house: a house with a total floor area of less than 70m2 forming part of a block where at least one house is attached to two or more other houses. The total floor area is measured using the original EHS definition of useable floor area, used in EHS reports up to and including the 2012 reports. That definition tends to yield a smaller floor area compared with the definition that is aligned with the Nationally Described Space Standard and used on the EHS since 2013. As a result of the difference between the two definitions, some small terraced houses are reported in the 2014 Housing Supply Report as having more than 70m².
medium/large terraced house: a house with a total floor area of 70m2 or more forming part of a block where at least one house is attached to two or more other houses. The total floor area is measured using the original EHS definition of useable floor area which tends to yield a small floor area compared with the definition used on the EHS since 2013.

46 | English Housing Survey Stock profile and condition, 2017
end terraced house: a house attached to one other house only in a block where at least one house is attached to two or more other houses.
mid terraced house: a house attached to two other houses in a block.
semi-detached house: a house that is attached to just one other in a block of two.
detached house: a house where none of the habitable structure is joined to another building (other than garages, outhouses etc.).
bungalow: a house with all of the habitable accommodation on one floor. This excludes chalet bungalows and bungalows with habitable loft conversions, which are treated as houses.
converted flat: a flat resulting from the conversion of a house or former non-residential building. Includes buildings converted into a flat plus commercial premises (such as corner shops).
purpose built flat, low rise: a flat in a purpose built block less than six storeys high. Includes cases where there is only one flat with independent access in a building which is also used for non-domestic purposes.
purpose built flat, high rise: a flat in a purpose built block of at least six storeys high.
Electrical safety:
wiring: this is the cabling from the input electrical supply point, which runs through the meters and consumer units and leading out into the dwelling. The earliest types of wiring used lead or black rubber sheathings to enclose the wires. The danger with this type of cable is the degrading of the rubber: any failure of the insulation can cause the outer covering to become live. Modern wiring is PVC sheathed.
earthing: these are the wires joining the components at the electrical distribution centre. The early forms of earthing wires were unsheathed then later covered with green rubber, then green plastic. In 1977 the colour convention changed and all wires had to be coloured green and yellow.
consumer unit arrangement (fuse boxes): in older systems, each individual electrical circuit was fed through an individual switch and fuse box. From 1960s through to the 1980s, fuses were collected together into a small number of smaller boxes, normally with a switch on the front which controlled all the circuits leading to the box. These boxes were normally fitted with a cover, the removal of which gave access to the fuses hidden inside. From the early 1980s, the newly named consumer unit (some dwellings have two) catered for the whole dwelling

Technical notes and glossary | 47
and was also designed to accommodate modern safety measures namely circuit breakers and residual current devices.
overload protection / miniature circuit breakers (MCBs): these provide the most modern form of electrical current overload protection by detecting a fault condition and interrupting the current flow. MCBs replaced cartridge fuses and the original wire fuses (these simply melt when overheated) which formed the earliest form of protection.
residual current devices (RCDs): these are designed to break an electrical current very easily by detecting any abnormality in the circuit, for example, through someone touching a live wire. They are normally located in the consumer unit but a separate RCD may exist to protect an additional circuit, for example, an electrical circuit used in the garden.
Energy efficiency rating (EER, also known as SAP rating): A dwelling’s energy costs per m2 of floor area for standard occupancy of a dwelling and a standard heating regime and is calculated from the survey using a simplified form of SAP. The energy costs take into account the costs of space and water heating, ventilation and lighting, less cost savings from energy generation technologies. They do not take into account variation in geographical location. The rating is expressed on a scale of 1-100 where a dwelling with a rating of 1 has poor energy efficiency (high costs) and a dwelling with a rating of 100 represents zero net energy cost per year. It is possible for a dwelling to have an EER/SAP rating of over 100 where it produces more energy than it consumes, although such dwellings will be rare within the English housing stock.
The detailed methodology for calculating SAP to monitor the energy efficiency of dwellings was updated in 2012 to reflect developments in the energy efficiency technologies and knowledge of dwelling energy performance. These changes in the SAP methodology were relatively minor compared with previous SAP methodology updates in 2005 and 2009. It means, however that a SAP rating using the 2009 method is not directly comparable to one calculated under the 2012 methodology, and it would be incorrect to do so. All SAP statistics used in reporting from 2013 are based on the SAP 2012 methodology and this includes time series data from 1996 to the current reporting period (i.e. the SAP 2012 methodology has been retrospectively applied to 1996 and subsequent survey data to provide consistent results in the 2013 and following reports).
Energy efficiency rating (EER)/SAP bands: The 1-100 EER/SAP energy efficiency rating is also presented in an A-G banding system for an Energy Performance Certificate, where Band A rating represents low energy costs (i.e. the most efficient band) and Band G rating represents high energy costs (the least efficient band). The break points in SAP (see below) used for the EER Bands are:
Band A (92–100) Band B (81–91)

48 | English Housing Survey Stock profile and condition, 2017
Band C (69–80) Band D (55–68) Band E (39–54) Band F (21–38) Band G (1–20)
Energy Performance Certificates (EPCs):
An Energy Performance Certificate (EPC) indicates the energy efficiency of the dwelling. The assessments are banded from A to G, where A is the most efficient in terms of likely fuel costs and carbon dioxide emissions. An EPC is required whenever a dwelling is newly constructed, sold or let. The purpose of an EPC is to show prospective tenants or buyers the energy efficiency of the property. The requirement for EPCs was introduced in phases and fully implemented for domestic properties by autumn 2008. EPCs are valid for 10 years.
Based on current energy performance the EPC provides a range of indicators, such as whether the property would benefit in terms of improved performance from a range of heating, insulation and lighting upgrades and the likely performance arising from the application of those measures. For further information on how the EHS models this, see the Technical Report for further information and also the EPC Improvements Modelling Review report: https://www.gov.uk/government/collections/english-housing-survey-technical-advice#methodology-reports.
EPC modelling in the EHS:
The EHS EPC assessment is based on a simplified form of the energy efficiency SAP known as reduced data SAP (RdSAP). Following revisions to the way that RdSAP software implements improvements as part of the EPC production process, a new EPC methodology has been applied to the EHS data since 2015. Several additional improvement measures have been added to the methodology, and for some existing measures the criteria and/or improvement specification has changed (see the Technical Report for further information and also the EPC Improvements Modelling Review report: https://www.gov.uk/government/collections/english-housing-survey-technical-advice#methodology-reports).
The EHS currently provides the following EPC based indicators, calculated using the survey’s own approach to:
current and post improvement performance:
o energy efficiency rating (EER) and bands o environmental impact rating (EIR) and bands o primary energy use (kWh/m2/year) o energy cost (£/year) for space heating, water heating, lighting and
renewables

Technical notes and glossary | 49
o CO2 (carbon dioxide) emissions (tonnes/year)
improvement measures: The Technical Report provides a list of improvements specified in the updated EHS methodology. These include loft insulation measures, wall and floor insulation measures, boiler upgrades, solar water heating, glazing and lighting measures. They are also listed in the relevant Annex Table.
the notional costs of installing the recommended measures: The EHS also estimates the notional costs of installing each of the recommended measures and the total cost of applying all the recommended measures to the dwelling stock. The methodology for estimating these costs has also been revised (see the Technical Report for further information).
Ethnicity: Classification according to respondents’ own perceived ethnic group.
Ethnic minority background is used throughout the report to refer to those respondents who do not identify as White. The classification of ethnic group used in the EHS is consistent with the 2011 Census. Respondents are classified as White if they answer one of the following four options:
1. English / Welsh / Scottish / Northern Irish / British 2. Irish 3. Gypsy or Irish Traveller 4. Any Other White background
Otherwise, they are classified as being from an ethnic minority background. Excess cold (HHSRS Category 1 hazard): Households living in homes with a threat to health arising from sub-optimal indoor temperatures. The assessment is based on the most vulnerable group who, for this hazard, are those aged 65 years or more (the assessment does not require a person of this age to be an occupant). The EHS does not measure achieved temperatures in the home and therefore this hazard is based on dwellings with an energy efficiency rating of less than 35 based on the SAP 2001 methodology. Under the SAP 2009 methodology, used for the 2010- 2012 EHS reports, the comparable threshold was recalculated to be 35.79 and the latter was used in providing statistics for the HHSRS Category 1 hazard. Since 2013, the EHS Reports have used the SAP 2012 methodology and the comparable excess cold threshold has been recalculated to 33.52.
Heating controls:
a) For central heating systems:
timers which control when the heating goes on and off. They range from simple manual timeclocks to complex digital programmers and most include a manual override.

50 | English Housing Survey Stock profile and condition, 2017
room thermostats which measure air temperature in the home, and switch the space heating on and off. They can be used to set a single target temperature and there may be one or more of these in the dwelling.
thermostatic radiator valves (TRVs) which enable the temperature of radiators in individual rooms to be modified manually.
b) For storage heating systems:
manual or automatic charge controls adjust the amount of heat stored overnight. The more recently introduced automatic controls measure the temperature in the room (or more rarely, outside the house). If the temperature is milder these allow less heat to be stored, saving money.
celect type controller has electronic sensors throughout the dwelling linking to a central control device. It monitors the individual room sensors and optimises the charging of all storage heaters individually.
Heating system: There are three main types of heating covered in this report:
central heating system: most commonly a system with a gas fired boiler and radiators which distribute heat throughout the dwelling (but also included in this definition are warm air systems, electric ceiling/underfloor and communal heating). It is generally considered to be a cost effective and relatively efficient method of heating a dwelling. Communal systems use heat generated in a centralized location for residential space and water heating. This could be from
o a central boiler using any fuel which supplies a number of dwellings o waste heat from power stations distributed through community heating
schemes o heat from a local CHP (combined heat and power) system
storage heaters: predominately used in dwellings that have an off-peak electricity tariff. Storage heaters use off-peak electricity to store heat in clay bricks or a ceramic material, this heat is then released throughout the day. However, storage heating can prove expensive if too much on peak electricity is used during the day.
room heaters: this category includes all other types of heaters such as fixed gas, fixed electric or portable electric heaters. This type of heating is generally considered to be the least cost effective of the main systems and produces more carbon dioxide emissions per kWh.
Household: One person or a group of people (not necessarily related) who have the accommodation as their only or main residence, and (for a group) share cooking facilities and share a living room or sitting room or dining area.
The EHS definition of household is slightly different from the definition used in the 2011 Census. Unlike the EHS, the 2011 Census did not limit household membership

Technical notes and glossary | 51
to people who had the accommodation as their only or main residence. The EHS included that restriction because it asks respondents about their second homes, the unit of data collection on the EHS, therefore, needs to include only those people who have the accommodation as their only or main residence.
Household in poverty: a household with income below 60% of the equivalised median household income (calculated before any housing costs are deducted). Income equivalisation is the adjustment of income to take into account the varied cost of living according to the size and type of household (see the EHS Technical Report, Chapter 5, Annex 4 for further information).
Household reference person (HRP): The person in whose name the dwelling is owned or rented or who is otherwise responsible for the accommodation. In the case of joint owners and tenants, the person with the highest income is taken as the HRP. Where incomes are equal, the older is taken as the HRP. This procedure increases the likelihood that the HRP better characterises the household’s social and economic position. The EHS definition of HRP is not consistent with the Census 2011, in which the HRP is chosen on basis of their economic activity. Where economic activity is the same, the older is taken as HRP, or if they are the same age, HRP is the first listed on the questionnaire.
Housing Health and Safety Rating System (HHSRS): A risk assessment tool used to assess potential risks to the health and safety of occupants in residential properties in England and Wales. It replaced the Fitness Standard in April 2006.
The purpose of the HHSRS assessment49 is not to set a standard but to generate objective information in order to determine and inform enforcement decisions. There are 29 categories of hazard, each of which is separately rated, based on the risk to the potential occupant who is most vulnerable to that hazard. The individual hazard scores are grouped into 10 bands where the highest bands (A-C representing scores of 1,000 or more) are considered to pose Category 1 hazards. Local authorities have a duty to act where Category 1 hazards are present, and may take into account the vulnerability of the actual occupant in determining the best course of action.
For the purposes of the decent homes standard, homes posing a Category 1 hazard are non-decent on its criterion that a home must meet the statutory minimum requirements.
The EHS is not able to replicate the HHSRS assessment in full as part of a large scale survey. Its assessment employs a mix of hazards that are directly assessed by surveyors in the field and others that are indirectly assessed from detailed related information collected. For 2006 and 2007, the survey (the then English House Condition Survey) produced estimates based on 15 of the 29 hazards. From 2008, the survey is able to provide a more comprehensive assessment based on 26 of the
49 https://www.gov.uk/government/collections/housing-health-and-safety-rating-system-hhsrs-guidance
52 | English Housing Survey Stock profile and condition, 2017
29 hazards. See the EHS Technical Note on Housing and Neighbourhood Conditions50 for a list of the hazards covered.
Insulation: There are two main types of insulation covered in this report:
wall insulation
cavity walls: where a dwelling has external walls of predominantly cavity construction, it is defined as having cavity wall insulation if at least 50% of the cavity walls are filled with insulation. This could have been fitted during construction or retrospectively injected between the masonry leaves of the cavity wall.
solid walls: where a dwelling has external walls of predominantly masonry solid construction, it is defined as having solid wall insulation if at least 50% of the solid walls are fitted with insulation. This could be applied either externally (e.g. insulated board attached to the external face with a render finish) or internally (e.g. insulated plasterboard fitted to the external walls inside each room, with a plaster finish).
other walls: these are any dwellings with predominantly non-cavity or masonry solid walls (e.g. timber, metal or concrete frames). If at least 50% of the walls are fitted with insulation, the dwelling is defined as having other wall insulation.
loft insulation: the presence and depth of loft insulation is collected for all houses and top-floor flats. Insulation could be found between joists above the ceiling of the top floor of the dwelling or between the roof timbers where the loft has been converted to a habitable space. Where insulation could not be observed, information was taken from the householder or from imputed estimates based on the age and type of the dwelling.
Insulation – new cavity wall insulation variable: For the 2015 Headline Report, the English Housing Survey introduced a new measure of cavity wall insulation (variable wins95x). This new measure incorporates more up-to-date information regarding the insulation of buildings built since 1991 and aligns the English Housing Survey methodology to a common method for calculating energy efficiency of buildings.
In compliance with new Building Regulations, an increasing proportion of dwellings built in 1991 or after with cavity walls had insulation fitted at the time of construction (known as ’as built‘ cavity wall insulation), although compliance could also be achieved through other techniques. The non-intrusive survey undertaken in the EHS would not always be able to identify as built insulation, and the Survey has to assume that these properties have insulation. To align with current RdSAP methodology and to improve our methodology, the English Housing Survey has for
50 https://www.gov.uk/government/publications/english-housing-survey-technical-advice

Technical notes and glossary | 53
2015 data introduced a new variable, which assumes that properties built in 1995 or after has as built insulation. This is the assumption used in the RdSAP model, which in turn reflects that cavity wall insulation was not used as often as previously thought to comply with the new Building Regulations in the early 1990s.
In the earlier variable (wins90x), properties built in 1991 or after were assumed to be insulated, as it was thought builders used cavity wall insulation to comply with the new Building Regulations. Due to changes in data collection the new variable can only be taken back to 2008. Trends from earlier reports hold, though the exact numbers produced by the new variable are lower (as properties built in 1991 up to 1995 without evidence of retrofitted cavity wall insulation are no longer assumed to be insulated).
Overcrowding: Households are said to be overcrowded if they have fewer bedrooms available than the notional number needed according to the bedroom standard definition. See bedroom standard.
Private accommodation: The majority of homes in all three tenures, excluding hotels, bed and breakfast accommodation and institutional residences such as student halls, army barracks and care homes. The EHS only covers private accommodation.
Region: A nine region classification is used to present geographical findings, as follows:
North East North West Yorkshire and the Humber East Midlands West Midlands East London South East South West SAP rating: See the entries for the Standard Assessment Procedure and Energy Efficiency Rating
Standard Assessment Procedure (SAP): The Standard Assessment Procedure (SAP) is the methodology used by the Government to assess and compare the energy and environmental performance of dwellings. The SAP is used to calculate the energy efficiency rating (EER) of dwellings, also known as the SAP rating. The EER is an index based on calculated energy costs for a standard heating regime and is expressed on a scale of 1 (highly inefficient) to 100 (highly efficient with 100 representing zero energy cost). It is possible for a dwelling to have a rating of over 100 where it produces more energy than it consumes, although such dwellings will be rare within the English housing stock.

54 | English Housing Survey Stock profile and condition, 2017
Reduced Data SAP (RdSAP) was introduced in 2005 as a lower cost method of assessing the energy performance of existing dwellings. RdSAP is used in the calculation of the energy ratings on the Energy Performance Certificate, a document which is required every time a home is put up for sale or rent. Since the 2015 survey, the EHS has provided a number of indicators on energy performance calculated using an approach which is in line with RdSAP 2012 version 9.92. To ensure that the findings in this report are as compatible as possible with energy performance assessments and certificates issued in England during 2017-18, the energy performance findings presented in this report were calculated using RdSAP version 9.92.
Serious condensation or mould: See ‘damp and mould’
Size: The total usable internal floor area of the dwelling as measured by the surveyor, rounded to the nearest square metre. It includes integral garages and integral balconies but excludes stores accessed from the outside only, the area under partition walls and the stairwell area.
Storeys: The number of storeys above ground i.e. it does not include any basements.
Substantial disrepair: Standardised basic repair costs of more than £35/m². Standardised repair costs measure repair costs expressed in pounds per square metre of floor area
Thermal comfort: an assessment from the surveyor as to whether a dwelling has both efficient heating; and effective insulation. Efficient heating is defined as
any gas or oil programmable central heating
electric storage heaters; or warm air systems
underfloor systems
programmable LPG/solid fuel central heating
similarly efficient heating systems which are developed in the future
The primary heating system must have a distribution system sufficient to provide heat to two or more rooms of the home. There may be storage heaters in two or more rooms, or other heaters that use the same fuel in two or more rooms.
Because of the differences in efficiency between gas/oil heating systems and the other heating systems listed, the level of insulation that is appropriate also differs:
For dwellings with gas/oil programmable heating, cavity wall insulation (if there are cavity walls that can be insulated effectively) or at least 50mm loft insulation (if there is loft space) is an effective package of insulation.
Technical notes and glossary | 55
For dwellings heated by electric storage heaters/LPG/programmable solid fuel central heating a higher specification of insulation is required: at least 200mm of loft insulation (if there is a loft) and cavity wall insulation (if there are cavity walls that can be insulated effectively).
Tenure: In this report, households are typically grouped into three broad categories known as tenures: owner occupiers, social renters and private renters. The tenure defines the conditions under which the home is occupied, whether it is owned or rented, and if rented, who the landlord is and on what financial and legal terms the let is agreed.
owner occupiers: households in accommodation which they either own outright, are buying with a mortgage or as part of a shared ownership scheme.
social renters: this category includes households renting from Local Authorities (including Arms’ Length Management Organisations (ALMOs) and Housing Action Trusts) and Housing Associations, Local Housing Companies, co-operatives and charitable trusts.
A significant number of Housing Association tenants wrongly report that they are Local Authority tenants. The most common reason for this is that their home used to be owned by the Local Authority, and although ownership was transferred to a Housing Association, the tenant still reports that their landlord is the Local Authority. There are also some Local Authority tenants who wrongly report that they are Housing Association tenants. Data from the EHS for 2008-09 onwards incorporate a correction for the great majority of such cases in order to provide a reasonably accurate split of the social rented category.
private renters: this sector covers all other tenants including all whose accommodation is tied to their job. It also includes people living rent-free (for example, people living in a flat belonging to a relative).
Urgent repair costs: These cover urgent work only which is defined as work required in the short term to tackle problems presenting a risk to health, safety, security or further significant deterioration of the building. See Chapter 5, Annex 5 of the Technical report for more information about how these are calculated and assumptions made.
Usable floor area: The total usable internal floor area of the dwelling as measured by the surveyor, rounded to the nearest square metre. A new modelling approach adopted since the 2013 report uses assumptions aligned with the Nationally Described Space Standard which was published as part of the Housing Standards Review. It excludes integral garages, balconies, stores accessed from the outside only and the area under external walls. The area remaining represents the total of all room areas, hallways and circulation space including cupboards and stairs. The area under internal partition walls is also included. Loft space is not included unless the

56 | English Housing Survey Stock profile and condition, 2017
loft is habitable, with a fixed stair in place to access it. Dwellings are also grouped into the following five categories:
less than 50m2 50 to 69m2 70 to 89m2 90 to 109m2 110m2 or more.
Vacant dwellings: The assessment of whether or not a dwelling is vacant is made at the time of the interviewer’s visit. Clarification of vacancy is sought from neighbours. Both properties in between lets and those that are vacant for a longer period are classified as vacant on the EHS. Surveyors are required to gain access to vacant dwellings and undertake full inspections.
Wall types: the method of the dwelling construction, including:
Cavity wall: constructed of two brick or block walls separated by a cavity that is at least 50mm wide. They are generally found in houses dating from about 1930 onwards, although some older examples exist. Many dwellings (especially older private sector homes) have a mix of wall types because they have had one or more extensions added at different times. In the EHS dwellings are only classed as ‘cavity wall’ where at least 50% of the total external wall area is cavity brickwork.
Solid wall dwelling: A dwelling whose structure comprises of solid brickwork i.e. no cavity inside the walls. Solid walls were mainly built until the 1930s in England.
Timber frame/concrete frame/other concrete/steel frame dwellings: This category covers a wide range of building types, ranging from traditional timber frame buildings to non-traditional concrete or steel frame buildings using ‘systems’ of building focused on speed and economy of construction. They usually use pre-constructed frames of material, e.g. timber, concrete or steel, that are then erected on site. In some cases the frames may be constructed on site. The frames can be clad with other materials or filled to form panels.
Masonry walled dwellings: Dwellings with walls constructed by laying individual masonry units (e.g. brick, concrete block or stone). The masonry units are normally laid with cement mortar, which binds them together to create a structure. They can be either cavity or solid wall.

© Crown copyright, 2019
Copyright in the typographical arrangement rests with the Crown.
You may re-use this information (not including logos) free of charge in any format or medium, under the terms of the Open Government Licence. To view this licence,http://www.nationalarchives.gov.uk/doc/open-government-licence/version/3/ or write to the Information Policy Team, The National Archives, Kew, London TW9 4DU, or email: [email protected].
This document/publication is also available on our website at www.gov.uk/mhclg
If you have any enquiries regarding this document/publication, complete the form at http://forms.communities.gov.uk/ or write to us at:
Ministry of Housing, Communities and Local Government Fry Building 2 Marsham Street London SW1P 4DF Telephone: 030 3444 0000 Email: [email protected]
For all our latest news and updates follow us on Twitter: https://twitter.com/mhclg
July 2019
In accordance with the Statistics and Registration Service Act 2007 the United Kingdom Statistics Authority has designated these statistics as National Statistics, signifying that they are fully compliant with the Code of Practice for Statistics.
Designation can be broadly interpreted to mean that the statistics:
meet identified user needs; are well explained and readily accessible; are produced according to sound methods, and are managed impartially and objectively in the public interest.
Once statistics have been designated as National Statistics it is a statutory requirement that the Code of Practice shall continue to be observed.