Travel & Driving Guide - Auto Europe Discount Car Rentals, Airfare

1
eHi Car Services Announces Second Quarter 2017 Results
• Net revenues increased by 27.6% year-over-year to RMB639.7million • Net income was RMB30.4 million comparing to RMB0.8 million year-over-year • Non-GAAP adjusted EBITDA increased by 31.4% year-over-year to RMB286.2 million • Continued margin expansion by achieving non-GAAP adjusted EBITDA margin of 44.7% SHANGHAI, August 28, 2017 – eHi Car Services Limited (“eHi” or the “Company”) (NYSE: EHIC), a leading car rental and car services provider in China, today announced its unaudited financial results for the second quarter ended June 30, 2017. Mr. Ray Zhang, eHi’s Chairman and Chief Executive Officer, said, “Our robust second quarter results reflect our leadership in China’s car rental and car services industry where we continue to execute effective marketing strategies, and introduce innovative services to further improve the customer experience. Both of our business lines delivered strong financial performance, resulting in a year-over-year increase of total net revenues by 27.6% with total RevPAC of RMB154. Notably, our car services line picked up in the quarter with RevPAC reaching RMB517, a 14.4% increase from the prior quarter, while our car rental line continued to grow year-over-year by 28.7% with average available fleet size growth of by 21.7% year-over-year and maintained an industry-leading fleet utilization rate of 72.7%. These results further demonstrate that we remain as a top choice for our growing user community who count on the high-quality and unrivalled services provided by eHi. “To further our quest for service excellence, we introduced ‘flash car rental’ this summer. This is a new service built on our mature and comprehensive fleet management system, providing a more convenient and efficient rental experience for our customers. In addition, we have received remarkable feedback for “Hi Car”, the car sharing service that we introduced in April, which is now expanded into ten top-tier cities in China with a total number of registered users reaching 60,000 at the end of the second quarter. Looking ahead, we will continue our efforts to drive industry innovation by leveraging our best-in-class platforms, advanced technology capabilities and leading network scale, while maintaining our current pricing strategy and leadership in fleet management to capture the significant demand and growth opportunity in the car rental market,” Mr. Zhang concluded. Mr. Colin Sung, eHi’s Chief Financial Officer, said, “Our financial achievements in the second quarter of 2017 clearly demonstrate that we have the right strategy to continue the exceptional growth in both of our business lines, as revenue from car rentals grew by 28.7% while revenue from car services increased by 23.9% year-over-year. Benefiting from our disciplined financial management and economies of scale, non-GAAP adjusted EBIT margin and non-GAAP adjusted EBITDA margin reached 15.0% and 44.7%, respectively, for the second quarter of 2017. In addition, the successful offering of US$400 million of senior unsecured notes with a favorable interest rate provides us substantial capital with longer maturity and will help lower financing costs and optimize our debt structure. This is a further testament to our ability to access diversified funding resources, as well as the trust that our bondholders have in our future.” Second Quarter 2017 Highlights Net revenues increased by 27.6% year-over-year to RMB639.7 million (US$94.4 million1) for the second quarter of 2017, from RMB501.3 million for the second quarter of 2016, driven by increased net revenues from both car rentals and car services.

2
Three months ended June 30, Year-Over-Year (RMB ‘000) 2016 2017 Comparison Car rentals 388,810 500,382 28.7% Car services 112,529 139,368 23.9% Total Net Revenues 501,339 639,750 27.6%
Average Available Fleet Size2
RevPAC3 (RMB)
2016Q2
2017Q2
Year-Over-Year
Comparison
2016Q2
2017Q2
Year-Over-Year
Comparison Car rentals 34,974
42,568
21.7%
124
129
4.0%
Car services 2,476
2,963
19.7%
505
517
2.4%
Total 37,450
45,531
21.6%
149
154
3.4%
Fleet utilization rate4 for car rentals was 72.7% for the second quarter of 2017, compared with 71.1% for the second quarter of 2016.
Cost of revenues (vehicle operating expenses) for the second quarter of 2017 was RMB453.8 million (US$66.9 million), up 26.1% year-over-year, primarily driven by increased depreciation and labor costs. In the second quarter of 2017, 2,591 used vehicles were disposed of, and 1,613 used vehicles were under sales contracts pending title transfer. The Company recognized a disposal gain of RMB2.5 million (US$0.4 million) in aggregate for these 4,204 vehicles5. In addition, a disposal gain of RMB4.1 million (US$0.6 million) was recognized in the second quarter of 2017 as a result of the completion of title transfer during such period. These disposal gains were both recognized as adjustments to the vehicle-related depreciation expense as part of the cost of revenues. Gross profit6 for the second quarter of 2017 was RMB186.0 million (US$27.4 million), up 31.4% year-over-year. Gross profit margin for the second quarter of 2017 was 29.1%, compared with 28.2% for the second quarter of 2016. Gross profit margin improvement was primarily due to a percentage decrease of vehicle-related depreciation in terms of net revenues. Selling and marketing expenses for the second quarter of 2017 were RMB35.8 million (US$5.3 million), up 33.6% year-over-year, as the Company expanded advertising and branding activities in the second quarter of 2017, including the marketing activities associated with the NBA China and NBA All-Star Stephen Curry. General and administrative expenses for the second quarter of 2017 were RMB59.9 million (US$8.8 million), up 1.2% year-over-year, primarily due to increased employee-related costs including salaries and welfare expenses as a result of increased headcount in the second quarter of 2017. Interest expense for the second quarter of 2017 slightly increased by 0.5% to RMB56.7 million (US$8.4 million), compared with the second quarter of 2016. Provision for income taxes for the second quarter of 2017 increased by 206.7% to RMB7.7 million (US$1.1 million), compared with RMB2.5 million for the second quarter of 2016 due to the expansion of income before income taxes. Net income for the second quarter of 2017 was RMB30.4 million (US$4.5 million), compared with a net income of RMB0.8 million for the second quarter of 2016. Net income margin for the second
3
quarter of 2017 was 4.7%, compared with a net income margin of 0.2% for the second quarter of 2016. Basic and diluted earnings per ADS for the second quarter of 2017 were RMB0.44 (US$0.06) each, compared with basic and diluted earnings per ADS of RMB0.01 each for the second quarter of 2016. Non-GAAP adjusted EBIT7 increased by 59.0% year-over-year to RMB95.9 million (US$14.1 million) for the second quarter of 2017, from RMB60.3 million for the second quarter of 2016. Non-GAAP adjusted EBIT margin7 increased to 15.0% for the second quarter of 2017, from 12.0% for the second quarter of 2016. Non-GAAP adjusted EBITDA8 increased by 31.4% year-over-year to RMB286.2 million (US$42.2 million) for the second quarter of 2017, from RMB217.9 million for the second quarter of 2016. Non-GAAP adjusted EBITDA margin8 increased to 44.7% for the second quarter of 2017, from 43.5% for the second quarter of 2016. As of June 30, 2017, the Company’s cash, cash equivalents and restricted cash balance was RMB571.3 million (US$84.3 million). Recent Development On August 14, 2017, the Company announced the completion of the offering of US$400 million aggregate principal amount of its senior unsecured notes due August 2022 (the “Notes”). The Notes will bear a fixed interest rate of 5.875% per annum, with interest payable semi-annually in arrears. The Notes were issued with a yield of 5.875%, and will mature on August 14, 2022. The Company intends to use the net proceeds of this offering to repay all outstanding borrowings under, and terminate, the US$150 million syndicated bank facility it entered into in August 2016, and for general corporate purposes, including capital expenditures, refinancing outstanding indebtedness and enhancing its capital structure. The Notes are listed on the Singapore Exchange Securities Trading Limited. Outlook The Company estimates that net revenues for the third quarter of 2017 will range from RMB780 million to RMB800 million, and for full year of 2017 will be RMB2.9 billion. This outlook reflects the Company’s current and preliminary view, which is subject to change. Conference Call Information The Company’s management will host an earnings conference call at 8:00 AM U.S. Eastern Time on August 28, 2017 (8:00 PM Beijing/Hong Kong time on August 28, 2017). Dial-in details for the earnings conference call are as follows: United States (toll free): 1-888-346-8982 International: 1-412-902-4272 Hong Kong (toll free): 800-905-945 Hong Kong: 852-3018-4992 China: 400-120-1203 Participants should dial-in at least 5 minutes before the scheduled start time and ask to be connected to the “eHi Car Services call.” Additionally, a live and archived webcast of the conference call will be available on the investor relations section of eHi’s website at http://ir.ehi.com.cn.

4
A replay of the conference call will be accessible by phone at the following numbers until September 4, 2017: United States (toll free): 1-877-344-7529 International: 1-412-317-0088 Replay Access Code: 10111733
About eHi Car Services Limited eHi Car Services Limited (NYSE: EHIC) is one of the leading car rental and car services providers in China. The Company’s mission is to provide comprehensive mobility solutions as an alternative to car ownership by best utilizing existing resources and sharing economy to create optimal value. eHi distinguishes itself in China’s fast-growing car rental and car services market through its complementary business model, customer-centric corporate culture, broad geographic coverage, efficient fleet management, leading brand name, and commitment to technological innovation. eHi is the exclusive strategic partner in China of Enterprise, the largest car rental company in the world, and is the designated and preferred business partner of Ctrip, a leader in the online travel agency industry in China. For more information regarding eHi, please visit http://en.1hai.cn. About Non-GAAP Financial Measures To supplement its unaudited condensed consolidated financial statements which are presented in accordance with U.S. GAAP, the Company uses adjusted EBIT and adjusted EBITDA as non-GAAP financial measures. Adjusted EBIT represents net income or loss before share-based compensation, interest expense, interest income and provision for income taxes. Adjusted EBITDA represents net income or loss before depreciation and amortization, share-based compensation, interest expense, interest income and provision for income taxes. The Company’s management believes that adjusted EBIT and adjusted EBITDA facilitate a better understanding of operating results from quarter to quarter and provide management with a better capability to plan and forecast future periods. For more information on the non-GAAP financial measures, please see the table captioned “Reconciliation of GAAP and Non-GAAP Results” set forth at the end of this press release. Non-GAAP information is not prepared in accordance with GAAP and may be different from non-GAAP methods of accounting and reporting used by other companies. The presentation of this additional information should not be considered a substitute for GAAP results. A limitation of using these Non-GAAP financial measures excludes depreciation and amortization, share-based compensation, interest expense, interest income and provision for income taxes, as applicable, that have been and will continue to be significant recurring portions of the Company’s business for the foreseeable future.

5
Safe Harbor Statement This press release contains forward-looking statements made under the “safe harbor” provisions of Section 21E of the Securities Exchange Act of 1934, as amended, and the U.S. Private Securities Litigation Reform Act of 1995. These forward-looking statements can be identified by terminology such as “will,” “expects,” “anticipates,” “future,” “intends,” “plans,” “believes,” “estimates,” “confident” and similar statements. eHi may also make written or oral forward-looking statements in its reports filed with or furnished to the SEC, in its annual report to shareholders, in press releases and other written materials and in oral statements made by its officers, directors or employees to third parties. Any statements that are not historical facts, including statements about eHi’s beliefs and expectations, are forward-looking statements that involve factors, risks and uncertainties that could cause actual results to differ materially from those in the forward-looking statements. Such factors and risks include, but not limited to the following: eHi’s goals and strategies; its future business development, financial condition and results of operations; its ability to achieve and sustain profitability; its heavy reliance on its proprietary technology platform; market recognition of its new “flash car rental” and car sharing services; its ability to maintain its pricing strategy and capture market demand and growth opportunities; its ability to compete successfully against current and future competitors; the expected growth of China’s car rentals and car services market; its ability to sustain its growth rates and manage its expansion plan; its ability to dispose used vehicles at desirable prices or timing or through appropriate channels; its ability to raise sufficient capital to fund and expand its operations at a reasonable cost; various government policies on automobile control and purchase restrictions in certain Chinese cities; its ability to enhance its brand recognition and maintain a high level of customer satisfaction; its ability to control the losses resulting from customer violation of traffic rules; and its ability to obtain all of the requisite permits, licenses or making all of the requisite filings or registrations or meeting other regulatory requirements for operating car rentals and car services business in China. Further information regarding these and other risks, uncertainties or factors is included in the Company’s filings with the SEC. All information provided in this press release is current as of the date of the press release, and eHi does not undertake any obligation to update such information, except as required under applicable law. ——————— 1 The Company’s business is conducted in China and substantially all of its revenues are denominated in Renminbi (RMB). However, this earnings announcement contains translations of RMB amounts into U.S. dollars (US$) at specified rates solely for the convenience of the reader. Unless otherwise noted, all translations from RMB to U.S. dollars are made at a rate of RMB6.7793 to US$1.00, the effective noon buying rate as of June 30, 2017 in The City of New York for cable transfers of RMB as certified for customs purposes by the Federal Reserve Bank of New York. 2 “Average available fleet size” is calculated by dividing the aggregate number of days in which the Company’s fleet was in operation during a given period by the total number of days during the same period. In determining the size of the Company’s fleet in operation, eHi includes all vehicles in its car rentals and/or car services fleets except for vehicles that have been written off in accordance with its accounting policy and vehicles that have not been consistently made available for rent and that it may consider to dispose of when appropriate opportunities arise. 3 “RevPAC” refers to average daily net revenue per available car, which is calculated by dividing the net revenues during a given period by the aggregate number of days in which the Company’s fleet was in operation during the same period. 4 “Fleet utilization rate” refers to the aggregate transaction days for the Company’s car rental fleet during a given period divided by the aggregate days the car rental fleet was in operation during the same period.

6
5 The gain of RMB2.5 million is a net amount of (i) the disposal gain and loss of the 2,591 used vehicles which were disposed of, and (ii) the disposal loss of the 1,613 used vehicles which were under sales contracts pending title transfer. If there is any disposal gain for the vehicles pending title transfer, such a gain will be recognized in the next period when the title transfer has been completed. 6 Gross profit is defined as net revenues less cost of net revenues (vehicle operating expenses). Gross profit margin is defined as the percentage representing gross profit divided by net revenues.
7 Non-GAAP adjusted EBIT is defined as net income before share-based compensation, interest expense, interest income and provision for income taxes. For more information, refer to “About Non-GAAP Financial Measures” and “Reconciliation of GAAP and Non-GAAP Results” at the end of this press release. Non-GAAP adjusted EBIT margin is defined as the percentage representing Non-GAAP adjusted EBIT divided by net revenues. 8 Non-GAAP adjusted EBITDA is defined as net income before depreciation and amortization, share-based compensation, interest expense, interest income and provision for income taxes. For more information, refer to “About Non-GAAP Financial Measures” and “Reconciliation of GAAP and Non-GAAP Results” at the end of this press release. Non-GAAP adjusted EBITDA margin is defined as the percentage representing Non-GAAP adjusted EBITDA divided by net revenues. For investor and media inquiries, please contact: eHi Car Services Limited Tel: +86 (21) 6468-7000 ext. 8742 E-mail: [email protected] The Piacente Group, Inc. Ms. Brandi Piacente Tel: +1-212-481-2050 E-mail: [email protected]
7
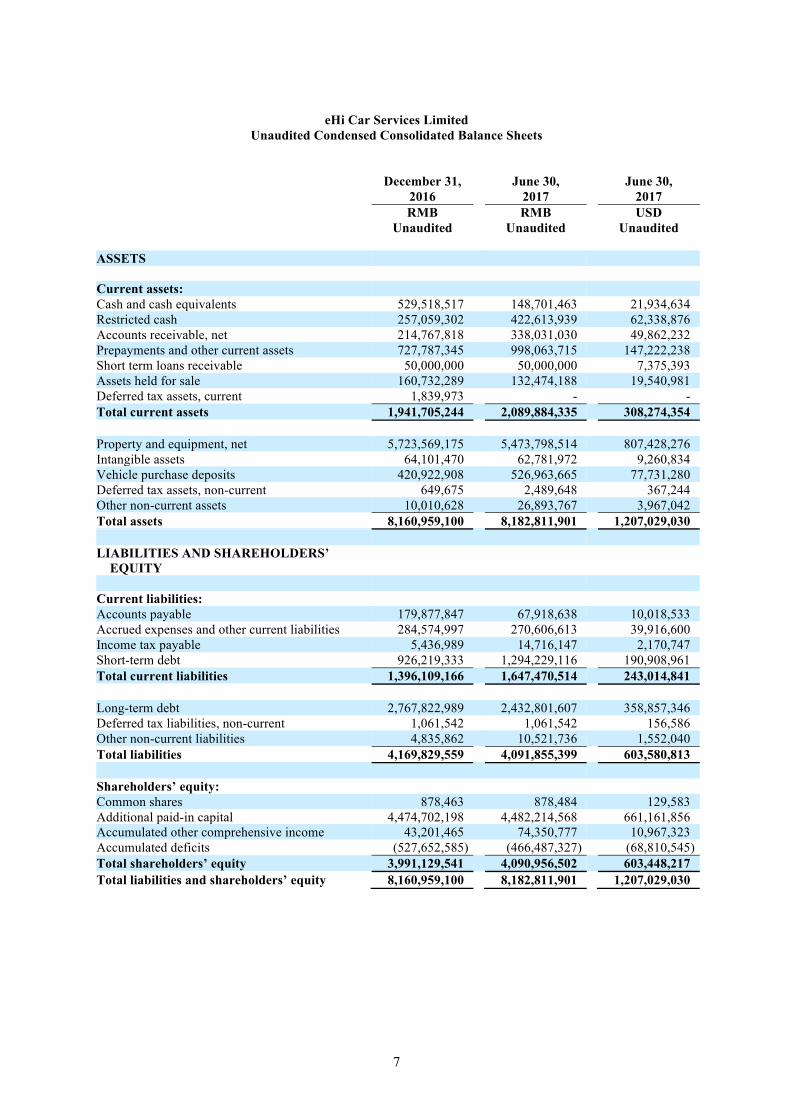
eHi Car Services Limited Unaudited Condensed Consolidated Balance Sheets
December 31,
2016
June 30,
2017 June 30,
2017 RMB RMB USD Unaudited Unaudited Unaudited ASSETS Current assets: Cash and cash equivalents 529,518,517 148,701,463 21,934,634 Restricted cash 257,059,302 422,613,939 62,338,876 Accounts receivable, net 214,767,818 338,031,030 49,862,232 Prepayments and other current assets 727,787,345 998,063,715 147,222,238 Short term loans receivable 50,000,000 50,000,000 7,375,393 Assets held for sale 160,732,289 132,474,188 19,540,981 Deferred tax assets, current 1,839,973 - - Total current assets 1,941,705,244 2,089,884,335 308,274,354 Property and equipment, net 5,723,569,175 5,473,798,514 807,428,276 Intangible assets 64,101,470 62,781,972 9,260,834 Vehicle purchase deposits 420,922,908 526,963,665 77,731,280 Deferred tax assets, non-current 649,675 2,489,648 367,244 Other non-current assets 10,010,628 26,893,767 3,967,042 Total assets 8,160,959,100 8,182,811,901 1,207,029,030 LIABILITIES AND SHAREHOLDERS’
EQUITY Current liabilities: Accounts payable 179,877,847 67,918,638 10,018,533 Accrued expenses and other current liabilities 284,574,997 270,606,613 39,916,600 Income tax payable 5,436,989 14,716,147 2,170,747 Short-term debt 926,219,333 1,294,229,116 190,908,961 Total current liabilities 1,396,109,166 1,647,470,514 243,014,841 Long-term debt 2,767,822,989 2,432,801,607 358,857,346 Deferred tax liabilities, non-current 1,061,542 1,061,542 156,586 Other non-current liabilities 4,835,862 10,521,736 1,552,040 Total liabilities 4,169,829,559 4,091,855,399 603,580,813 Shareholders’ equity: Common shares 878,463 878,484 129,583 Additional paid-in capital 4,474,702,198 4,482,214,568 661,161,856 Accumulated other comprehensive income 43,201,465 74,350,777 10,967,323 Accumulated deficits (527,652,585) (466,487,327) (68,810,545) Total shareholders’ equity 3,991,129,541 4,090,956,502 603,448,217 Total liabilities and shareholders’ equity 8,160,959,100 8,182,811,901 1,207,029,030
8
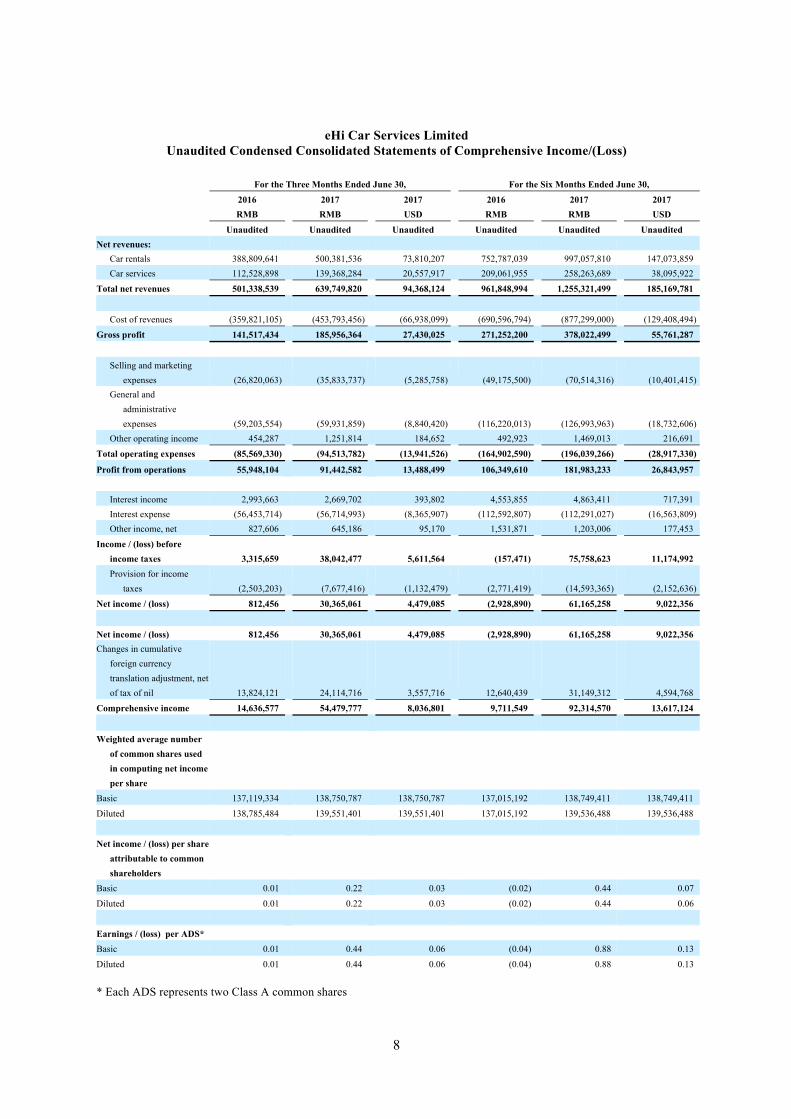
eHi Car Services Limited
Unaudited Condensed Consolidated Statements of Comprehensive Income/(Loss) For the Three Months Ended June 30, For the Six Months Ended June 30,
2016 2017 2017 2016 2017 2017 RMB RMB USD RMB RMB USD
Unaudited Unaudited Unaudited Unaudited Unaudited Unaudited Net revenues:
Car rentals 388,809,641 500,381,536 73,810,207 752,787,039 997,057,810 147,073,859 Car services 112,528,898 139,368,284 20,557,917 209,061,955 258,263,689 38,095,922
Total net revenues 501,338,539 639,749,820 94,368,124 961,848,994 1,255,321,499 185,169,781
Cost of revenues (359,821,105) (453,793,456) (66,938,099) (690,596,794) (877,299,000) (129,408,494)
Gross profit 141,517,434 185,956,364 27,430,025 271,252,200 378,022,499 55,761,287
Selling and marketing
expenses (26,820,063) (35,833,737) (5,285,758) (49,175,500) (70,514,316) (10,401,415) General and
administrative expenses (59,203,554) (59,931,859) (8,840,420) (116,220,013) (126,993,963) (18,732,606)
Other operating income 454,287 1,251,814 184,652 492,923 1,469,013 216,691
Total operating expenses (85,569,330) (94,513,782) (13,941,526) (164,902,590) (196,039,266) (28,917,330)
Profit from operations 55,948,104 91,442,582 13,488,499 106,349,610 181,983,233 26,843,957 Interest income 2,993,663 2,669,702 393,802 4,553,855 4,863,411 717,391 Interest expense (56,453,714) (56,714,993) (8,365,907) (112,592,807) (112,291,027) (16,563,809) Other income, net 827,606 645,186 95,170 1,531,871 1,203,006 177,453
Income / (loss) before income taxes 3,315,659 38,042,477 5,611,564 (157,471) 75,758,623 11,174,992 Provision for income
taxes (2,503,203) (7,677,416) (1,132,479) (2,771,419) (14,593,365) (2,152,636)
Net income / (loss) 812,456 30,365,061 4,479,085 (2,928,890) 61,165,258 9,022,356
Net income / (loss) 812,456 30,365,061 4,479,085 (2,928,890) 61,165,258 9,022,356 Changes in cumulative
foreign currency translation adjustment, net of tax of nil 13,824,121 24,114,716 3,557,716 12,640,439 31,149,312 4,594,768
Comprehensive income 14,636,577 54,479,777 8,036,801 9,711,549 92,314,570 13,617,124
Weighted average number
of common shares used in computing net income per share
Basic 137,119,334 138,750,787 138,750,787 137,015,192 138,749,411 138,749,411
Diluted 138,785,484 139,551,401 139,551,401 137,015,192 139,536,488 139,536,488
Net income / (loss) per share attributable to common shareholders
Basic 0.01 0.22 0.03 (0.02) 0.44 0.07
Diluted 0.01 0.22 0.03 (0.02) 0.44 0.06
Earnings / (loss) per ADS* Basic 0.01 0.44 0.06 (0.04) 0.88 0.13
Diluted 0.01 0.44 0.06 (0.04) 0.88 0.13 * Each ADS represents two Class A common shares

9
eHi Car Services Limited Reconciliation of GAAP and Non-GAAP Results
For the Three Months Ended June 30 For the Six Months Ended June 30,
2016
2017
2017 2016 2017 2017 RMB
RMB
USD RMB RMB USD
Unaudited
Unaudited Unaudited Unaudited Unaudited Unaudited Net Income / (loss) 812,456 30,365,061 4,479,085 (2,928,890) 61,165,258 9,022,356 Add / (subtract):
Share-based compensation 3,546,972 3,795,944 559,932 7,156,396 7,512,391 1,108,137 Interest income (2,993,663) (2,669,702) (393,802) (4,553,855) (4,863,411) (717,391) Interest expense 56,453,714 56,714,993 8,365,907 112,592,807 112,291,027 16,563,809 Provision for income
taxes 2,503,203 7,677,416 1,132,479 2,771,419 14,593,365 2,152,636
Adjusted EBIT 60,322,682 95,883,712 14,143,601 115,037,877 190,698,630 28,129,547
Depreciation and amortization 157,540,717 190,363,384 28,080,095 304,732,127 367,406,312 54,195,318
Adjusted EBITDA 217,863,399
286,247,096 42,223,696 419,770,004 558,104,942 82,324,865


![[CASE STUDY] - Keptifykeptify.com/resources/snaprental.pdf[CASE STUDY] MEET SNAP RENTALS Snap Rentals is New Zealand's fastest growing and most innovative car rental company. With](https://static.fdocuments.net/doc/165x107/5ec5493c1146c40e7c4494ae/case-study-case-study-meet-snap-rentals-snap-rentals-is-new-zealands-fastest.jpg)