Egypt Economic 022009
5
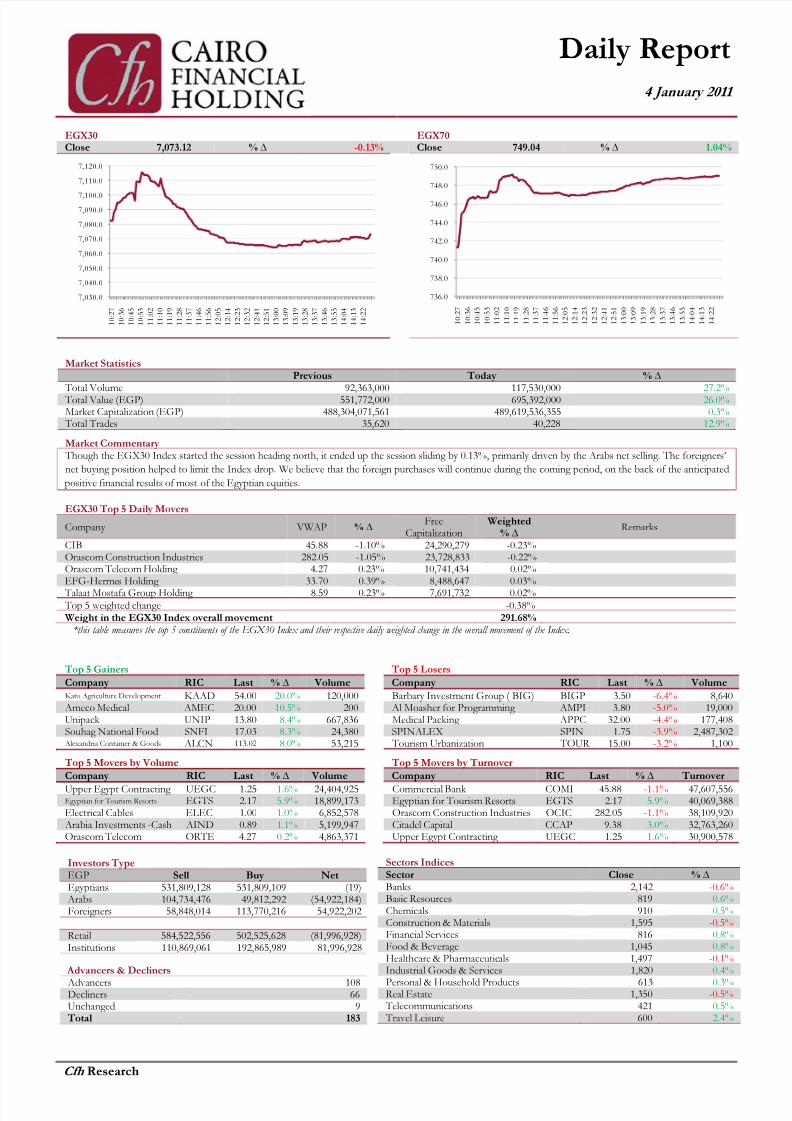
Daily Report 4 January 2011 Cfh Research Top 5 Gainers Top 5 Losers Company RIC Last % ∆ Volume Company RIC Last % ∆ Volume Kato Agriculture Development KAAD 54.00 20.0% 120,000 Barbary Investment Group ( BIG) BIGP 3.50 -6.4% 8,640 Ameco Medical AMEC 20.00 10.5% 200 Al Moasher for Programming AMPI 3.80 -5.0% 19,000 Unipack UNIP 13.80 8.4% 667,836 Medical Packing APPC 32.00 -4.4% 177,408 Souhag National Food SNFI 17.03 8.3% 24,380 SPINALEX SPIN 1.75 -3.9% 2,487,302 Alexandria Container & Goods ALCN 113.02 8.0% 53,215 Tourism Urbanization TOUR 15.00 -3.2% 1,100 Top 5 Movers by Volume Top 5 Movers by Turnover Company RIC Last % ∆ Volume Company RIC Last % ∆ Turnover Upper Egypt Contracting UEGC 1.25 1.6% 24,404,925 Commercial Bank COMI 45.88 -1.1% 47,607,556 Egyptian for Tourism Resorts EGTS 2.17 5.9% 18,899,173 Egyptian for Tourism Resorts EGTS 2.17 5.9% 40,069,388 Electrical Cables ELEC 1.00 1.0% 6,852,578 Orascom Construction Industries OCIC 282.05 -1.1% 38,109,920 Arabia Investments -Cash AIND 0.89 1.1% 5,199,947 Citadel Capital CCAP 9.38 3.0% 32,763,260 Orascom Telecom ORTE 4.27 0.2% 4,863,371 Upper Egypt Contracting UEGC 1.25 1.6% 30,900,578 Market Statistics Previous Today % ∆ Total Volume 92,363,000 117,530,000 27.2% Total Value (EGP) 551,772,000 695,392,000 26.0% Market Capitalization (EGP) 488,304,071,561 489,619,536,355 0.3% Total Trades 35,620 40,228 12.9% Market Commentary Though the EGX30 Index started the session heading north, it ended up the session sliding by 0.13%, primarily driven by the Arabs net selling. The foreigners’ net buying position helped to limit the Index drop. We believe that the foreign purchases will continue during the coming period, on the back of the anticipated positive financial results of most of the Egyptian equities. EGX30 Top 5 Daily Movers Company VWAP % ∆ Free Capitalization Weighted % ∆ Remarks CIB 45.88 -1.10% 24,290,279 -0.23% Orascom Construction Industries 282.05 -1.05% 23,728,833 -0.22% Orascom Telecom Holding 4.27 0.23% 10,741,434 0.02% EFG-Herme s Holding 33.70 0.39% 8,488,647 0.03% Talaat Mostafa Group Holding 8.59 0.23% 7,691,732 0.02% Top 5 weighted change -0.38% Weight in the EGX30 Index overall movement 291.68% *this table measures the top 5 constituents of the EGX30 Index and their respective daily weighted change in the overall movement of the Index. EGX30 EGX70 Close 7,073.12 % ∆ -0.13% Close 749.04 % ∆ 1.04% 7,030.0 7,040.0 7,050.0 7,060.0 7,070.0 7,080.0 7,090.0 7,100.0 7,110.0 7,120.0 1 0 : 2 7 1 0 : 3 6 1 0 : 4 5 1 0 : 5 3 1 1 : 0 2 1 1 : 1 0 1 1 : 1 9 1 1 : 2 8 1 1 : 3 7 1 1 : 4 6 1 1 : 5 6 1 2 : 0 5 1 2 : 1 4 1 2 : 2 3 1 2 : 3 2 1 2 : 4 1 1 2 : 5 1 1 3 : 0 0 1 3 : 0 9 1 3 : 1 9 1 3 : 2 8 1 3 : 3 7 1 3 : 4 6 1 3 : 5 5 1 4 : 0 4 1 4 : 1 3 1 4 : 2 2 736.0 738.0 740.0 742.0 744.0 746.0 748.0 750.0 1 0 : 2 7 1 0 : 3 6 1 0 : 4 5 1 0 : 5 3 1 1 : 0 2 1 1 : 1 0 1 1 : 1 9 1 1 : 2 8 1 1 : 3 7 1 1 : 4 6 1 1 : 5 6 1 2 : 0 5 1 2 : 1 4 1 2 : 2 3 1 2 : 3 2 1 2 : 4 1 1 2 : 5 1 1 3 : 0 0 1 3 : 0 9 1 3 : 1 9 1 3 : 2 8 1 3 : 3 7 1 3 : 4 6 1 3 : 5 5 1 4 : 0 4 1 4 : 1 3 1 4 : 2 2 Investors Type EGP Sell Buy Net Egyptians 531,809,128 531,809,109 (19) Arabs 104,734,476 49,812,292 (54,922,184) Foreigners 58,848,014 113,770,216 54,922,202 Retail 584,522,556 502,525,628 (81,996,928) Institutions 110,869,061 192,865,989 81,996,928 Advancers & Decliners Advancers 108 Decliners 66 Unchanged 9 Total 183 Sectors Indices Sector Close % ∆ Banks 2,142 -0.6% Basic Resources 819 0.6% Chemicals 910 0.5% Construction & Materials 1,595 -0.5% Financial Services 816 0.8% Food & Beverage 1,045 0.8% Healthcare & Pharmaceutic als 1,497 -0.1% Industrial Goods & Services 1,820 0.4% Personal & Household Products 613 0.3% Real Estate 1,350 -0.5% Telecommunications 421 0.5% Travel Leisure 600 2.4%
-
Upload
sagda-abdel-wahab -
Category
Documents
-
view
223 -
download
0
Transcript of Egypt Economic 022009
8/8/2019 Egypt Economic 022009
http://slidepdf.com/reader/full/egypt-economic-022009 1/5
Daily Report
4 January 2011
Cfh Research
Top 5 Gainers Top 5 Losers
Company RIC Last % ∆ Volume Company RIC Last % ∆ VolumeKato Agriculture Development KAAD 54.00 20.0% 120,000 Barbary Investment Group ( BIG) BIGP 3.50 -6.4% 8,640Ameco Medical AMEC 20.00 10.5% 200 Al Moasher for Programming AMPI 3.80 -5.0% 19,000Unipack UNIP 13.80 8.4% 667,836 Medical Packing APPC 32.00 -4.4% 177,408Souhag National Food SNFI 17.03 8.3% 24,380 SPINALEX SPIN 1.75 -3.9% 2,487,302Alexandria Container & Goods ALCN 113.02 8.0% 53,215 Tourism Urbanization TOUR 15.00 -3.2% 1,100
Top 5 Movers by Volume Top 5 Movers by Turnover
Company RIC Last % ∆ Volume Company RIC Last % ∆ Turnover
Upper Egypt Contracting UEGC 1.25 1.6% 24,404,925 Commercial Bank COMI 45.88 -1.1% 47,607,556Egyptian for Tourism Resorts EGTS 2.17 5.9% 18,899,173 Egyptian for Tourism Resorts EGTS 2.17 5.9% 40,069,388Electrical Cables ELEC 1.00 1.0% 6,852,578 Orascom Construction Industries OCIC 282.05 -1.1% 38,109,920Arabia Investments -Cash AIND 0.89 1.1% 5,199,947 Citadel Capital CCAP 9.38 3.0% 32,763,260Orascom Telecom ORTE 4.27 0.2% 4,863,371 Upper Egypt Contracting UEGC 1.25 1.6% 30,900,578
Market StatisticsPrevious Today % ∆
Total Volume 92,363,000 117,530,000 27.2%Total Value (EGP) 551,772,000 695,392,000 26.0%Market Capitalization (EGP) 488,304,071,561 489,619,536,355 0.3%Total Trades 35,620 40,228 12.9%
Market Commentary Though the EGX30 Index started the session heading north, it ended up the session sliding by 0.13%, primarily driven by the Arabs net selling. The foreigners’
net buying position helped to limit the Index drop. We believe that the foreign purchases will continue during the coming period, on the back of the anticipated
positive financial results of most of the Egyptian equities.
EGX30 Top 5 Daily Movers
Company VWAP % ∆Free
CapitalizationWeighted
% ∆Remarks
CIB 45.88 -1.10% 24,290,279 -0.23%Orascom Construction Industries 282.05 -1.05% 23,728,833 -0.22%Orascom Telecom Holding 4.27 0.23% 10,741,434 0.02%EFG-Hermes Holding 33.70 0.39% 8,488,647 0.03%
Talaat Mostafa Group Holding 8.59 0.23% 7,691,732 0.02%Top 5 weighted change -0.38%Weight in the EGX30 Index overall movement 291.68%
*this table measures the top 5 constituents of the EGX30 Index and their respective daily weighted change in the overall movement of the Index.
EGX30 EGX70Close 7,073.12 % ∆ -0.13% Close 749.04 % ∆ 1.04%
7,030.0
7,040.0
7,050.0
7,060.0
7,070.0
7,080.0
7,090.0
7,100.0
7,110.0
7,120.0
1 0 : 2 7
1 0 : 3 6
1 0 : 4 5
1 0 : 5 3
1 1 : 0 2
1 1 : 1 0
1 1 : 1 9
1 1 : 2 8
1 1 : 3 7
1 1 : 4 6
1 1 : 5 6
1 2 : 0 5
1 2 : 1 4
1 2 : 2 3
1 2 : 3 2
1 2 : 4 1
1 2 : 5 1
1 3 : 0 0
1 3 : 0 9
1 3 : 1 9
1 3 : 2 8
1 3 : 3 7
1 3 : 4 6
1 3 : 5 5
1 4 : 0 4
1 4 : 1 3
1 4 : 2 2
736.0
738.0
740.0
742.0
744.0
746.0
748.0
750.0
1 0 : 2 7
1 0 : 3 6
1 0 : 4 5
1 0 : 5 3
1 1 : 0 2
1 1 : 1 0
1 1 : 1 9
1 1 : 2 8
1 1 : 3 7
1 1 : 4 6
1 1 : 5 6
1 2 : 0 5
1 2 : 1 4
1 2 : 2 3
1 2 : 3 2
1 2 : 4 1
1 2 : 5 1
1 3 : 0 0
1 3 : 0 9
1 3 : 1 9
1 3 : 2 8
1 3 : 3 7
1 3 : 4 6
1 3 : 5 5
1 4 : 0 4
1 4 : 1 3
1 4 : 2 2
Investors TypeEGP Sell Buy Net Egyptians 531,809,128 531,809,109 (19)Arabs 104,734,476 49,812,292 (54,922,184)Foreigners 58,848,014 113,770,216 54,922,202
Retail 584,522,556 502,525,628 (81,996,928)Institutions 110,869,061 192,865,989 81,996,928
Advancers & Decliners
Advancers 108Decliners 66Unchanged 9Total 183
Sectors IndicesSector Close % ∆Banks 2,142 -0.6%Basic Resources 819 0.6%Chemicals 910 0.5%Construction & Materials 1,595 -0.5%Financial Services 816 0.8%Food & Beverage 1,045 0.8%Healthcare & Pharmaceuticals 1,497 -0.1%Industrial Goods & Services 1,820 0.4%
Personal & Household Products 613 0.3%Real Estate 1,350 -0.5%Telecommunications 421 0.5%Travel Leisure 600 2.4%
8/8/2019 Egypt Economic 022009
http://slidepdf.com/reader/full/egypt-economic-022009 2/5
Daily Report
4 January 2011
Cfh Research
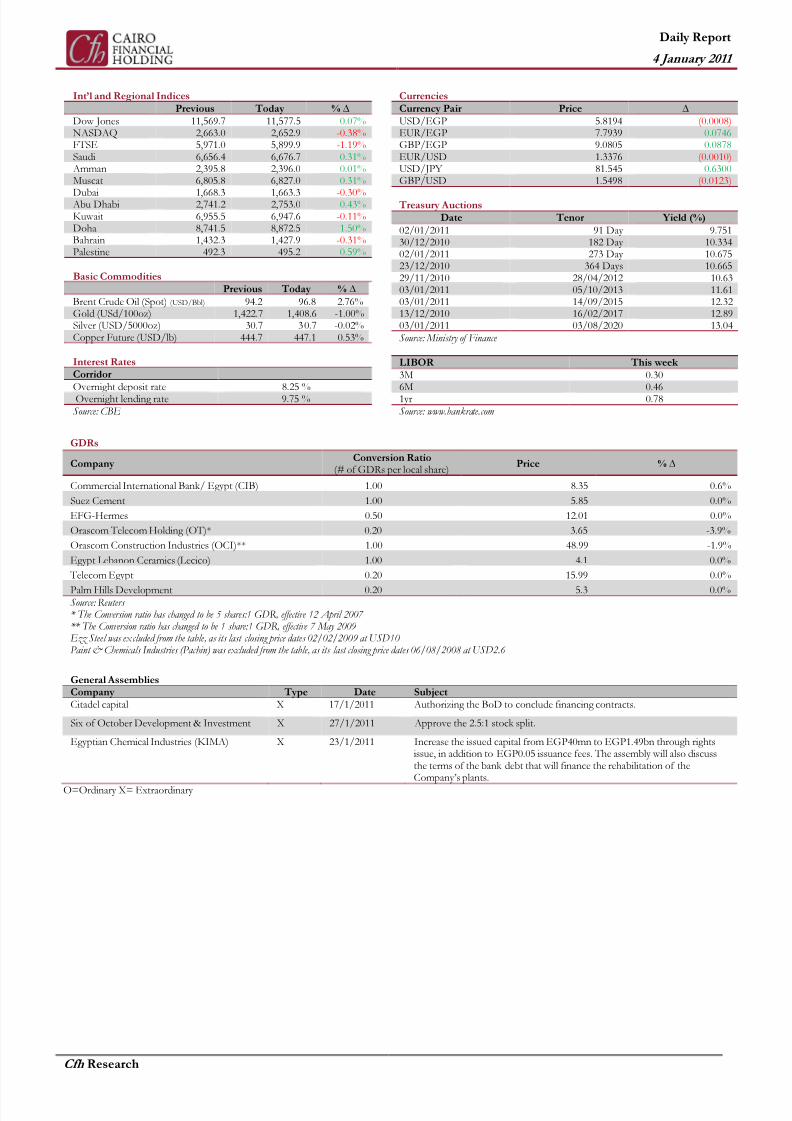
GDRs
Company Conversion Ratio
(# of GDRs per local share)Price % ∆
Commercial International Bank/ Egypt (CIB) 1.00 8.35 0.6%
Suez Cement 1.00 5.85 0.0%
EFG-Hermes 0.50 12.01 0.0%
Orascom Telecom Holding (OT)* 0.20 3.65 -3.9%
Orascom Construction Industries (OCI)** 1.00 48.99 -1.9%
Egypt Lebanon Ceramics (Lecico) 1.00 4.1 0.0%
Telecom Egypt 0.20 15.99 0.0%
Palm Hills Development 0.20 5.3 0.0%Source: Reuters * The Conversion ratio has changed to be 5 shares:1 GDR, effective 12 April 2007 ** The Conversion ratio has changed to be 1 share:1 GDR, effective 7 May 2009 Ezz Steel was excluded from the table, as its last closing price dates 02/02/2009 at USD10 Paint & Chemicals Industries (Pachin) was excluded from the table, as its last closing price dates 06/08/2008 at USD2.6
General Assemblies Company Type Date Subject Citadel capital X 17/1/2011 Authorizing the BoD to conclude financing contracts.
Six of October Development & Investment X 27/1/2011 Approve the 2.5:1 stock split.
Egyptian Chemical Industries (KIMA) X 23/1/2011 Increase the issued capital from EGP40mn to EGP1.49bn through rightsissue, in addition to EGP0.05 issuance fees. The assembly will also discussthe terms of the bank debt that will finance the rehabilitation of theCompany’s plants.
O=Ordinary X= Extraordinary
Int’l and Regional Indices
Previous Today % ∆
Dow Jones 11,569.7 11,577.5 0.07%NASDAQ 2,663.0 2,652.9 -0.38%FTSE 5,971.0 5,899.9 -1.19%Saudi 6,656.4 6,676.7 0.31%Amman 2,395.8 2,396.0 0.01%Muscat 6,805.8 6,827.0 0.31%
Dubai 1,668.3 1,663.3 -0.30%Abu Dhabi 2,741.2 2,753.0 0.43%Kuwait 6,955.5 6,947.6 -0.11%Doha 8,741.5 8,872.5 1.50%Bahrain 1,432.3 1,427.9 -0.31%Palestine 492.3 495.2 0.59%
Basic Commodities
Previous Today % ∆
Brent Crude Oil (Spot) (USD/Bbl) 94.2 96.8 2.76%Gold (USd/100oz) 1,422.7 1,408.6 -1.00%Silver (USD/5000oz) 30.7 30.7 -0.02%Copper Future (USD/lb) 444.7 447.1 0.53%
Interest RatesCorridor
Overnight deposit rate 8.25 %Overnight lending rate 9.75 %Source: CBE
Currencies
Currency Pair Price ∆
USD/EGP 5.8194 (0.0008)EUR/EGP 7.7939 0.0746GBP/EGP 9.0805 0.0878EUR/USD 1.3376 (0.0010)USD/JPY 81.545 0.6300GBP/USD 1.5498 (0.0123)
Treasury Auctions
Date Tenor Yield (%)
02/01/2011 91 Day 9.75130/12/2010 182 Day 10.33402/01/2011 273 Day 10.67523/12/2010 364 Days 10.66529/11/2010 28/04/2012 10.6303/01/2011 05/10/2013 11.6103/01/2011 14/09/2015 12.3213/12/2010 16/02/2017 12.8903/01/2011 03/08/2020 13.04Source: Ministry of Finance
LIBOR This week
3M 0.306M 0.461yr 0.78Source: www.bankrate.com
8/8/2019 Egypt Economic 022009
http://slidepdf.com/reader/full/egypt-economic-022009 3/5
Daily Report
4 January 2011
Cfh Research
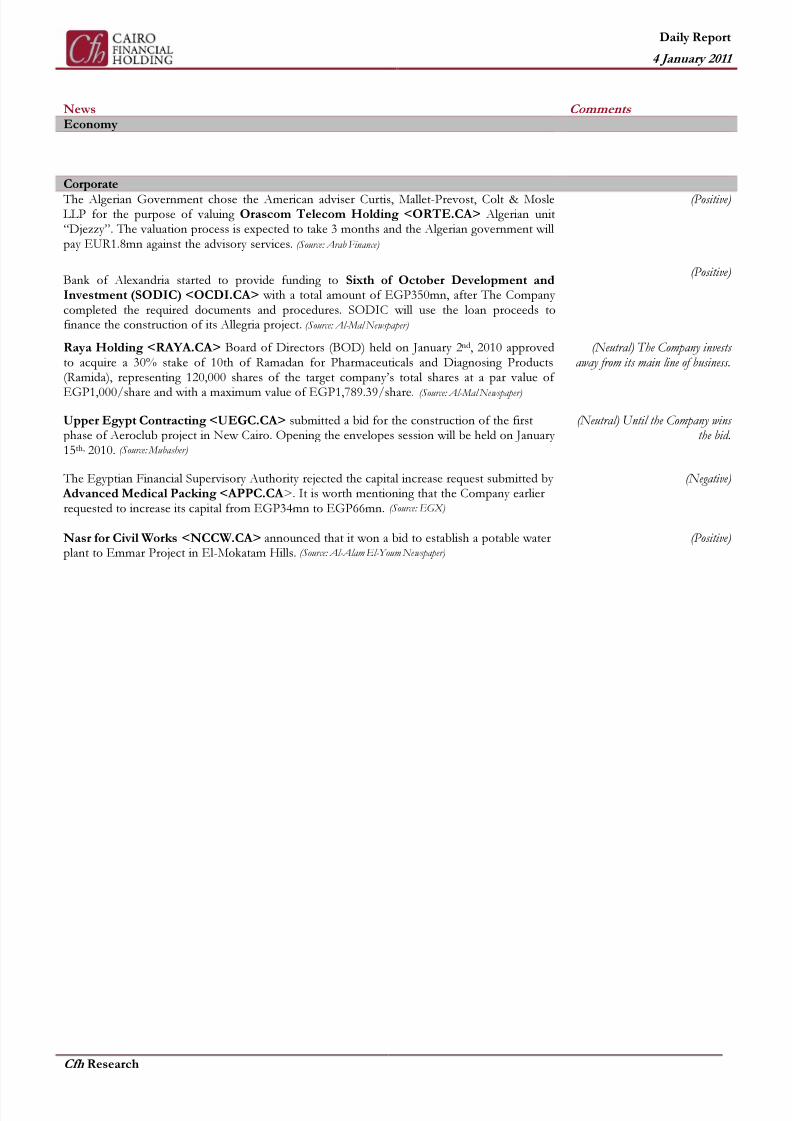
News Comments
Economy
Corporate
The Algerian Government chose the American adviser Curtis, Mallet-Prevost, Colt & MosleLLP for the purpose of valuing Orascom Telecom Holding <ORTE.CA> Algerian unit“Djezzy”. The valuation process is expected to take 3 months and the Algerian government willpay EUR1.8mn against the advisory services. (Source: Arab Finance)
(Positive)
Bank of Alexandria started to provide funding to Sixth of October Development andInvestment (SODIC) <OCDI.CA> with a total amount of EGP350mn, after The Companycompleted the required documents and procedures. SODIC will use the loan proceeds tofinance the construction of its Allegria project. (Source: Al-Mal Newspaper)
(Positive)
Raya Holding <RAYA.CA> Board of Directors (BOD) held on January 2nd, 2010 approvedto acquire a 30% stake of 10th of Ramadan for Pharmaceuticals and Diagnosing Products(Ramida), representing 120,000 shares of the target company’s total shares at a par value of
EGP1,000/share and with a maximum value of EGP1,789.39/share. (Source: Al-Mal Newspaper)
(Neutral) The Company invests away from its main line of business.
Upper Egypt Contracting <UEGC.CA> submitted a bid for the construction of the firstphase of Aeroclub project in New Cairo. Opening the envelopes session will be held on January15th, 2010. (Source: Mubasher)
(Neutral) Until the Company wins the bid.
The Egyptian Financial Supervisory Authority rejected the capital increase request submitted by Advanced Medical Packing <APPC.CA >. It is worth mentioning that the Company earlierrequested to increase its capital from EGP34mn to EGP66mn. (Source: EGX)
(Negative)
Nasr for Civil Works <NCCW.CA> announced that it won a bid to establish a potable waterplant to Emmar Project in El-Mokatam Hills. (Source: Al-Alam El-Youm Newspaper)
(Positive)
8/8/2019 Egypt Economic 022009
http://slidepdf.com/reader/full/egypt-economic-022009 4/5
8/8/2019 Egypt Economic 022009
http://slidepdf.com/reader/full/egypt-economic-022009 5/5