eG Enterprise v6 - Infrastructure Monitoring Measurements Manuals...... A high-level view of the...
46
Monitoring Siebel Enterprise eG Enterprise v6
Transcript of eG Enterprise v6 - Infrastructure Monitoring Measurements Manuals...... A high-level view of the...

Monitoring Siebel Enterprise
eG Enterprise v6

Restricted Rights Legend
The information contained in this document is confidential and subject to change without notice. No
part of this document may be reproduced or disclosed to others without the prior permission of eG
Innovations Inc. eG Innovations Inc. makes no warranty of any kind with regard to the software and
documentation, including, but not limited to, the implied warranties of merchantability and fitness for
a particular purpose.
Trademarks
Microsoft Windows, Windows NT, Windows 2000, Windows 2003 and Windows 2008 are either
registered trademarks or trademarks of Microsoft Corporation in United States and/or other countries.
The names of actual companies and products mentioned herein may be the trademarks of their
respective owners.
Copyright
©2014 eG Innovations Inc. All rights reserved.

Table of Contents INTRODUCTION ................................................................................................................................................................................................... 1
MONITORING THE SIEBEL WEB SERVER .................................................................................................................................................... 5
2.1 THE SIEBEL WEB LAYER .............................................................................................................................................................................. 6 2.1.1 Siebel Accesses Test ........................................................................................................................................................................ 7 2.1.2 Siebel Error Log Test ...................................................................................................................................................................... 7 2.1.3 Siebel Sessions Test ...................................................................................................................................................................... 11 2.1.4 Siebel Events Test ......................................................................................................................................................................... 12 2.1.5 Siebel Locks Test........................................................................................................................................................................... 14
MONITORING SIEBEL GATEWAY SERVER................................................................................................................................................ 16
3.1 THE SIEBEL GATEWAY LAYER ................................................................................................................................................................... 17 3.1.1 Siebel Gateway Errors Test .......................................................................................................................................................... 17
3.2 THE WINDOWS SERVICE LAYER ................................................................................................................................................................. 21
MONITORING THE SIEBEL APPLICATION SERVER ............................................................................................................................... 22
4.1 THE SIEBEL DATABASE LAYER .................................................................................................................................................................. 23 4.1.1 Siebel SQLs Test ........................................................................................................................................................................... 23 4.1.2 Siebel Network Test ...................................................................................................................................................................... 26
4.2 THE SIEBEL APPLICATION LAYER .............................................................................................................................................................. 29 4.2.1 Siebel Object Managers Test ........................................................................................................................................................ 29 4.2.2 Siebel Stats Test ............................................................................................................................................................................ 31 4.2.3 Siebel Server Log Test .................................................................................................................................................................. 33 4.2.4 Siebel Tasks Test ........................................................................................................................................................................... 36 4.2.5 Siebel Traffic Test ......................................................................................................................................................................... 38
TROUBLESHOOTING ........................................................................................................................................................................................ 40
CONCLUSION ...................................................................................................................................................................................................... 42

Table of Figures
Figure 1.1: A high-level view of the Siebel application suite architecture ................................................................................................................. 2 Figure 1.2: The topology model of the monitored Siebel environment...................................................................................................................... 4 Figure 2.1: Layer model for a Siebel Web Server ..................................................................................................................................................... 6 Figure 2.2: Tests associated with the Siebel Web layer ............................................................................................................................................. 6 Figure 3.1: Layer model of the Siebel Gateway Server ........................................................................................................................................... 16 Figure 3.2: The tests associated with the Siebel Gateway layer ............................................................................................................................... 17 Figure 3.3: shows the tests associated with the Win_Service Layer ....................................................................................................................... 21 Figure 4.1: The layer model for the Siebel Application server. ............................................................................................................................... 22 Figure 4.2: The tests associated with Siebel Database layer .................................................................................................................................... 23 Figure 4.3: The Data source name ........................................................................................................................................................................... 27 Figure 4.4: Selecting the Siebel database Properties................................................................................................................................................ 28 Figure 4.5: The General tab displaying the database Owner.................................................................................................................................... 28 Figure 4.6: The tests associated with the Siebel Application Layer ......................................................................................................................... 29

I n t r o d u c t i o n
1
Introduction
Ever since business entities decided to go online with their service offerings, they have been having
trouble dealing with a fast-expanding customer base and ever-mounting customer concerns. The lack
of any efficient mechanism to manage the growing list of permanent/probable users to the service,
caused the enterprise to lose millions; delays in follow-up calls lead to slow or no conversions, and
poor customer support resulted in a loss of goodwill. That should explain why the service sector
organizations providing business-critical services to end-users, have been turning to Customer
Relationship Management (CRM) solutions like Siebel for help.
Siebel CRM-packaged business applications have become key enablers of an enterprise’s customer-
facing business processes. From tracking enquiries received from prospects to providing timely
support to customers, the Seibel CRM modules automate the complete spectrum of activities that form
part of an enterprise's marketing, sales, and support cycles. The wide capabilities of the Siebel
solution demand a complex architecture; accordingly, you have a Siebel web client that front-ends
requests to a Siebel web server, a Siebel gateway that grants the web requests access to the Siebel
application servers, the Siebel application servers that process the requests by applying the business
logic, and finally, the database server which stores and maintains the resultant data.
Chapter
1

I n t r o d u c t i o n
2
Figure 1.1: A high-level view of the Siebel application suite architecture
As multiple tiers of components are at work here, a problem with one tier/component can ripple and
affect the performance of the dependent tiers. Siebel administrators therefore, often find it very
difficult to determine where the real problem lies - is it with the Siebel web server? the Siebel
gateway? the Siebel application server? or the database? The source of the problem has to be
identified and necessary correction/optimization steps need to be taken to improve service
performance and avoid service outages. What Siebel administrators need therefore, is an integrated
solution that can monitor the entire chain of Siebel enterprise servers, taking into consideration the
inter-dependencies that exist between them.
The eG Enterprise Suite, with its 100% web-based architecture and patented correlation and root-
cause diagnosis capability, is ideal for monitoring Siebel environments. This solution offers exclusive
monitoring models for analysing the availability and overall health of every Siebel component. The
data collectors employed by the suite extract a wide variety of performance statistics pertaining to the
availability, responsiveness, session information, error logs and key tasks executing on these
components. Besides measuring the health of the critical ingredients of a typical Siebel infrastructure,
eG Enterprise also focuses on the performance of the operating systems that host the Siebel
Enterprise components. Accordingly, a wealth of host-level performance information, which includes
metrics on resource (CPU/memory/disk) usage by the host, key processes executing on the host,
network availability and traffic to and from the host, etc., are collected. Using such extensive
performance data, administrators can easily find answers to common Siebel Enterprise related queries
like:
Siebel Web Server
Monitoring Is the web server available?
Is it responding quickly to client requests?
Are any Siebel modules accessed very often? If so, which ones are
they?
How many sessions are currently active on the web server?
Did the sessions open too slowly? What about session closure? Did
it also take too long?
Were the sessions open for too long?

I n t r o d u c t i o n
3
Are there any anonymous sessions?
Are too many errors logged in the error log?
Siebel Gateway
Monitoring Are too many errors logged in the error log? If so, what are they?
Is the Siebel Gateway server up and running currently?
Is the Siebel Gateway Name Server service available? If so, is it
consuming too much CPU?
Siebel Application
Server Monitoring Is the application server available?
What is the current state of the component object managers? Have
adequate object managers been spawned for the business process
currently in use?
Has the object manager reached the maximum tasks limit?
How quickly does it respond to requests?
Are too many anonymous locks currently held? If so, how long were
they held?
Is the server overloaded with tasks or are only a few currently
running?
Is the server able to easily connect to the database or are
connection retries necessary?
How quickly is the server able to execute/fetch/parse SQL queries
on the database?
Database server
monitoring Is the database server available?
Does it respond to requests quickly? If not, which are the queries
that are taking too much time?
How are the SQL fetches, parses and execution happening in the
database?
What is the typical workload on the database server?
What is the typical locking activity on the database?
Which processes are being blocked and by whom?
How many processes are running, and what queries are they
executing? Which user(s) are executing these queries?
Which of the databases is seeing more transaction activity?
Moreover, the suite's end-to-end service monitoring capability and its patented root-cause diagnosis
algorithm enable automatic correlation of the performance of the various Siebel components and quick
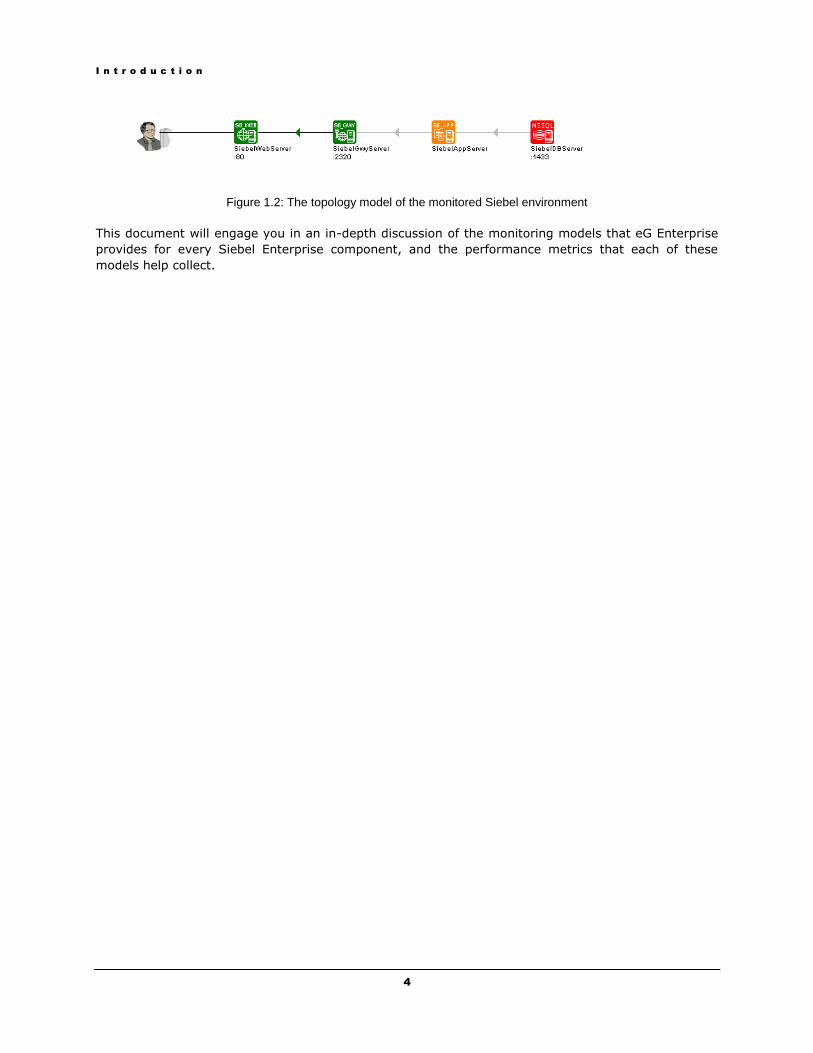
and accurate problem isolation. By graphically representing a Siebel environment (see Figure 1.2), eG
Enterprise enables administrators to quickly understand the interdependencies among Siebel
components and their cause-effect relationships, and accurately judge root-cause of issues.
I n t r o d u c t i o n
4
Figure 1.2: The topology model of the monitored Siebel environment
This document will engage you in an in-depth discussion of the monitoring models that eG Enterprise
provides for every Siebel Enterprise component, and the performance metrics that each of these
models help collect.

M o n i t o r i n g t h e S i e b e l W e b S e r v e r
5
Monitoring the Siebel Web Server
Using the Siebel web server extension running within, the Siebel Web Server maintains user sessions
and manages the communication to Siebel Enterprise. The Siebel Web monitoring model (see Figure
2.1) that eG Enterprise prescribes for the Siebel Web server therefore, focuses on session behavior
and related abnormalities.
To enable the eG agent to collect the session-specific and other statistics from the web server, you
need to configure the web server in the following manner:
Edit the <SIEBEL_INSTALL_DIR>\sea<SIEBEL_VERSION>\SWEApp\BIN\eapps.cfg file on the Siebel web
server host. For example, if Siebel 7.0.3 is installed in the C directory of a host, then the path
to the configuration file will be as follows: C:\sea703\SWEApp\BIN\eapps.cfg.
To enable the eG agent to extract session statistics from the web server, ensure that the
SessionMonitor flag in the eapps.cfg file is set to TRUE.
Similarly, by setting the AllowStats flag in the eapps.cfg file to TRUE, you can make sure that
metric-collection is enabled on the Siebel web server to be monitored.
Then, save the file.
Finally, restart the web server (in case of a Unix environment) or restart services such as such
as WWW after the eapps.cfg file is changed.
Once monitoring is enabled on the web server, the eG agent can proceed to execute tests on the web
server to determine the following:
Is the web server available?
Is it responding quickly to client requests?
Which are the most popular Siebel modules in terms of the number and duration of accesses?
How many sessions are currently active on the web server?
Did the sessions open too slowly? What about session closure? Did it also take too long?
Were the sessions open for too long?
Are there any anonymous sessions?
Are too many errors logged in the error log?
Chapter
2
M o n i t o r i n g t h e S i e b e l W e b S e r v e r
6
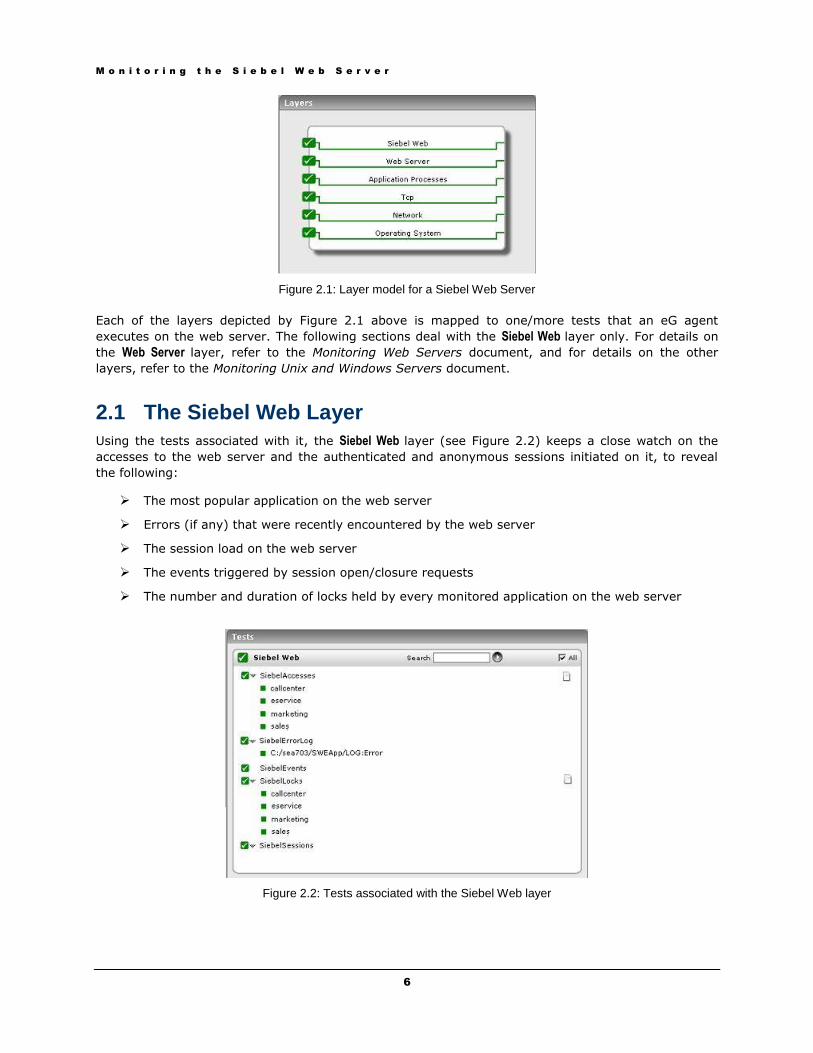
Figure 2.1: Layer model for a Siebel Web Server
Each of the layers depicted by Figure 2.1 above is mapped to one/more tests that an eG agent
executes on the web server. The following sections deal with the Siebel Web layer only. For details on
the Web Server layer, refer to the Monitoring Web Servers document, and for details on the other
layers, refer to the Monitoring Unix and Windows Servers document.
2.1 The Siebel Web Layer
Using the tests associated with it, the Siebel Web layer (see Figure 2.2) keeps a close watch on the
accesses to the web server and the authenticated and anonymous sessions initiated on it, to reveal
the following:
The most popular application on the web server
Errors (if any) that were recently encountered by the web server
The session load on the web server
The events triggered by session open/closure requests
The number and duration of locks held by every monitored application on the web server
Figure 2.2: Tests associated with the Siebel Web layer

M o n i t o r i n g t h e S i e b e l W e b S e r v e r
7
This test reports how often and for how long the configured application modules on the Siebel web
server were accessed.
Purpose Reports how often and for how long were configured application modules on the
Siebel web server used
Target of the
test
A Siebel web server
Agent
deploying the
test
An internal or remote agent
Configurable
parameters for
the test
1. TEST PERIOD - How often should the test be executed
2. HOST – The hostname (or IP address) of the Siebel web server
3. PORT – The port number on which the Siebel web server is listening
4. URL - Specify the URL of the Siebel web server being monitored.
5. APPLICATIONNAME – Provide a comma-separated list of Siebel modules that
need to be monitored. For example, callcenter,eai,ecustomer.
Outputs of the
test
One set of results for each Siebel module monitored.
Measurements
made by the
test
Measurement Measurement
Unit Interpretation
Application hits:
Indicates the number of
current hits to this
application.
Number The value reported by this measure
signifies the load to the specific Siebel
application; it could also indicate how
popular the application is.
Session life span:
Indicates the duration of
sessions to this
application.
Secs
All the events and errors that relate to the web server are tracked by the log file, along with the date,
time and event for each log entry. Periodic monitoring of these log files can provide administrators
with useful pointers to critical errors that might have affected the web server performance in recent
times. The SiebelErrorLog test reports the errors that were newly added to the web server log since
the last measurement period.
Purpose Reports the number of newly added errors to the log file
Target of the
test
A Siebel web server
Agent
deploying the
An internal agent
M o n i t o r i n g t h e S i e b e l W e b S e r v e r
8
test
Configurable
parameters for
the test
1. TEST PERIOD - How often should the test be executed
2. HOST – The hostname (or IP address) of the Siebel web server
3. PORT – The port number on which the Siebel web server is listening
4. ALERTFILE - Specify the path to the log file to be monitored. For eg.,
C:/sea703/SWEBApp/LOG/Siebel_Web_log.txt. Multiple log file paths can be
provided as a comma-separated list.
Also, instead of a specific log file path, the path to the directory containing log
files can be provided - eg., C:/sea703/SWEBApp/LOG. This ensures that eG
Enterprise monitors the most recent log files in the specified directory. Specific
log file name patterns can also be specified. For example, to monitor the latest
log files with names containing the strings 'siebel' and 'log', the parameter
specification can be,
C:/sea703/SWEBApp/LOG/*siebel*,C:/sea703/SWEBApp/LOG/*log*. Here, '*'
indicates leading/trailing characters (as the case may be). In this case, the eG
agent first enumerates all the log files in the specified path that match the given
pattern, and then picks only the latest log file from the result set for monitoring.
You can also configure the path in the following format:Name@logfilepath. Here,
Name represents the display name of the path being configured. Accordingly,
the parameter specification for the 'siebel' and 'log' example discussed above
can be:
siebel@C:/sea703/SWEBApp/LOG/*siebel*,log@C:/sea703/SWEBApp/LOG/*log
*. In this case, the display names 'siebel' and 'log' will alone be displayed as
descriptors of this test.
Every time this test is executed, the eG agent verifies the following:
Whether any changes have occurred in the size and/or timestamp of the log
files that were monitoring during the last measurement period;
Whether any new log files (that match the ALERTFILE specification) have
been newly added since the last measurement period;
If a few lines have been added to a log file that was monitored previously, then
the eG agent monitors the additions to that log file, and then proceeds to
monitor newer log files (if any). If an older log file has been overwritten, then,
the eG agent monitors this log file completely, and then proceeds to monitor the
newer log files (if any).
5. SEARCHPATTERN - Enter the specific patterns of alerts to be monitored. The
pattern should be in the following format: <PatternName>:<Pattern>, where
<PatternName> is the pattern name that will be displayed in the monitor
interface and <Pattern> is an expression of the form - *expr* or expr or *expr
or expr*, etc. A leading '*' signifies any number of leading characters, while a
trailing '*' signifies any number of trailing characters.
For example, say you specify Gen_errors:Generic* in the SEARCHPATTERN text
box. This indicates that "Gen_errors" is the pattern name to be displayed in the
monitor interface. "Generic*" indicates that the test will monitor only those lines
in the log which start with the term "Generic".
A single pattern may also be of the form e1+e2, where + signifies an OR
condition. That is, the <PatternName> is matched if either e1 is true or e2 is
true.

M o n i t o r i n g t h e S i e b e l W e b S e r v e r
9
Multiple search patterns can be specified as a comma-separated list. For
example: Gen_errors:Generic*,Critical_errors:*Error*.
If the ALERTFILE specification is of the format Name@logfilepath, then the
descriptor for this test in the eG monitor interface will be of the format:
Name:PatternName. On the other hand, if the ALERTFILE specification consists
only of a comma-separated list of log file paths, then the descriptors will be of
the format: LogFilePath:PatternName.
6. LINES - Specify two numbers in the format x:y. This means that when a line in
the log file matches a particular pattern, then x lines before the matched line
and y lines after the matched line will be reported in the detail diagnosis output
(in addition to the matched line). The default value here is 0:0. Multiple entries
can be provided as a comma-separated list.
If you give 1:1 as the value for LINES, then this value will be applied to all the
patterns specified in the SEARCHPATTERN field. If you give 0:0,1:1 as the value
for LINES and if the corresponding value in the SEARCHPATTERN filed is like
Gen_errors:Generic*,Critical_errors:*Error*, then:
0:0 will be applied to the Gen_errors:Generic* pattern
1:1 will be applied to the Critical_errors:*Error* pattern
7. EXCLUDEPATTERN - Provide a comma-separated list of patterns to be excluded
from monitoring in the EXCLUDEPATTERN text box. For example
*critical*,*exception*. By default, this parameter is set to 'none'.
8. UNIQUEMATCH - By default, the UNIQUEMATCH parameter is set to FALSE,
indicating that, by default, the test checks every line in the log file for the
existence of each of the configured SEARCHPATTERNS. By setting this
parameter to TRUE, you can instruct the test to ignore a line and move to the
next as soon as a match for one of the configured patterns is found in that line.
For example, assume that Pattern1:*Generic*,Pattern2:*Error* is the
SEARCHPATTERN that has been configured. If UNIQUEMATCH is set to FALSE,
then the test will read every line in the log file completely to check for the
existence of messages embedding the strings 'Generic' and 'Error'. If both the
patterns are detected in the same line, then the number of matches will be
incremented by 2. On the other hand, if UNIQUEMATCH is set to TRUE, then the
test will read a line only until a match for one of the configured patterns is found
and not both. This means that even if the strings 'Generic' and 'Error' follow one
another in the same line, the test will consider only the first match and not the
next. The match count in this case will therefore be incremented by only 1.

M o n i t o r i n g t h e S i e b e l W e b S e r v e r
10
9. ROTATINGFILE - This flag governs the display of descriptors for this test in the
eG monitoring console.
If this flag is set to true and the ALERTFILE text box contains the full path to a
specific (log/text) file, then, the descriptors of this test will be displayed in the
following format: Directory_containing_monitored_file:<SearchPattern>. For
instance, if the ALERTFILE parameter is set to c:\eGurkha\logs\syslog.txt, and
ROTATINGFILE is set to true, then, your descriptor will be of the following
format: c:\eGurkha\logs:<SearchPattern>. On the other hand, if the
ROTATINGFILE flag had been set to false, then the descriptors will be of the
following format: <FileName>:<SearchPattern> - i.e.,
syslog.txt:<SearchPattern> in the case of the example above.
If this flag is set to true and the ALERTFILE parameter is set to the directory
containing log files, then, the descriptors of this test will be displayed in the
format: Configured_directory_path:<SearchPattern>. For instance, if the
ALERTFILE parameter is set to c:\eGurkha\logs, and ROTATINGFILE is set to
true, then, your descriptor will be: c:\eGurkha\logs:<SearchPattern>. On the
other hand, if the ROTATINGFILE parameter had been set to false, then the
descriptors will be of the following format:
Configured_directory:<SearchPattern> - i.e., logs:<SearchPattern> in the case
of the example above.
If this flag is set to true and the ALERTFILE parameter is set to a specific file
pattern, then, the descriptors of this test will be of the following format:
<FilePattern>:<SearchPattern>. For instance, if the ALERTFILE parameter is set
to c:\eGurkha\logs\*sys*, and ROTATINGFILE is set to true, then, your descriptor
will be: *sys*:<SearchPattern>. In this case, the descriptor format will not
change even if the ROTATINGFILE flag status is changed.
10. DETAILED DIAGNOSIS: To make diagnosis more efficient and accurate, the eG
suite embeds an optional detailed diagnostic capability. With this capability, the
eG agents can be configured to run detailed, more elaborate tests as and when
specific problems are detected. To enable the detailed diagnosis capability of
this test for a particular server, choose On option. To disable the capability, click
on Off option. The option to selectively enabled/disable the detailed diagnosis
capability will be available only if the following conditions are fulfilled:
The eG manager license should allow the detailed diagnosis capability.
Both the normal and abnormal frequencies configured for the detailed
diagnosis measures should not be 0.
Outputs of the
test
One set of results for every log file, log file directory, or LogFilePath:PatternName
monitored on the Siebel web server
Measurements
made by the
test
Measurement Measurement
Unit Interpretation
Recent errors:
Indicates the number of
errors that were newly
added to the log file when
the test was last
executed.
Number The value of this measure is a clear
indicator of the number of “new” errors
that have occurred on the monitored
Siebel web server. The detailed
diagnosis of this measure provides the
details of these new errors.

M o n i t o r i n g t h e S i e b e l W e b S e r v e r
11
This test reports key statistics pertaining to the sessions on the Siebel web server.
Purpose Reports key statistics pertaining to the sessions on the Siebel web server
Target of the
test
A Siebel web server
Agent
deploying the
test
An internal or remote agent
Configurable
parameters for
the test
1. TEST PERIOD - How often should the test be executed
2. HOST – The hostname (or IP address) of the Siebel web server
3. PORT – The port number on which the Siebel web server is listening
6. URL - Specify the URL of the Siebel web server being monitored.
4. APPLICATIONNAME – Specifies a comma-separated list of Siebel modules that
need to be monitored.
5. DETAILED DIAGNOSIS: To make diagnosis more efficient and accurate, the eG
suite embeds an optional detailed diagnostic capability. With this capability, the
eG agents can be configured to run detailed, more elaborate tests as and when
specific problems are detected. To enable the detailed diagnosis capability of
this test for a particular server, choose On option. To disable the capability, click
on Off option. The option to selectively enabled/disable the detailed diagnosis
capability will be available only if the following conditions are fulfilled:
The eG manager license should allow the detailed diagnosis capability
Both the normal and abnormal frequencies configured for the detailed
diagnosis measures should not be 0.
Outputs of the
test
One set of results for each Siebel web server monitored
Measurements
made by the
test
Measurement Measurement
Unit Interpretation
Current sessions:
Indicates the number of
sessions currently active
on the Siebel web server.
Number Since the user sessions include data on
any user logged into the Siebel web
server as well as the sessions created by
the Siebel application, this measure is an
accurate indicator of the direct loading
on the web server from clients. As these
user sessions run based on the Siebel
server component task, the information
on the user sessions can be viewed as
either a user session or a task currently
handled by the web server.
The detailed diagnosis of this measure, if
enabled, lists all the current sessions to
the Siebel web server.

M o n i t o r i n g t h e S i e b e l W e b S e r v e r
12
New sessions:
Indicates the number of
sessions that newly
opened on the Siebel Web
server, the last time this
test executed.
Number Tracking the new sessions added over
the monitoring interval enables
administrators to be proactively alerted
of any sudden, unusual increase in the
load on the web server. By observing
session load over a period of time, you
can easily detect load trends, which in
turn, will enable you to plan the capacity
of the web server.
Avg session duration:
Indicates the average
duration of sessions.
Secs An abnormal increase in the value of this
measure could indicate that sessions are
not getting closed properly. This hence
necessitates further investigation.
This test monitors the session related events handled by the Siebel web server. The events are user
specific actions, which help Siebel applications to respond in real time to user requests.
Purpose Monitors the session related events handled by the Siebel Web server.
Target of the
test
A Siebel web server
Agent
deploying the
test
An internal or remote agent
Configurable
parameters for
the test
1. TEST PERIOD - How often should the test be executed
2. HOST – The hostname (or IP address) of the Siebel web server
3. PORT – The port number on which the Siebel web server is listening
7. URL - Specify the URL of the Siebel web server being monitored.
4. APPLICATIONNAME – Specifies a comma-separated list of Siebel modules that
need to be monitored.
Outputs of the
test
One set of results for every configured module on the web server monitored
Measurements
made by the Measurement
Measurement
Unit Interpretation

M o n i t o r i n g t h e S i e b e l W e b S e r v e r
13
test Anonymous sessions
requested:
Indicates the number of
anonymous session
requests handled by the
Siebel web Server.
Sessions Ideally, the value reported for this
measure should be low. A high value for
this measure indicates that the number
of anonymous users accessing the web
server has increased. The benchmark
set for optimizing the Siebel
performance depends upon defining
MaxTasks, MTServers and Anonuserpool
values against the target no of users.
Suppose if your target no of users is
4000 and you have defined
MaxMTServer=MinMTServer to 58, the
MaxTasks defined for this scenario could
be 4600, taking into account the
Anonymous user pool at any point in
time to be 10% (400) of the Target
users. An increase in the number of
anonymous users could affect the ratio
of threads per users, causing
performance degradation in terms of
longer response times.
Anonymous sessions
removed:
Indicates the number of
anonymous sessions
removed/terminated by
the Siebel web server.
Sessions A high value for this indicates that either
sessions are being timed out or
connectivity is not stable enough.
Anonymous sessions
returned:
Indicates the number of
anonymous sessions
returned to the web
server.
Sessions Anonymous sessions returned should be
close to anonymous sessions requested.
Avg time for opening a
session:
This specifies the average
amount of time spent by
the server to open a
session.
Secs A steady/significant increase in the time
taken to open sessions can point to
probable issues, which, if left
unresolved, can impair the end user
experience.
M o n i t o r i n g t h e S i e b e l W e b S e r v e r
14
Avg response time:
Indicates the average
amount of time spent by
the server to respond to
the request.
Secs Ideally the value for this measure should
be low.
Avg time for closing a
session:
Indicates the average
amount of time taken by
the sessions to close.
Secs This event reflects the amount of time it
takes to close a session. Closing the
session might involve signaling to the
session manager to close the session.
The session manager might or might not
close the TCP/IP connection.
If the value of this measure is very high,
it indicates a bottleneck in session
closure. The reasons for the same should
hence be ascertained.
Avg request time:
Indicates the average
amount of taken to
submit a request to the
Siebel Server and to get a
response back.
Secs Ideally the value for this measure should
be low. For example, if the user (on the
browser) clicked on a button then the
plug-in receives the request and invokes
a service on the Siebel Server. The value
for Request Time is the average amount
of time for invoking that service.
This test indicates the number and duration of locks on configured modules on the Siebel web server.
Purpose Indicates the number and duration of locks on configured modules on the web
server
Target of the
test
A Siebel server
Agent
deploying the
test
An internal agent
Configurable
parameters for
the test
1. TEST PERIOD - How often should the test be executed
2. HOST – The hostname (or IP address) of the Siebel server
3. PORT – The port number on which the Siebel server is listening
4. URL - Specify the URL of the Siebel web server being monitored.
5. APPLICATIONNAME – Specifies a comma-separated list of Siebel modules that
need to be monitored.
Outputs of the
test
One set of results for each module configured for monitoring on the Siebel web
server
Measurements
made by the Measurement
Measurement
Unit Interpretation

M o n i t o r i n g t h e S i e b e l W e b S e r v e r
15
test Time taken to initialize
locks:
Represents the time that
an identified user
currently took to initialize
locks on this module.
Secs
Time taken to acquire
anonymous locks:
Represents the time that
an anonymous user
currently took to acquire
locks on this module.
Secs
Initialized locks:
Indicates the number of
locks that are currently
initialized by identified
users to this module.
Number
Anonymous locks:
Indicates the number of
locks on this module that
are currently held by
anonymous users.
Number
Avg time to initialize
locks:
Indicates the average
time taken by identified
users to initialize locks on
this module.
Secs
Avg time to acquire
anonymous locks:
Indicates the average
time taken by anonymous
users to acquire locks on
this module.
Secs

M o n i t o r i n g t h e S i e b e l G a t e w a y S e r v e r
16
Monitoring Siebel Gateway Server
The Gateway Server is a logical server that consists of the Siebel Name Server and optionally
Resonate Central Dispatch. These two components can reside on separate physical servers. The
Gateway Name Server is a repository for configuration information about each Siebel Server. When
Siebel Servers or components come online or go offline the Name Server data is refreshed with the
connect strings. Clients will also use the Gateway Name server to connect to the Siebel Servers if
Resonate Central Dispatch (which is used to load balance and manage client connections to Siebel
Enterprise) is not implemented.
Since the Name server component of the Gateway server maintains the connectivity information
pertaining to every component in Siebel Enterprise, the 24 x 7 availability of the Name server is
crucial to the functioning of the Gateway server, and also for ensuring that client connections to Siebel
servers are not disrupted.
eG Enterprise offers a specialized Siebel Gateway monitoring model (see Figure 3.1), which runs
periodic availability checks on the Gateway server to determine the availability of its Name server
component and related services. This way, availability issues can be proactively detected and resolved
before they affect the end-user experience.
Besides, additions to the Siebel Gateway server's log files are also closely monitored, so that potential
threats to the health of the Gateway server can be promptly detected, and administrators immediately
alerted.
Figure 3.1: Layer model of the Siebel Gateway Server
The sections to come will discuss the first 2 layers of Figure 3.1 alone, as the remaining layers have
been elaborately discussed in the Monitoring Unix and Windows Servers document.
Chapter
3

M o n i t o r i n g t h e S i e b e l G a t e w a y S e r v e r
17
3.1 The Siebel Gateway Layer
Using the Siebel Gateway Errors test, this layer monitors the error logs and indicates whether any new
errors occurred on the Gateway server (see Figure 3.2).
Figure 3.2: The tests associated with the Siebel Gateway layer
This test provides the status of errors logged in the Siebel gateway server log files.
Purpose Provides the status of errors logged in the Siebel gateway server log files
Target of the
test
A Siebel gateway server
Agent
deploying the
test
An internal agent

M o n i t o r i n g t h e S i e b e l G a t e w a y S e r v e r
18
Configurable
parameters for
the test
1. TEST PERIOD - How often should the test be executed
2. HOST – The hostname (or IP address) of the Siebel web server
3. PORT – The port number on which the Siebel web server is listening
4. ALERTFILE - Specify the path to the log file to be monitored. For eg.,
C:/sea703/SWEBApp/LOG/Siebel_Web_log.txt. Multiple log file paths can be
provided as a comma-separated list.
Also, instead of a specific log file path, the path to the directory containing log
files can be provided - eg., C:/sea703/SWEBApp/LOG. This ensures that eG
Enterprise monitors the most recent log files in the specified directory. Specific
log file name patterns can also be specified. For example, to monitor the latest
log files with names containing the strings 'siebel' and 'log', the parameter
specification can be,
C:/sea703/SWEBApp/LOG/*siebel*,C:/sea703/SWEBApp/LOG/*log*. Here, '*'
indicates leading/trailing characters (as the case may be). In this case, the eG
agent first enumerates all the log files in the specified path that match the given
pattern, and then picks only the latest log file from the result set for monitoring.
You can also configure the path in the following format:Name@logfilepath. Here,
Name represents the display name of the path being configured. Accordingly,
the parameter specification for the 'siebel' and 'log' example discussed above
can be:
siebel@C:/sea703/SWEBApp/LOG/*siebel*,log@C:/sea703/SWEBApp/LOG/*log
*. In this case, the display names 'siebel' and 'log' will alone be displayed as
descriptors of this test.
Every time this test is executed, the eG agent verifies the following:
Whether any changes have occurred in the size and/or timestamp of the log
files that were monitoring during the last measurement period;
Whether any new log files (that match the ALERTFILE specification) have
been newly added since the last measurement period;
If a few lines have been added to a log file that was monitored previously, then
the eG agent monitors the additions to that log file, and then proceeds to
monitor newer log files (if any). If an older log file has been overwritten, then,
the eG agent monitors this log file completely, and then proceeds to monitor the
newer log files (if any).

M o n i t o r i n g t h e S i e b e l G a t e w a y S e r v e r
19
5. SEARCHPATTERN - Enter the specific patterns of alerts to be monitored. The
pattern should be in the following format: <PatternName>:<Pattern>, where
<PatternName> is the pattern name that will be displayed in the monitor
interface and <Pattern> is an expression of the form - *expr* or expr or *expr
or expr*, etc. A leading '*' signifies any number of leading characters, while a
trailing '*' signifies any number of trailing characters.
For example, say you specify Gen_errors:Generic* in the SEARCHPATTERN text
box. This indicates that "Gen_errors" is the pattern name to be displayed in the
monitor interface. "Generic*" indicates that the test will monitor only those lines
in the log which start with the term "Generic".
A single pattern MAY also be of the form e1+e2, where + signifies an OR
condition. That is, the <PatternName> is matched if either e1 is true or e2 is
true.
Multiple search patterns can be specified as a comma-separated list. For
example: Gen_errors:Generic*,Critical_errors:*Error*.
If the ALERTFILE specification is of the format Name@logfilepath, then the
descriptor for this test in the eG monitor interface will be of the format:
Name:PatternName. On the other hand, if the ALERTFILE specification consists
only of a comma-separated list of log file paths, then the descriptors will be of
the format: LogFilePath:PatternName.
6. LINES - Specify two numbers in the format x:y. This means that when a line in
the log file matches a particular pattern, then x lines before the matched line
and y lines after the matched line will be reported in the detail diagnosis output
(in addition to the matched line). The default value here is 0:0. Multiple entries
can be provided as a comma-separated list.
If you give 1:1 as the value for LINES, then this value will be applied to all the
patterns specified in the SEARCHPATTERN field. If you give 0:0,1:1 as the value
for LINES and if the corresponding value in the SEARCHPATTERN filed is like
Gen_errors:Generic*,Critical_errors:*Error*, then:
0:0 will be applied to the Gen_errors:Generic* pattern
1:1 will be applied to the Critical_errors:*Error* pattern
7. EXCLUDEPATTERN - Provide a comma-separated list of patterns to be excluded
from monitoring in the EXCLUDEPATTERN text box. For example *critical*,
*generic*. By default, this parameter is set to 'none'.

M o n i t o r i n g t h e S i e b e l G a t e w a y S e r v e r
20
8. UNIQUEMATCH - By default, the UNIQUEMATCH parameter is set to FALSE,
indicating that, by default, the test checks every line in the log file for the
existence of each of the configured SEARCHPATTERNS. By setting this
parameter to TRUE, you can instruct the test to ignore a line and move to the
next as soon as a match for one of the configured patterns is found in that line.
For example, assume that Pattern1:*Generic*,Pattern2:*Error* is the
SEARCHPATTERN that has been configured. If UNIQUEMATCH is set to FALSE,
then the test will read every line in the log file completely to check for the
existence of messages embedding the strings 'Generic' and 'Error'. If both the
patterns are detected in the same line, then the number of matches will be
incremented by 2. On the other hand, if UNIQUEMATCH is set to TRUE, then the
test will read a line only until a match for one of the configured patterns is found
and not both. This means that even if the strings 'Generic' and 'Error' follow one
another in the same line, the test will consider only the first match and not the
next. The match count in this case will therefore be incremented by only 1.
9. ROTATINGFILE - This flag governs the display of descriptors for this test in the
eG monitoring console.
If this flag is set to true and the ALERTFILE text box contains the full path to a
specific (log/text) file, then, the descriptors of this test will be displayed in the
following format: Directory_containing_monitored_file:<SearchPattern>. For
instance, if the ALERTFILE parameter is set to c:\eGurkha\logs\syslog.txt, and
ROTATINGFILE is set to true, then, your descriptor will be of the following
format: c:\eGurkha\logs:<SearchPattern>. On the other hand, if the
ROTATINGFILE flag had been set to false, then the descriptors will be of the
following format: <FileName>:<SearchPattern> - i.e.,
syslog.txt:<SearchPattern> in the case of the example above.
If this flag is set to true and the ALERTFILE parameter is set to the directory
containing log files, then, the descriptors of this test will be displayed in the
format: Configured_directory_path:<SearchPattern>. For instance, if the
ALERTFILE parameter is set to c:\eGurkha\logs, and ROTATINGFILE is set to
true, then, your descriptor will be: c:\eGurkha\logs:<SearchPattern>. On the
other hand, if the ROTATINGFILE parameter had been set to false, then the
descriptors will be of the following format:
Configured_directory:<SearchPattern> - i.e., logs:<SearchPattern> in the case
of the example above.
If this flag is set to true and the ALERTFILE parameter is set to a specific file
pattern, then, the descriptors of this test will be of the following format:
<FilePattern>:<SearchPattern>. For instance, if the ALERTFILE parameter is set
to c:\eGurkha\logs\*sys*, and ROTATINGFILE is set to true, then, your descriptor
will be: *sys*:<SearchPattern>. In this case, the descriptor format will not
change even if the ROTATINGFILE flag status is changed.

M o n i t o r i n g t h e S i e b e l G a t e w a y S e r v e r
21
11. DETAILED DIAGNOSIS: To make diagnosis more efficient and accurate, the eG
suite embeds an optional detailed diagnostic capability. With this capability, the
eG agents can be configured to run detailed, more elaborate tests as and when
specific problems are detected. To enable the detailed diagnosis capability of
this test for a particular server, choose On option. To disable the capability, click
on Off option. The option to selectively enabled/disable the detailed diagnosis
capability will be available only if the following conditions are fulfilled:
The eG manager license should allow the detailed diagnosis capability.
Both the normal and abnormal frequencies configured for the detailed
diagnosis measures should not be 0.
Outputs of the
test
One set of results for every log file, log file directory, or LogFilePath:PatternName
monitored on the Siebel Gateway server
Measurements
made by the
test Measurement
Measurement
Unit Interpretation
Recent errors:
Indicates the total
number of recent errors
logged in the log file.
Number The value of this measure is a clear
indicator of the number of “new” alerts
that have come into the log file of the
monitored server.
3.2 The Windows Service Layer
The WindowsServices Test mapped to this layer determines the availability of the Name server service
executing on the Gateway server.
Figure 3.3: shows the tests associated with the Win_Service Layer
The WindowsServices test, its parameters, and the measures it reports have been dealt with
extensively in the Monitoring Unix and Windows Servers document.

M o n i t o r i n g t h e S i e b e l A p p l i c a t i o n S e r v e r
22
Monitoring the Siebel Application Server
The Siebel Application Server has one or more physical servers and is the middle tier of the enterprise
architecture. These servers run the components (i.e., programs/tasks that run on the Siebel server to
service user requests) that provide all business logic to the clients.
Performance degradations experienced by the Siebel Application server can therefore cause fatal
errors in business logic execution, and can even bring the entire Siebel environment to a stand-still,
thereby causing customer dissatisfaction and related revenue losses.
It is hence imperative to constantly 'watch over' the functioning of the Siebel server, so that probable
anomalies are promptly isolated and addressed before they can adversely impact the customer
experience.
The Siebel Application monitoring model (see Figure 4.1) that eG Enterprise offers exclusively for the
Siebel application server, runs a wide variety of tests that execute commands on the application
server to determine the overall health of the Siebel server, and its availability to service client
requests.
Figure 4.1: The layer model for the Siebel Application server.
The sections to come will shed light on the Siebel Application and Siebel Database layers of Figure 4.1. For
information on the other layers, refer to the Monitoring Unix and Windows Servers document.
Chapter
4

M o n i t o r i n g t h e S i e b e l A p p l i c a t i o n S e r v e r
23
4.1 The Siebel Database Layer
The tests associated with this layer monitor the availability of the Siebel database and the efficiency
with which the database server handles queries executed by the Siebel server.
Figure 4.2: The tests associated with Siebel Database layer
This test, executed by an internal agent, monitors the overall health of interactions between the Siebel
server and its backend database.
Purpose Monitors the overall health of interactions between the Siebel server and its backend
database
Target of the
test
A Siebel server
Agent
deploying the
test
An internal agent
Configurable
parameters for
the test
1. TEST PERIOD - How often should the test be executed
2. HOST – The hostname (or IP address) of the Siebel server
3. PORT – The port number on which the Siebel server is listening
4. INSTALLDIRECTORY – Provide the full path to the install directory of the Siebel
server
5. GATEWAYSERVER – Provide the IP address/host name of the Gateway server
6. ENTERPRISESERVER - This refers to the name that was specified for the
Enterprise server during a Siebel installation. An Enterprise server is a logical
entity. It collectively represents the Siebel application servers and gateway
server.
7. USERNAME – This test executes a command on the Siebel server to extract the
statistics of interest; this command requires administrator privileges to execute.
Therefore, enter the name of the Siebel administrator.
8. PASSWORD – Specify the administrator password
9. CONFIRM PASSWORD – Confirm the password by retyping it.

M o n i t o r i n g t h e S i e b e l A p p l i c a t i o n S e r v e r
24
Outputs of the
test
One set of results for the monitored Siebel server
Measurements
made by the
test
Measurement Measurement
Unit Interpretation
SQL execute
operations:
Indicates the total
number of SQL execute
operations.
Number
SQL fetch operations:
Indicates the total
number of SQL fetch
operations.
Number A low value is indicative of low fetch-
intensive Siebel queries on the Siebel
database.
SQL parses:
Indicates the total
number of SQL parse
operations.
Number A low value is an indicative of low parse-
intensive queries on the Siebel database.
Total time taken by
SQL executes:
Indicates the total time
taken by SQL execute
operations.
Secs Ideally, the value of this measure should
be low. However, if you find that
execution times are unreasonably long,
look at the execution plan to determine
how the data was accessed. The
following can also be attributed to delays
in SQL execution:
I/O constraint on the disk where
the table or index resides
Logical row lock contention
(because of INSERT, DELETE,
UPDATE and so on)
DB2 connection on page latches
CPU constrained or storage
constrained machine
Total time taken by
SQL fetches:
Indicates the total time
taken for SQL fetch
operations.
Secs A query is request for data. Sometimes,
various queries from the application do
not fetch the entire result requested
which forces the SQL server to hold
shared key or page locks until the entire
result set is fetched, or canceled
(closed).
Tracking this value helps you to
determine the time taken for SQL fetch
operations. If the time taken to fetch all
result rows is high, then it will lock the
tables, thereby blocking other users.

M o n i t o r i n g t h e S i e b e l A p p l i c a t i o n S e r v e r
25
Total time taken by
SQL parses:
Indicates the total time
elapsed for SQL parse
operations.
Secs The parse call – hard or soft – has
overhead due to processing
requirements i.e. actual CPU work
needed by the database engine. During
the hard parse, database engine has to
lock several internal sources to make
sure the structure of the tables involved
does not change. Operations on the
library cache also require locking of
internal sources. These locks are taken
for very short duration of time and have
little effect on the applications
supporting few users. However for
applications that need to scale many
concurrent users, any such lock will
prevent scalability.
A sudden increase in the value for this
measure can affect other operations and
increase the transaction response time.
Avg time for SQL
executes:
Indicates the average
time taken by SQL
execute operations.
Secs If the average elapsed time for SQL
execution is high, it could be due to the
following reasons:
I/O constraint on the disk where
the table or index resides
Logical row lock contention
(because of INSERT, DELETE,
UPDATE and so on)
DB2 connection on page latches
CPU constrained or storage
constrained machine
Avg time for SQL
executes:
Indicates the average
time for SQL fetch
operations.
Secs
Avg time for SQL
parses:
Indicates the average
time for SQL parse
operations.
Secs
Database connection
retries:
Indicates the number of
retries due to database
connection loss.
Number Ideally, this value should be 0.

M o n i t o r i n g t h e S i e b e l A p p l i c a t i o n S e r v e r
26
This test checks whether the database server is accessible from the Siebel server, and if so, indicates
how quickly the database responds to Siebel requests.
Purpose Checks whether the database server is accessible from the Siebel server, and if so,
indicates how quickly the database responds to Siebel requests
Target of the
test
A Siebel server
Agent
deploying the
test
An internal agent
Configurable
parameters for
the test
1. TEST PERIOD - How often should the test be executed
2. HOST – The hostname (or IP address) of the Siebel server
3. PORT – The port number on which the Siebel server is listening
4. INSTALLDIRECTORY – Provide the full path to the install directory of the Siebel
server
5. SIEBELDATASOURCE – One of the key pre-requisites for a Siebel installation is
to create an ODBC Data source exclusively for Siebel Enterprise. The name of
this data source needs to be provided here. To know how to locate the data
source name, refer to Page 27.
6. TABLEOWNERNAME – Specify the name of the owner of any valid table on the
Siebel repository. To know how to find the name of a table owner, follow the
procedure detailed in Page 27.
7. USERNAME – This test executes a command on the Siebel server to extract the
statistics of interest; this command requires administrator privileges to execute.
Therefore, enter the name of the Siebel administrator.
8. PASSWORD – Specify the administrator password
9. CONFIRM PASSWORD – Confirm the password by retyping it.
10. NODE – Specify the host name of the system on which the data source has been
installed; typically, this will be the Siebel server's hostname.
Outputs of the
test
One set of results for each Siebel server monitored
Measurements
made by the
test
Measurement Measurement
Unit Interpretation
Availability:
Indicates whether/not a
healthy network
connection is available
between the Siebel server
and its database server.
Percent Ideally, this value should be 100%. A
zero value reported for this measure
indicates that the database server is not
accessible from the Siebel server. This
could be owing to a faulty network
connection, or a non-availability of the
database server itself.
M o n i t o r i n g t h e S i e b e l A p p l i c a t i o n S e r v e r
27
Response time:
Indicates the time taken
by the database server to
respond to the Siebel
requests.
Secs An increase in response time can be due
to many reasons such as sudden
increase in the number of tasks waiting
to be processed, lack of memory, high
CPU utilization, buffer pools not properly
sized etc.
To view a list of data sources to choose from, do the following:
1. On the ODBC host, follow the menu sequence Start -> Programs -> Administrative Tools -> Data
Sources (ODBC).
2. In the ODBC Data Source Administrator dialog box that appears, click on the System DSN tab.
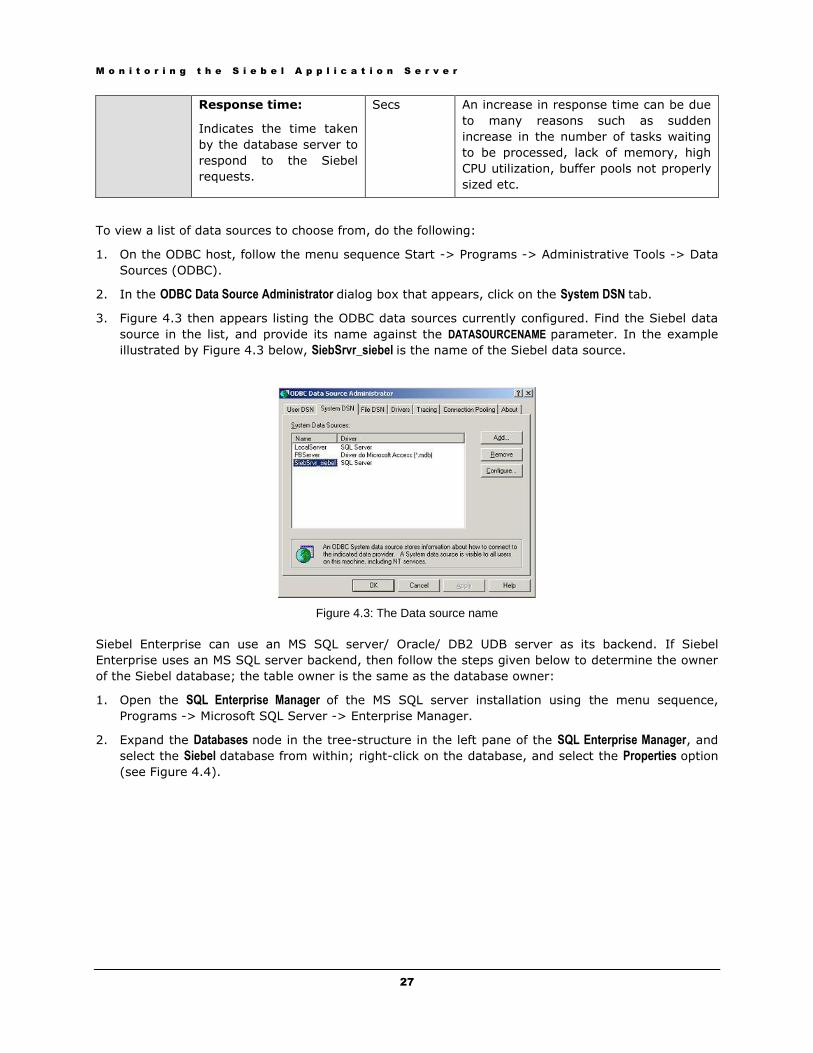
3. Figure 4.3 then appears listing the ODBC data sources currently configured. Find the Siebel data
source in the list, and provide its name against the DATASOURCENAME parameter. In the example
illustrated by Figure 4.3 below, SiebSrvr_siebel is the name of the Siebel data source.
Figure 4.3: The Data source name
Siebel Enterprise can use an MS SQL server/ Oracle/ DB2 UDB server as its backend. If Siebel
Enterprise uses an MS SQL server backend, then follow the steps given below to determine the owner
of the Siebel database; the table owner is the same as the database owner:
1. Open the SQL Enterprise Manager of the MS SQL server installation using the menu sequence,
Programs -> Microsoft SQL Server -> Enterprise Manager.
2. Expand the Databases node in the tree-structure in the left pane of the SQL Enterprise Manager, and
select the Siebel database from within; right-click on the database, and select the Properties option
(see Figure 4.4).

M o n i t o r i n g t h e S i e b e l A p p l i c a t i o n S e r v e r
28
Figure 4.4: Selecting the Siebel database Properties
3. In the Properties dialog box that appears, you will find a name against the Owner field. This name
should be specified as the TABLEOWNERNAME (see Figure 4.5).
Figure 4.5: The General tab displaying the database Owner

M o n i t o r i n g t h e S i e b e l A p p l i c a t i o n S e r v e r
29
4.2 The Siebel Application Layer
Using the tests associated with this layer, you can determine the following:
The availability, responsiveness, and resource usage of the object managers on the Siebel
server
Whether the object managers are overloaded with tasks
Recent errors encountered by the Siebel server
Level of data traffic to and from the Siebel server
Figure 4.6: The tests associated with the Siebel Application Layer
The requests to every application executing on a Siebel server are typically handled by one/more
object managers. If the object manager required by an application is not running, then the Siebel
server will be forced to reject all requests for that application, causing the end-user to suffer. The
SiebelObjectManagers test monitors each of the object managers to ascertain their current state and
load.
Purpose Monitors each of the object managers to ascertain their current state and load.
Target of the
test
A Siebel server
Agent
deploying the
test
An internal agent

M o n i t o r i n g t h e S i e b e l A p p l i c a t i o n S e r v e r
30
Configurable
parameters for
the test
1. TEST PERIOD - How often should the test be executed
2. HOST – The hostname (or IP address) of the Siebel server
3. PORT – The port number on which the Siebel server is listening
4. INSTALLDIRECTORY – Provide the full path to the install directory of the Siebel
server
5. GATEWAYSERVER – Provide the IP address/host name of the Gateway server
6. ENTERPRISESERVER - This refers to the name that was specified for the
Enterprise server during a Siebel installation. An Enterprise server is a logical
entity. It collectively represents the Siebel application servers and gateway
server.
7. USERNAME – This test executes a command on the Siebel server to extract the
statistics of interest; this command requires administrator privileges to execute.
Therefore, enter the name of the Siebel administrator.
8. PASSWORD – Specify the administrator password
9. CONFIRM PASSWORD – Confirm the password by retyping it.
Outputs of the
test
One set of results for every object manager monitored.
Measurements
made by the
test
Measurement Measurement
Unit Interpretation
Run state :
Indicates the current
state of this Siebel Object
Manager.
Boolean The value 0 for this measure indicates
that the object manager is unavailable.
While 1 indicates that the object
manager is online (i.e., it is available,
but not currently running any tasks), 2
indicates that the object manager is
running (i.e., it is available and is
currently running one/more tasks).
Max tasks reached :
Indicates whether this
object manager has
reached its 'maximum
tasks' limit or not.
Boolean This measure is a true indicator of load
on the object manager. As long as the
value of this measure is 0, it is an
indication of an optimal number of tasks
currently executing on the object
manager. If the value becomes 1, it
implies that the 'maximum tasks' limit
has been reached. When this happens,
eG Enterprise triggers an alarm
indicating an overload on the object
manager. During such circumstances,
the object manager will run out of
threads to execute any more tasks, and
will therefore be unable to handle
subsequent requests.

M o n i t o r i n g t h e S i e b e l A p p l i c a t i o n S e r v e r
31
Maximum MTServers:
An MTServer is a multi-
threaded component
process; this measure
indicates the maximum
number of MTServers per
component per server.
Number
Active MTServers:
Indicates the currently
active MTServers on this
object manager.
Number The value of this should be close to the
value of the Num_max_mts_svr
measure.
Percent usage of
MTServers:
Indicates the percentage
of maximum MTServers
that are being actively
used by this object
manager.
Percent Ideally, the value of this measure should
be between 90-100%. A far less value
indicates that the object manager is
grossly under-utilizing the MTServers.
This happens when the object manager
does not have enough tasks to run, and
is more or less idle.
Components refer to the various tasks or programs that run on the Siebel server and perform the
work requested by the user. For example, the object manager is one of the key components on a
Siebel server. In order to effectively measure the end-user experience with a Siebel server, it is
essential to keenly observe and analyze the fluctuations in resource usage, responsiveness, and errors
encountered by these components. The Siebel Stats test, executed by an internal agent, enables such
an analysis. In the event of any deterioration in the performance of a Siebel server, the metrics
reported by this test will enable administrators to figure out whether there are any resource-
intensive/error-prone components on the Siebel server, which are impacting its performance.
Purpose Monitors the fluctuations in resource usage, responsiveness, and errors encountered
by the components on the Siebel server
Target of the
test
A Siebel server
Agent
deploying the
test
An internal agent

M o n i t o r i n g t h e S i e b e l A p p l i c a t i o n S e r v e r
32
Configurable
parameters for
the test
1. TEST PERIOD - How often should the test be executed
2. HOST – The hostname (or IP address) of the Siebel server
3. PORT – The port number on which the Siebel server is listening
4. INSTALLDIRECTORY – Provide the full path to the install directory of the Siebel
server
5. GATEWAYSERVER – Provide the IP address/host name of the Gateway server
6. ENTERPRISESERVER - This refers to the name that was specified for the
Enterprise server during a Siebel installation. An Enterprise server is a logical
entity. It collectively represents the Siebel application servers and gateway
server.
7. USERNAME – This test executes a command on the Siebel server to extract the
statistics of interest; this command requires administrator privileges to execute.
Therefore, enter the name of the Siebel administrator.
8. PASSWORD – Specify the administrator password
9. CONFIRM PASSWORD – Confirm the password by retyping it.
Outputs of the
test
One set of results for each Siebel server monitored.
Measurements
made by the
test
Measurement Measurement
Unit Interpretation
CPU time:
Indicates the total CPU
time for component tasks
Secs Ideally, the value of this measure should
be low. A very high value could indicate
that users are executing one/more CPU-
intensive tasks on the Siebel server.
Further investigation is hence required
to zero-in on the resource-hungry
components.
Elapsed_time:
Indicates the total
elapsed (running) time for
component tasks.
Secs This measure is indicative of time taken
by the task to complete its operation.
Think time:
Indicates the average
end-user think time
between requests.
Secs
Total response time:
Indicates the total
amount of time taken by
the components to
respond to requests.
Secs A very high value indicates slow
component responsiveness. Response
time issues can be caused by high
resource utilization or heavy load on the
components.
Total tasks:
Indicates the total
number of tasks
completed for the server
components.
Number

M o n i t o r i n g t h e S i e b e l A p p l i c a t i o n S e r v e r
33
Avg response time:
Indicates the average
time taken by the
components to respond to
requests.
Secs A very high value indicates that the
component responds slowly to requests.
Response time issues can be caused by
high CPU utilization or heavy load on the
components.
Avg connection time:
Indicates the average
connect time for
component sessions.
Secs Ideally, a low value is desired. A high
value indicates connection bottlenecks.
Errors:
Indicates that the
component job ran but
encountered an error
during operation.
Number Ideally, this value should be 0.
Tests attempted:
This indicates the number
of test attempted.
Number
Tests failed:
This metric represents the
number of tests failed.
Number
Tests successful:
This metric represents the
number of test successful.
Number
This test provides the status of errors logged in the Siebel log files.
Purpose Provides the status of errors logged in the Siebel log files
Target of the
test
A Siebel server
Agent
deploying the
test
An internal agent

M o n i t o r i n g t h e S i e b e l A p p l i c a t i o n S e r v e r
34
Configurable
parameters for
the test
1. TEST PERIOD - How often should the test be executed
2. HOST – The hostname (or IP address) of the Siebel web server
3. PORT – The port number on which the Siebel web server is listening
4. ALERTFILE - specify the path to the log file to be monitored. For eg.,
C:/sea703/SWEBApp/LOG/Siebel_Web_log.txt. Multiple log file paths can be
provided as a comma-separated list.
Also, instead of a specific log file path, the path to the directory containing log
files can be provided - eg., C:/sea703/SWEBApp/LOG. This ensures that eG
Enterprise monitors the most recent log files in the specified directory. Specific
log file name patterns can also be specified. For example, to monitor the latest
log files with names containing the strings 'siebel' and 'log', the parameter
specification can be,
C:/sea703/SWEBApp/LOG/*siebel*,C:/sea703/SWEBApp/LOG/*log*. Here, '*'
indicates leading/trailing characters (as the case may be). In this case, the eG
agent first enumerates all the log files in the specified path that match the given
pattern, and then picks only the latest log file from the result set for monitoring.
You can also configure the path in the following format:Name@logfilepath. Here,
Name represents the display name of the path being configured. Accordingly,
the parameter specification for the 'siebel' and 'log' example discussed above
can be:
siebel@C:/sea703/SWEBApp/LOG/*siebel*,log@C:/sea703/SWEBApp/LOG/*log
*. In this case, the display names 'siebel' and 'log' will alone be displayed as
descriptors of this test.
Every time this test is executed, the eG agent verifies the following:
Whether any changes have occurred in the size and/or timestamp of the log
files that were monitoring during the last measurement period;
Whether any new log files (that match the ALERTFILE specification) have
been newly added since the last measurement period;
If a few lines have been added to a log file that was monitored previously, then
the eG agent monitors the additions to that log file, and then proceeds to
monitor newer log files (if any). If an older log file has been overwritten, then,
the eG agent monitors this log file completely, and then proceeds to monitor the
newer log files (if any).
5. SEARCHPATTERN - Enter the specific patterns of alerts to be monitored. The
pattern should be in the following format: <PatternName>:<Pattern>, where
<PatternName> is the pattern name that will be displayed in the monitor
interface and <Pattern> is an expression of the form - *expr* or expr or *expr
or expr*, etc. A leading '*' signifies any number of leading characters, while a
trailing '*' signifies any number of trailing characters.
For example, say you specify Gen_errors:Generic* in the SEARCHPATTERN text
box. This indicates that "Gen_errors" is the pattern name to be displayed in the
monitor interface. "Generic*" indicates that the test will monitor only those lines
in the log which start with the term "Generic".

M o n i t o r i n g t h e S i e b e l A p p l i c a t i o n S e r v e r
35
A single pattern may also be of the form e1+e2, where + signifies an OR
condition. That is, the <PatternName> is matched if either e1 is true or e2 is
true.
Multiple search patterns can be specified as a comma-separated list. For
example: Gen_errors:Generic*,Critical_errors:*Error*.
If the ALERTFILE specification is of the format Name@logfilepath, then the
descriptor for this test in the eG monitor interface will be of the format:
Name:PatternName. On the other hand, if the ALERTFILE specification consists
only of a comma-separated list of log file paths, then the descriptors will be of
the format: LogFilePath:PatternName.
6. LINES - Specify two numbers in the format x:y. This means that when a line in
the log file matches a particular pattern, then x lines before the matched line
and y lines after the matched line will be reported in the detail diagnosis output
(in addition to the matched line). The default value here is 0:0. Multiple entries
can be provided as a comma-separated list.
If you give 1:1 as the value for LINES, then this value will be applied to all the
patterns specified in the SEARCHPATTERN field. If you give 0:0,1:1 as the value
for LINES and if the corresponding value in the SEARCHPATTERN filed is like
Gen_errors:Generic*,Critical_errors:*Error*, then:
0:0 will be applied to the Gen_errors:Generic* pattern
1:1 will be applied to the Critical_errors:*Error* pattern
7. EXCLUDEPATTERN - Provide a comma-separated list of patterns to be excluded
from monitoring in the EXCLUDEPATTERN text box. For example *critical*,
*generic*. By default, this parameter is set to 'none'.
8. UNIQUEMATCH - By default, the UNIQUEMATCH parameter is set to FALSE,
indicating that, by default, the test checks every line in the log file for the
existence of each of the configured SEARCHPATTERNS. By setting this
parameter to TRUE, you can instruct the test to ignore a line and move to the
next as soon as a match for one of the configured patterns is found in that line.
For example, assume that Pattern1:*Generic*,Pattern2:*Error* is the
SEARCHPATTERN that has been configured. If UNIQUEMATCH is set to FALSE,
then the test will read every line in the log file completely to check for the
existence of messages embedding the strings 'Generic' and 'Error'. If both the
patterns are detected in the same line, then the number of matches will be
incremented by 2. On the other hand, if UNIQUEMATCH is set to TRUE, then the
test will read a line only until a match for one of the configured patterns is found
and not both. This means that even if the strings 'Generic' and 'Error' follow one
another in the same line, the test will consider only the first match and not the
next. The match count in this case will therefore be incremented by only 1.

M o n i t o r i n g t h e S i e b e l A p p l i c a t i o n S e r v e r
36
9. ROTATINGFILE - This flag governs the display of descriptors for this test in the
eG monitoring console.
If this flag is set to true and the ALERTFILE text box contains the full path to a
specific (log/text) file, then, the descriptors of this test will be displayed in the
following format: Directory_containing_monitored_file:<SearchPattern>. For
instance, if the ALERTFILE parameter is set to c:\eGurkha\logs\syslog.txt, and
ROTATINGFILE is set to true, then, your descriptor will be of the following
format: c:\eGurkha\logs:<SearchPattern>. On the other hand, if the
ROTATINGFILE flag had been set to false, then the descriptors will be of the
following format: <FileName>:<SearchPattern> - i.e.,
syslog.txt:<SearchPattern> in the case of the example above.
If this flag is set to true and the ALERTFILE parameter is set to the directory
containing log files, then, the descriptors of this test will be displayed in the
format: Configured_directory_path:<SearchPattern>. For instance, if the
ALERTFILE parameter is set to c:\eGurkha\logs, and ROTATINGFILE is set to
true, then, your descriptor will be: c:\eGurkha\logs:<SearchPattern>. On the
other hand, if the ROTATINGFILE parameter had been set to false, then the
descriptors will be of the following format:
Configured_directory:<SearchPattern> - i.e., logs:<SearchPattern> in the case
of the example above.
If this flag is set to true and the ALERTFILE parameter is set to a specific file
pattern, then, the descriptors of this test will be of the following format:
<FilePattern>:<SearchPattern>. For instance, if the ALERTFILE parameter is set
to c:\eGurkha\logs\*sys*, and ROTATINGFILE is set to true, then, your descriptor
will be: *sys*:<SearchPattern>. In this case, the descriptor format will not
change even if the ROTATINGFILE flag status is changed.
10. DETAILED DIAGNOSIS: To make diagnosis more efficient and accurate, the eG
suite embeds an optional detailed diagnostic capability. With this capability, the
eG agents can be configured to run detailed, more elaborate tests as and when
specific problems are detected. To enable the detailed diagnosis capability of
this test for a particular server, choose On option. To disable the capability, click
on Off option. The option to selectively enabled/disable the detailed diagnosis
capability will be available only if the following conditions are fulfilled:
The eG manager license should allow the detailed diagnosis capability.
Both the normal and abnormal frequencies configured for the detailed
diagnosis measures should not be 0.
Measurements
made by the
test
Measurement Measurement
Unit Interpretation
Recent errors:
Shows the number of
errors recently logged in
the Siebel log files.
Number The value of this measure is a clear
indicator of the number of “new” alerts
that have come into the log file of the
monitored server.
This test reports the current and completed tasks on every object manager on a Siebel server.

M o n i t o r i n g t h e S i e b e l A p p l i c a t i o n S e r v e r
37
Purpose Reports the current and completed tasks on every object manager on a Siebel
server
Target of the
test
A Siebel server
Agent
deploying the
test
An internal agent
Configurable
parameters for
the test
1. TEST PERIOD - How often should the test be executed
2. HOST – The hostname (or IP address) of the Siebel server
3. PORT – The port number on which the Siebel server is listening
4. INSTALLDIRECTORY – Provide the full path to the install directory of the Siebel
server
5. GATEWAYSERVER – Provide the IP address/host name of the Gateway server
6. ENTERPRISESERVER - This refers to the name that was specified for the
Enterprise server during a Siebel installation. An Enterprise server is a logical
entity. It collectively represents the Siebel application servers and gateway
server.
7. USERNAME – This test executes a command on the Siebel server to extract the
statistics of interest; this command requires administrator privileges to execute.
Therefore, enter the name of the Siebel administrator.
8. PASSWORD – Specify the administrator password
9. CONFIRM PASSWORD – Confirm the password by retyping it.
10. DETAILED DIAGNOSIS: To make diagnosis more efficient and accurate, the eG
suite embeds an optional detailed diagnostic capability. With this capability, the
eG agents can be configured to run detailed, more elaborate tests as and when
specific problems are detected. To enable the detailed diagnosis capability of
this test for a particular server, choose On option. To disable the capability, click
on Off option. The option to selectively enabled/disable the detailed diagnosis
capability will be available only if the following conditions are fulfilled:
The eG manager license should allow the detailed diagnosis capability
Both the normal and abnormal frequencies configured for the detailed
diagnosis measures should not be 0.
Outputs of the
test
One set of results for each object manager on the Siebel server monitored
Measurements
made by the Measurement
Measurement
Unit Interpretation

M o n i t o r i n g t h e S i e b e l A p p l i c a t i o n S e r v e r
38
test Running tasks:
Indicates the number of
tasks currently running on
this Object Manager.
Number The detailed diagnosis of this measure, if
enabled, provides the details of tasks
current running. Such details include the
task ID, the object manager that is
running the task, the mode in which the
task is running, and the data\time at
which the task began running. Using this
information, you can quickly identify
long-running tasks, and investigate the
reason behind the same.
Completed tasks:
Indicates the number of
tasks that ran to
completion and exited
normally on this Object
Manager.
Number
This test monitors the status of incoming and outgoing traffic to the Siebel application server.
Purpose Monitors the status of incoming and outgoing traffic to the Siebel application server
Target of the
test
A Siebel server
Agent
deploying the
test
An internal agent
Configurable
parameters for
the test
1. TEST PERIOD - How often should the test be executed
2. HOST – The hostname (or IP address) of the Siebel server
3. PORT – The port number on which the Siebel server is listening
4. INSTALLDIRECTORY – Provide the full path to the install directory of the Siebel
server
5. GATEWAYSERVER – Provide the IP address/host name of the Gateway server
6. ENTERPRISESERVER - This refers to the name that was specified for the
Enterprise server during a Siebel installation. An Enterprise server is a logical
entity. It collectively represents the Siebel application servers and gateway
server.
7. USERNAME – This test executes a command on the Siebel server to extract the
statistics of interest; this command requires administrator privileges to execute.
Therefore, enter the name of the Siebel administrator.
8. PASSWORD – Specify the administrator password
9. CONFIRM PASSWORD – Confirm the password by retyping it.
Outputs of the
test
One set of results for each Siebel server monitored.

M o n i t o r i n g t h e S i e b e l A p p l i c a t i o n S e r v e r
39
Measurements
made by the
test
Measurement Measurement
Unit Interpretation
Request size:
Indicates the size of
incoming requests to the
Siebel server.
Bytes This measures helps you to quantify the
load on the Siebel server.
Reply size:
Indicates the size of
responses sent by the
Siebel server.
Bytes

T r o u b l e s h o o t i n g
40
Troubleshooting
If the tests related to the Siebel web server are not running, then first, try connecting to the following
URL, and check whether it takes you to a page that lists the session-related and other web server-
specific metrics for a configured APPLICATIONNAME:
http://<IPoftheSibelWebServer>/<applicationnameconfiguredforthetest>/_stats.swe?verbode=high. For instance, if
the IP address of the Siebel web server is, 192.168.10.12, and the APPLICATIONNAME configured for
a Siebel web server-related test is callcenter, the URL will be:
http://192.168.10.12/callcenter/_stats.swe?verbose=high.
If the URL does not result in the display of the desired web page, then proceed to check whether the
AllowStats and SessionMonitor flags in the eapps.cfg file (in the
<SIEBEL_INSTALL_DIR>\sea<SIEBEL_VERSION>\SWEApp\BIN directory) are set to TRUE. To know how, refer to
Page 5 of this document.
Also, you can verify the values reported by the tests associated with the Siebel application server
component, using the srvrmgr.exe in the <SIEBEL_INSTALL_DIR>\sea<Siebel_version>\BIN directory. The syntax
for the command is:
srvrmgr.exe /g <IPoftheGatewayServer> /e <SiebelEnterpriseServerNameconfiguredforthetest> /u
<UsernameoftheSiebelAdministrator> /p <PasswordoftheSiebelAdministrator> /c "<sub-command>"
For instance, to check whether the statistics reported by the SiebelTasks test are accurate or not, do
the following:
1. Go to the command prompt of the Siebel application server.
2. Switch to the <SIEBEL_INSTALL_DIR>\sea<Siebel_version>\BIN directory.
3. Assume that the SiebelTasks test takes the following parameters:
GATEWAYSERVER - 192.168.10.58
ENTERPRISESERVER - siebel
USERNAME - sadmin
PASSWORD - sadmin
4. Then, execute the following command on it:
srvrmgr.exe /g 192.168.10.58 /e siebel /u sadmin /p sadmin /c "list tasks", where "list tasks" is the sub-
command that is executed for viewing task-related metrics.
Similarly, the command for the SiebelStats test, will be:
Chapter
5

T r o u b l e s h o o t i n g
41
srvrmgr.exe /g 192.168.10.56 /e siebel /u sadmin /p sadmin /c "list stats"
The following command will have to be executed for viewing the list of object managers configured on
the Siebel server:
srvrmgr.exe /g 192.168.10.56 /e siebel /u sadmin /p sadmin /c "list comps"
For the SiebelNet test, on the other hand, a utility named visutl.exe will have to be run from the
<SIEBEL_INSTALL_DIR>\sea<SIEBEL_VERSION>\SWEApp\BIN directory. The syntax of this command is:
visutl.exe /u <SiebelAdministratorName> /p <SiebelAdministratorPassword> /c
<ODBCDatasourceNameconfiguredforthetest> /d <Tableownernameconfiguredforthetest> /n
<Nodenameconfiguredforthetest>
For instance, assume that you want to verify the accuracy of the measures reported by the SiebelNet
test, which takes the following parameters:
USERNAME - sadmin
PASSWORD - sadmin
SIEBELDATASOURCENAME - SiebSrvr_siebel
TABLEOWNERNAME - siebel
NODENAME - siebel
To achieve this, execute the following command from the
<SIEBEL_INSTALL_DIR>\sea<SIEBEL_VERSION>\SWEApp\BIN directory:
visutl.exe /u sadmin /p sadmin /c SiebSrvr_siebel /d siebel /n siebel

C o n c l u s i o n
42
Conclusion
This document has described in detail the monitoring paradigm used and the measurement
capabilities of the eG Enterprise suite of products with respect to Siebel Enterprise. For details of how to
administer and use the eG Enterprise suite of products, refer to the user manuals.
We will be adding new measurement capabilities into the future versions of the eG Enterprise suite. If
you can identify new capabilities that you would like us to incorporate in the eG Enterprise suite of
products, please contact [email protected]. We look forward to your support and
cooperation. Any feedback regarding this manual or any other aspects of the eG Enterprise suite can
be forwarded to [email protected].
Chapter
6


![Siebel Mobile Guide: Connected - Oracle Cloud · [1]Siebel CRM Siebel Mobile Guide: Connected Siebel Innovation Pack 2017, Rev. A E52426-01 November 2017](https://static.fdocuments.net/doc/165x107/5f0537077e708231d411d9c7/siebel-mobile-guide-connected-oracle-cloud-1siebel-crm-siebel-mobile-guide.jpg)


![Configuring Siebel Open UI - Oracle · 1[]Siebel CRM Configuring Siebel Open UI Siebel Innovation Pack 2015 E52417-01 May 2015](https://static.fdocuments.net/doc/165x107/5f0d0b457e708231d438667d/configuring-siebel-open-ui-oracle-1siebel-crm-configuring-siebel-open-ui-siebel.jpg)