Efofex Function Graphing you are working in FX Draw, select the function graphing tool and sweep out...
77
© 2014 Efofex Software Efofex Function Graphing
Transcript of Efofex Function Graphing you are working in FX Draw, select the function graphing tool and sweep out...

© 2014 Efofex Software
Efofex Function Graphing
2
2
Efofex Function GraphingUser's Guide
by Efofex Software
Efofex Software
PO Box 7 Waroona WA 6215 Australia
Fax: +61 8 9733 2460Email: [email protected]: www.efofex.com

All rights reserved. No parts of this work may be reproduced in any form or by any means - graphic, electronic, ormechanical, including photocopying, recording, taping, or information storage and retrieval systems - without thewritten permission of the publisher.
Products that are referred to in this document may be either trademarks and/or registered trademarks of therespective owners. The publisher and the author make no claim to these trademarks.
While every precaution has been taken in the preparation of this document, the publisher and the author assume noresponsibility for errors or omissions, or for damages resulting from the use of information contained in thisdocument or from the use of programs and source code that may accompany it. In no event shall the publisher andthe author be liable for any loss of profit or any other commercial damage caused or alleged to have been causeddirectly or indirectly by this document.
Efofex Function Graphing
© 2014 Efofex Software

Efofex Function Graphing I
© 2014 Efofex Software
Table of Contents
Part I Getting Started 3
Part II Points of Interest 6
Part III Right-Click Menus 7
Part IV Setting Axes 1 10
Part V Annotations 1 13
Part VI Cartesian and Inverse CartesianFunctions 15
Part VII Using the Function Entry System 17
Part VIII Points and Vectors 19
Part IX Polar Functions 22
Part X Inequations and FeasibleRegions 26
Part XI Complex Numbers and ArgandDiagrams 31
Part XII Parametric and Implicitly DefinedFunctions 34
Part XIII Slope Fields and DifferentialEquations 37
Part XIV Setting Axes 2 38
Part XV Annotations 2 40
Part XVI Moving Around the Plane 46
Part XVII Zooming 48
Part XVIII Tangent and Secant Lines 50
Part XIX Integrals 53
Part XX Tables of Values 56
Efofex Function Graphing II
© 2014 Efofex Software
Part XXI Setting Domains 60
Part XXII Constants 62
Part XXIII Families of Curves 64
Part XXIV Animations 67
Part XXV Making Graphs Look The WayYOU Want 68
Part XXVI Using FX Graph in Word 70
Part XXVII Plot As Points 72
Index 0

3Efofex Function Graphing Getting Started
© 2014 Efofex Software
1 Getting Started
Welcome to the FX Graph 4 Introductory lesson set. Email tutorials don't try to teachyou everything, instead they try to provide you with the sort of information that youwould get from a helpful mentor as you explore the product. There is MUCH moreinformation in the manual.
Load FX Graph from the Start menu. You will see a blank set of axes.
If you are working in FX Draw, select the function graphing tool and sweep out arectangle. You will see a blank set of axes. If you select the axes (by clicking onthem, the Function graphing buttons will appear on the right hand side of the screen. For the rest of this series of lessons we will be assuming that you are using FXGraph but all information is directly transferable to FX Draw.
Let's start by drawing a simple quadratic graph.
Push the button to enter a function. Alternatively, you can move the mouse to a

4Efofex Function Graphing Getting Started
© 2014 Efofex Software
blank part of the FX Graph window and right-click.
I have typed x2-4x+1 into the top line of the functions. Notice how a formatted versionof this is shown. Press OK and our graph will appear.

5Efofex Function Graphing Getting Started
© 2014 Efofex Software
The function entry section of the Quick Entry screen allows for multiple lines. Eachline will be graphed as a separate function.
6Efofex Function Graphing Getting Started
© 2014 Efofex Software
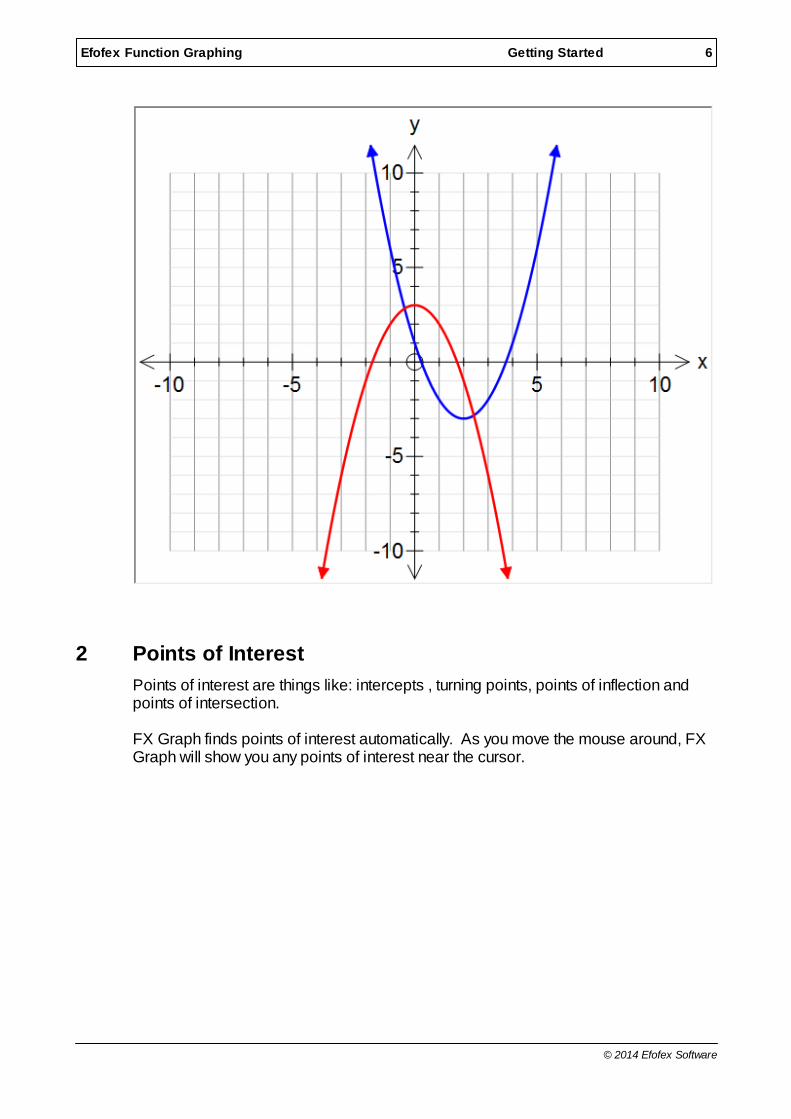
2 Points of Interest
Points of interest are things like: intercepts , turning points, points of inflection andpoints of intersection.
FX Graph finds points of interest automatically. As you move the mouse around, FXGraph will show you any points of interest near the cursor.

7Efofex Function Graphing Points of Interest
© 2014 Efofex Software
There are two important things to note:
1. FX Graph will only show the point of interest if you "hover" near it. In otherwords, the message will only be shown if you leave the mouse still for a short time.2. Most points of interest are calculated numerically rather than algebraically. This will sometimes result in slight errors.
Points of interest are color coded to the function curve if possible.
3 Right-Click Menus
You will spend a lot of time right-clicking in FX Graph. What happens depends onwhere you click.
8Efofex Function Graphing Right-Click Menus
© 2014 Efofex Software
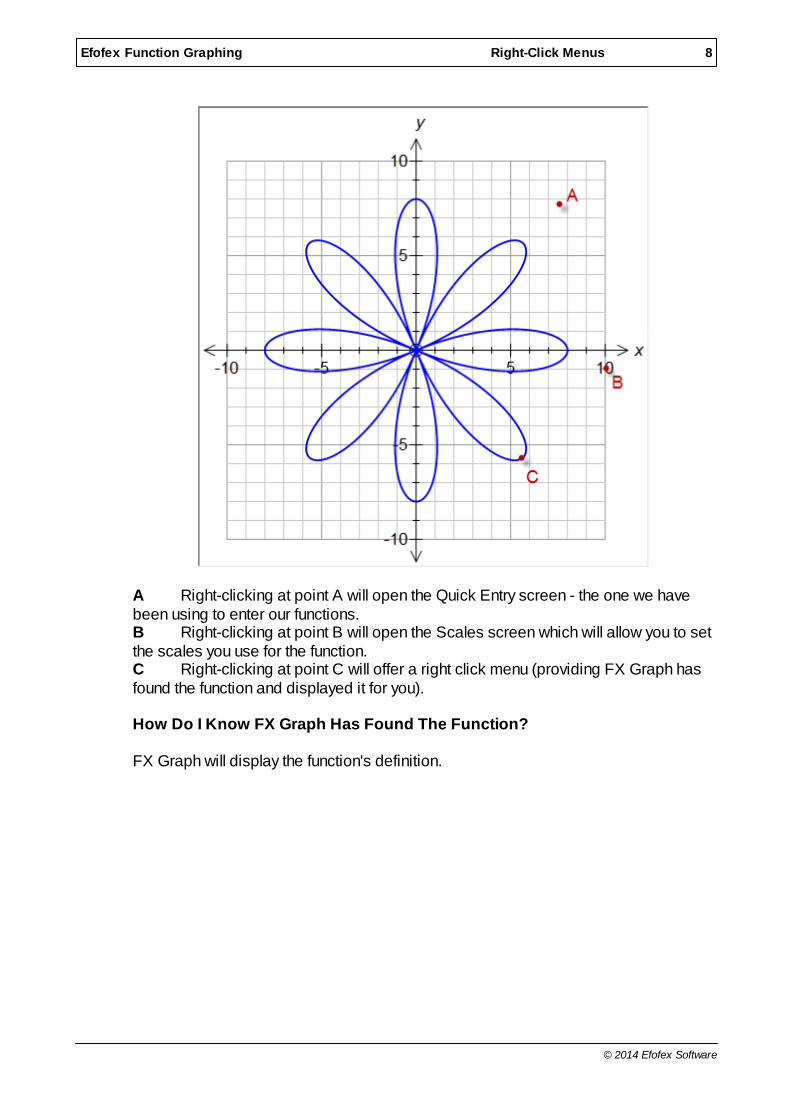
A Right-clicking at point A will open the Quick Entry screen - the one we havebeen using to enter our functions.B Right-clicking at point B will open the Scales screen which will allow you to setthe scales you use for the function.C Right-clicking at point C will offer a right click menu (providing FX Graph hasfound the function and displayed it for you).
How Do I Know FX Graph Has Found The Function?
FX Graph will display the function's definition.
9Efofex Function Graphing Right-Click Menus
© 2014 Efofex Software
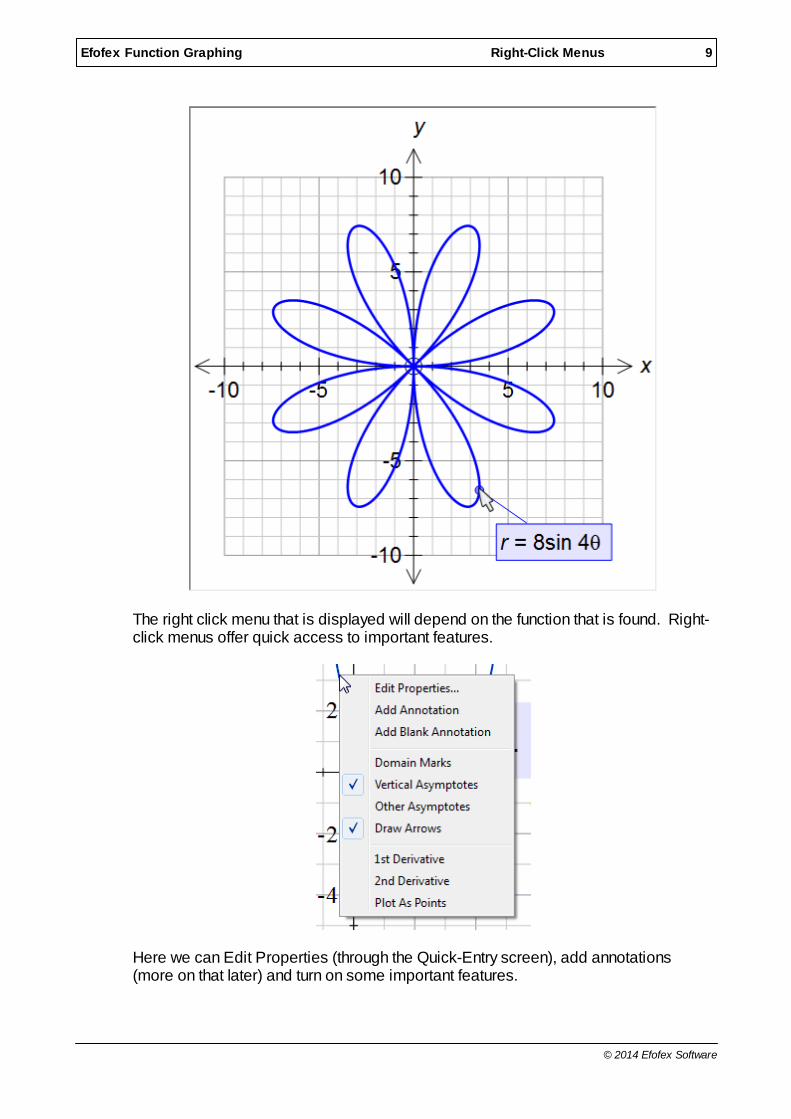
The right click menu that is displayed will depend on the function that is found. Right-click menus offer quick access to important features.
Here we can Edit Properties (through the Quick-Entry screen), add annotations(more on that later) and turn on some important features.

10Efofex Function Graphing Right-Click Menus
© 2014 Efofex Software
4 Setting Axes 1
Setting Axes is often one of the most tedious parts of using a graphing program. FXGraph makes it just about as simple as it can be. First up, we will discuss how to setthe axes using the Quick Entry Screen. It is a three-stage process.
Step 1 - Start with a Standard Set Of Axes
If you want to start with a standard set of axes, push one of the three buttons.
The first button sets up this set of axes.
The second button sets up this set.

11Efofex Function Graphing Setting Axes 1
© 2014 Efofex Software
The only difference is that the first axes are "free" and the second are "equal aspect". Equal aspect just means that each unit on the x axis measures the same as eachunit on the y axis. For some graph types (Argand diagrams, polar functions etc),equal aspect is important.
The third button sets up these sets of axes depending on your current setting in theangle measurement.

12Efofex Function Graphing Setting Axes 1
© 2014 Efofex Software
Step 2 - Set the Shape
The two sliders let you set the shape of the axes. The mini set of axes shows you theshape you have selected.

13Efofex Function Graphing Setting Axes 1
© 2014 Efofex Software
Step 3 - Enter the Maxima
Just type in the maximum values for the x axis and the y axis. You can include pi, eand fractions in your maxima if you wish.
That's it!
FX Graph will use the information you have provided to design a set of axes. Most ofthe time it will come up with something perfectly adequate for your use. If you reallyneed more control over what is provided, that is the topic of the next lesson.
5 Annotations 1
FX Graph provides lots of transient information as you move around the graph. If youwant to keep information on the graph, you need to add an annotation. FX Graphmakes adding annotations easy.
To add an annotation, all you need to do is to wait until FX Graph finds somethinginteresting - and then right click.
Move mouse around screen

14Efofex Function Graphing Annotations 1
© 2014 Efofex Software
FX Graph has found something interesting and told me about it
Right click to add an annotation
Permanent annotation

15Efofex Function Graphing Annotations 1
© 2014 Efofex Software
Move the annotation to somewhere more suitable
Perhaps the best thing about annotations is that they update themselves as functionschanged (if possible).
This is particularly useful when combined with constants and animations - but moreabout those things in later lessons.
6 Cartesian and Inverse Cartesian Functions
All functions are entered into FX Graph's Quick Entry screen - one line per equation.
Remember to right - click or push the button to gain access to the Quick Entryscreen.

16Efofex Function Graphing Cartesian and Inverse Cartesian Functions
© 2014 Efofex Software
FX Graph never needs to be "told" what type of graph to draw - it automaticallydetermines the graph type by what you type. To draw a Cartesian function, just usex's.
3x2 + 2x - 4y = 3x2 + 2x - 4
f(x) = 3x2 + 2x - 43x2 + 2x - 4 - y = 0
FX Graph will correctly interpret all of these as Cartesian and will produce the samegraph for each. There are a few things to notice.
1. The "y =" and "f(x) =" are optional. If you leave them off and expresseverything in terms of x, FX Graph will assume the graph is Cartesian2. We do not need to rearrange functions into "y =" format. FX Graph is quitehappy interpreting things like 3x + 2y = x2 - 4y.3. We have not had to tell FX Graph that the 2 in 3x2 is a power. FX Graph hasworked that out itself. We will discuss some of the finer points to using the functionentry system in the next lesson.
If we want to draw an inverse Cartesian function, we just need to enter the function interms of y.

17Efofex Function Graphing Cartesian and Inverse Cartesian Functions
© 2014 Efofex Software
3y - 4/yx = 2y2 + 3y - 4
f(y) = 3y + 4
All of these will be interpreted as inverse Cartesian functions.
In summary, to enter a Cartesian or inverse Cartesian function - type what yousee. FX Graph will sort it out.
7 Using the Function Entry System
FX Graph uses FX Equation technology to allow you to enter functions as you seethem - with minimal formatting. There is very little to learn in order to start using FXGraph - particularly as you get to see exactly how FX Graph is interpreting what youhave typed as you type it.
Let's look at an example which shows some of the tricks to using the system.
Notice the following:
1. The function has no y = but FX Graph will interpret it as a Cartesian functionanyway. 2. We have not had to do anything to get FX Graph to interpret x2 as x squared. Most of the time, FX Graph will find powers automatically.3. We have used the / sign to represent division.4. We have wrapped the numerator and denominator of the fraction in brackets -not too tricky as most mathematicians realize that the fraction line is a de-factobracket.5. We have used sqrt to represent square roots. We could have used sr

18Efofex Function Graphing Using the Function Entry System
© 2014 Efofex Software
instead.
More examples:
6. We have used the ^ character to tell FX Graph to raise something as apower. We use this when FX Graph cannot work it out for itself.7. We needed to wrap the x + 1 in brackets so that it was all raised to the power
8. If I don't put a space between the sin and the 2, it raises the 2 as a power. If Ido put a space, FX Graph interprets it as sin 2x. This is actually easier to use thanexplain. Most people put the required spaces in naturally and don't even realize what

19Efofex Function Graphing Using the Function Entry System
© 2014 Efofex Software
FX Graph is doing!
This lesson represents the vast bulk of the "tricks" needed to use the Function EntrySystem. Most of the time you type what you see and FX Graph will work it out.
8 Points and Vectors
You may have already found the point marking tool . This tool allows you tomark points anywhere on the plane. There is another way of creating a point in FXGraph - in many ways more powerful. This can be done by entering points asfunctions.

20Efofex Function Graphing Points and Vectors
© 2014 Efofex Software
Points are entered in the Quick Entry screen in exactly the same way as a function(see above). You can separate the points with semicolons but this is not strictlynecessary.
Joining The Dots
+ signs tell FX Graph to join the dots.

21Efofex Function Graphing Points and Vectors
© 2014 Efofex Software
Vectors
Vectors are entered as <2,4>

22Efofex Function Graphing Points and Vectors
© 2014 Efofex Software
and can be combined with points and other vectors using the + and - signs
You can use constants (discussed in a later lesson) in points and vectors whichallows you to create interesting animations and demonstrations.
FX Graph can also handle Polar points and vectors. We will also discuss this in alater lesson.
9 Polar Functions
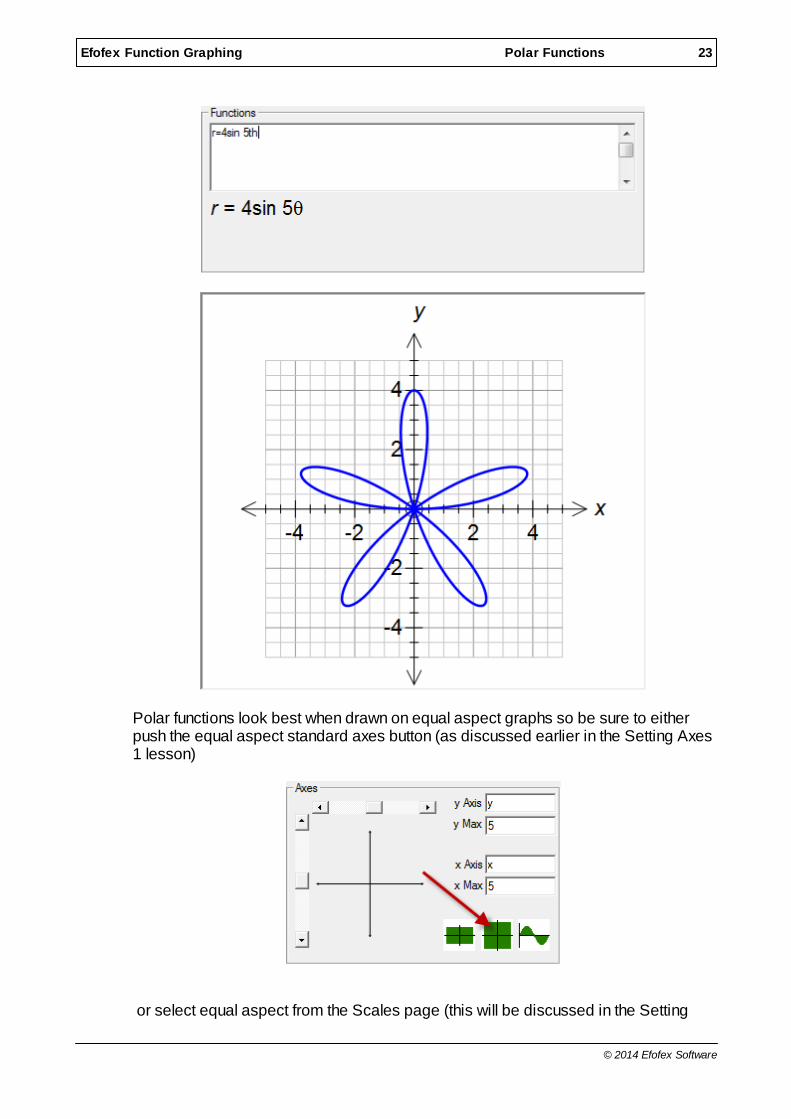
FX Graph can draw polar functions (and points) but you do have to remember onething - we use th to represent theta.
23Efofex Function Graphing Polar Functions
© 2014 Efofex Software
Polar functions look best when drawn on equal aspect graphs so be sure to eitherpush the equal aspect standard axes button (as discussed earlier in the Setting Axes1 lesson)
or select equal aspect from the Scales page (this will be discussed in the Setting

24Efofex Function Graphing Polar Functions
© 2014 Efofex Software
Axes 2 lesson)
Inverse Polar Functions
Unlike most graphing products, FX Graph can graph inverse polar functions. Notethat you almost certainly have to have the angle type set to radians to makesense of these functions.
Polar Grids
Don't forget that FX Graph can draw polar grids using either points or lines.

25Efofex Function Graphing Polar Functions
© 2014 Efofex Software

26Efofex Function Graphing Polar Functions
© 2014 Efofex Software
Polar Points and Vectors
If you prefix a line of points and/or vectors with P, FX Graph will interpret the pointsas polar points.
10 Inequations and Feasible Regions
FX Graph can graph inequations and draw either half planes or feasible regions. You need to use <=, >=, > or < in place of the equals sign. Entering the inequationsis easy...

27Efofex Function Graphing Inequations and Feasible Regions
© 2014 Efofex Software
Interpreting the output can be slightly more difficult because FX Graph can graph thisset of inequations in three ways depending on your settings.
Half planes shading the side that agrees w ith inequality

28Efofex Function Graphing Inequations and Feasible Regions
© 2014 Efofex Software
Half planes shading the side that does NOT agree w ith the inequality
Feasible region shading - just the area that agrees w ith all inequalities.
There are two ways of shading half planes in common use around the world. FX

29Efofex Function Graphing Inequations and Feasible Regions
© 2014 Efofex Software
Graph can graph either way and you set YOUR preference by choosing Preferencesfrom the Tools menu. Push the Graph option and decide whether you want to shadethe accept region.
Deciding whether to shade half planes or the feasible region is easy and is selectedfrom the Quick Entry screen.

30Efofex Function Graphing Inequations and Feasible Regions
© 2014 Efofex Software
You can graph all sorts of inequalities

31Efofex Function Graphing Inequations and Feasible Regions
© 2014 Efofex Software
11 Complex Numbers and Argand Diagrams
FX Graph has limited support for complex numbers and Argand diagrams. Havingsaid that, you may never come up against the limits.
To enter complex numbers, we need to enter things in terms of z, i and cis.

32Efofex Function Graphing Complex Numbers and Argand Diagrams
© 2014 Efofex Software
FX Graph can undertake some complex calculations
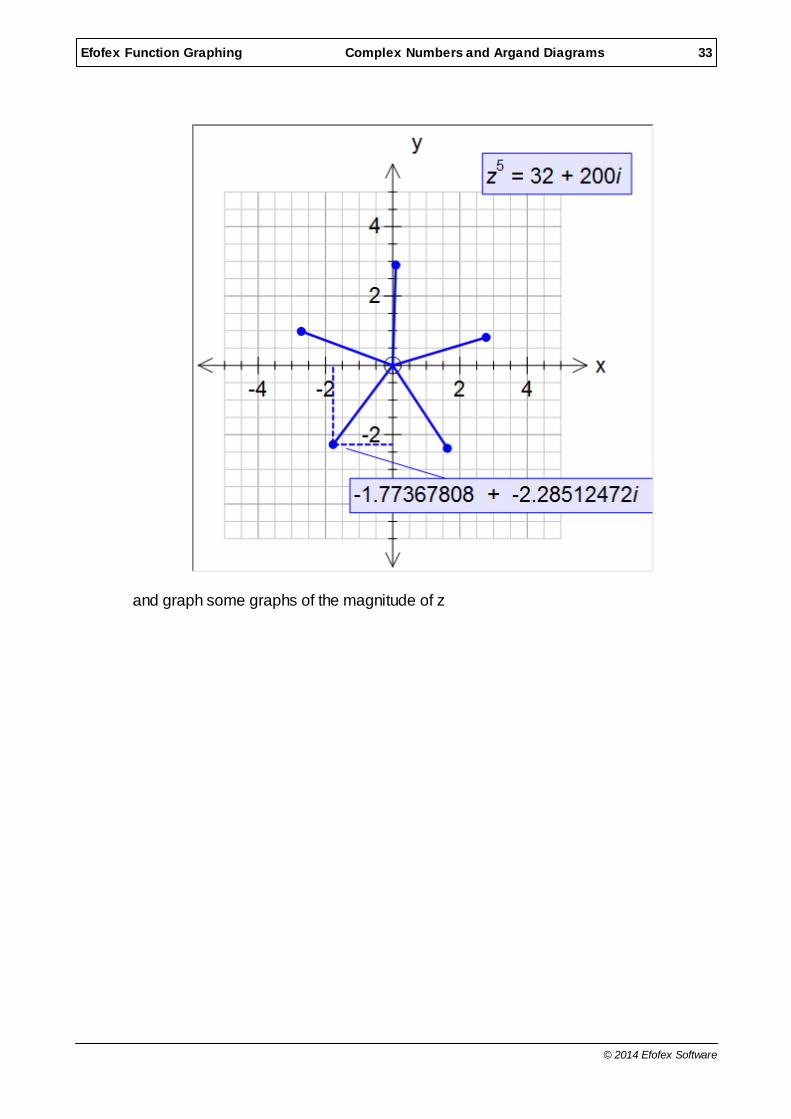
FX Graph can solve complex powers
33Efofex Function Graphing Complex Numbers and Argand Diagrams
© 2014 Efofex Software
and graph some graphs of the magnitude of z

34Efofex Function Graphing Complex Numbers and Argand Diagrams
© 2014 Efofex Software
12 Parametric and Implicitly Defined Functions
To graph a parametric function we need to express x and y in terms of t. The twocomponents of the function need to be separated by a semicolon.

35Efofex Function Graphing Parametric and Implicitly Defined Functions
© 2014 Efofex Software
FX Graph assumes a domain for t of 0 <= t <= 20. This will be adequate for mostgraphs but you can always set your own domain. This is discussed in a later lesson.
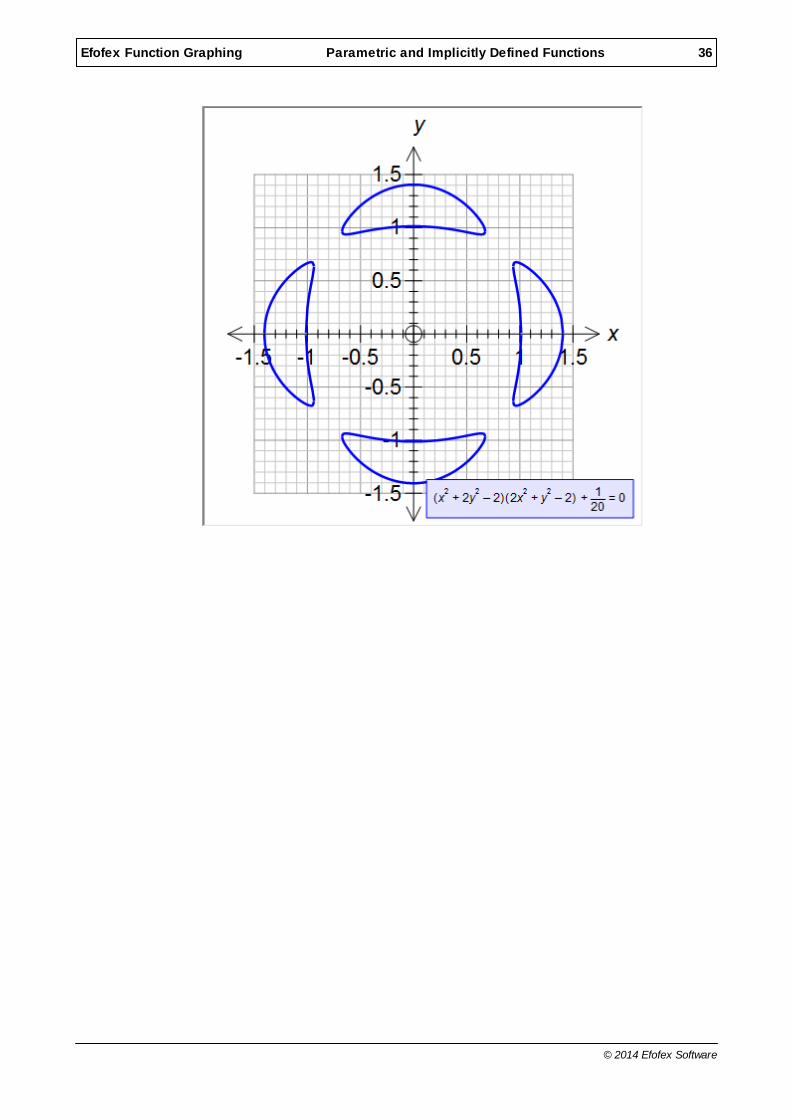
Implicitly Defined Functions
FX Graph is able to graph arbitrarily complicated, implicitly defined functions.
36Efofex Function Graphing Parametric and Implicitly Defined Functions
© 2014 Efofex Software

37Efofex Function Graphing Slope Fields and Differential Equations
© 2014 Efofex Software
13 Slope Fields and Differential Equations
FX Graph will graph a slope field for any function that includes y'.
If you choose the Marked Point tool and mark a point on a slope line, FXGraph will graph the solution to the differential equation at that point.

38Efofex Function Graphing Slope Fields and Differential Equations
© 2014 Efofex Software
14 Setting Axes 2
To gain more control over the axes, you need to click on the Scale options from theQuick Entry Screen.

39Efofex Function Graphing Setting Axes 2
© 2014 Efofex Software
Here we can set the minimum and maximum values for both axes. You can alsooverride the automatically generated ticks.
What are Ticks?
Ticks are the scale marks on the axes. Major ticks have numbers on them. Minorticks don't. If you wish to override the automatic ticks, you need to uncheck the check

40Efofex Function Graphing Setting Axes 2
© 2014 Efofex Software
boxes next to each setting so FX Graph knows that you are taking responsibility forthe settings.
The maximum, minimum, major and minor entries can all include pi, e orfractions if you wish.
Logarithmic Scales
Use these to generate Log or Log/Log graphs.
Scales
We discussed the difference between Free scales and Equal Aspect scales in thelast lesson. This is where you can set the scale type explicitly. You can also chooseFixed scales. Fixed scales sets the scale to a particular measurement. You setexactly how many millimetres constitute one unit on the x and y axis. When you dothis, FX Graph ignores your maximum and minimum values because the graph'sextent will depend on how much room you give it.
NOTE: If you resize a graphic FX Graph has generated inside anotherprogram (like Word), this "fixed" size will no longer hold true and the scalemay no longer be equal aspect.
15 Annotations 2
FX Graph allows you to edit the annotations that you add to your diagram. Simplyright-click on an existing annotation.

41Efofex Function Graphing Annotations 2
© 2014 Efofex Software

42Efofex Function Graphing Annotations 2
© 2014 Efofex Software
Initially this may seem a little confusing - what is $point doing there? That is the firstlesson regarding annotations. FX Graph uses some codes internally ($point is justone, you might see $f1, $integral, $area or a number of others) to mark a placewhere it needs to place dynamically created information. This allows it to create newversions of the annotation when you do things like animate. In this case, it willreplace $point with the currently calculated point for the local minimum.
Most of the other options are obvious, apart from Anchor Style.
This lets you change how the annotation is attached to its anchor point. At themoment it is attached by a line standing off a dot on the function. Lets change it to anarrow to the point.
Equations in Annotations
Annotations can include formatted equations - for example the annotation of anintegral.

43Efofex Function Graphing Annotations 2
© 2014 Efofex Software
On most occasions, FX Graph will automatically determine which sections of yourannotations should be interpreted as equations.
Move With Point
By default, annotations will move with the point that they are attached to.

44Efofex Function Graphing Annotations 2
© 2014 Efofex Software

45Efofex Function Graphing Annotations 2
© 2014 Efofex Software
Sometimes, particularly when animating, this behaviour produces annotations whichare very distracting. If this is the case, uncheck Move With Point and the annotationwill stay put.

46Efofex Function Graphing Moving Around the Plane
© 2014 Efofex Software
16 Moving Around the Plane
If you have a graph such as this one
you might suspect that there is something interesting happening higher up the y axis. How do you get up there to see it? You could go into the Scales and adjust them oryou can use thearrow keys to move around the plane. We want to move up the y axis, so pressthe up arrow a few times.

47Efofex Function Graphing Moving Around the Plane
© 2014 Efofex Software
The graphs look about ready to intersect - so lets go further.

48Efofex Function Graphing Moving Around the Plane
© 2014 Efofex Software
We can now see the point of intersection (marked). Notice that FX Graph has"broken" the y axis. FX Graph is quite happy to break the axis but you can turn offthe behaviour if you wish. You can move all over the plane using the arrow keys. Ifyou wish to return to the origin, just push the Home key.
17 Zooming
FX Graph's automatic detection of points of interest largely eliminates the need forzooming in on different parts of the screen but FX Graph can zoom if you need it. There are three ways of zooming in.
Keyboard In the last lesson we moved around the plane using the arrow and Home keys. Youcan Zoom by using the Page Up and Page Down keys. Page Up zooms out andPage Down zooms in.
One Click ZoomingYou can also zoom using the mouse but you first need to change to Zoom mode.
You do this by pushing the button on the toolbar. When you are in Zoom mode,you can zoom in by left clicking on the graph. FX Graph will zoom in, centred on yourclick. Right clicking will zoom out.
Rectangle Zooming When you are in Zoom mode, you can use your mouse to sweep out a rectangle onthe graph. FX Graph will zoom in to the rectangle you mark.

49Efofex Function Graphing Zooming
© 2014 Efofex Software

50Efofex Function Graphing Zooming
© 2014 Efofex Software
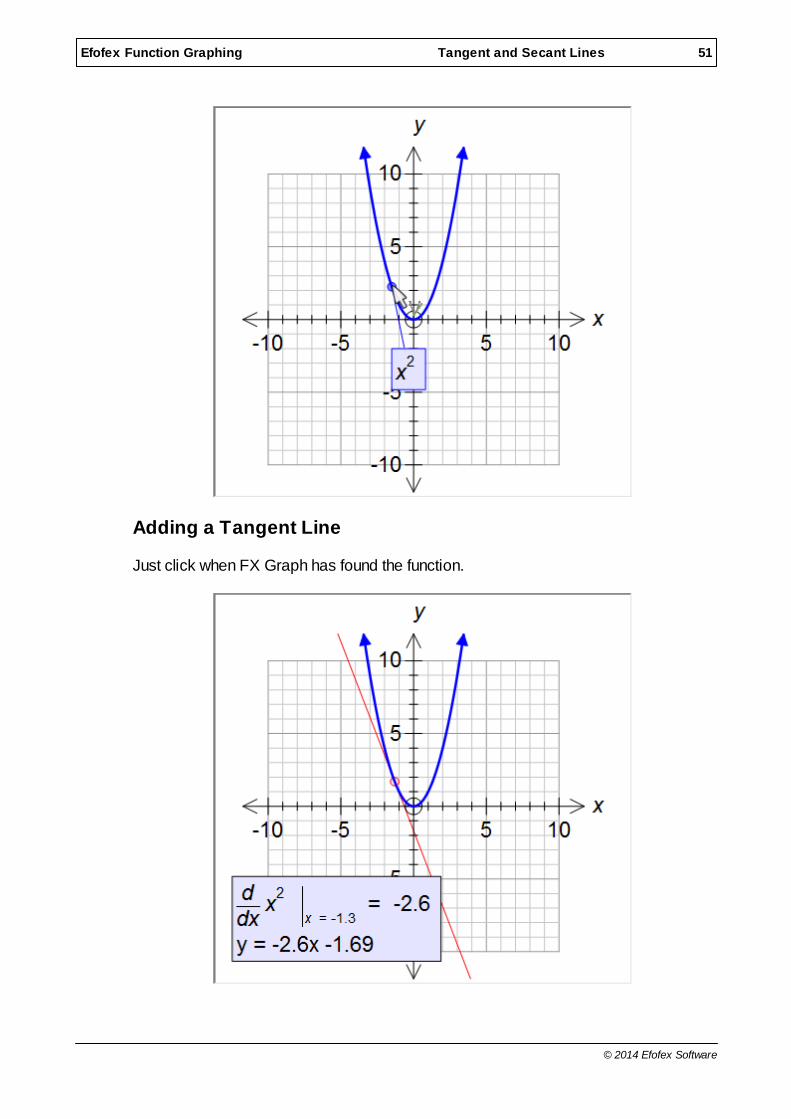
18 Tangent and Secant Lines
You can add tangent and secant lines to Cartesian functions.
First, graph a function and then select the Tangent/Secant line tool
Move your mouse so that FX Graph finds the function. You will know it has found thefunction because it will display the function's equation.
51Efofex Function Graphing Tangent and Secant Lines
© 2014 Efofex Software
Adding a Tangent Line
Just click when FX Graph has found the function.
52Efofex Function Graphing Tangent and Secant Lines
© 2014 Efofex Software
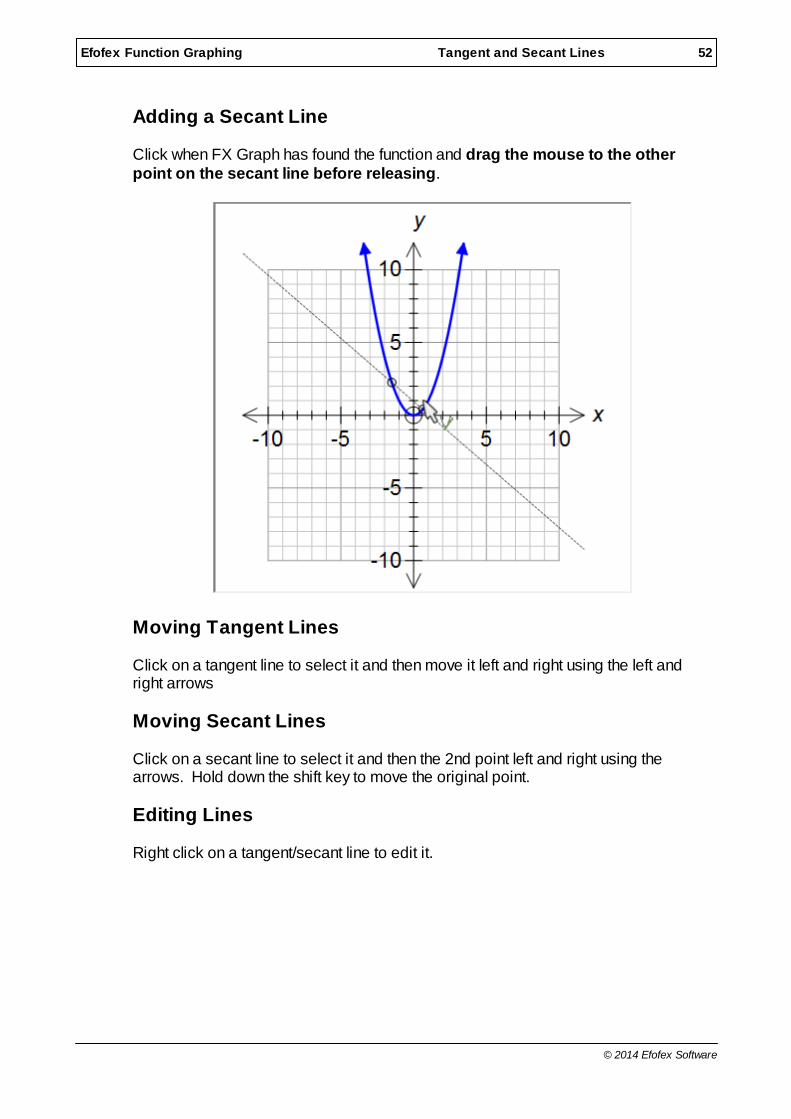
Adding a Secant Line
Click when FX Graph has found the function and drag the mouse to the otherpoint on the secant line before releasing.
Moving Tangent Lines
Click on a tangent line to select it and then move it left and right using the left andright arrows
Moving Secant Lines
Click on a secant line to select it and then the 2nd point left and right using thearrows. Hold down the shift key to move the original point.
Editing Lines
Right click on a tangent/secant line to edit it.

53Efofex Function Graphing Tangent and Secant Lines
© 2014 Efofex Software
You can change between secant and tangent lines here. Importantly, you can useconstants (discussed later) in the at and delta spots. This allows for some verynice demonstrations and animations.
19 Integrals
You can add integrals to Cartesian functions.
First, graph a function and then select the Integral tool
Move until FX Graph finds a function - click and drag the mouse to the other end ofthe integral.

54Efofex Function Graphing Integrals
© 2014 Efofex Software

55Efofex Function Graphing Integrals
© 2014 Efofex Software
If you have two functions on screen and wish to find the integral between them, waituntil FX Graph finds a point of intersection and click then. FX Graph will integratebetween the curves.
Editing Integrals
Right click to edit an integral

56Efofex Function Graphing Integrals
© 2014 Efofex Software
Here you can chose which things to integrate between and choose an integralapproximation. Divisions lets you set how many slices to divide the approximationinto. In the next graphic we have used the midpoint approximation with 10 divisions. You can use constants in both the bounds of integration and the number ofdivisions.
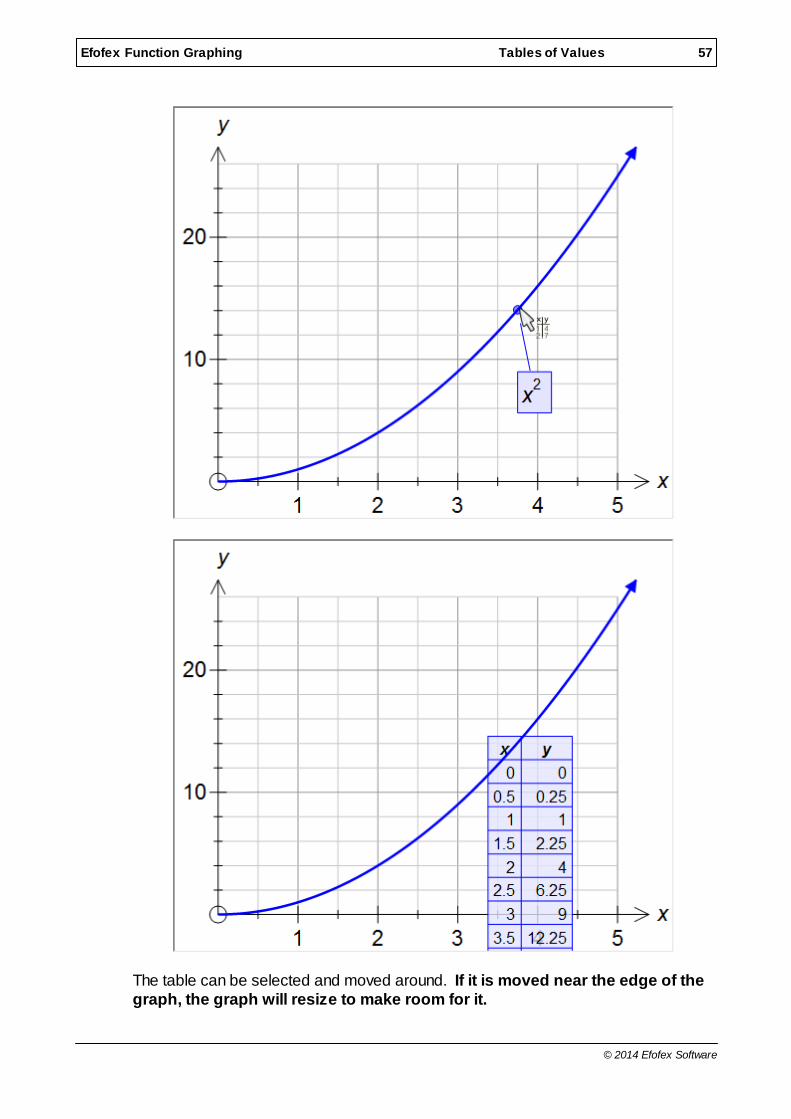
20 Tables of Values
Tables of Values can be added to most functions.
Enter a function and select the table of values tool . Move near the functionand, when FX Graph finds the function - click the mouse.
57Efofex Function Graphing Tables of Values
© 2014 Efofex Software
The table can be selected and moved around. If it is moved near the edge of thegraph, the graph will resize to make room for it.

58Efofex Function Graphing Tables of Values
© 2014 Efofex Software
By default, FX Graph will create a table that has an entry for every minor x grid line. Notice how on the graph above, there is a grid line at every x = 0.5 - that is why thetable goes up on lots of 0.5. You can edit this, and many other options, by rightclicking on the table.
Note that on the right-click menu we have the option of copying the date to theclipboard, changing the orientation (to a horizontal table) or editing the table'sproperties.

59Efofex Function Graphing Tables of Values
© 2014 Efofex Software
You might want to change the entries from automatic and create a table starting at 0,with 6 entries, incrementing in 1's.

60Efofex Function Graphing Tables of Values
© 2014 Efofex Software
21 Setting Domains
If you wish to graph a function for a specific domain, there are two ways of telling FXGraph what you want.

61Efofex Function Graphing Setting Domains
© 2014 Efofex Software
These two entries will produce the same graph. If you choose the second style, notethat you must use a semicolon to separate the domain from the function.
Using the brackets style is obviously quicker by the second style allows you to createmore versatile domains.

62Efofex Function Graphing Setting Domains
© 2014 Efofex Software
Domains are particularly important for polar and parametric functions. Finally, youcan use constants and pi in the domain. A domain such as (a,pi] is perfectlyacceptable.
22 Constants
FX Graph can use up to five different constants in each function. The five constantsare a, b, c, d and m.
To use constants, just enter them as part of the equation or domain. FX Graph willfind them and will display "constant controllers" for each constant you have used.For example, if we enter the function
ax2 + bx + c
FX Graph will show

63Efofex Function Graphing Constants
© 2014 Efofex Software
FX Graph has replaced the a, b and c with 1 and graphed the result: y = 1x2 + 1x + 1
Lets take a look at one of the controllers.
Try moving one of the sliders and watch both the graph and the annotation change toreflect the new value for the constant.

64Efofex Function Graphing Constants
© 2014 Efofex Software
Important
Constants are not just restricted to functions. Constants can be used just abouteverywhere - domains, integral bounds, tangent and secant lines - everywhere. Constants let you create a dynamic demonstration and learning environment.
23 Families of Curves
What is a family of curves? A collection of curves generated by varying one of theconstants. For example if I graph
x2 + a/x

65Efofex Function Graphing Families of Curves
© 2014 Efofex Software
Varying a will create a selection of different tridents - but if I push the Family ofCurves button.
I will see a collection of the curves with a varying from -4 to 6

66Efofex Function Graphing Families of Curves
© 2014 Efofex Software
The increment between the curves is determined in the constant controller but thenumber of curves is determined in the bottom controller.
If I move the slider to the right, I will increase the range, and the number of curves.

67Efofex Function Graphing Families of Curves
© 2014 Efofex Software
24 Animations
The concepts behind animations are very similar to Families of Curves - it is just thatFX Graph shows the curves one at a time.
To animate a constant, push the animate button.
The bottom controller has some controls that only affect animations.

68Efofex Function Graphing Animations
© 2014 Efofex Software
By adding constants to things like the number of divisions in an integralapproximation, you can create highly informative learning experiences.
25 Making Graphs Look The Way YOU Want
Everywhere in the world has different "standards" for the way graphs should look. Some places like arrow heads on axes, some don't. Some places want grids to goto the edge of the screen, some don't. There are many ways of marking the origin. FX Graph is capable of producing exactly what YOU want.
Your first place to visit is the Tools menu - choose Preferences. This will let you setoptions that you are unlikely to want to change once you have found the rightcombination for your use.
The axes options let you choose how ticks are marked, the sizes of variouscomponents of the axes and some miscellaneous controls on how the axes aredisplayed.

69Efofex Function Graphing Making Graphs Look The Way YOU Want
© 2014 Efofex Software
The graph options let you choose how feasible regions are shaded and the sizes ofdomain marks and point discontinuities.
The next place to visit is the Axes option in the Quick Entry screen.

70Efofex Function Graphing Making Graphs Look The Way YOU Want
© 2014 Efofex Software
Here you get to choose the origin mark and how arrows are displayed.
You may need to play for a while to get things right but, once you have, you canproduce exactly what you need every time.
26 Using FX Graph in Word
If you are using Office 2007 or later, the FX Graph button will be added to the Efofextab of Word
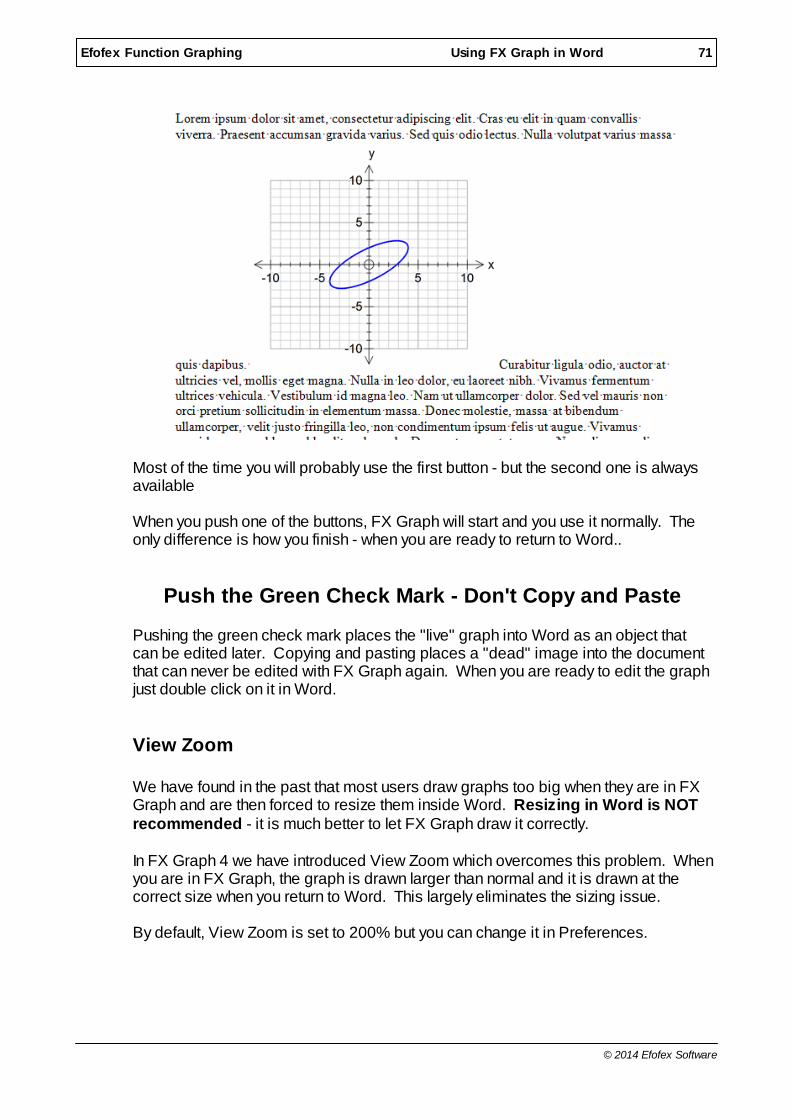
The buttons insert a new graph into your document. The way they operate is subtlydifferent. The first button inserts the image as a "floating" object that can be movedanywhere on the page. Text can be made to wrap around the graph
The second button inserts the graph "in-line". It sits in a line of text like a characterand the line of text is resized to fit it.
71Efofex Function Graphing Using FX Graph in Word
© 2014 Efofex Software
Most of the time you will probably use the first button - but the second one is alwaysavailable
When you push one of the buttons, FX Graph will start and you use it normally. Theonly difference is how you finish - when you are ready to return to Word..
Push the Green Check Mark - Don't Copy and Paste
Pushing the green check mark places the "live" graph into Word as an object thatcan be edited later. Copying and pasting places a "dead" image into the documentthat can never be edited with FX Graph again. When you are ready to edit the graphjust double click on it in Word.
View Zoom
We have found in the past that most users draw graphs too big when they are in FXGraph and are then forced to resize them inside Word. Resizing in Word is NOTrecommended - it is much better to let FX Graph draw it correctly.
In FX Graph 4 we have introduced View Zoom which overcomes this problem. Whenyou are in FX Graph, the graph is drawn larger than normal and it is drawn at thecorrect size when you return to Word. This largely eliminates the sizing issue.
By default, View Zoom is set to 200% but you can change it in Preferences.

72Efofex Function Graphing Using FX Graph in Word
© 2014 Efofex Software
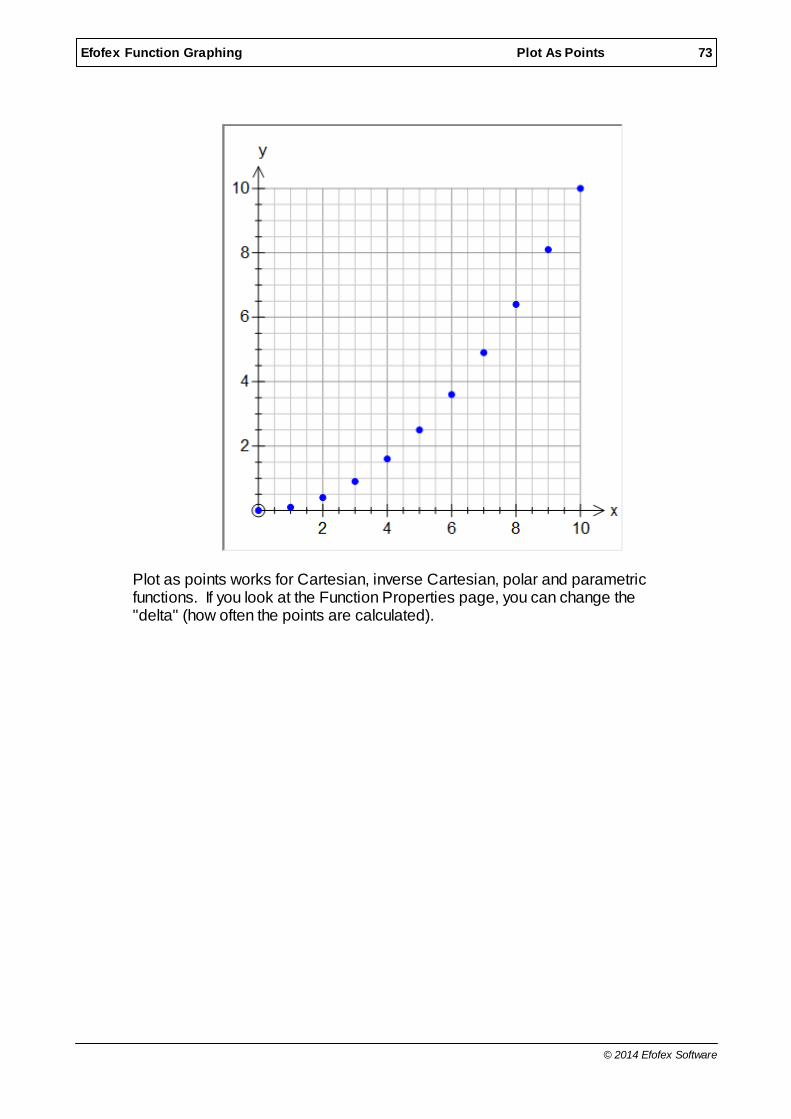
27 Plot As Points
If you right click on a function, you will see a Plot As Points option.
Selecting this option will turn the graph into a sequence of points, with x changing by1 each time.
73Efofex Function Graphing Plot As Points
© 2014 Efofex Software
Plot as points works for Cartesian, inverse Cartesian, polar and parametricfunctions. If you look at the Function Properties page, you can change the"delta" (how often the points are calculated).

74Efofex Function Graphing Plot As Points
© 2014 Efofex Software
You can enter just about anything as a delta - 0.1, 1/4, pi/3. You can even enter aconstant and use the constant controllers to control the delta dynamically.
That's All Folks!
This the last lesson in the Efofex Function Graphing Introductory Series. We hopethat you have got something out of each lesson but we are always willing to hearfeedback. Thanks for taking the time to learn about our product.