Effsys2 - project report heat pumps for the Swedish market ... dokument/P03/P3 slutrapport.pdf ·...
47
Effsys2 - project report CO 2 heat pumps for the Swedish market Test and analysis of the SANYO ECO- CUTE heat pump modified for Swedish conditions Authors: Yang Chen Per Lundqvist André Alves Leonie Brachert
-
Upload
hoangthuan -
Category
Documents
-
view
214 -
download
0
Transcript of Effsys2 - project report heat pumps for the Swedish market ... dokument/P03/P3 slutrapport.pdf ·...

Effsys2 - project report
CO2 heat pumps for the Swedish market
Test and analysis of the SANYO ECO-CUTE heat pump modified for Swedish
conditions
Authors: Yang Chen Per Lundqvist André Alves Leonie Brachert

1

TABLE OF CONTENTS
Table of contents .......................................................................................................................... 2 Table of figures ............................................................................................................................ 4 Abstract ........................................................................................................................................ 6 Introduction Description of Sanyo Eco-cute ................................................................................................... 11
The outdoor unit (SHP-C45DEN) .......................................................................................... 11 The indoor tank (SGP-TH22D) .............................................................................................. 14
Description of testing facifity and testing euqipments ............................................................... 17 Description of testing procedures ............................................................................................... 19 Testing results and analysis ........................................................................................................ 20
Stage 1. ................................................................................................................................... 20 Stage 2. ................................................................................................................................... 23 Stage 3. ................................................................................................................................... 29 Stage 4. ................................................................................................................................... 34
Discussion and conclusion ......................................................................................................... 38 Suggestions on further work ...................................................................................................... 41 Acknoledgement: ....................................................................................................................... 41 Reference: ................................................................................................................................... 42 Appendix .................................................................................................................................... 43
2

3

TABLE OF FIGURES Figure 1 schematic l diagram of water heating up process in a transcritical refrigeration cycle and a conventional refrigeration cycle [2] .................................................................................... 10 Figure 2. Size of the heat pump outdoor unit ................................................................................ 12 Figure 3. Schematic layout of the heat pump outdoor unit ........................................................... 13 Figure 4. Section view of the evaporator’s freezing protection circuit ........................................ 13 Figure 5. Gas cooler design ........................................................................................................... 14 Figure 6. Sketch of the Sanyo compressor [3] .............................................................................. 14 Figure 7. Size of Sanyo indoor tank ............................................................................................... 15 Figure 8 Layout of tank inside ....................................................................................................... 16 Figure 9. Program operation window (from ClimaCheck) ............................................................ 17 Figure 10. Schematic layout of testing measuring points ............................................................. 18 Figure 11. COP1 vs. Water inlet temperature to the gas cooler at 7 °C outdoor temperature (comment the funnyp patterns) ....................................................................................................... 20 Figure 12. Example of test results at +7 °C outdoor temperature ................................................ 22 Figure 13. COP vs. water inlet temperatures for different outdoor temperatures. ....................... 23 Figure 14. Test rig layout of system testing. .................................................................................. 24 Figure 15 Heat pump performances at different heating loads at 0°C outdoor temperature ....... 25 Figure 16 Heat pump performances at different heating loads at -5°C outdoor temperature ...... 26 Figure 17 Heat pump performances at different heating loads at -10°C outdoor temperature .... 26 Figure 18 Heat pump performances at different heating loads at -12°C outdoor temperature .... 27 Figure 19. Radiator inlet temperature vs. outdoor temperature .................................................... 28 Figure 20. Schematic layouts of the defrosting test facilities in the climate chamber ................... 30 Figure 21. Example of evaporator’s fin before defrosting (pos.1) ................................................ 31 Figure 22. Example of evaporator’s fin after defrosting (pos 1) ................................................... 31 Figure 23. Testing results of frequent defrosting (position 1) ....................................................... 32 Figure 24. Comparison of outer and inner evaporator plates at the same time ............................ 33 Figure 25. Amplified testing results of Figure 23 .......................................................................... 33 Figure 26, Layout of the thermocouple position in water tank testing .......................................... 34 Figure 27. Heating up of a cold tank with electric heater at off-mode .......................................... 35 Figure 28. Heating up of a cold tank with the electric heater at on-mode .................................... 36 Figure 29. Tank temperature distributions during defrosting period (electric heater at off-mode, with radiator load) ......................................................................................................................... 37 Figure 30. Tank temperature distributions during defrosting period (electric heater at off-mode, no radiator load) ............................................................................................................................ 37 Figure 31. Schematic layout of tank modification ......................................................................... 40 Figure 32. Schematic layout of tank modification 1 ...................................................................... 41 Figure 33 . Pretest results at 5°C outdoor temperature ................................................................ 43 Figure 34. Pretest results at 0°C outdoor temperature ................................................................. 43 Figure 35. Pretest results at -5 °C outdoor temperature ............................................................... 44 Figure 36. Pretest results at - 10 °C outdoor temperature ............................................................ 44 Figure 37. Defrosting test at -6°C at position 1 ............................................................................. 45 Figure 38. Defrosting test at 2°C at position 2 .............................................................................. 45 Figure 39. Ice layer built up on evaporator fin with boiler placed at position 2 .......................... 46
4

5

ABSTRACT The current report describes testing work of a Sanyo made CO2 heat pump. The heat pump has been modified by Sanyo based on the Swedish end users’ habit in order to fit the Swedish market. In the current study, the heat pump’s COP, its tank performance and the control scheme of defrosting are studied and reported. Based on the testing results, comments on the heat pump’s performance as well as on European heat pump testing standard (EN 14511-1) are given. Furthermore, suggestions on the methods to improve the heat pump performance and on further work are stated in the end.
The general test results show that the CO2 heat pump’s performance is highly dependant on the application and the surround systems. For applications, where there is a huge demand of hot water (hospitals, sport facilities etc.) or where there is a relative large ratio between the demand of hot tap water and space heating (i.e. newly built low energy buildings with floor heating), the CO2 heat pump will be competitive with traditional heat pumps. For typical Swedish houses, where the energy demand for space heating is much larger than for hot tap water, the CO2 heat pump will show a poorer performance, due to the typically relatively high return water temperatures to the heat pump and the relatively small temperature lift needed from the heat pump. The heat pump performance test results (i.e. the heat pump performance, without water tank) show that the tested CO2 heat pump, under the same testing conditions, achieved similar performances as presented in the manufactures technical manual. Furthermore, the tests also show that the European heat pump test standard (EN 14511-1) is not suitable for evaluating the performance of CO2 heat pumps. This is mainly due to the reason that the standard states testing conditions with relative high return water temperature (the most critical parameter that influences the CO2 heat pump performance) to the heat pump, which is very unfavorable to a CO2 heat pump. Therefore, if the same test standard is adopted to compare the CO2 heat pumps with traditional heat pumps, the performance of CO2 heat pump will be underestimated compared to cases with low inlet water temperature. One way would be to extend the test procedure with additional operating conditions allowing for a lower water flow, thus enabling a larger temperature glide for the heat sink. When performing the system tests (e.g. testing with the water tank and the radiator load), the CO2 heat pump achieves a lower COP than conventional heat pumps. The main reason for the poor system performance of the tested CO2 heat pump system is due to the influence of water tank. The performance of the CO2 heat pump is very sensitive to the water inlet temperature to the gas cooler. A high water inlet temperature will introduce large thermodynamic losses due to the characteristics of the working fluid, and thus greatly lower the heat pump performance. The typical water tank design for conventional heat pumps does not fit a CO2 heat pump since it delivers water to the CO2 heat pump at an unfavorable high temperature. Furthermore, it has been noticed that the important tank stratification is destroyed every time the heat pump delivers new hot water to the tank. This can be improved by changing the design of
6

the water tank. Based on the test results, suggestions on how to improve the heat pump system performance are given at the end of the report.
7

8

INTRODUCTION Based on the choice of heat source, heat pumps are often divided into three main categories: ground source, water source and air source heat pumps. The choice of heat source is strongly influenced by regional conditions such as the availability and temperature of the heat source (for instance the air temperatures for air source heat pumps and ground conditions for ground source heat pumps, etc.) Another way to categorize heat pumps could be based on the choice of refrigerants. Heat pumps could again be divided into three categories: heat pumps with pure synthetic working fluids, heat pumps with different types of mixtures and heat pump working entirely with natural working fluids such as CO2, Ammonia or Water. The refrigerant Carbon Dioxide, CO2 was widely used in marine and air conditioning applications during the first decades of the 20th century but were gradually passed-out when the CFC fluids were introduced in the 1930s. Since then CO2 has been “gone” for a long time until the late 1980s, when the search for alternatives started due to the findings concerning ozone depletion and global warming caused by CFC and HFC refrigerants. Ever since Professor Gustav Lorenz proposed the CO2 transcritcal cycle in early 1990s, carbon dioxide (CO2) has been more and more “popular” all over the world [1]. Due to its low critical temperature (31.3 °C), a carbon dioxide refrigeration cycle will, in many applications, be a so-called transcritical cycle. This means that the refrigerant will encounter no sharp phase change on the high temperature side – the condenser in a conventional system becomes a gas cooler of a supercritical fluid. The high critical pressure of CO2 also gives a challenge in designing the heat exchangers and above all the compressors. Due to all these reasons, the introduction of suitable components for CO2 refrigeration systems has to be introduced on the market and mass-produced in the same way as the components for conventional refrigeration systems. This has so far made CO2 heat pumps more expensive and thus not yet so widely spread. Compared to heat pumps using conventional refrigerants, a carbon dioxide heat pump has an advantage when heating cold water with a large temperature glide producing high temperature hot water directly. This is due to the fact that the temperature glide of supercritical carbon dioxide matches the hot water heating process better than conventional refrigerants do, which will lead to less irreversibilities and can give higher COP than conventional heat pumps have (Figure 1) provided the system is designed accordingly. However, this also makes the demand profile of the users a critical factor that strongly influences the performance of a CO2 heat pump.
9

Figure 1 A schematic diagram showing the thermodynamic cycle of the process and the water heating process (blue line) in a transcritical refrigeration cycle(left) and in a conventional
refrigeration cycle (right) [2] Japan has from the beginning been leading the process of commercializing the carbon dioxide air source heat pumps, mainly due to three reasons:
• Japan has small houses with limited living space, which makes the geothermal heat pump difficult to realize with a big water tank for example;
• The traditional habit of hot bathing, Onsen, requires large amount of hot water. It is thus clear that this nice habit requires a more efficient and environmental benign way of producing hot water than the conventional way of burning fossil fuels (i.e. natural gas);
• Governmental subsides, supporting the introduction of energy saving technologies such as the carbon dioxide heat pump.
The tested Japanese CO2 heat pump has “Eco-Cute” as a general name, which derives itself from the Japanese pronunciation of “hot water heater”. The Eco-Cute technology was jointly developed by the Tokyo Electric Power Company (TEPCO), Denso Corporation and CRIEPI, since the year 1998. In year 2001, the world’s first CO2 heat pump water heater was introduced on the market simultaneous by Corona, Sekisui Chemical, Mitsubishi Electric, Shihen Technical, Kyuhen and other companies with Denso as the original equipment manufacturer. With the fast development of CO2 heat pumps, in fiscal year 2005 alone, about 225 000 units were shipped in Japan [3]. There are thus many Japanese CO2 heat pump manufactures nowadays providing CO2 heat pumps, such as Sanyo, Sharp and Daikin, etc. Among them, Sanyo has been a pioneer in developing units for the European market. However, when compared to habits of some Japanese end users, there is not so high demand for hot tap water in Swedish but instead a much higher demand for heating energy due to the cold Nordic climate. Therefore, the “Swedish version” Eco-
10

cute has been modified to produce both hot tap water and heating energy (radiator water). The Japanese version of Eco-cute only produced hot tap water. The Swedish company Ahlsell AB is the authorized Swedish importer and distributer of Sanyo CO2 heat pumps. Since July, 2005, more than 3000 units are sold in Sweden by Ahlsell. However, there has not been very much information about the performance of the modified Swedish Eco-cute available on the Swedish market. In the current project, A Sanyo made “Swedish Eco-cute” is tested at KTH, Energy technology, in the lab of Division of Applied Thermodynamics and Refrigeration The heat pump being tested is rated to deliver 4.5 kW heating power at an outdoor air temperature of -15 °C. It should also be capable of heating the tap water up to +70 °C (which is very high). The main objective of the tests is to study the heat pump unit and the heat pump system COPs, the tank performance and the defrost control.
DESCRIPTION OF SANYO ECO-CUTE The Sanyo Eco-cute consists of two main parts: the outdoor unit and the indoor water tank. The outdoor unit comprises the entire heat pump unit, while the indoor unit includes the water tank and the control unit of the heat pump. According to the water temperature condition, the control unit will send out a control signal to the outdoor unit to adjust its working condition accordingly.
The outdoor unit (SHP-C45DEN) The size of the heat pump outdoor unit is shown in Figure 2. The heat pump’s net weight is 65 kg. The noise level of the heat pump is claimed to be 46 db (1 meter from heat pump) and there are 860 grams of CO2 in the system.
11
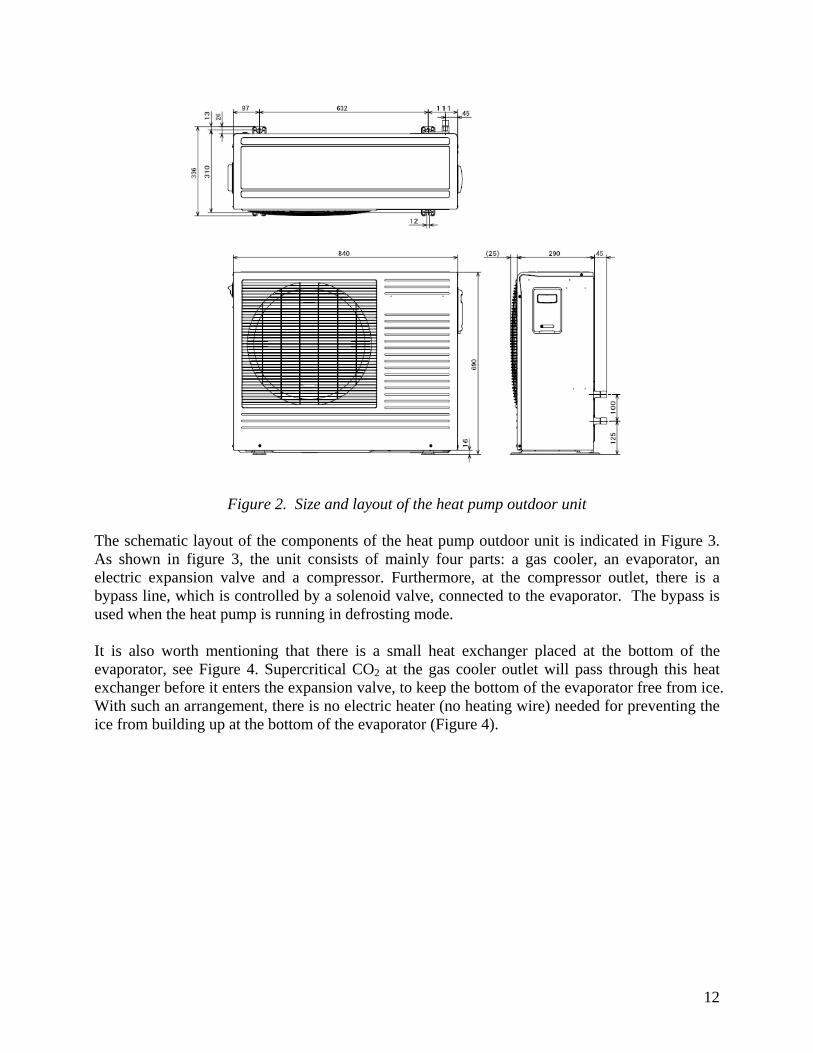
Figure 2. Size and layout of the heat pump outdoor unit
The schematic layout of the components of the heat pump outdoor unit is indicated in Figure 3. As shown in figure 3, the unit consists of mainly four parts: a gas cooler, an evaporator, an electric expansion valve and a compressor. Furthermore, at the compressor outlet, there is a bypass line, which is controlled by a solenoid valve, connected to the evaporator. The bypass is used when the heat pump is running in defrosting mode. It is also worth mentioning that there is a small heat exchanger placed at the bottom of the evaporator, see Figure 4. Supercritical CO2 at the gas cooler outlet will pass through this heat exchanger before it enters the expansion valve, to keep the bottom of the evaporator free from ice. With such an arrangement, there is no electric heater (no heating wire) needed for preventing the ice from building up at the bottom of the evaporator (Figure 4).
12

Figure 3. Schematic layout of the heat pump outdoor unit
Anti-freezing circuit
Figure 4. Section view of the evaporator’s freezing protection circuit The heat pump’s gas cooler (serving as the water heater) is a counter flow heat exchanger. As illustrated in Figure 5, it is made of four copper tubes: there is a big tube placed in the center and three small tubes squeezed onto the bigger tube by pressure. Water flows in the centre tube and CO2 flows in the other three tubes in a counter-current fashion.
Evaporator Pipe thickness 0.6 mm
Warm CO2 Pipe thickness 0.9 mm
Freezing protection
circuit
Air flow
13
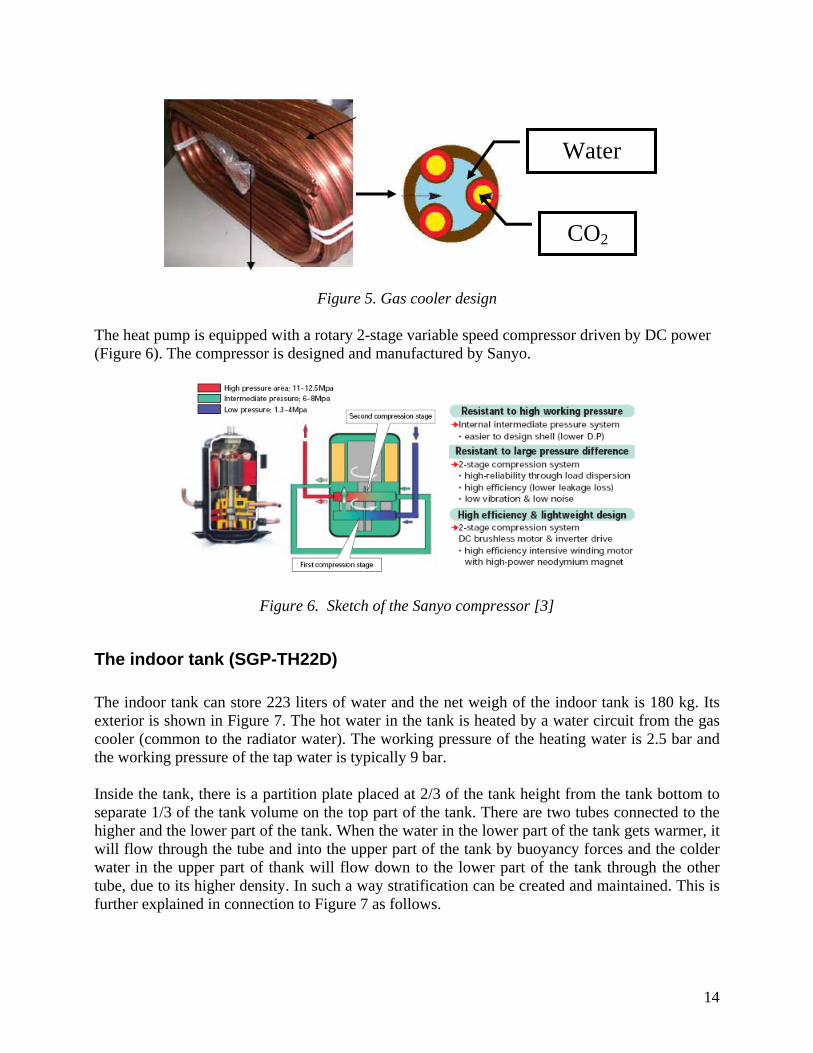
Water
CO2
Figure 5. Gas cooler design
The heat pump is equipped with a rotary 2-stage variable speed compressor driven by DC power (Figure 6). The compressor is designed and manufactured by Sanyo.
Figure 6. Sketch of the Sanyo compressor [3]
The indoor tank (SGP-TH22D) The indoor tank can store 223 liters of water and the net weigh of the indoor tank is 180 kg. Its exterior is shown in Figure 7. The hot water in the tank is heated by a water circuit from the gas cooler (common to the radiator water). The working pressure of the heating water is 2.5 bar and the working pressure of the tap water is typically 9 bar. Inside the tank, there is a partition plate placed at 2/3 of the tank height from the tank bottom to separate 1/3 of the tank volume on the top part of the tank. There are two tubes connected to the higher and the lower part of the tank. When the water in the lower part of the tank gets warmer, it will flow through the tube and into the upper part of the tank by buoyancy forces and the colder water in the upper part of thank will flow down to the lower part of the tank through the other tube, due to its higher density. In such a way stratification can be created and maintained. This is further explained in connection to Figure 7 as follows.
14

Figure 7. Size of Sanyo indoor tank
Figure 8 shows a sctech of the tank interiors. Due to hyginic requirments, it is not allowed to take the hot tap water directly from the same tank as the radiator warm water. Therefore, there is a coil placed in the tank to produce the hot tap water seperately. As shown in the figure, the cold city water comes from the left coil (blue color) and flows down directly to the lower part of the tank. From there, the cold water will be heated up gradualy by the lower part of the tank, upper part of the tank and then provided to the end user. Furthermore, there is en electric heater placed in between the lower coil and upper coil to further heat the water in cases when the temperature in the tank is too low. For the radiator water, there is a four way valve connected to the upper part of the tank, the lower part of the tank and the return loop of the radiator. Depending upon the tempertaure of the water to the radiator, the four way valve will open or close automatically to take water from either the lower part of the tank, upper part of the tank or the return loop from the radiator to maintain a constant desired inlet tempeature to the radiator circuit.
15

Originally the gas cooler of the heat pump unit will receive its water from the bottom of the water tank (blue line with valve at the bottom of the tank). If a large amount of heat is “taken away” to the radiator system in a short time, i.e a large heating demand, the important stratification in the water tank will be destroyed. Furthermore, due to the water’s thermal capacity in the tank, the influence of the radiator’s heating load variation on the water inlet temperture to the heat pump will be delayed and it will therefore make it hard to control the water inlet temperature to the heat pump at a desired low value. To aviod test conditions where the stratification is destroyed and to make it easier to control the water inlet temperature to the heat pump, the connection where the heat pump takes water from the tank has been modified . As shown in the figure (Figure 8), the pipe at the bottom of the tank is closed. Instead, the connection on the side of the tank, which used to be the connection for radiator return loop to the tank, has been changed to a three way connection to the heat pump water inlet. In case there is a large heating demand in the radiator during the testing, the cold radiator return water will directly be pumped into the heat pump gas cooler instead of forcing it to return to the water tank and mix and thus destroy the temperature stratification in the tank.
Figure 8 Layout of tank inside
16

DESCRIPTION OF TEST FACILITY AND TEST EQUIPMENT The testing is performed in the refrigeration lab of Energy Department of Royal Institute of Technology (ETT lab). For the test, the outdoor unit is placed in a climate chamber, where different outdoor conditions were created down to -12 °C (in the test). The indoor tank is placed in the heated lab space outside the climate chamber. A plate heat exchanger, which is cooled by city water, is connected to the radiator connection of the tank to simulate the radiator system of a building. The data acquisition system is provided as part of the project by the Swedish company ClimaCheck AB [4]. The data acquisition software used was developed by ClimaCheck. The system is typically used to collect operational data from refrigeration, air- conditioning and heat pump systems in the field in order to monitor and evaluate their performances and to give suggestions on system optimization. The system also works excellent in a laboratory setting.
Figure 9. Software operational window (from ClimaCheck)
Figure 9 shows the standard ClimaCheck software operational window. As shown in the figure, the program collects data from both primary side (i.e. temperatures, pressures and mass flow rate on refrigerant side) and the secondary side (i.e. temperatures, flow rates on the water side). The power consumption of the compressor is also recorded by the system. PT1000 elements are used for the temperature measurements. The water volume flow to the heat pump is measured by an energy meter produced by Brunata. The compressor power is measured by a three-phase power analyzer (Type WM22-DIN). Only one phase of the three-phase power analyzer is however used due since the compressor is driven by DC power. The accuracy of the measurement instruments are summarized in Table 1.
17

Table 1 Accuracy of the measurement instruments Variable Measurement instrument Accuracy Temperature Pt 1000 DIN class A t×+± 002.015.0 [°C] Volume flow HGQ1-R3-182/1 EN1434 class 2 Compressor power WM22-DIN Current (I):
from 0.003Ib to 0.2 Ib: )3%5.0( DGTRDG +±
from 0.2Ib to Imax: )1%5.0( DGTRDG +±
Voltage (U): in the range Un:
)1%5.0( DGTRDG +± Frequency (Hz):
RDG%1.0± (50 to 60 Hz) Due to agreed upon safety and confidentially reasons, it was not allowed to open the refrigerant loop during the testing. Therefore, during the study, the CO2 temperatures are measured on the tube surfaces, and no pressure readings were taken in the cycle. The study of the heat pump had to a large part to be done indirectly via measurements on the secondary sides i.e. the water and air sides. Figure 10 shows a schematic layout the test rig’s data acquisition points. As shown in the figure, for the outdoor unit, CO2 temperatures are monitored on the evaporator, after the compressor and before the expansion valve respectively. Meanwhile, the air temperatures before and after the evaporator as well as water temperatures at gas cooler inlet and outlet are also recorded. For the tank side, the temperatures at tap water inlet and outlet as well as temperatures before and after radiator are recorded. Furthermore, the compressor power consumption, water flow rate to the heat pump and radiator are also monitored.
E-2
P-10
P-11
E-6
V-3
P-15
P-16
E-9
V-2
E-3E-4
E-5P-2
P-3P-4
P-5
P-6
P-7
Temperature sensor
Energy meter
Flow meter
I-1
I-2 Power meter
I-3
P-23
P-12
Figure 10. Schematic layout of test rig with measurement points
18

DESCRIPTION OF TESTING PROCEDURES The testing work is performed at different outdoor temperatures and in four different stages: Stage 1. The heat pump unit is tested without the influence of water tank. The performance is
tested by maintaining the water inlet temperature to the heat pump constant, while recording all the other data. The tested performance is then compared with the performance data provided by the manufacturer in the technical manual.
Stage 2. The heat pump is tested together with the water tank and the radiator load (i.e. system
testing). A plate heat exchanger cooled by city water is connected to the water tank to simulate the radiator system. Different cooling water flow rates are used to simulate different house heating demands. The COP of the system is recorded.
Stage 3. The defrosting scheme of the heat pump is studied. Stage 4. The water temperature distribution in the tank is recorded. The tank performance at
different conditions is studied.
19

TEST RESULTS AND ANALYSIS
Stage 1. It is well known that refrigeration cycles operating near the critical point have higher throttling losses than cycles with condensing temperatures much lower than the critical temperature. The throttling losses in a transcritical cycle can however be reduced if the temperature of the supercritical fluid before the throttling valve is considerably lower than the critical temperature. This is especially important to have in mind when working with CO2-cycles. Therefore, the working fluid temperature after the gas cooler outlet has a crucial influence on the performance of CO2 heat pumps. It is important to cool down the fluid temperature as low as possible. If a constant approaching temperature difference is assumed, it will become obvious that the system should operate with as low cooling water inlet temperature to the gas cooler as possible. Thanks to the modified connection of the water inlet from the tank to the heat pump, it is in the experiment possible to control the heat pump water inlet temperature by adjusting the cooling water flow rate to the plate heat exchanger (i.e. the one simulates the radiator system).The variation of heat pump unit COP for different water inlet temperatures were pre-tested at the beginning of the testing work to get a feeling on the water inlet temperature’s control scheme. The heat pump performance at different water inlet temperature to the gas cooler was tested at 7 °C outdoor temperature. These test results are shown in Figure 11. As the trend shows in the figure, the heat pump heating COP decrease with increasing water inlet temperatures. Besides that, one may also notice large deviations in the results. The reason for this is the dynamic behavior of the system, the different operating points were monitored during a relative short period of constant water inlet temperature (i.e. the system was not at a very stable condition, when those points were recorded). More results can also be found in appendix 1.
1
1.5
2
2.5
3
3.5
4
4.5
5
5.5
6
15 20 25 30 35 40 45
Water inlet temperature gas cooler
CO
P 1
Figure 11. COP1 vs. Water inlet temperature to the gas cooler at 7 °C outdoor temperature
20

After the pretesting, the main tests for heat pump COPs at varying water inlet temperatures to the gas cooler were done at the following outdoor temperatures: -10, -5, 0 and 7 °C. During the main tests, the heat pump heating COP were recorded during significantly longer period of constant water inlet temperature than for the pre-tests. As mentioned previously the performance of CO2 heat pumps is strongly influenced by the water inlet temperature to its gas cooler due to the high throttling losses for cycles operating near the critical point. For applications in real buildings, operating under varying conditions, the heating demand should be divided into two main categories: space heating (radiator water heating) and tap water heating. The space heating can be further roughly divided into three sub-categories: high temperature space heating, medium temperature space heating and low temperature space heating (I.e. floor heating). Depending upon the building design and type of heat distribution system (e.g. old poor insulated houses, new well insulated houses), different temperature levels for space heating (the heating system) will be required. Accordingly, the ratio between the energy demand for space heating and tap water heating will be different. All these differences are important for selecting the right heat pump systems and will decide whether the performance of a CO2 heat pump can compete with conventional heat pump systems or not. The European test standard (EN14511) specifies a heat pump testing standard with a constant water inlet temperature of 40°C and an outlet temperature 45°C at an outdoor temperature of 7 °C (with variations for different temperature levels). This specified condition however does not reflect all possible “real house conditions” found on the market. Furthermore, it also does not show the difference between modern houses, where the heating demand for tap water heating is much higher than space heating and the old houses, where the heating demand is relatively large. This means that tests done at a 40°C water inlet temperature not necessarily reflect conditions when the CO2 heat pump could (or should) be used (i.e. a space heating system with low return water temperature or. modern houses with floor heating systems). Test results based on the standard EN14511 therefore cannot give a good comparison between CO2 and traditional heat pumps. For the reasons stated above, the heat pump unit is here tested based on testing condition given in the heat pump manual and the testing results will thus be compared with the results given by the manual. During the testing, data is recorded and calculated when the heat pump working conditions are stable for about 30 minutes. An example of recorded results at 7 °C outdoor temperature is shown in figure 12. With this manner, the heat pump’s COP is tested against different water inlet temperatures at different outdoor temperatures (i.e.-10, -5, 0 and 7 °C respectively). Figure 13 shows all the test results. As shown in figure (Figure 13), the heat pumps heating COP decreases with increasing water inlet temperature as expected and it decreases with decreasing outdoor temperature (as usual). One may notice that the points in Figure 13 are not all monitored at the same water inlet temperature. This is due to the reason that the water pump, which controls the water flow rate from the water tank to the heat pump, was controlled by the built-in control algorithm. This algorithm changes the flow rate dependant upon the tank conditions, which influences the water inlet temperature and so on.
21

Based on the test results, the heat pump COP is compared with the data given by the manufacturer. The values for the COP from the manufacturer data sheet are given for three different outdoor temperatures: -15, 7 and 20 °C, based on constant water inlet and outlet temperatures to and from the heat pump at 30 °C and 50 °C respectively. Several tests have been done at different outdoor temperatures during stages 1 and 2. Due to some limitations of the climate chamber, it was however not possible to reach as low as -15 °C outdoor temperature. The manual specifies three different outdoor conditions. Therefore, only the test results at 7°C and 20°C outdoor temperatures are compared with data from the manufacturer during phase one of the testing. The test results at 7 °C outdoor temperature were obtained at a mean water inlet temperature of 30.12 °C and a mean outgoing water temperature of 59.17 °C. Compared with the test conditions of the manufacturer, the laboratory testing had a higher water outlet temperature (59 compared to 50°C), which results in a lower COP. The COP from the lab test was 2.91 whereas the manufacturer data gives 3.1. For 20°C outdoor temperature, the lab testing results were achieved at a mean water inlet temperature of 30.4 °C and a mean water outlet temperature of 51.58 °C, which is very similar to the manual’s given testing condition. The lab testing under the above specified condition achieved a COP as 4.2, which is slightly higher than the manual data as 3.75.
Figure 12. Example of test results at +7 °C outdoor temperature
22

0
0,5
1
1,5
2
2,5
3
3,5
15 20 25 30 35 40 45
Water inlet temperature to the gas cooler
CO
P_1
0 °C7 °C-5 °C-10 °C
Figure 13. COP vs. water inlet temperatures for different outdoor temperatures.
Stage 2.
In the stage 2-testing, different heating loads at the plate heat exchanger, which simulates the radiator system, are defined and kept constant for a series of testing at different outdoor temperatures as: -12°C,-10°C, -5 °C and +0°C. All the tests are done without the electric heater. The test rig layout for system testing is shown in Figure 14.
23

Figure 14. Test rig layout for the system tests.
In the system tests, city water with a constant temperature is used as a cooling media for the plate heat exchanger. The water temperature to the radiator system (point 3) is determined by the heat pump control algorithm, which is a function of outdoor temperature (this can be seen later on in the test results). The out-going water temperature from the heat pump unit (point 5) to the water tank is about 60 ºC, which is the set point of the heat pump. The heat pump will adjust its compressor’s speed and the water circulation rate between the heat pump unit and the water tank to meet this temperature demand. The cooling water circulating rate is adjusted manually to maintain a certain temperature drop cross the radiator system. Based on practical experience and values found in literature, a 5K temperature drop across the plate heat exchanger can be used to simulate testing typical conditions for a low temperature floor heating systems [4]. For a 10-15K1 temperature drop, the test condition corresponds to a low flow radiator system for Swedish conditions. For conventional radiator systems as well as floor heating, temperature changes in the heating water circuit of 5 to 8 K are considered typical. After considering the factors mentioned above and the capacity limit of the heat pump without electric heater, the following testing conditions are chosen (Table 2):
1 Statements from the German radiator technical company “Hennemann” give as upper level spreads of about 10-15K.
24

Table 2 List of the testing conditions Heating load
(KW) Temperature difference
(K) Radiator water flow rate
(m3/h) 4,7 8 0.5 3 8 0.33
2.9 5 0.5 1.9 5 0.33
All test runs are done at stable operating conditions for the entire heat pump system (including the plate heat exchanger). Dynamic changes of the tank conditions are inevitable, but should be kept in a way not affecting the other parameters. If these prerequisites are realized, average values over the stable period, which should last between 30 and 60 minutes, shall represent a specific condition.
Figures 15 thru 18 show the test results at different outdoor temperatures for different capacities (i.e. different compressor speeds) and water flow rates.
+0 °C ambient air temperature
-8.2
3
33.0
7
63.5
4
111.
99
32.9
4
38.5
6
2.34
0.16 5.
63
2.40
-9.1
0
34.8
6
61.7
2
92.1
7
34.3
4
39.4
0
2.14
0.16 5.
05
2.36
-8.0
6
31.7
6
63.1
3
111.
74
31.4
5 39.2
8
2.34
0.16 5.
69
2.44
-9.2
5
31.4
9
60.8
6
92.2
7
31.4
2 39.7
4
2.15
0.16 5.
39
2.51
-20
-10
0
10
20
30
40
50
60
70
80
90
100
110
120
CO2
com
pr. i
n [°C
]wa
ter g
as c
oole
r in
[°C]
wate
r gas
coo
ler o
utCO
2 co
mpr
. out
[°C]
Trad
retu
rn [°
C]
Trad
sup
ply [
°C]
Com
pres
sor p
ower
[kW
]
Flow
[m3/
h]he
atin
g ca
pacit
y [kW
]
COP
[-]
1.9KW/deltaT=5K/0,33m3/h2.9KW/deltaT=5K/0,49m3/h3KW/eltaT=8K/0.33m3/h4.7KW/deltaT=8K/0,50m3/h
Figure 15 Heat pump performances at different heating loads at 0°C outdoor temperature
25
-5 °C ambient air temperature
-10.
39
47.8
6
62.5
3
91.0
5
37.5
7
42.9
8
2.25
0.20 3.
48
1.54
-12.
15
43.9
5
61.7
8
93.3
4
37.8
8
43.2
4
2.38
0.20 4.
24
1.77
-13.
68
35.3
2
61.7
7
96.7
4
35.1
6 43.3
8
2.36
0.17 5.
09
2.16
-14.
26
32.9
3
60.2
8
96.5
6
32.8
4 41.1
9
2.34
0.16 5.
23
2.24
-20
-10
0
10
20
30
40
50
60
70
80
90
100
CO2
com
pr. i
n [°C
]wa
ter g
as c
oole
r in
[°C]
wate
r gas
coo
ler o
ut
CO2
com
pr. o
ut [°
C]
Trad
retu
rn [°
C]
Trad
sup
ply
[°C]
Com
pres
sor p
ower
[kW
]
Flow
[m3/
h]
heat
ing
capa
city
[kW
]
COP
[-]
1.9KW/deltaT=5K/0,33m3/h2.9KW/deltaT=5K/0,49m3/h3KW/eltaT=8K/0.33m3/h4.7KW/deltaT=8K/0,50m3/h
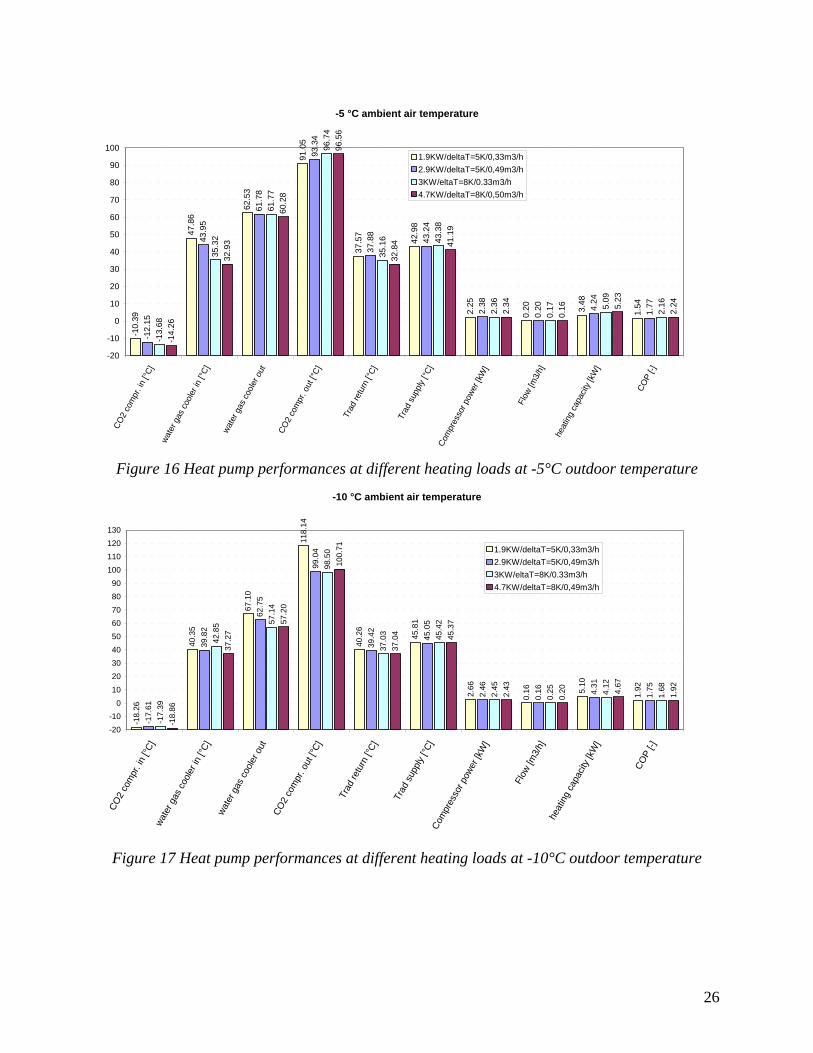
Figure 16 Heat pump performances at different heating loads at -5°C outdoor temperature
-10 °C ambient air temperature
-18.
26
40.3
5
67.1
0
118.
14
40.2
6
45.8
1
2.66
0.16 5.
10
1.92
-17.
61
39.8
2
62.7
5
99.0
4
39.4
2
45.0
5
2.46
0.16 4.
31
1.75
-17.
39
42.8
5 57.1
4
98.5
0
37.0
3 45.4
2
2.45
0.25 4.
12
1.68
-18.
86
37.2
7
57.2
0
100.
71
37.0
4 45.3
7
2.43
0.20 4.
67
1.92
-20-10
0102030405060708090
100110120130
CO2
com
pr. i
n [°C
]wa
ter g
as c
oole
r in
[°C]
wate
r gas
coo
ler o
utCO
2 co
mpr
. out
[°C]
Trad
retu
rn [°
C]
Trad
sup
ply [
°C]
Com
pres
sor p
ower
[kW
]
Flow
[m3/
h]he
atin
g ca
pacit
y [kW
]
COP
[-]
1.9KW/deltaT=5K/0,33m3/h2.9KW/deltaT=5K/0,49m3/h3KW/eltaT=8K/0.33m3/h4.7KW/deltaT=8K/0,49m3/h
Figure 17 Heat pump performances at different heating loads at -10°C outdoor temperature
26

-12 °C ambient air temperature-1
9.96
40.4
7
59.4
6
105.
90
39.9
9 47.6
7
2.48
0.20 4.
40
1.77
-19.
51
44.7
7
61.2
6
105.
02
39.5
4 47.4
8
2.50
0.20 3.
90
1.56
-19.
50
43.5
3
57.6
6
104.
23
37.8
1 46.5
4
2.48
0.25 4.
09
1.64
-20.
18
37.5
8
61.2
1
104.
17
37.3
9 45.8
5
2.43
0.16 4.
51
1.86
-30
-20
-10
0
10
20
30
40
50
60
70
80
90
100
110
120
CO2
com
pr. i
n [°C
]
wate
r gas
coo
ler i
n [°C
]
wate
r gas
coo
ler o
ut
CO2
com
pr. o
ut [°
C]
Trad
retu
rn [°
C]
Trad
sup
ply
[°C]
Com
pres
sor p
ower
[kW
]
Flow
[m3/
h]
heat
ing
capa
city
[kW
]
COP
[-]
1.8 KW/deltaT=5K/0,31m3/h2.6 KW/deltaT=5K/0,45m3/h3 KW/deltaT=8K/0.33m3/h4.7 KW/deltaT=8K/0,50m3/h
Figure 18 Heat pump performances at different heating loads at -12°C outdoor temperature
As shown in the above figures, the compressor power increases slightly with decreased outdoor temperature. As a consequence, the CO2 temperature at the compressor outlet will increase. This helps to maintain the water outlet temperature at the desired temperature at lower outdoor temperatures. The water flow rate from the water tank to the heat pump unit is controlled to maintain the temperature of the water delivered to the water tank to around 65 °C. It can also be noticed from the charts that the radiator inlet temperature will increase with decreased outdoor temperature (Fig. 19).
27

0,00
10,00
20,00
30,00
40,00
50,00
60,00
-15 -12 -9 -6 -3 0
T_outdoor (°C)
T_ra
diat
or(°
C)
1.9kW/delta T=5K/0.33m3/h2.9kW/delta T=5K/0.49m3/h3kW/delta T=8K/0.33m3/h4.7kW/delta T=8K/0.49m3/h
Figure 19. Radiator inlet temperature vs. outdoor temperature
The different values of COP calculated in the charts are system COP, which are calculated as:
HeatPump
atDemandRadiatorHe
WQCOP = Equation 1
Comparing the data with the same heating demand at different outdoor temperatures, one can notice that the system COP is decreasing with decreasing outdoor temperature in general (except the 1.9 kW data, for which the testing condition was not as stable as others due to the very small heating demand from the radiator). Comparing the data with the same temperature difference but different heating demand, one can notice that the temperature of the water delivered to the heat pump from the water tank has a more crucial influence on system COP than other parameters. Comparing the data with 8K temperature difference, the system COP is higher for the 4.7 kW case. This is due to the reason that 4.7 kW is higher than the heat pump capacity at these conditions which results in a steadily decrease of water temperature in the tank, i.e energy from the tank is delivered to the building and conditions are not stable. As mentioned before, the advantage of the CO2 heat pump in heating up tap water with a large temperature glide and the high throttling losses for operating points near the critical point, a low water return temperature and a large temperature lift will result in a relatively higher COP improvement for CO2 heat pumps than for conventional ones. The results also indicate that CO2 heat pumps will fit houses where there is a large temperature drop in the radiator system (a low water flow rate) or for applications where there is a relatively large demand for hot tap water compared to the space heating demand.
28

Stage 3. Stage 3 mainly focused on investigating the defrosting scheme of the Sanyo Eco-cute heat pump since no description of this was available. These tests were therefore more or less based on a trail-error manner to investigate the heat pump’s defrosting scheme and the heat pump’s performance during the defrosting period. As described previously in the heat pump unit description part, the heat pump has a bypass line controlled by a solenoid valve after the compressor. When defrosting starts, this valve will open and “hot”CO2 will be diverged to from the compressor outlet to the evaporator to remove any ice formation. Figure 20 shows the schematic layout of the test facility in the climate chamber. A normal water boiler is used as a steam generator to create the required humidity in the climate chamber. There are two positions used as testing positions for the boiler: Position 1 is considered as a pre-testing position, where the boiler creates very strong humidity conditions in the region close to the heat pump (boiler is placed about 50 cm away from the heat pump evaporator’s fin). By pre-testing at this position, the defrosting should happen extremely frequent due to the high moisture content in the air close to the evaporator. Therefore, changes of the heat pump system parameters during the defrosting period can be relatively easily studied. Furthermore, the possible influence of the heat generated by the boiler on the air inlet temperature to the heat pump’s evaporator is also studied to avoid the bias on the testing results. There is however no large observable difference between the air inlet temperature and the pre-set climate chamber’s temperature. Therefore, the influence of the heat generated by the boiler on the air inlet temperature to the heat pump’s evaporator can be neglected. In position 2 a more uniform moisture distribution is created in the climate chamber. This is used to test the heat pump performance during normal defrosting periods. Furthermore, during the tests with the boiler placed at position 2, the relative humidity of the air in the climate chamber is measured regularly with a psychrometer. The relative humidity is always controlled to be in the range of 75-85 % at different temperatures conditions. The tests are run under constant radiator heating loads of about 3.5 or 5 kW with a radiator water volume flow of approximately 0.5 m3/h. Data is recorded when the heat pump system has reached stable working condition with the predefined radiator load. Moreover, in addition to the measuring equipment already mounted on the heat pump system, two extra thermocouples are mounted on the bottom and middle of the evaporator air inlet respectively to study the effect of the small gas cooler (the drip pan heater) that is placed at the bottom of the evaporator.
29

Figure 20. Schematic layout for the defrosting tests in the climate chamber
When testing at position 1, a thick ice layer covered the evaporator fins shortly after starting the boiler and between two defrosting periods, due to the high moisture content near the heat pump’s evaporator. Therefore, defrosting happens frequently as planned. The photos in Figure 21 and Figure 22 show two examples of the evaporator fins before and after defrosting, with the boiler placed at position 1. It can be noticed from Figure 21 that a thick layer of ice is formed on the evaporator. It may also be noticed that the ice is unevenly distributed on the evaporator surface, which may be due to the influence of the powerful fan placed near the ceiling of the climate chamber. The air flow brings the moisture to the area where the ice is thicker due to the influence of the fan. After the defrosting process, the ice layer will melt completely as shown in Figure 22.
30

Thermocouple 1
Thermocouple 2
Figure 21. Example of evaporator’s fin before defrosting (pos.1)
Figure 22. Example of evaporator’s fin after defrosting (pos 1)
Figure 23 shows data from a test covering several defrosting periods when the boiler is placed at position 1. Due to the high moisture content in the air created by the closely placed water boiler, the defrosting happens very frequently in the pre-test. Several phenomena can be noticed from the figure before the defrosting starts:
31

• The evaporator air outlet temperature will first get closer to the air inlet temperature,
which indicates the ice is blocking up the air flow path through the fins. • The evaporator temperature will drop (as expected) • The heat pump heating capacity will drop (as expected)
During the defrosting period the fan, which takes air through the evaporator fins, will stop running. It can be notice that
• The water pump, which circulating the water between the water tank and the outdoor unit, will stop running.
• The evaporator temperature will increase until it reaches a certain value, when the defrosting stops.
• After the defrosting stops, the ice layer built up on the evaporator will melt completely. • The power used for defrosting is about 1.7 kW for ten minutes.
Similar pattern can be found for all the defrosting periods during the tests. Furthermore, it can also be noticed that the bottom of the evaporator is always free of ice, thanks to the special arrangement of the small gas cooler that is placed at the bottom of the evaporator for anti-frosting purpose. Moreover, the evaporator is composed of two plates of evaporator tubes and fins and it was noticed that the inner plate of evaporator has much less ice built up compared with the outer plate. This may due to the reason that warm air passing the small gas cooler at the bottom of the evaporator flows up by buoyancy forces and warms up the inner plate (Figure 24).
Figure 23. Testing results of frequent defrosting (position 1)
32

Outer plate of the evaporator
Inner plate of the evaporator
Figure 24. Comparison of outer and inner evaporator plates at the same time Figure 25 shows a short time segment from Figure 23, where the testing results from the two thermocouples that are placed at the bottom and the middle of the evaporator are can be seen as well. As shown in the figure the bottom of the evaporator and the drip pan, where the small gas cooler placed, has always a temperature higher than 10 °C.
Frosting-defrosting periods at -2 degreeC Tamb and 3,4 kW heating load 2008-04-14 - detail of first two cycles
25
30
35
40
45
50
55
60
65
70
75
80
85
90
95
100
105
1800 3600 5400 7200 9000
time[s]
CO
2 co
mpr
. out
, CO
2 Ex
p.-v
alve
in,
wat
er g
as c
oole
r in[
°C]
-20
-17,5
-15
-12,5
-10
-7,5
-5
-2,5
0
2,5
5
7,5
10
12,5
15
17,5
20
Teva
p bo
ttom
/mid
, CO
2 co
mpr
. in,
eva
p. a
ir in
/out
[°C
];
CO
P[-]
; flo
w[-
];
water gascooler in
CO2 Exp.-valve in
CO2 compr.Out
evap. air in
evap. air out
CO2 compr.In
normalizedflow[x/0,239]COP
Tevapbottom
Tevap mid
Figure 25. A shorter time segment (zoom-in) from Figure 23
33

Compared with the results obtained with boiler placed at position 1, similar results can be found with boiler placed at position 2 as well. The differences in results for the two different positions are that the defrosting cycle happened less often and the ice layer was more evenly distributed on the evaporator fins with boiler placed at position 2. More testing results and pictures can be found in Appendix 1.
Stage 4. The water tank, as a heat reservoir, connects the heating loads (radiator and hot tap water) and the heat pump unit. The heating demand of the radiator and the hot tap water will directly influence the temperature distribution of the water in the tank and this will indirectly influence the heat pump water inlet temperature (inlet water temperature to the gas cooler). At the same time, the hot water produced by the heat pump unit will be transferred back to the water tank and it will influence the water temperature distribution in the tank as well as the temperature for the outgoing radiator water at the same time. Therefore, the water tank works as a “heat damper” between the load side and the heat pump side. The tank has therefore a crucial influence on the system performance and it is therefore important to study its performance more in detail. In the water tank tests, six T-type thermocouples are placed on the outside of the tank shell (inside the insulation) at even distances from the bottom to the top of the water tank (Figure 26). The tests are mainly focused on the water temperature distribution in the tank.
T1
T2
T3
T4
T5
T6
Figure 26. Position of the thermocouple in the water tank tests
34

At the beginning of the tests, a brief study was made to show how the stratification will develop in a newly filled tank by measuring the water temperature distribution in the tank. Two cases with electric heater at “on-mode” and “off-mode”, respectively, were tested. Before each test, the tank is totally emptied and filled with cold city water. Testing results are shown in Figures 27 and 28 respectively.
tank charging with no electric heater at -2°C - 2008-05-01
10
15
20
25
30
35
40
45
50
55
60
65
70
0 900 1800 2700 3600 4500 5400 6300 7200 8100 9000 9900 10800 11700
time [s]
tem
pera
ture
[°C
]
0
1
2
3
4
5
6
7
8
9
10
11
12
Flow
[m3/
h]; p
ower
[kW
]
T_top
T1
T2
T3
T4
T5
T6
T_rad_supply
water gas coolerinwater gas cooleroutcompr. Power
flow scaled 10 [m3/h]
Figure 27. Heating up of a cold tank with electric heater in “off-mode”
35
tank charging with electric heater at -2°C Tamb - 2008-04-29
10
15
20
25
30
35
40
45
50
55
60
65
70
0 900 1800 2700 3600 4500 5400 6300 7200 8100 9000 9900 10800 11700
time [s]
tem
pera
ture
[°C
]
0
1
2
3
4
5
6
7
8
9
10
11
12
Flow
[m3/
h]; p
ower
[kW
]
T_top
T1
T2
T3
T4
T5
T6
T_rad_supply
water gascooler outwater gascooler incompr. power
Flow scaled10 [m3/h]
el. heater stops
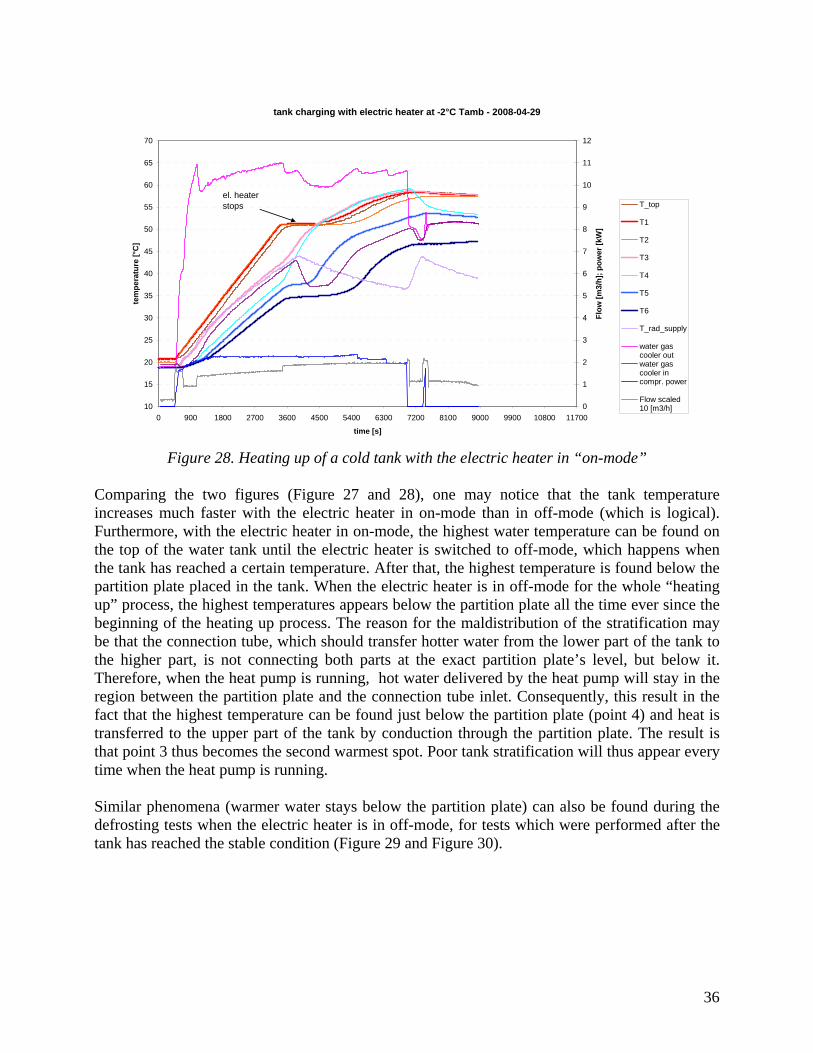
Figure 28. Heating up of a cold tank with the electric heater in “on-mode”
Comparing the two figures (Figure 27 and 28), one may notice that the tank temperature increases much faster with the electric heater in on-mode than in off-mode (which is logical). Furthermore, with the electric heater in on-mode, the highest water temperature can be found on the top of the water tank until the electric heater is switched to off-mode, which happens when the tank has reached a certain temperature. After that, the highest temperature is found below the partition plate placed in the tank. When the electric heater is in off-mode for the whole “heating up” process, the highest temperatures appears below the partition plate all the time ever since the beginning of the heating up process. The reason for the maldistribution of the stratification may be that the connection tube, which should transfer hotter water from the lower part of the tank to the higher part, is not connecting both parts at the exact partition plate’s level, but below it. Therefore, when the heat pump is running, hot water delivered by the heat pump will stay in the region between the partition plate and the connection tube inlet. Consequently, this result in the fact that the highest temperature can be found just below the partition plate (point 4) and heat is transferred to the upper part of the tank by conduction through the partition plate. The result is that point 3 thus becomes the second warmest spot. Poor tank stratification will thus appear every time when the heat pump is running. Similar phenomena (warmer water stays below the partition plate) can also be found during the defrosting tests when the electric heater is in off-mode, for tests which were performed after the tank has reached the stable condition (Figure 29 and Figure 30).
36

transient tank behavior under frosting/defrosting conditions with 3,4kW radiator load at -2°C Tamb- 2008-04-17
20
25
30
35
40
45
50
55
60
65
0 1800 3600 5400 7200 9000 10800 12600 14400
time [s]
Tem
pera
ture
[°C
]
0
1
2
3
4
5
6
7
8
9
heat
ing
capa
city
[kW
], Fl
ow [m
3/h]
T_top
T1
T2
T3
T4
T5
T6
T_rad_supply
water gascooler inT_rad_return
Flow
heat_cap
Figure 29. Tank temperature distributions during defrosting period (electric heater at off-mode,
with radiator load) Tank charging at +0 degreeC Tamb with no radiator load *- 2008-04-07
-10
0
10
20
30
40
50
60
70
0 1800 3600 5400 7200 9000 10800 12600 14400time [s]
tem
pera
ture
[°C
]
0
1
2
3
4
5
6
7
8
norm
aliz
ed fl
ow [-
]; p
ower
[kW
]; C
OP
[-]
water gas coolerin
water gas coolerout
T1
T2
T3
T4
T5
compr. power
COP
Flow normalized[x/0,263m3/h]
*radiator pump was working
Figure 30. Tank temperature distributions during defrosting period (electric heater at off-mode,
no radiator load)
37

DISCUSSION AND CONCLUSION In the current study, A Sanyo made so-called “Swedish Eco-cute” is tested in the laboratory of div of Applied Thermodynamics and Refrigeration, dept. of Energy Technology, Royal Institute of Technology. The heat pump unit is first tested with constant water inlet temperature and outlet temperature based on the testing conditions given by the manufacturer in the manual. The results are similar to the data given by the manufacturer which suggest that the system is working according to the specifications. Furthermore, the testing results showed, as expected, that the heat pump’s heating COP decreases with increasing water inlet temperature and also that it decreases with decreasing outdoor temperature in a manner which agrees with findings from other CO2 heat pump research results [5-6]. The tests of the Eco-cute heat pumps performance also show that the European heat pump testing standard (EN 14511-1) is not suitable for evaluating the performance of CO2 heat pumps. This is mainly due to the fact that the European standard states testing condition with relative high water inlet temperature to the heat pump unit. This is very unfavorable to a CO2 heat pump in general. However, this is typical hydronic heating system conditions in most houses where conventional heat pumps are installed. The CO2 Heat pumps should be installed in houses with (i) a low temperature radiator system with (ii) a large temperature drop. If this is the case the testing standards should be adopted to better compare the CO2 heat pumps with traditional heat pumps. Unless this is done, the performance of CO2 heat pump will always be underestimated even if the building is suited for such a system. The standard should further be modified in order to take into consideration conditions where a combination of tap water heating and radiator heating with low flow rates are considered and where the former is significant. When testing the performance of the CO2 heat pump together with the water tank and radiator load, the CO2 heat pump achieves a lower system COP than conventional heat pumps. The main reason for this is mainly due to the fact that the water tank delivers water to the CO2 heat pump at an unfavorable high temperature. Comparing data for the same temperature difference in the radiator system, but different heating demand, one can notice that the temperature of the return water delivered to the heat pump from the water tank has more crucial influence on system COP than any other parameter. The same is valid if a certain outdoor temperature and heating demand is kept constant. When the heating load is higher than the heat pump capacity (4.7 KW), the “apparent heat pump COP” increases due to the steadily decrease of water temperature in the tank and to the heat pump. This must be compensated for later in the cycle. The defrosting tests show that the starting point for the defrosting mode is controlled by the temperature difference between the evaporator air inlet temperature and evaporator temperature, which can indicate the ice blocking up the air flow path through the fins. Before defrosting, the evaporator temperature and the heat pump heating capacity will drop as well. During the defrosting period, the fan of the evaporator and the water pump, that is pumping water to the heat pump, will both stop running. Hot CO2 is fed to the evaporator to melt the ice via the bypass line, which is controlled by a solenoid valve, until the evaporator reaches a certain
38

temperature, when the defrosting mode stops. After the defrosting process, the ice built up on the evaporator will melt completely. One of the advantages of a CO2 heat pump is the temperature glide in the supercritical region, which fits the water heating process better than cycles with conventional refrigerants (se figure 1). This enables CO2 heat pumps to achieve a high theoretical COP for these specific conditions when producing hot water only. Therefore, if the CO2 heat pump is used mainly for space heating instead of hot tap water heating, the advantage may not be obvious and such applications will not make CO2 heat pumps appear as a future alternative. Thanks to the temperature glide of supercritical CO2, it is possible to arrange tap water production at different temperature levels by better gas cooler layout designs to meet the demand of both warm radiator water and hot tap water. However, to make the CO2 heat pumps more competitive than conventional heat pumps, the ratio between hot tap water demand and warm radiator water demand has become a critical factor. In principle, the higher the ratio between tap water and radiator heating, the better the CO2 heat pump will be. This ratio is at the same time closely linked to the building standards. In old houses, with a less effective climate shell, this ratio will always be much smaller than for modern well insulated houses. Therefore the CO2 heat pump should fit well in modern low energy houses, with a high ratio between hot tap water demand and space heating demand. Any future development should aim in this direction also realizing the fact that the heat pump size (capacity) needs to be much smaller. The gas cooler outlet temperature has a critical influence on the COP of CO2 heat pump. A low gas cooler outlet temperature can greatly reduce the CO2 heat pump’s throttling losses and increase its COP. Therefore, surrounding system must be designed so that the temperature of the CO2 at the gas cooler outlet temperature is as low as possible. This makes the water tank design critical in order to achieve a good stratification in the tank and ensure low temperature water being delivered to the CO2 heat pump. It can be noticed from the test results that the current CO2 heat pump achieved lower COP than typical traditional heat pumps due to the fact that the water being delivered to the heat pump from water tank always has a relative high temperature It has been noticed that when the heat pump is running in a mode without the electric heater, the tank stratification is destroyed every time the heat pump start to deliver hot water to the tank. It is observed that the highest temperature in the tank appears below the partition plate. Based on the test results, several improvements are therefore suggested:
• The inefficient temperature stratification in the water tank is mainly due to the fact that the connection tube (dark blue color in Figure 31) is not exactly connecting two tank parts at the partition plate’s (green color) level, but below it. Consequently, the space between the tube inlet and the partition plate will reserve some of the hot water produced by the heat pump and these results in high water temperatures below the plate.
• Based on the findings mentioned above, it is suggested that the return loop (red line in
Figure 31) from the heat pump should be inserted slightly above the partition plate, instead of below it. After the modification, the hot water produced by the heat pump will
39

be transferred directly to the top part of the water tank and the colder water in the upper part will be pushed down to the lower part, through the other connection tube (light blue).
Figure 31. Schematic layout of tank modification
Furthermore, to solve the problem of high water return temperatures from the water tank to the heat pump, other tank modifications can be suggested (Figure 32). As shown in the figure, one more partition plate is suggested to be positioned in the lower part of the water tank. One connection tube is placed between the two lower parts of the water tank to ensure that the colder water flows to the lowest part of the tank. Furthermore, the control algorithm should be set to keep the heat pump’s compressor running at a low speed for as long time as possible until the return water reaches a certain limit temperature. In such a way, the colder water will be pushed to the lowest part of the water tank before it is transferred to the heat pump. The heat pump will continually work with lower water inlet temperature than before. Moreover, the cold city water inlet coil should be connected to the bottom part of the tank as a heat exchanger. Each time, when the end user uses the tap water, the cold water will further cool down the water inlet temperature to the heat pump as well.
40

Figure 32. Schematic layout of tank modification 1
SUGGESTIONS ON FURTHER WORK Based on the current study, several further activities are suggested: The new tank design should first be simulated with a CFD tool to prove its performance. After confirming a preliminary design with a CFD tool, field testing should be performed with a tank prototype. The current tests were done based on measurements on the secondary side, which is the water side due to the confidential reasons suggested by the manufacturer. To understand better the heat pump performance and to give detailed suggestions on improvements the heat pump performance, pressure measurements on the refrigerant side should be performed.
ACKNOWLEDGEMENT: The work is sponsored by the Swedish National Heat Pump System Research Program Effsys2. The authors would like to thank the Swedish Energy administration and Effsys2 for the support
41
REFERENCES: [1] M.-H. Kim, J. Pettersen, C. W. Bullard ,Fundamental process and system design issues in CO2 vapor compression systems, Progress in Energy and Combustion Science, Volume 30, Issue 2, 2004, Pages 119-174 [2] Köster, Stephan: Auslegung, Konstruktion und experimentelle Untersuchung einer Hochtemperatur-Heizungswärmepumpenanlage mit dem natürlichen Kältemittel Kohlendioxid, Fortschritt-Berichte VDI Reihe 19, VDI Verlag Düsseldorf, 2005 [3] http://www.sanyo.com.pl/co2.pdf (2008) [4] J. Stene, Residential CO2 heat pump system for combined space heating and hot water heating, International Journal of Refrigeration, Volume 28, Issue 8, December 2005, Pages 1259-1265 [5] R. Yokoyama, T. Shimizu, K. I., K. Takemura , Influence of ambient temperatures on performance of a CO2 heat pump water heating system, Energy, Volume 32, Issue 4, April 2007, Pages 388-398 [6] M. R. Richter, S. M. Song, J. M. Yin, M. H. Kim, C. W. Bullard, P. S. Hrnjak Experimental results of transcritical CO2 heat pump for residential application, Energy, Volume 28, Issue 10, August 2003, Pages 1005-1019 [7] N. Agrawal, S. Bhattacharyya, Optimized transcritical CO2 heat pumps: Performance comparison of capillary tubes against expansion valves, International Journal of Refrigeration, Volume 31, Issue 3, May 2008, Pages 388-395
42

APPENDIX 1
1
1,5
2
2,5
3
3,5
4
4,5
15 20 25 30 35 40 45
Water inflow temperature [°C]
CO
P 1
Figure 33 . Pretest results at 5°C outdoor temperature
1
1,5
2
2,5
3
3,5
15 20 25 30 35 40 45 50
Water inflow temperature [°C]
CO
P 1
Figure 34. Pretest results at 0°C outdoor temperature
43

1
1,5
2
2,5
3
3,5
15 20 25 30 35 40
Water inflow temperature [°C]
CO
P 1
Figure 35. Pretest results at -5 °C outdoor temperature
1
1,5
2
2,5
3
3,5
15 25 35 45 55
Water inlet temperature [°C]
CO
P 1
Figure 36. Pretest results at - 10 °C outdoor temperature
44

-24-22-20-18-16-14-12-10
-8-6-4-202468
101214161820222426
10:32 10:43 10:55 11:06 11:18 11:29 11:41 11:52 12:04 12:15 12:27 12:38 12:50 13:01 13:13 13:24
time
tem
pera
ture
[°C
]; he
atin
g ca
paci
ty [k
W]
-3,5-3,25-3-2,75-2,5-2,25-2-1,75-1,5-1,25-1-0,75-0,5-0,2500,250,50,7511,251,51,7522,252,52,75
CO
P [-]
; pow
er [k
W];
flow
[m3/
h]
SecC_inSecC_outRComp_inheat. CapacityTevap_midTevap_bottomCompFlow m3/hCOP
11:42: water starts boiling
11:16: no ice
11:27: first ice signs 12:02: complete
water mass flow marks defrosting
evaporator ice free, water drops on fins
Figure 37. Defrosting test at -6°C at position 1
-16
-14
-12
-10
-8
-6
-4
-2
0
2
4
6
8
10
12
15:10:00 15:38:48 16:07:36 16:36:24 17:05:12 17:34:00 18:02:48 18:31:36
time [hh:mm:ss]
tem
pera
ture
[°C
]; he
at. c
apac
ity [k
W]
-4
-3.5
-3
-2.5
-2
-1.5
-1
-0.5
0
0.5
1
1.5
2
2.5
3
CO
P [-]
; flo
w [m
3/h]
; pow
er [k
W]
evap. air in
evap. air out
CO2 compr.in
heat.Capacity
compr.power
COP
water flow
Figure 38. Defrosting test at 2°C at position 2
45

Figure 39. Ice layer built up on evaporator fin with boiler placed at position 2
46