
EFFIROB - ECHORD
30
© Fraunhofer IPA, Fraunhofer ISI EFFIROB Profitability analysis of new service robotic applications and their means for robotic development ECHORD Workshop – IROS 2011 Kai Pfeiffer Fraunhofer IPA, Stuttgart, Germany San Francisco, 30 th September 2011
Transcript of EFFIROB - ECHORD

© Fraunhofer IPA, Fraunhofer ISI
EFFIROBProfitability analysis of new service robotic applications and their means for robotic development
ECHORD Workshop – IROS 2011
Kai PfeifferFraunhofer IPA, Stuttgart, Germany
San Francisco, 30th September 2011
2
Outline
• Motivation• Objectives• Approach• Target markets and scenarios
Introduction
• Systems Engineering (AD)• Software Cost Estimation• Life-Cycle-Costing LCC• Market Structure Analysis
Methods
• Scenario Descriptions• ExampleScenarios
• Economics, Market Potencial• Safety• Key Components
Conclusion
Introduction Methods Scenarios Conclusion

3
Motivation
German Ministry for Education and Research (BMBF) spend over 50 Mio. € for robotics research in the past years.
Identification of industrial application scenarios for service robotics which are:
Already economically feasible motivate industrial cooperation
Close to feasibility fund projects to overcome borders
Not feasible identify blocking points and fund basic research
Identification of key components and common parts in service robotic
Introduction Methods Scenarios Conclusion

4
Starting point Objectives
Supplier view
End-user view
• Show concrete scenarios of newservice robot applications
• Evaluate target markets• Utility value and size of markets• Cost-benefit ratio• Identify dependencies
(„If-Then“-correlations)regarding design parameters
• Justify R&D demands• New business models• Exemplary calculations
• Grown robotic market• Technology driven• Various product ideas, little
economic applications• Module-, platform concepts
not wide spread• Utility value not clear for
end-user• Only few suppliers• High growing potential• Good R&D infrastructure
Technology Push Application Pull
Objectives of the Study
Introduction Methods Scenarios Conclusion

5
Structural analysis in 7 target markets
Preparation of 11 scenarios
Determination of LCC-values
Analysis of utility value
Feedback talks with «Stakeholders»: Robot applications and markets
Cost-Benefit-Alternatives and Optimizations• „Economies of Scale“• Function – utility value scaling• Cost-benefit optimization strategies
• Business and operator models• Nonmonetary utility values• Sensitivity analysis
Needs and Implications• R&D reg. technologies, components
to increase cost-benefit-ratio• Norms and regulations
• Division of labor, cooperationbetween suppliers and end-users
• Business models
Final discussion forum, Documentation, Tools, etc.
Supplier view End-user view
Overview: Approach and Methods
Introduction Methods Scenarios Conclusion

6
Scenario Development
Product ideas Existing product ideas New product ideas
Preliminary idea evaluation
viable partly viable
not viable• Lot size• Feasibility• Supplier industry
• Profitability• Demand, benefit• Culture
Developmentof scenario solution
Scenario fact sheet Brief description of sector
Scenario requirements
System concept
Production costs,unit cost elasticities
Economic characteristics
Installation & operational costsQuality & performance comparisons
Technical characteristics
Estimation of economic characteristics
• LCC• Economies of Scale• Sensitivity analyses
• Market structure• Exploitation of market potential• Demand, benefit
Introduction Methods Scenarios Conclusion

7
Target markets and applications
Target market Application
Agriculture Ground-crop harvestingDairy cattle farming
Energy and water supply Grounds maintenance
Sewer inspection
Logistics Container transport in hospitals
Manufacturing Production assistance
Facility management Floor cleaningFacade cleaning
Construction industry Interior fittings assistance
Residential and nursing homes Provisioning of care utensilsLifting and moving of persons
Introduction Methods Scenarios Conclusion

8
Axiomatic Design
Functional domain(“what”)
manual scenario
Physical domain(“how”)
automated scenario
Process domainCustomer domain(„what“)
application
Axiom 1: Decoupling of functional requirements (from user’s perspective) Decomposition und modularization FRiDPi
Axiom 2: Minimization of information content of the designEstimation of functional performance by proposed solution
Functionalrequirements
(FRs)
Designparameters
(DPs)
Processvariables
(PVs)
Customer needs
Domains and rules
Introduction Methods Scenarios Conclusion
9
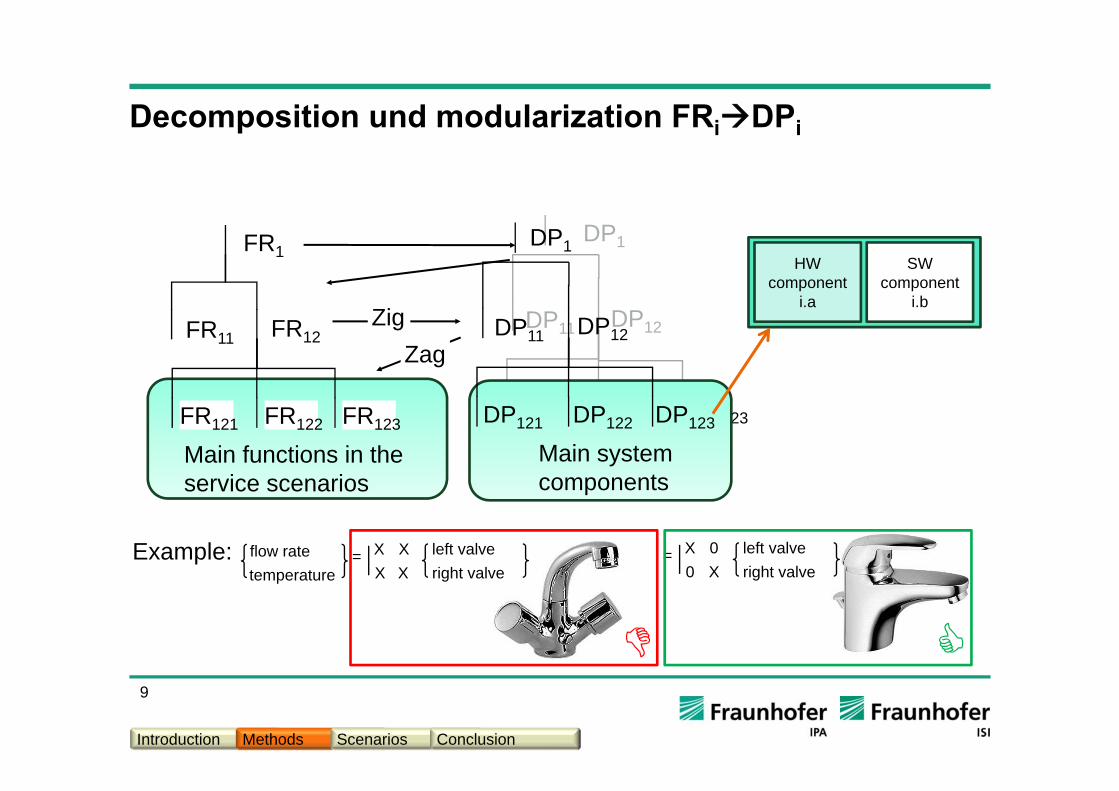
Decomposition und modularization FRiDPi
DP1
DP11 DP12
DP121 DP122 DP123
FR1
FR11 FR12
FR121 FR122 FR123
DP1
DP11 DP12
DP121 DP122 DP123
Zag
Main functions in the service scenarios
Main system components
HW component
i.a
SW component
i.b
flow ratetemperature
XXXX
= left valveright valve
Example:
0XX0
= left valveright valve
Zig
Introduction Methods Scenarios Conclusion

10
Component catalog hardware (Example: Sensors)
Introduction Methods Scenarios Conclusion

11
„Component catalog“ of SR software
Proxy-based estimation using ROS stack list
FUNCTIONS
interactive internal function points
ROS stack Nav
igat
ion
Man
ipul
atio
n
Perc
eptio
n
Com
mun
icat
ion
Mod
elin
g
Plan
ning
Lear
ning
Dev
elop
men
t
arm_navigation x x 69arm_planning_control x x 24articulation x x x x 247camera_drivers x x 134camera_umd x x 37collision_environment x x 71common x x x x x x x x 310common_msgs x x x x x 38communication x 12
…
ROS (Robot Operating System by Willow Garage) components used as reference
57 software stacks included in catalog
Function points: Quantitative measure of the functional extent of a software component
Function point counts in catalog were established by code analysis and „backfiring“.
Introduction Methods Scenarios Conclusion

12
Cost estimation for software development
60% reuse, 40% proprietary
development CSW = 0,06*CPM*∑FP
100% proprietary development
CSW = 0,167*CPM*∑FP
Introduction Methods Scenarios Conclusion

13
Profitability analysis
determines exploitation of market potential
determines market potential
1. Life Cycle Costing
2. Market structure analysis
3. Market potential
8(2%)
234(66%)
72(20%)
42(12%)
Landwirtschaft
Investitions -volumen
Ökonomische Situation
Innovations -verhalten
Anzahl Unternehmen
Markt -strukturdaten
Größenstruktur Unternehmen
Energie &Wasser
Industrie
Baugewerbe
Reinigung &Facility Management
Gesundheit &Pflege
15-85%
-75%
-60%
RealistischerAnteil für
SR
MaximalerAnteil für
SR100
TechnischeAusrüstun
g400
GesamtInvestitione
n1.000
SR Scenarios
define the use case define the market
2. Market structure analysis
Introduction Methods Scenarios Conclusion

14
Invest-ment
Operation and Maintenance
Recycling/Disposal
„Trade-Off“
Why LCC-Analysis?
PROBLEM
Classical multi periodic decision making instrument
Bigger part of decision relevant costs incur after buy
Cash flow and life cycle orientated consideration
BASIS FOR DECISION
Absolute amount of LCC
Amortization time
Discounted Cash flow
Cost per activity unittime
Life
cyc
le c
osts
Introduction Methods Scenarios Conclusion

15
Scenario Ground-crop Harvester: Manual Solution
12 meter wide harvesting beam 12 harvesters 12 classifiers 3 packers 1 group leader
Introduction Methods Scenarios Conclusion

16
Scenario Ground-crop Harvester: SR concept
12
3
4
5
6
1 Packing unit2 Robot on linear axis3 Robot arm4 Sensor for object detection5 Gripper (fruit safe)6 Cutting unit
Introduction Methods Scenarios Conclusion

17
Floor cleaningGround-crop Harvester
Example:Szenario-Comparison
196(6%)
2.462(73%)
16(0%)
703(21%)
LCC-Sum(TEUR)
Cost rate(EUR/#)
DCF(TEUR)
Amortization(years)
3.376,9(5.040,0)
0,04(0,04)
-2.763,7(-3.821,1)
<<3
5.040(100%)
SR (manual)
Robust result Interesting in case of loan increase Complete use of market potential expected
4(2%)
94(40%)
61(26%)
77(33%)
LCC-Summe (TEUR)
Cost rate(EUR/#)
DCF(TEUR)
Amortization(years)
234,9(220,4)
21,51(15,13)
-193,0(-153,6)
entfällt
219(99%)
SR
Even cheapest SR variant more expensive Potential just by reduction of investment (>50%)
and better use of capacity Low market potential
(manual)
InvestmentInstallation costsActivity costsMainenance, Service costs
Introduction Methods Scenarios Conclusion

18
Example:Economics Analysis ResultFigures SR-Version A SR-Version B Manual Version
Basic Data Use Case
Life time (a) 5 5 5
Number of Robots (System) 6 6 -
Eff. Productive time (h/a) 3.600 3.600 4.560
Personell time (h/a) 14.400 14.400 134.400
Activity units (Mio AU/a) 18,1 18,1 23,0
LCC-Sum (T€) 3.378,5 100,0% 2.871,6 100,0% 5.040,0 100,0%
Investment (T€) 704,1 20,8% 297,2 10,3% - -
Installation costs (T€) 16,0 0,5% 16,0 0,6% - -
Activity costs(T€) 2.462,4 72,9% 2.464,1 85,8% 5.040,0 100,0%
Maintenance (T€) 196,0 5,8% 94,3 3,3% - -
Other - - - - -
DCF (@10%, T€) -2.735,6 -2.253,9 -3.821,1
Software costs (T€) 903,1 2.994,9 -
Activity unit costs (€/LE) 0,04 0,03 0,04
Introduction Methods Scenarios Conclusion

19
Scenario-Management:
Scenario selection from database
1
LCC-Definition: Main menu
2
LCC-Definition: Dialog
Input
Estimation of parameters
3
SR-LCC Tool –Screenshots
Introduction Methods Scenarios Conclusion

20
Market structure analysis
Investment Behavior
Investment volume
Number of enterprises
Size structure of enterprises
Economic situation
Innovation behavior
Agriculture
Energy & Water
Manufacturing
Construction
Facility Management
Health Care
Logistics
Introduction Methods Scenarios Conclusion

21
Part market
Whole market
Target marketof application
1. Identify basic population(Top-Down)
2. Estimate total investment(Bottom-Up)
3. Estimate maximum market potential(Top-Down)
4. Estimate realistic exploitation of market potential
Estimation of market potential
Bot
tom
-Up
15Realisticcontingent for SR
-85%
-75%
-60%1.000
Maximumcontingent for SR 100
Technicalequipment 400
Totalinvestment
Identify basic populationBusinesses
Estimation of funds available for SR TEUR p.a.
Introduction Methods Scenarios Conclusion

22
4.314
4.3140%
-75%
-58%
17.256
41.085Horticulture
Agriculture
Target market
Estimation of market potentialExample: Ground-crop harvester
Bot
tom
-Up
Farms 374.514thereof horticulture 12.153thereof vegetables 2.021thereof in target market(main business, > 30 ha) 316
Market potential for SRSales p.a.(@ T€ 704,1 / 310,2 per system with 6 SR) 36 / 84Expected Installed Base(@ 5 years life span) 180 / 420
Introduction Methods Scenarios Conclusion
Identify basic populationBusinesses
Estimation of funds available for SR TEUR p.a.
Realisticcontingent for SR
Maximumcontingent for SR
Technicalequipment
Totalinvestment

23
Service Robot Scenarios
Scenario
EstimatesSW-costs/Scenario
[M€]
Economic feasibility Estimated market potential in SR p.a. for Germany
Based on LCC
Relevance of qualitative
factors
Calculated maximum Realistic exploit
Grounds maintenance 1,5 (no) high 391 39Provisioning of care utensils 6,8 (no) high 5 - 10 2 - 5Lifting and moving of persons 5,0 no high 6 0Ground-crop harvesting 0,9 high low 36 - 84 36 - 84Floor cleaning 14,0 no low 25 - 44 0Container transport in hospitals 3,3 high high 40 - 60 40 - 60
Facade cleaning 4,2 no none 3 0Interior fittings assistance 4,3 high high 5 - 6 5 – 6Sewer inspection 0,3 high high 30 - 59 30 – 59Dairy cattle farming 4,4 high high 62 62Production assistance 4,4 high low 903 - 1 344 903 - 1 344
Introduction Methods Scenarios Conclusion
24
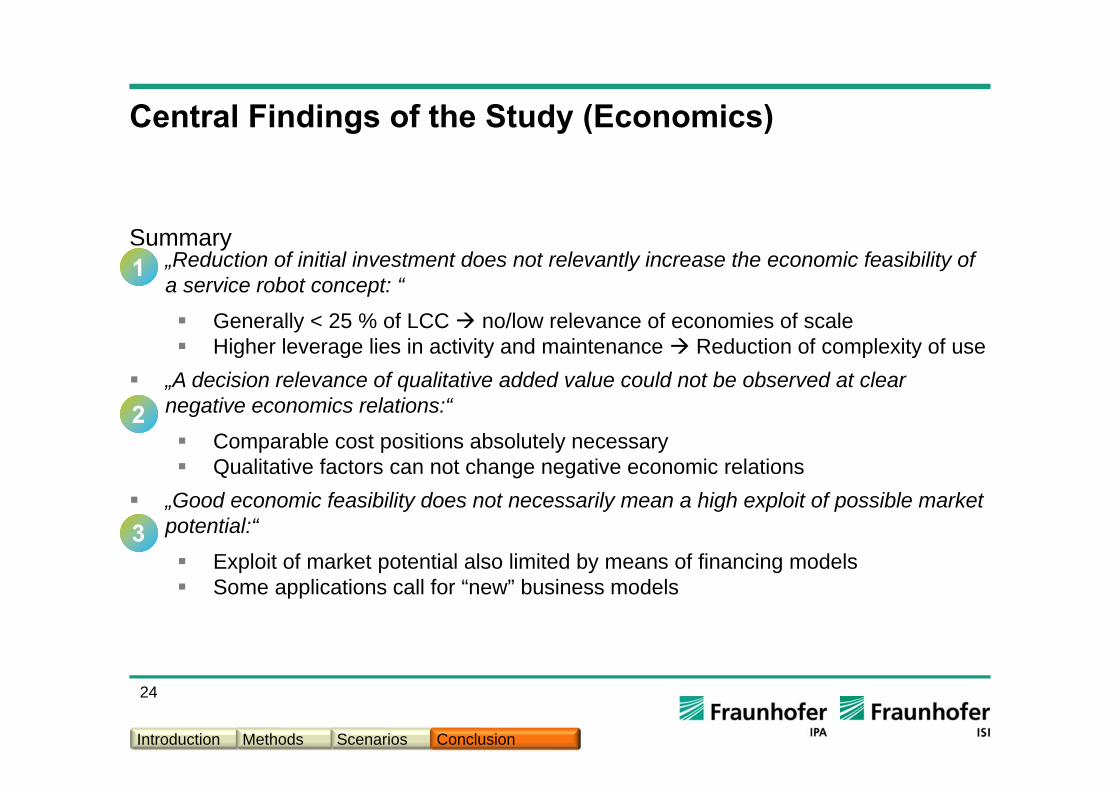
Central Findings of the Study (Economics)
Summary „Reduction of initial investment does not relevantly increase the economic feasibility of
a service robot concept: “
Generally < 25 % of LCC no/low relevance of economies of scale Higher leverage lies in activity and maintenance Reduction of complexity of use
„A decision relevance of qualitative added value could not be observed at clear negative economics relations:“
Comparable cost positions absolutely necessary Qualitative factors can not change negative economic relations
„Good economic feasibility does not necessarily mean a high exploit of possible market potential:“
Exploit of market potential also limited by means of financing models Some applications call for “new” business models
1
2
3
Introduction Methods Scenarios Conclusion

25
Critical Claim of the Approach (economics)
ADVANTAGES
Holistic and dynamic examination of economic feasibility
Mixed estimation of market potential
Bottom-Up estimation of potential for investment
Top-Down for narrowing down available volume(consideration of market structures and economics)
DISADVANTAGES
Findings not always reflect real behavior of deciders („Investment cost are after all relevant “)
LCC considerations quite dependent on concrete scenario
+
+
-
-
Introduction Methods Scenarios Conclusion

26
Safety
Safety criteria:• Spatial separation of machine and human• Avoid shearing and crushing zones• Safe navigation• Safe manipulation• Safe handling of big/heavy objects• Protection against misuse• Assurance of stability
Under assessment criteria:• Easy to solve• Solvable• Solvable under limitations
Under consideration of:• Actual and draft ISO Norms• EU 2006 / 42 / EG
• Scenarios can be designed “safe”• Expert knowledge partially necessary• Sporadically demand for components
Introduction Methods Scenarios Conclusion

27
Evaluation of used Components and Technologies
Stable base of components (at least as prototypes); Effects of former research projects are noticeable. Demands: High resolution 3D sensors, safety sensors, arm modules with higher payload, flexible grippers…Safety-related design of service robots based on existing/planed ISO-norms complex but possible
4
5
6 Extensive SW-costs:
Re-use, plan ability of SW-components: SW-Paradigms (e.g. component based
development, model driven engineering, …)
Repositories for re-usable SW-components
Standards , guidelines for development and componentintegration
Methods for software cost estimation (public) available methods, SW-Controlling know-how
Introduction Methods Scenarios Conclusion

28
Findings (technically)
Perception central and most important basic technology in commercial service robotics. It is connected with other technologies.
Robustness of key technologie navigation suppliers and end-users consider this a central demand (high discrepancy between the rating of the level of maturity of robotic community and suppliers/end-users).
Key functionality robust grasping of spectrums of work pieces and every day objects
Efficient and safe human-robot-interaction improves user acceptance and efficiency
Shared Autonomy.
7
8
9
10
Introduction Methods Scenarios Conclusion

29
Possible Impact on Academia-Industry Collaboration
Academia: Tool to convince industry about economic feasibility of SR solutions
Industry: Tool to estimate costs for a SR development
Consortia: Methodology to state expected exploitation
Reviewers: Comparability of stated exploitations
1
2
3
4
Introduction Methods Scenarios Conclusion

30
Interaktiv Document with Software
• Download Study EFFIROB(ZIP, 30MB, 6MB)
• Download LCC-Tool (Excel) Download manualLCC-Tool (pdf)
http://www.ipa.fraunhofer.de/studien
English printed version planed for
January 2011


