Efficient Estimation of Binding Free Energies between Peptides and an MHC Class II...
13
Efficient Estimation of Binding Free Energies between Peptides and an MHC Class II Molecule Using Coarse- Grained Molecular Dynamics Simulations with a Weighted Histogram Analysis Method Ming Huang, Wenjun Huang , Fei Wen, and Ronald G. Larson* We estimate the binding free energy between peptides and an MHC class II molecule using molecular dynamics (MD) simu- lations with the weighted histogram analysis method (WHAM). We show that, owing to its more thorough sampling in the available computational time, the binding free energy obtained by pulling the whole peptide using a coarse-grained (CG) force field (MARTINI) is less prone to significant error induced by inadequate-sampling than using an atomistic force field (AMBER). We further demonstrate that using CG MD to pull 3–4 residue peptide segments while leaving the remaining peptide segments in the binding groove and adding up the binding free energies of all peptide segments gives robust binding free energy estimations, which are in good agreement with the experimentally measured binding affinities for the peptide sequences studied. Our approach thus provides a promising and computationally efficient way to rapidly and reliably estimate the binding free energy between an arbitrary peptide and an MHC class II molecule. V C 2017 Wiley Periodicals, Inc. DOI: 10.1002/jcc.24845 Introduction The major histocompatibility complex (MHC) plays an impor- tant role in human adaptive immune responses by binding to antigen-derived peptide fragments and presenting them for T- cell recognition. [1] Due to the variations in the mechanisms mediating antigen processing and presentation, [2–4] stable binding to the restricting MHC protein is the most selective requisite for T-cell recognition of a peptide. Therefore, identify- ing MHC-binding peptides is a crucial step in studying T-cell immune responses as well as designing effective vaccines and therapeutics. [5,6] There are two classes of MHC molecules involved in T-cell antigen presentation—class I and class II. An MHC class I molecule contains a peptide binding groove with closed ends that can only accommodate peptides with 8–10 residues in length. [7] An MHC class II molecule, on the other hand, contains a peptide binding groove that is open on both ends (Fig. 1a), allowing the binding of a peptide with 12 to 25 residues. [8] The peptide binding groove of an MHC molecule contains multiple binding pockets that allow strong interac- tions with certain residues, which are termed anchor residues. The flexibility in the length and registry of binding peptides to MHC class II molecules makes their computational identifica- tion more challenging than that for MHC class I molecules. This study focuses on the estimation of binding free energy between peptides and an MHC class II molecule using molecu- lar dynamics simulation technique. Molecular dynamics (MD) simulation has been successfully applied to model the interactions between peptides and pro- tein molecules. Atomistic MD simulation models all atoms on the amino acid residues explicitly, and offers molecular level insights into peptide–protein binding that are not accessible through conventional experimental efforts. Atomistic MD simu- lations have been adopted to identify the binding pockets and conformational changes of the binding groove on binding of the peptide to both MHC class I and II molecules. [9–11] How- ever, due to the size of the MHC molecule (8 nm in diame- ter), atomistic MD simulations only access short time scales (<100 ns) within reasonable computational time. Coarse- grained (CG) models, on the other hand, combine a few atoms into one single CG bead, and therefore reduce the degrees of freedom of the system significantly, allowing affordable access to microsecond timescales. Several systematically parameter- ized CG models are available in the literature. In particular, Marrink and coworkers developed the MARTINI force field for lipids and surfactants, [12] and Monticelli et al. extended this force field to peptides and proteins. [13] To date, the MARTINI force field has been applied to characterize the properties of lipid membranes and lipid polymorphism, and the interplay between proteins and lipids, such as the interaction between ATP synthase and inner mitochondrial membrane cristae, as well as the self-assembly of soluble peptides and proteins. [14] The weighted histogram analysis method (WHAM) [15] is often used to estimate the binding free energy between two molecules. WHAM is a statistical analysis technique that com- bines conformation distributions gathered from multiple biased umbrella sampling simulations along a chosen reaction coordinate between two states of interest and computes the M. Huang, W. Huang, F. Wen, R. G. Larson Department of Chemical Engineering, University of Michigan, Ann Arbor, Michigan, 48109-2136 E-mail: [email protected] Contract grant sponsor: University of Michigan MCube V C 2017 Wiley Periodicals, Inc. Journal of Computational Chemistry 2017, 38, 2007–2019 2007 FULL PAPER WWW.C-CHEM.ORG
Transcript of Efficient Estimation of Binding Free Energies between Peptides and an MHC Class II...

Efficient Estimation of Binding Free Energies betweenPeptides and an MHC Class II Molecule Using Coarse-Grained Molecular Dynamics Simulations with a WeightedHistogram Analysis Method
Ming Huang, Wenjun Huang , Fei Wen, and Ronald G. Larson*
We estimate the binding free energy between peptides and
an MHC class II molecule using molecular dynamics (MD) simu-
lations with the weighted histogram analysis method (WHAM).
We show that, owing to its more thorough sampling in the
available computational time, the binding free energy obtained
by pulling the whole peptide using a coarse-grained (CG) force
field (MARTINI) is less prone to significant error induced by
inadequate-sampling than using an atomistic force field
(AMBER). We further demonstrate that using CG MD to pull 3–4
residue peptide segments while leaving the remaining peptide
segments in the binding groove and adding up the binding free
energies of all peptide segments gives robust binding free
energy estimations, which are in good agreement with the
experimentally measured binding affinities for the peptide
sequences studied. Our approach thus provides a promising and
computationally efficient way to rapidly and reliably estimate
the binding free energy between an arbitrary peptide and an
MHC class II molecule. VC 2017 Wiley Periodicals, Inc.
DOI: 10.1002/jcc.24845
Introduction
The major histocompatibility complex (MHC) plays an impor-
tant role in human adaptive immune responses by binding to
antigen-derived peptide fragments and presenting them for T-
cell recognition.[1] Due to the variations in the mechanisms
mediating antigen processing and presentation,[2–4] stable
binding to the restricting MHC protein is the most selective
requisite for T-cell recognition of a peptide. Therefore, identify-
ing MHC-binding peptides is a crucial step in studying T-cell
immune responses as well as designing effective vaccines and
therapeutics.[5,6] There are two classes of MHC molecules
involved in T-cell antigen presentation—class I and class II. An
MHC class I molecule contains a peptide binding groove with
closed ends that can only accommodate peptides with 8–10
residues in length.[7] An MHC class II molecule, on the other
hand, contains a peptide binding groove that is open on both
ends (Fig. 1a), allowing the binding of a peptide with 12 to 25
residues.[8] The peptide binding groove of an MHC molecule
contains multiple binding pockets that allow strong interac-
tions with certain residues, which are termed anchor residues.
The flexibility in the length and registry of binding peptides to
MHC class II molecules makes their computational identifica-
tion more challenging than that for MHC class I molecules.
This study focuses on the estimation of binding free energy
between peptides and an MHC class II molecule using molecu-
lar dynamics simulation technique.
Molecular dynamics (MD) simulation has been successfully
applied to model the interactions between peptides and pro-
tein molecules. Atomistic MD simulation models all atoms on
the amino acid residues explicitly, and offers molecular level
insights into peptide–protein binding that are not accessible
through conventional experimental efforts. Atomistic MD simu-
lations have been adopted to identify the binding pockets and
conformational changes of the binding groove on binding of
the peptide to both MHC class I and II molecules.[9–11] How-
ever, due to the size of the MHC molecule (�8 nm in diame-
ter), atomistic MD simulations only access short time scales
(<100 ns) within reasonable computational time. Coarse-
grained (CG) models, on the other hand, combine a few atoms
into one single CG bead, and therefore reduce the degrees of
freedom of the system significantly, allowing affordable access
to microsecond timescales. Several systematically parameter-
ized CG models are available in the literature. In particular,
Marrink and coworkers developed the MARTINI force field for
lipids and surfactants,[12] and Monticelli et al. extended this
force field to peptides and proteins.[13] To date, the MARTINI
force field has been applied to characterize the properties of
lipid membranes and lipid polymorphism, and the interplay
between proteins and lipids, such as the interaction between
ATP synthase and inner mitochondrial membrane cristae, as
well as the self-assembly of soluble peptides and proteins.[14]
The weighted histogram analysis method (WHAM)[15] is
often used to estimate the binding free energy between two
molecules. WHAM is a statistical analysis technique that com-
bines conformation distributions gathered from multiple
biased umbrella sampling simulations along a chosen reaction
coordinate between two states of interest and computes the
M. Huang, W. Huang, F. Wen, R. G. Larson
Department of Chemical Engineering, University of Michigan, Ann Arbor,
Michigan, 48109-2136
E-mail: [email protected]
Contract grant sponsor: University of Michigan MCube
VC 2017 Wiley Periodicals, Inc.
Journal of Computational Chemistry 2017, 38, 2007–2019 2007
FULL PAPERWWW.C-CHEM.ORG
potential of mean force (PMF) as a function of distance along
this reaction coordinate based on the distribution of confor-
mations.[16] Several studies have used WHAM to compute the
binding free energy between peptides and an MHC class I
molecule. For example, Olaposi et al. applied WHAM with
atomistic force field to estimate the binding free energy
between a nine-residue peptide (sequence: SLYNTVATL) and
HLA-A2 (PDB ID: 2V2W). They obtained a binding free energy
of 12 kJ/mol between the peptide and the MHC class I mole-
cule, which deviates considerably from the 32.2 kJ/mol binding
free energy obtained from experiments.[17] On the other hand,
May et al. applied WHAM with MARTINI CG force field to esti-
mate the binding free energy between the peptide-MHC-Class-
I molecule and the T cell receptor (TCR) (PDB ID: 1AO7) and
obtained a binding free energy of 80 kJ/mol, which compares
well to the value of 78.6 kJ/mol obtained from experiments.[18]
To our knowledge, however, there is no reported study that
has accurately estimated the binding free energy between a
peptide and a MHC class II molecule. Zhang et al. have
adopted molecular mechanics Poisson–Boltzmann surface area
(MM-PBSA) along with atomistic MD simulations to estimate
the binding free energy contribution from each individual resi-
due on the bound peptide, and summed up these contribu-
tions to get an estimated total binding free energy between
each peptide and an MHC class II molecule. However, the esti-
mated binding free energies did not agree well with experi-
mental results.[19] Therefore, we wish to develop a reliable
protocol for using WHAM and MD simulation to predict accu-
rately the binding free energy between peptides and an MHC
class II molecule.
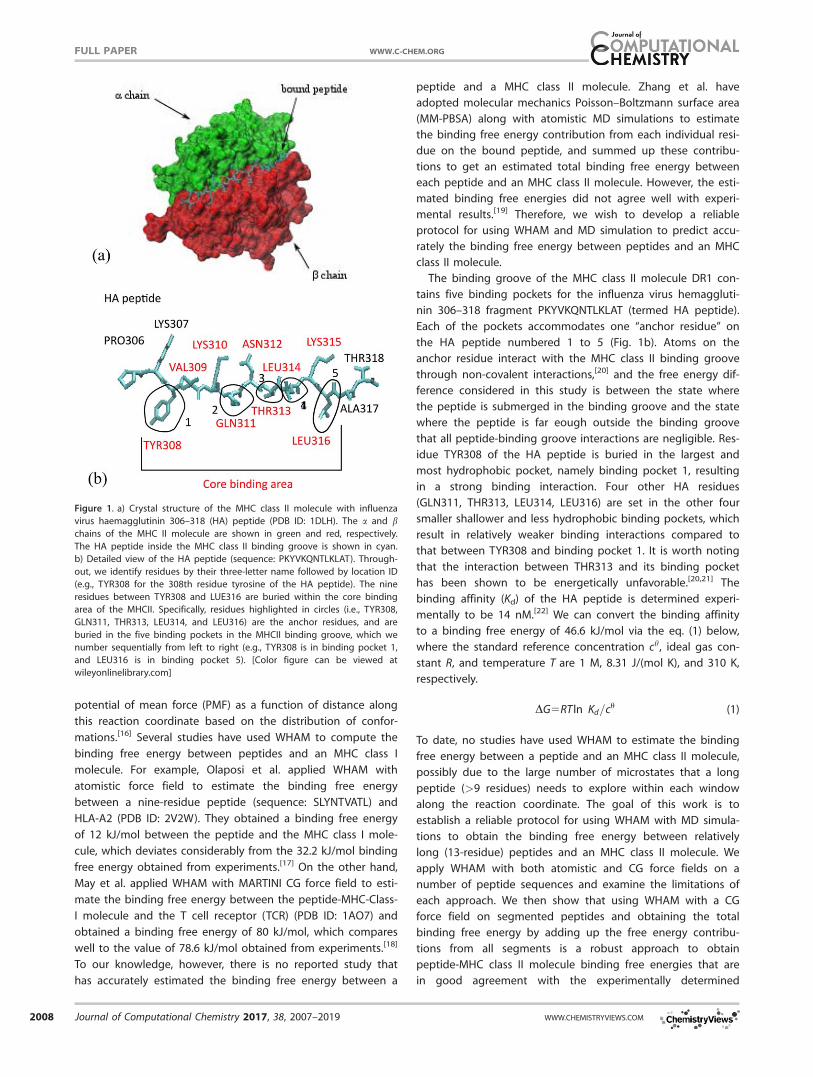
The binding groove of the MHC class II molecule DR1 con-
tains five binding pockets for the influenza virus hemaggluti-
nin 306–318 fragment PKYVKQNTLKLAT (termed HA peptide).
Each of the pockets accommodates one “anchor residue” on
the HA peptide numbered 1 to 5 (Fig. 1b). Atoms on the
anchor residue interact with the MHC class II binding groove
through non-covalent interactions,[20] and the free energy dif-
ference considered in this study is between the state where
the peptide is submerged in the binding groove and the state
where the peptide is far eough outside the binding groove
that all peptide-binding groove interactions are negligible. Res-
idue TYR308 of the HA peptide is buried in the largest and
most hydrophobic pocket, namely binding pocket 1, resulting
in a strong binding interaction. Four other HA residues
(GLN311, THR313, LEU314, LEU316) are set in the other four
smaller shallower and less hydrophobic binding pockets, which
result in relatively weaker binding interactions compared to
that between TYR308 and binding pocket 1. It is worth noting
that the interaction between THR313 and its binding pocket
has been shown to be energetically unfavorable.[20,21] The
binding affinity (Kd) of the HA peptide is determined experi-
mentally to be 14 nM.[22] We can convert the binding affinity
to a binding free energy of 46.6 kJ/mol via the eq. (1) below,
where the standard reference concentration ch, ideal gas con-
stant R, and temperature T are 1 M, 8.31 J/(mol K), and 310 K,
respectively.
DG5RT ln Kd=cu� �
(1)
To date, no studies have used WHAM to estimate the binding
free energy between a peptide and an MHC class II molecule,
possibly due to the large number of microstates that a long
peptide (>9 residues) needs to explore within each window
along the reaction coordinate. The goal of this work is to
establish a reliable protocol for using WHAM with MD simula-
tions to obtain the binding free energy between relatively
long (13-residue) peptides and an MHC class II molecule. We
apply WHAM with both atomistic and CG force fields on a
number of peptide sequences and examine the limitations of
each approach. We then show that using WHAM with a CG
force field on segmented peptides and obtaining the total
binding free energy by adding up the free energy contribu-
tions from all segments is a robust approach to obtain
peptide-MHC class II molecule binding free energies that are
in good agreement with the experimentally determined
Figure 1. a) Crystal structure of the MHC class II molecule with influenza
virus haemagglutinin 306–318 (HA) peptide (PDB ID: 1DLH). The a and bchains of the MHC II molecule are shown in green and red, respectively.
The HA peptide inside the MHC class II binding groove is shown in cyan.
b) Detailed view of the HA peptide (sequence: PKYVKQNTLKLAT). Through-
out, we identify residues by their three-letter name followed by location ID
(e.g., TYR308 for the 308th residue tyrosine of the HA peptide). The nine
residues between TYR308 and LUE316 are buried within the core binding
area of the MHCII. Specifically, residues highlighted in circles (i.e., TYR308,
GLN311, THR313, LEU314, and LEU316) are the anchor residues, and are
buried in the five binding pockets in the MHCII binding groove, which we
number sequentially from left to right (e.g., TYR308 is in binding pocket 1,
and LEU316 is in binding pocket 5). [Color figure can be viewed at
wileyonlinelibrary.com]
FULL PAPER WWW.C-CHEM.ORG
2008 Journal of Computational Chemistry 2017, 38, 2007–2019 WWW.CHEMISTRYVIEWS.COM
binding affinities. For simplicity, we will hereafter refer to the
MHC class II molecule DR1 as “MHCII,” and the binding free
energy between the peptide and the MHCII as the “binding
free energy,” unless specified otherwise.
Methods
Peptide models
The crystal structure of HA-MHCII complex used in this study
(HA: PKYVKQNTLKLAT, PDB ID: 1DLH) is obtained from the Pro-
tein Data Bank (www.rcsb.org). We generate five additional
peptide sequences via the residue mutation utility imple-
mented in PyMol (Schrodinger, LLC,Ver 1.8) (Table 1). Among
these six peptide sequences, the binding affinities of HA, CLIP,
YAK, and HAY308A (see the sequence name convention in Table
1 caption), have been determined experimentally.[22,23] HA and
CLIP are fairly strong binding peptides with binding affinities
of 14 nM and 25 nM, respectively; YAK has a weak binding
affinity of 118 nM; while HAY308A has a binding affinity of only
23,000 nM, which is extremely weak. Using eq. (1), these
binding affinities can be converted to binding free energies of
46.6 kJ/mol, 45.1 kJ/mol, 41.1 kJ/mol, and 27.5 kJ/mol,
respectively.
In addition to these four whole peptide models, segmented
peptide models are set up by truncating the peptide based on
the location of the anchor residues. For example, we truncate
the HA peptide into four segments (PKY | VKQ | NTL | KLAT).
We truncate the atomistic peptide by disconnecting the bond
between carbon and nitrogen terminus of the two neighbor-
ing segments and adding hydrogens to fill the valencies. Only
four segments are chosen, instead of five, because both
anchor residues THR313 and LEU314 have weak interactions
with their corresponding binding pockets, as shown in an
experimental study,[20] and are, therefore, combined into one
segment. The other segmented peptides are set up in a similar
way.
Atomistic simulations
All simulations are conducted using the GROMACS simulation
package, version 4.6.5.[24] VMD version 1.9.1[25] is used for visu-
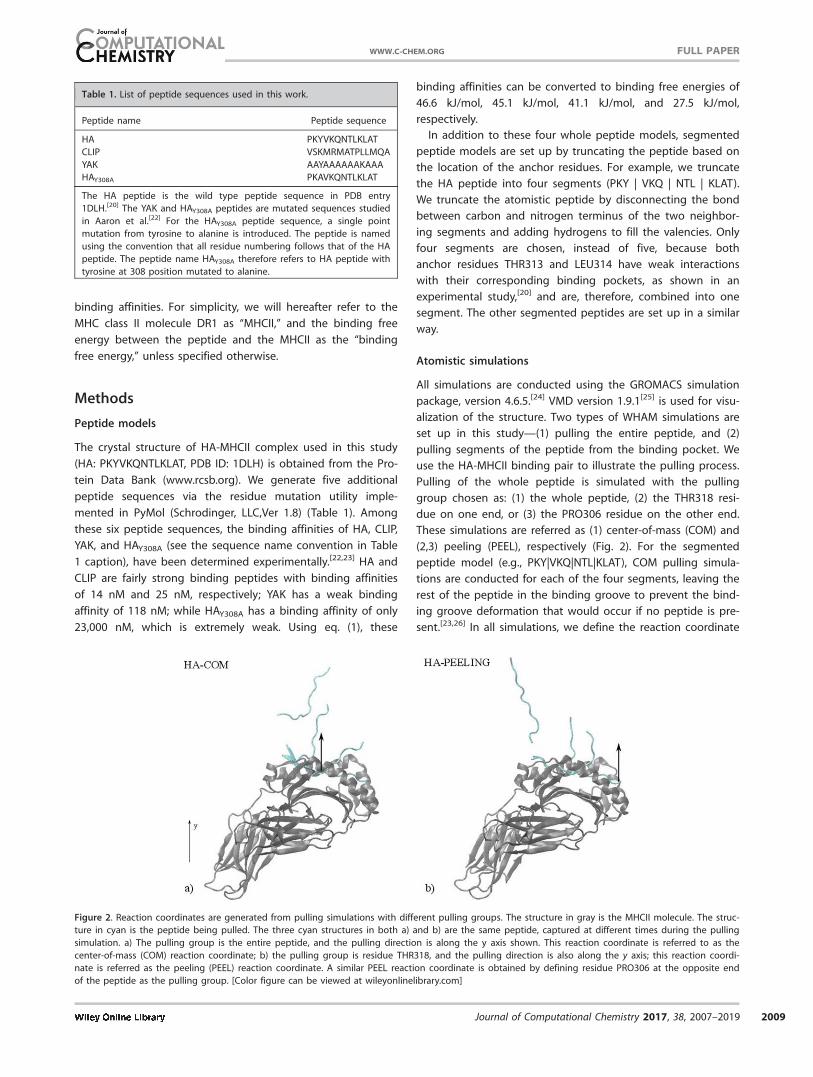
alization of the structure. Two types of WHAM simulations are
set up in this study—(1) pulling the entire peptide, and (2)
pulling segments of the peptide from the binding pocket. We
use the HA-MHCII binding pair to illustrate the pulling process.
Pulling of the whole peptide is simulated with the pulling
group chosen as: (1) the whole peptide, (2) the THR318 resi-
due on one end, or (3) the PRO306 residue on the other end.
These simulations are referred as (1) center-of-mass (COM) and
(2,3) peeling (PEEL), respectively (Fig. 2). For the segmented
peptide model (e.g., PKY|VKQ|NTL|KLAT), COM pulling simula-
tions are conducted for each of the four segments, leaving the
rest of the peptide in the binding groove to prevent the bind-
ing groove deformation that would occur if no peptide is pre-
sent.[23,26] In all simulations, we define the reaction coordinate
Table 1. List of peptide sequences used in this work.
Peptide name Peptide sequence
HA PKYVKQNTLKLAT
CLIP VSKMRMATPLLMQA
YAK AAYAAAAAAKAAA
HAY308A PKAVKQNTLKLAT
The HA peptide is the wild type peptide sequence in PDB entry
1DLH.[20] The YAK and HAY308A peptides are mutated sequences studied
in Aaron et al.[22] For the HAY308A peptide sequence, a single point
mutation from tyrosine to alanine is introduced. The peptide is named
using the convention that all residue numbering follows that of the HA
peptide. The peptide name HAY308A therefore refers to HA peptide with
tyrosine at 308 position mutated to alanine.
Figure 2. Reaction coordinates are generated from pulling simulations with different pulling groups. The structure in gray is the MHCII molecule. The struc-
ture in cyan is the peptide being pulled. The three cyan structures in both a) and b) are the same peptide, captured at different times during the pulling
simulation. a) The pulling group is the entire peptide, and the pulling direction is along the y axis shown. This reaction coordinate is referred to as the
center-of-mass (COM) reaction coordinate; b) the pulling group is residue THR318, and the pulling direction is also along the y axis; this reaction coordi-
nate is referred as the peeling (PEEL) reaction coordinate. A similar PEEL reaction coordinate is obtained by defining residue PRO306 at the opposite end
of the peptide as the pulling group. [Color figure can be viewed at wileyonlinelibrary.com]
FULL PAPERWWW.C-CHEM.ORG
Journal of Computational Chemistry 2017, 38, 2007–2019 2009
to be the distance between the COM of the respective pulling
group and that of the MHCII. A spring constant of 600 kJ
mol21 nm22 is applied on the pulling group to generate a tra-
jectory with a pulling rate of 0.002 nm/ps from the bounded
state to unbound state along the reaction coordinate in each
simulation. We then select “windows” along the reaction coor-
dinate with a 0.1–0.2 nm spacing between two consecutive
windows, each with a harmonic potential centered at a posi-
tion nei . Umbrella sampling simulations[27] are conducted for
each window, where the harmonic bias potential xi [eq. (2)] is
used with a spring constant value (K) between 800 and 8000
kJ mol21 nm22 to allow adequate sampling of microstates
around the equilibrium position of each window.
xi nð Þ5 1
2K n2ne
i
� �2(2)
We apply the WHAM[16] to generate the potential of mean
force (PMF) curve, which yields the binding free energy. This is
done by using the g_wham[15,16] utility from the GROMACS
package.
The AMBER03 force field is used in the atomistic simula-
tions.[28] Starting structures are placed in a 10 3 18 3 10 nm
simulation box solvated with TIP3P water[29] and sodium ions
to neutralize the charge. The temperature is maintained at
298 K using the Nos�e–Hoover weak-coupling method[30,31] and
the pressure is maintained at 1 atm using a Parrinello–Rahman
barostat.[32,33] The cut-off distance for the short-range interac-
tion is 1.4 nm. Long-range electrostatic interactions are calcu-
lated using the Particle Mesh Ewald (PME) algorithm.[34]
Periodic boundary conditions are applied in all three direc-
tions. Position restraints are applied on the heavy atoms of the
MHCII, namely carbon, oxygen, and nitrogen atoms. The sol-
vated system then undergoes a 10,000-step steepest descent
minimization followed by a 100 ps constant-pressure (NPT)
equilibration. A 3 ns pulling simulation is used to generate the
pulling trajectory, which is divided into windows. Each window
is then sampled for 8 ns with a 2 fs time step. We use data
from the last 7 ns of each window in the final PMF calculation.
Our window selection criteria are shown in Supporting Infor-
mation (section S.1).
CG simulations
The MARTINI protein force field is used in the CG simula-
tions.[13,35] Due to the CG nature of MARTINI, we set position
restraints on MHCII backbone beads during the window simu-
lations to stabilize the structure. We note that an alternative
method, not used here, to maintain the stability of the CG
protein structure during the simulation is to adopt the
MARTINI-inherent elastic network approach.[36] We believe that
the deformation of the peptide binding groove,[26,37,38] which
occurs during the initial pulling simulation, is more accurately
accounted for at the atomistic level, and we therefore convert
the configurations generated in the atomistic pulling trajectory
to the CG representation, using martinize.py (http://cgmartini.
nl/index.php/tools2/). We then solvate each starting structure
in a simulation box of 10 3 18 3 10 nm with MARTINI water
beads and add sodium ions to neutralize the system. The tem-
perature is maintained at 325 K using the Berendsen[39] ther-
mostat, and the pressure is maintained at 1 atm using the
Berendsen[40] barostat. A temperature of 325 K is chosen
instead of 310 K to keep the MARTINI water beads from freez-
ing. We note that the calculated experimental binding free
energies using 310 K and 325 K differ by less than 2 kJ/mol,
smaller than the typical error bar obtained in the simulations.
Energy minimization and a 100 ps constant volume (NVT) sim-
ulation with the entire peptide-MHCII complex frozen are car-
ried out to allow adequate equilibration of the water beads. A
10 ns constant pressure (NPT) simulation with 10 fs time step
and position restraint on the backbone beads of the MHCII is
then conducted, followed by a 500 ns umbrella sampling sim-
ulation, with a 25 fs time step. We use the last 480 ns simula-
tion from each window in the final PMF calculation.
Simulation systems
A list of all simulation systems studied in this work is given in
Table 2, and the simulation parameters for window simulations
are available from the University of Michigan Library Deep
Blue Data Depository (DOI:10.7302/Z2M906KK). We study the
effects of reaction coordinates, mutations, and segmentations
using various peptide models. Specifically, the effect of COM
and PEEL pulling coordinates on the binding free energy is
studied using whole peptide models of both HA and CLIP
peptides (systems 1 and 2 in Table 2). The effects of both
single-residue and multiple-residue mutations are studied
using systems 3–4 in Table 2. We test whether the free energy
is sensitive to the choice of the segmentation location and/or
segment length by using segmented peptides PKYV|KQN|TLK|LAT
and PK|YV|KQ|NTL|KLAT (systems 5–7 in Table 2). We also repeat
the single-residue mutation studies with the segmented peptides
to demonstrate that the use of WHAM with a CG force field on a
segmented peptide model is a robust approach to quantify the
binding free energy difference resulting from a single-residue
mutation. HA pulling simulations and HA segmentation simula-
tion are carried out with both atomistic and CG force fields
Table 2. Summary of the simulations.
No. Peptide model type System Peptide sequence No. Peptide model type System Peptide sequence
1 Whole HA PKYVKQNTLKLAT 5 Segmented HA PKY|VKQ|NTL|KLAT
2 Whole CLIP SKMRMATPLLMQAV 6 Segmented HA PKYV|KQN|TLK|LAT
3 Whole YAK AAYAAAAAAKAAA 7 Segmented HA PK|YV|KQ|NTL|KLAT
4 Whole HAY308A PKAVKQNTLKLAT 8 Segmented HAY308A PKA|VKQ|NTL|KLAT
The vertical separators (|) indicate the segmentation locations.
FULL PAPER WWW.C-CHEM.ORG
2010 Journal of Computational Chemistry 2017, 38, 2007–2019 WWW.CHEMISTRYVIEWS.COM

(systems 1 and 8 in Table 2), while only the CG force field is used
in the remaining simulations of Table 2. We carry out seven addi-
tional single-residue mutation studies on designed peptide
sequences (HAQ311A, GGY-G309-318, GGA-G309-318, GGG-G309-318, AAF-
A309-318, AAW-A309-318, and AAA-A309-318), but because there are no
experimental results available for these, the results are shown in
the Supporting Information in Figures S3 and S4, and Table S1.
Results and Discussion
As mentioned earlier, the previous attempt to apply WHAM
using atomistic MD simulations to estimate the binding free
energy between a nine-residue peptide and an MHC class I
molecule did not agree well with the experimental value.[17]
We suspect that this may be due to the overwhelmingly large
number of microstates that a long peptide needs to explore
during each window along the reaction coordinate. The HA
peptide contains 13 residues, which has considerably more
degrees of freedom than a nine-residue peptide does. There-
fore, we expect that the CG simulation might yield more accu-
rate estimation of the binding free energy than atomistic
pulling simulation by reducing the degrees of freemdom. In
this study, we performed and compared both methods.
Whole peptide simulation
We first show a PMF diagram for pulling the entire peptide
out of the binding groove using an atomistic simulation (Fig.
3). The estimated binding free energy is 53.8 6 2.9 kJ/mol,
which is in reasonably good agreement with the experimen-
tally determined value of 46.6 kJ/mol. The standard deviation
is calculated by the bootstrap analysis method[15] with 100
bootstraps. We label four regions on the PMF diagram, based
on the location along the reaction coordinate where each
anchor residue leaves the corresponding binding pocket. Note
that we combine anchor residues THR313 and LEU314 into
one region, because these two residues leave their binding
pockets at roughly the same time in our pulling trajectory. For
each region, we show a snapshot from the simulation near
the point in the simulation at which the anchor residue(s)
jumps out of the binding pocket. We observe two free energy
barriers in the PMF diagram. The main barrier occurs in
regions III and IV, which corresponds to the free energy cost
of pulling residues TYR308 and GLN311 out of binding pockets
1 and 2. The secondary energy barrier occurs in region II. After
examining the trajectories carefully, we find this barrier is asso-
ciated with the free energy cost of pulling anchor residue
LEU316 out of binding pocket 5. The PMF decreases along the
reaction coordinate after this first energy barrier between 2.2
and 2.5 nm. Based on the COM distance between residues on
the peptide and MHCII, this decrease in PMF is the result of
the departure of segment NTL (anchor residue THR313,
LEU314) from the MHCII binding groove. Although this is gen-
erally in line with the experimental result that THR313 interacts
favorably with its binding pocket,[20,21] we cannot finely
resolve the contribution to a single anchor residue, due to the
limitations of the reaction coordinate we chose.
Figure 3. Atomistic PMF curve for pulling the HA peptide from MHCII along a COM reaction coordinate. Four regions are defined, along with one represen-
tative snapshot from each. MHCII is colored gray and the peptide is colored cyan, with red LEU316, green THR313 and LEU314, orange GLN311, and blue
TYR308. We include TYR308 colored in blue in all snapshots to mark the orientation of the peptide. The snapshot at the upper left corresponds to the
early stage of the pulling process where the entire peptide is buried in the binding groove. In region I, the residue LEU316 leaves the binding pocket 5,
while in region II anchor residues THR313 and LEU314 are leaving binding pockets 3 and 4. In region III anchor residue GLN311 is pulled out of binding
pocket 2. Region IV corresponds to the final stage where TYR308 and whole peptide are pulled out of the binding groove. [Color figure can be viewed at
wileyonlinelibrary.com]
FULL PAPERWWW.C-CHEM.ORG
Journal of Computational Chemistry 2017, 38, 2007–2019 2011
It is surprising to see that an atomistic full peptide pulling
simulation gives a binding free energy that is in reasonable
agreement with that reported experimentally. We therefore
decided to test the limitation of using WHAM with an atomis-
tic force field for whole-peptide pulling simulations. A true
free energy does not depend on the path taken between the
two states of interest. Therefore, pulling a peptide out of the
binding groove along a different reaction coordinate should
result in the same binding free energy, assuming that each
reaction coordinate permits adequate sampling of configura-
tions within each window and that the windows overlap suffi-
ciently. So far we have discussed pulling the peptide out of
the binding groove by using the entire peptide as the pulling
group. Here we discuss the effect of choosing the two addi-
tional reaction coordinates in which the pulling groups are res-
idues closer to the ends of the peptide, namely THR318 and
PRO306, respectively, which we refer to as “PEEL” simulations.
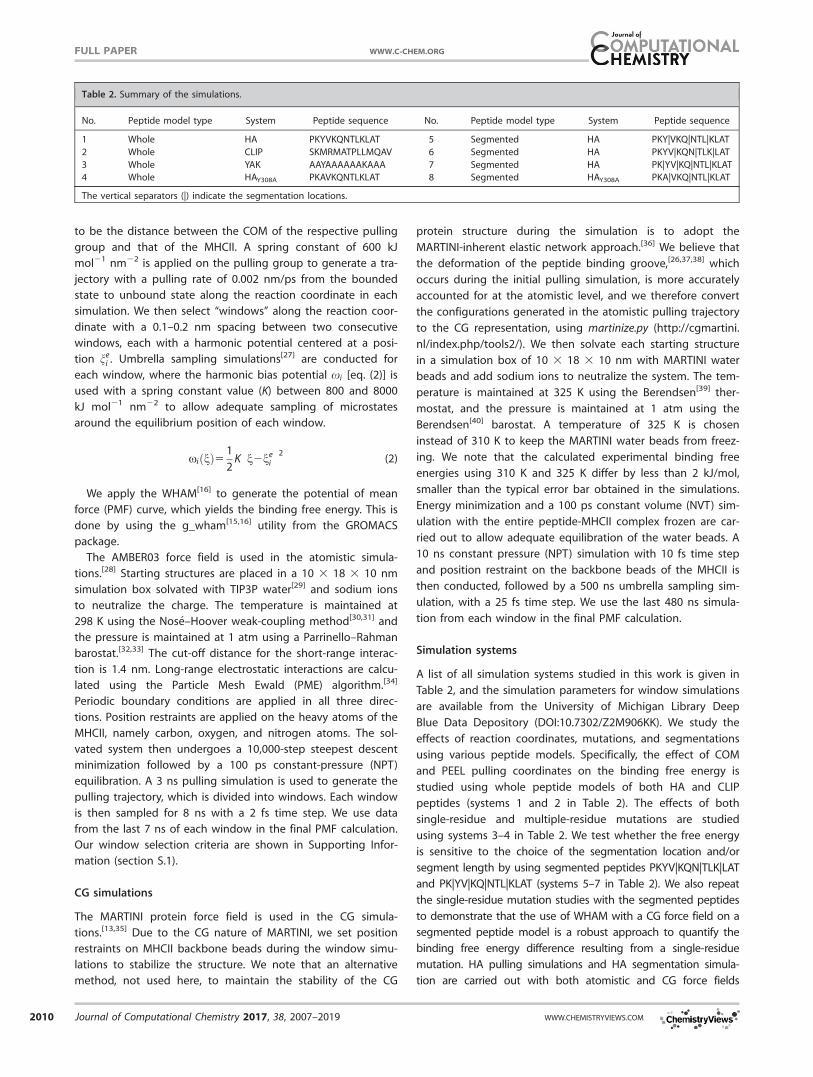
We peel the entire peptide from the THR318 residue end
using the atomistic force field, giving the results shown in Fig-
ure 4a which differs drastically from that of COM pulling.
Based on the COM distances between residues on the peptide
and MHCII, we can identify the portion of each PMF that cor-
responds to the pulling of NTLKLAT residues from the pocket.
In the COM pulling, this corresponds to the distance along the
reaction coordinate between 1.6 and 2.5 nm (reproduced as
Fig. 4b), and in the peeling PMF, to the distance between 0.7
and 4.0 nm (Fig. 4a). The estimated binding free energies of
NTLKLAT residues from both PMFs are around 9 kJ/mol. The
remainder of the PMFs corresponds to the pulling of PKYVKQ
residues. For this portion of the pulling the COM pulling simu-
lation gives a free energy of 44 kJ/mol, while the peeling one
gives a much higher value, 217 kJ/mol.
This significant difference in binding free energy suggests
that it is extremely costly energetically to pull either one of
the two anchor residues (GLN311 or TYR308) out of its corre-
sponding binding pocket, which has not been reported in the
experimental studies. We have inspected the relevant frames
and found the following sources of this significant energy bar-
rier. (1) An accurate WHAM free energy requires adequate sam-
pling of all possible microstates in each umbrella-sampling
window. However, in multiple cases, we find that the peptide
becomes stuck in a localized set of configurations caused by
strong interactions between a single residue and the binding
pocket, preventing adequate sampling in that window. This
biases the WHAM calculation, giving an unrealistically high
energy barrier. We demonstrate one such incident in the fol-
lowing briefly, and in much more detail in the Supporting
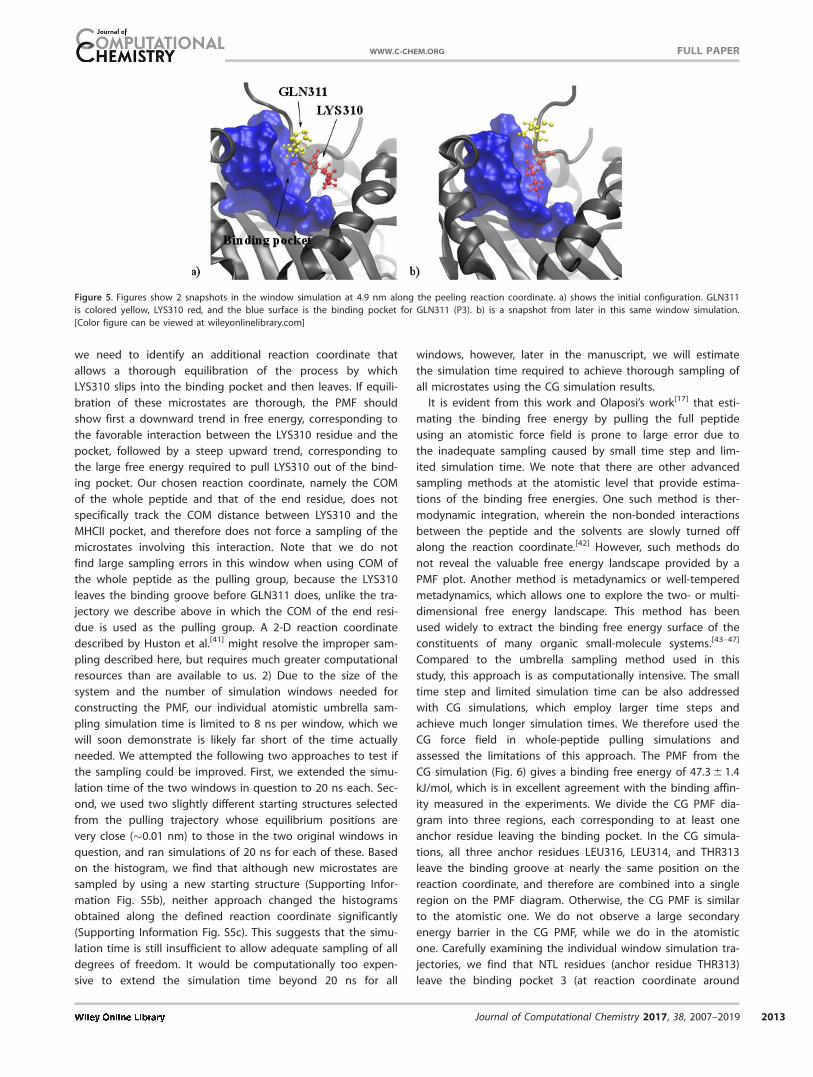
Information (section S.3). Figure 5a shows the initial state of
the window in which residue GLN311 is at the edge of leaving
its binding pocket 2 (highlighted by the blue surface). Ideally,
LYS310 and GLN311 should explore all microstates near this
initial configuration in this umbrella simulation window, includ-
ing configurations in which GLN311 resides both in and out of
the binding pocket and LYS310 is both in and out of the sur-
rounding binding groove. However, in our umbrella sampling
simulation, LYS310 slips into the binding pocket 2, replacing
GLN311, which has been pulled out, after which LYS310
remains inside the binding pocket throughout the 8 ns simula-
tion period of the window (Fig. 5b). A thorough sampling of
configurations between these two microstates therefore does
not occur. A close examination of the distance between the
COM of LYS310 on the peptide and of the residues GLN9 on
the a chain of the MHCII molecule (termed GLN a9), and of
TYR78 on the b chain of the MHCII molecule (termed TYR
b78), reveals that LYS310 remains in close proximity to these
two residues throughout this window (Supporting Information
Fig. S5). In the following window along the reaction coordi-
nate, both LYS310 and GLN311 explore microstates outside the
binding groove throughout the simulation, but do not sample
properly the transitional states through which LYS310 moves
in and out of the binding groove. A positively charged residue
such as LYS310 should not bind strongly within pocket 2, due
to the nearby presence of residue ARG b71 on MHCII bchain.[20] Therefore, the apparently strong interaction between
LYS310 and binding pocket 2 imputed by WHAM is an artifact
created by the choice of reaction coordinate, along which not
all microstates between the bounded peptide and non-
bounded peptide states have been sampled. The localized set
of configurations where LYS310 is in close proximity to GLN A9
and TYR b78 produced large positive “pulling” forces, which
resulted in positive PMF values when taking the weighted
average during the WHAM calculation.[27] To resolve this issue,
Figure 4. Atomistic PMF curves. a) PMF from peeling the HA peptide from the THR318 end; b) Same as Figure 3 where the entire peptide is pulled. [Color
figure can be viewed at wileyonlinelibrary.com]
FULL PAPER WWW.C-CHEM.ORG
2012 Journal of Computational Chemistry 2017, 38, 2007–2019 WWW.CHEMISTRYVIEWS.COM
we need to identify an additional reaction coordinate that
allows a thorough equilibration of the process by which
LYS310 slips into the binding pocket and then leaves. If equili-
bration of these microstates are thorough, the PMF should
show first a downward trend in free energy, corresponding to
the favorable interaction between the LYS310 residue and the
pocket, followed by a steep upward trend, corresponding to
the large free energy required to pull LYS310 out of the bind-
ing pocket. Our chosen reaction coordinate, namely the COM
of the whole peptide and that of the end residue, does not
specifically track the COM distance between LYS310 and the
MHCII pocket, and therefore does not force a sampling of the
microstates involving this interaction. Note that we do not
find large sampling errors in this window when using COM of
the whole peptide as the pulling group, because the LYS310
leaves the binding groove before GLN311 does, unlike the tra-
jectory we describe above in which the COM of the end resi-
due is used as the pulling group. A 2-D reaction coordinate
described by Huston et al.[41] might resolve the improper sam-
pling described here, but requires much greater computational
resources than are available to us. 2) Due to the size of the
system and the number of simulation windows needed for
constructing the PMF, our individual atomistic umbrella sam-
pling simulation time is limited to 8 ns per window, which we
will soon demonstrate is likely far short of the time actually
needed. We attempted the following two approaches to test if
the sampling could be improved. First, we extended the simu-
lation time of the two windows in question to 20 ns each. Sec-
ond, we used two slightly different starting structures selected
from the pulling trajectory whose equilibrium positions are
very close (�0.01 nm) to those in the two original windows in
question, and ran simulations of 20 ns for each of these. Based
on the histogram, we find that although new microstates are
sampled by using a new starting structure (Supporting Infor-
mation Fig. S5b), neither approach changed the histograms
obtained along the defined reaction coordinate significantly
(Supporting Information Fig. S5c). This suggests that the simu-
lation time is still insufficient to allow adequate sampling of all
degrees of freedom. It would be computationally too expen-
sive to extend the simulation time beyond 20 ns for all
windows, however, later in the manuscript, we will estimate
the simulation time required to achieve thorough sampling of
all microstates using the CG simulation results.
It is evident from this work and Olaposi’s work[17] that esti-
mating the binding free energy by pulling the full peptide
using an atomistic force field is prone to large error due to
the inadequate sampling caused by small time step and lim-
ited simulation time. We note that there are other advanced
sampling methods at the atomistic level that provide estima-
tions of the binding free energies. One such method is ther-
modynamic integration, wherein the non-bonded interactions
between the peptide and the solvents are slowly turned off
along the reaction coordinate.[42] However, such methods do
not reveal the valuable free energy landscape provided by a
PMF plot. Another method is metadynamics or well-tempered
metadynamics, which allows one to explore the two- or multi-
dimensional free energy landscape. This method has been
used widely to extract the binding free energy surface of the
constituents of many organic small-molecule systems.[43–47]
Compared to the umbrella sampling method used in this
study, this approach is as computationally intensive. The small
time step and limited simulation time can be also addressed
with CG simulations, which employ larger time steps and
achieve much longer simulation times. We therefore used the
CG force field in whole-peptide pulling simulations and
assessed the limitations of this approach. The PMF from the
CG simulation (Fig. 6) gives a binding free energy of 47.3 6 1.4
kJ/mol, which is in excellent agreement with the binding affin-
ity measured in the experiments. We divide the CG PMF dia-
gram into three regions, each corresponding to at least one
anchor residue leaving the binding pocket. In the CG simula-
tions, all three anchor residues LEU316, LEU314, and THR313
leave the binding groove at nearly the same position on the
reaction coordinate, and therefore are combined into a single
region on the PMF diagram. Otherwise, the CG PMF is similar
to the atomistic one. We do not observe a large secondary
energy barrier in the CG PMF, while we do in the atomistic
one. Carefully examining the individual window simulation tra-
jectories, we find that NTL residues (anchor residue THR313)
leave the binding pocket 3 (at reaction coordinate around
Figure 5. Figures show 2 snapshots in the window simulation at 4.9 nm along the peeling reaction coordinate. a) shows the initial configuration. GLN311
is colored yellow, LYS310 red, and the blue surface is the binding pocket for GLN311 (P3). b) is a snapshot from later in this same window simulation.
[Color figure can be viewed at wileyonlinelibrary.com]
FULL PAPERWWW.C-CHEM.ORG
Journal of Computational Chemistry 2017, 38, 2007–2019 2013

2.4 nm) soon after KLAT residues (anchor residue LEU316)
leave the binding pocket 4 (at reaction coordinate around
2.0 nm).
We show the PMF curves generated from CG PEEL simula-
tions in Figure 7a. From these two PMF curves, we obtain
binding free energies of 43.1 6 1.6 kJ/mol and 48.1 6 1.7 kJ/
mol by pulling from the PRO306 end and the THR318 end,
respectively. Both results are in good agreement with the
experimentally determined value, as well as with the CG result
obtained when the entire peptide is the pulling group. In
addition, we are able to achieve much longer time scales (500
ns per window) using CG simulations.
Although the sequence of the CLIP peptide is different from
that of the HA peptide, the former has a binding free energy
of 45.1 kJ/mol,[37] which is comparable to that of the HA pep-
tide. We mutate the HA peptide to CLIP and carry out the pull-
ing simulation at the CG level with three reaction coordinates,
namely COM and two PEEL reaction coordinates and obtain a
binding free energy of 44.5 6 2.2 kJ/mol using the COM reac-
tion coordinate and 42.0 6 1.5 kJ/mol and 53.8 6 1.1 kJ/mol
using the two PEEL reaction coordinates (Fig. 7b). These results
are in reasonable (although not excellent) agreement with
each other and again demonstrate that, compared to atomistic
simulations, the binding free energies from the CG simulations
are less sensitive to the choice of the reaction coordinate.
Painter et al. has deposited a crystal structure of CLIP-MHCII
in the protein data bank (PDB ID: 3QXA).[38] However, compar-
ing the MHC crystal structures in 1DLH (MHCII-HA peptide)
and 3QXA (MHCII-CLIP peptide), we find the protein structures
around the binding pocket 1(P1) are different, even though
the sequences of both MHCII molecules were identical. This is
likely due to the different pH conditions where these two crys-
tal structures were determined (pH 5 5.5 and 7.0, respectively).
Painter et al. has shown that minor structural difference in the
binding pocket, particularly at the P1 position, leads to differ-
ence in the binding free energy.[38] Indeed, when we conduct
a whole-peptide pulling simulation of CLIP-MHCII using this
crystal structure (3QXA), we obtain a modestly different bind-
ing free energy of 35.7 6 2.8 kJ/mol (PMF shown in Supporting
Information Fig. S6) from the one that we obtain using the
CLIP-MHCII structure where the CLIP peptide is mutated from
the HA peptide (44.5 6 2.2 kJ/mol, shown in Fig. 7b). Note that
due to the position restraints set on the MHC backbone dur-
ing the CG simulations, the differences in the crystal structures
would be inherited throughout the simulation. Because remov-
ing the position restraints in the CG simulation causes the CG
protein structure to destabilize, we are not able to investigate
further the effect of MHC II conformational change on the
binding free energy.
To estimate the simulation time required to achieve the ade-
quate sampling of microstates needed to obtain a converged
PMF, we plot in Figure 8 the PMFs for HA and CLIP peptides
obtained using the data from the first 20 ns, 50 ns, 200 ns,
500 ns, and 1000 ns of each window simulation. The PMFs
depend on the window simulation time up to around 200 ns
runs, with good convergence for runs longer than this for
both HA and CLIP. The thoroughness of sampling in each win-
dow is also demonstrated by the symmetry of the histogram.
To quantify this symmetry, for each PMF, we fit Gaussian distri-
butions to all histograms used to construct it, and plot the
total fitting error in the insets of Figure 8. We find the fitting
Figure 7. a) shows the PMF curves from CG COM and PEEL simulations of the HA peptide from the MHCII molecule using the COM, PRO306 end, and
THR318 end as the pulling group. b) shows the PMF curves from CG simulations of the CLIP peptide from the COM and both peptide ends. The dashed
lines in the both figures stand for the experimental results of binding free energy for HA and CLIP peptides. [Color figure can be viewed at wileyonline-
library.com]
Figure 6. CG PMF curve for pulling the HA peptide from MHCII along a
COM reaction coordinate. Notation is the same as in Figure 3. [Color figure
can be viewed at wileyonlinelibrary.com]
FULL PAPER WWW.C-CHEM.ORG
2014 Journal of Computational Chemistry 2017, 38, 2007–2019 WWW.CHEMISTRYVIEWS.COM

errors decrease greatly with increasing window duration, up to
around 200–500 ns of sampling, and plateau thereafter, sup-
porting the conclusion that the minimum simulation time to
achieve thorough sampling of microstates at the CG level is
around 200 ns for each window. Since the MARTINI force field,
with its softer interactions, speeds up molecular mobility by a
factor of around four relative to atomistic simulations, the 200
ns minimum simulation time per window at CG level corre-
sponds to 800 ns at atomistic level.[48] Such a time scale is
very challenging to achieve at atomistic scale, where a total of
16 ls simulation time would be required for a single PMF with
20 windows. Moreover, there are significantly more degrees of
freedom at the atomistic level, therefore, the total number of
microstates need to be sampled at atomistic level is likely to
be significant greater than at CG level and the minimum
simulation time required for each atomistic simulation window
may be well beyond 800 ns.
Estimating the binding free energy between mutated
peptides and MHCII
We have obtained an accurate estimation of the binding free
energy of the HA peptide and of the CLIP peptide using
WHAM with CG simulations. Since our goal is to develop a
robust method to estimate the binding free energy between
an arbitrary peptide and MHCII, we further apply WHAM with
this CG force field to estimate the binding free energies of
mutated peptide sequences (systems 3 and 4 in Table 2).
We first carry out the pulling simulation using the peptide
HAY308A, which is a single-residue mutation of the HA peptide
Figure 8. Convergence of the PMF curves obtained from COM CG pulling of a) HA peptide and b) CLIP peptide. The PMFs are obtained using data from
first 20, 50, 200, 500, and 1000 ns of the simulation, respectively. The insets show the total error obtained by fitting Gaussian distributions to the histo-
grams used to construct the corresponding PMF. [Color figure can be viewed at wileyonlinelibrary.com]
FULL PAPERWWW.C-CHEM.ORG
Journal of Computational Chemistry 2017, 38, 2007–2019 2015
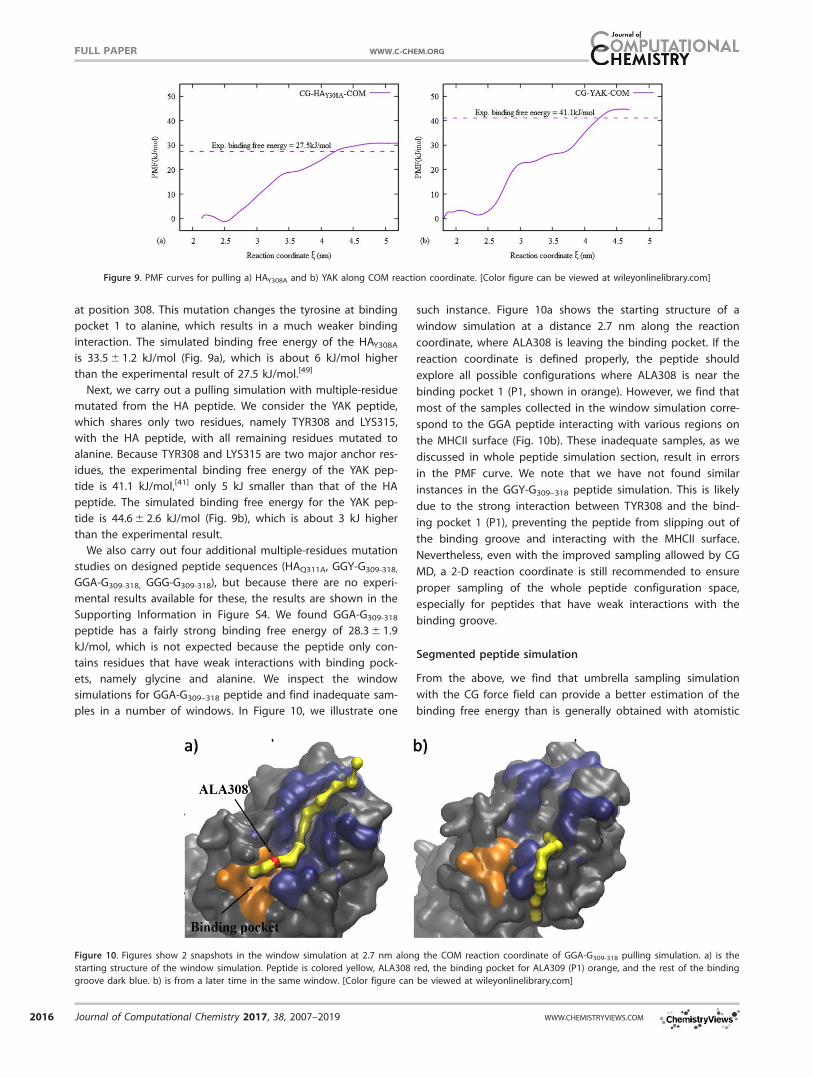
at position 308. This mutation changes the tyrosine at binding
pocket 1 to alanine, which results in a much weaker binding
interaction. The simulated binding free energy of the HAY308A
is 33.5 6 1.2 kJ/mol (Fig. 9a), which is about 6 kJ/mol higher
than the experimental result of 27.5 kJ/mol.[49]
Next, we carry out a pulling simulation with multiple-residue
mutated from the HA peptide. We consider the YAK peptide,
which shares only two residues, namely TYR308 and LYS315,
with the HA peptide, with all remaining residues mutated to
alanine. Because TYR308 and LYS315 are two major anchor res-
idues, the experimental binding free energy of the YAK pep-
tide is 41.1 kJ/mol,[41] only 5 kJ smaller than that of the HA
peptide. The simulated binding free energy for the YAK pep-
tide is 44.6 6 2.6 kJ/mol (Fig. 9b), which is about 3 kJ higher
than the experimental result.
We also carry out four additional multiple-residues mutation
studies on designed peptide sequences (HAQ311A, GGY-G309-318,
GGA-G309-318, GGG-G309-318), but because there are no experi-
mental results available for these, the results are shown in the
Supporting Information in Figure S4. We found GGA-G309-318
peptide has a fairly strong binding free energy of 28.3 6 1.9
kJ/mol, which is not expected because the peptide only con-
tains residues that have weak interactions with binding pock-
ets, namely glycine and alanine. We inspect the window
simulations for GGA-G309–318 peptide and find inadequate sam-
ples in a number of windows. In Figure 10, we illustrate one
such instance. Figure 10a shows the starting structure of a
window simulation at a distance 2.7 nm along the reaction
coordinate, where ALA308 is leaving the binding pocket. If the
reaction coordinate is defined properly, the peptide should
explore all possible configurations where ALA308 is near the
binding pocket 1 (P1, shown in orange). However, we find that
most of the samples collected in the window simulation corre-
spond to the GGA peptide interacting with various regions on
the MHCII surface (Fig. 10b). These inadequate samples, as we
discussed in whole peptide simulation section, result in errors
in the PMF curve. We note that we have not found similar
instances in the GGY-G309–318 peptide simulation. This is likely
due to the strong interaction between TYR308 and the bind-
ing pocket 1 (P1), preventing the peptide from slipping out of
the binding groove and interacting with the MHCII surface.
Nevertheless, even with the improved sampling allowed by CG
MD, a 2-D reaction coordinate is still recommended to ensure
proper sampling of the whole peptide configuration space,
especially for peptides that have weak interactions with the
binding groove.
Segmented peptide simulation
From the above, we find that umbrella sampling simulation
with the CG force field can provide a better estimation of the
binding free energy than is generally obtained with atomistic
Figure 9. PMF curves for pulling a) HAY308A and b) YAK along COM reaction coordinate. [Color figure can be viewed at wileyonlinelibrary.com]
Figure 10. Figures show 2 snapshots in the window simulation at 2.7 nm along the COM reaction coordinate of GGA-G309-318 pulling simulation. a) is the
starting structure of the window simulation. Peptide is colored yellow, ALA308 red, the binding pocket for ALA309 (P1) orange, and the rest of the binding
groove dark blue. b) is from a later time in the same window. [Color figure can be viewed at wileyonlinelibrary.com]
FULL PAPER WWW.C-CHEM.ORG
2016 Journal of Computational Chemistry 2017, 38, 2007–2019 WWW.CHEMISTRYVIEWS.COM
force field, but there remain some limitations. As we discussed,
the chosen 1-D reaction coordinate in this work, namely the
COM distance between the peptide and MHCII, does not guar-
antee adequate sampling of the entire configuration space of
a 13-residue peptide, which may result in errors in the PMF
curves (e.g., Fig. 5). In the hope of addressing this issue, we
propose segmenting the peptide, wherein the 13-residue long
peptide is truncated into four small segments, based on the
locations of their anchor residues. Then, we estimate the bind-
ing free energy of each segment and sum up these up to
obtain the total binding free energy for the whole peptide.
Although we are still employing a 1-D reaction coordinate
defined as the COM distance between the peptide segment
and MHCII, the configuration space is far smaller for a 3-mer
peptide segment than for a 13-mer peptide. Therefore, com-
bining the small configuration space and the long simulation
time, we expect that CG MD with a segmented peptide using
the 1-D reaction coordinate might be sufficient to allow ade-
quate sampling in all window simulations.
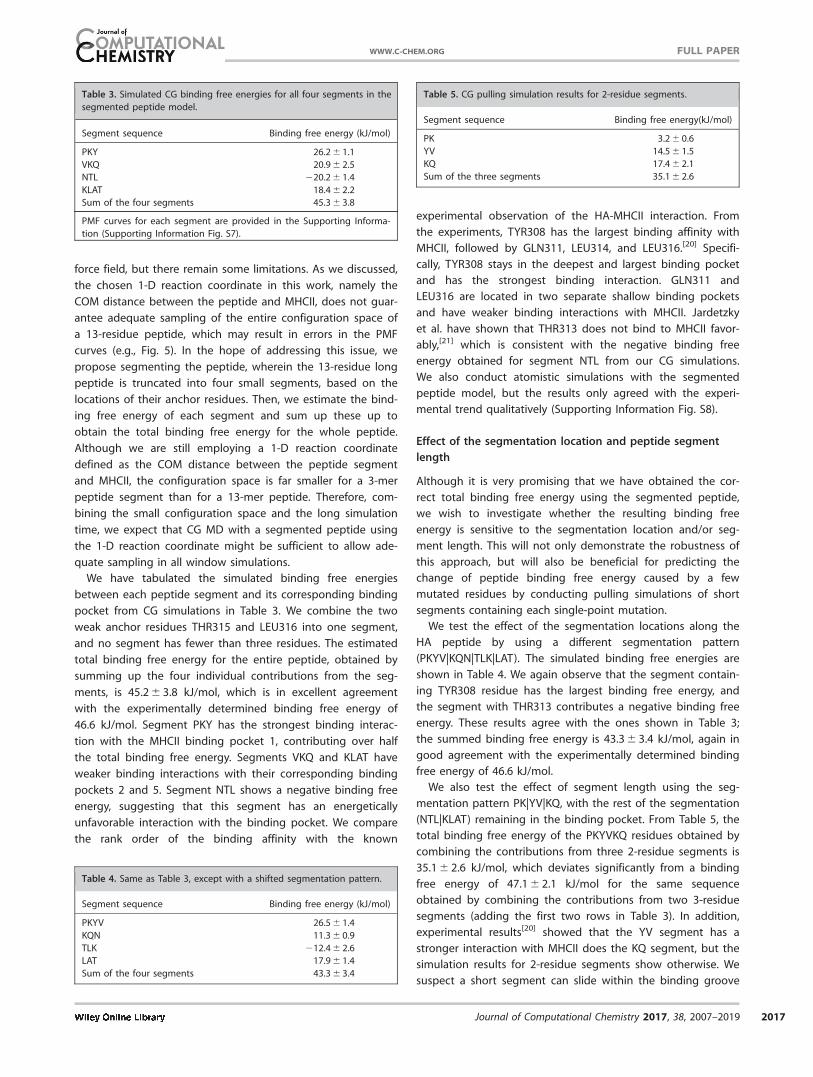
We have tabulated the simulated binding free energies
between each peptide segment and its corresponding binding
pocket from CG simulations in Table 3. We combine the two
weak anchor residues THR315 and LEU316 into one segment,
and no segment has fewer than three residues. The estimated
total binding free energy for the entire peptide, obtained by
summing up the four individual contributions from the seg-
ments, is 45.2 6 3.8 kJ/mol, which is in excellent agreement
with the experimentally determined binding free energy of
46.6 kJ/mol. Segment PKY has the strongest binding interac-
tion with the MHCII binding pocket 1, contributing over half
the total binding free energy. Segments VKQ and KLAT have
weaker binding interactions with their corresponding binding
pockets 2 and 5. Segment NTL shows a negative binding free
energy, suggesting that this segment has an energetically
unfavorable interaction with the binding pocket. We compare
the rank order of the binding affinity with the known
experimental observation of the HA-MHCII interaction. From
the experiments, TYR308 has the largest binding affinity with
MHCII, followed by GLN311, LEU314, and LEU316.[20] Specifi-
cally, TYR308 stays in the deepest and largest binding pocket
and has the strongest binding interaction. GLN311 and
LEU316 are located in two separate shallow binding pockets
and have weaker binding interactions with MHCII. Jardetzky
et al. have shown that THR313 does not bind to MHCII favor-
ably,[21] which is consistent with the negative binding free
energy obtained for segment NTL from our CG simulations.
We also conduct atomistic simulations with the segmented
peptide model, but the results only agreed with the experi-
mental trend qualitatively (Supporting Information Fig. S8).
Effect of the segmentation location and peptide segment
length
Although it is very promising that we have obtained the cor-
rect total binding free energy using the segmented peptide,
we wish to investigate whether the resulting binding free
energy is sensitive to the segmentation location and/or seg-
ment length. This will not only demonstrate the robustness of
this approach, but will also be beneficial for predicting the
change of peptide binding free energy caused by a few
mutated residues by conducting pulling simulations of short
segments containing each single-point mutation.
We test the effect of the segmentation locations along the
HA peptide by using a different segmentation pattern
(PKYV|KQN|TLK|LAT). The simulated binding free energies are
shown in Table 4. We again observe that the segment contain-
ing TYR308 residue has the largest binding free energy, and
the segment with THR313 contributes a negative binding free
energy. These results agree with the ones shown in Table 3;
the summed binding free energy is 43.3 6 3.4 kJ/mol, again in
good agreement with the experimentally determined binding
free energy of 46.6 kJ/mol.
We also test the effect of segment length using the seg-
mentation pattern PK|YV|KQ, with the rest of the segmentation
(NTL|KLAT) remaining in the binding pocket. From Table 5, the
total binding free energy of the PKYVKQ residues obtained by
combining the contributions from three 2-residue segments is
35.1 6 2.6 kJ/mol, which deviates significantly from a binding
free energy of 47.1 6 2.1 kJ/mol for the same sequence
obtained by combining the contributions from two 3-residue
segments (adding the first two rows in Table 3). In addition,
experimental results[20] showed that the YV segment has a
stronger interaction with MHCII does the KQ segment, but the
simulation results for 2-residue segments show otherwise. We
suspect a short segment can slide within the binding groove
Table 3. Simulated CG binding free energies for all four segments in the
segmented peptide model.
Segment sequence Binding free energy (kJ/mol)
PKY 26.2 6 1.1
VKQ 20.9 6 2.5
NTL 220.2 6 1.4
KLAT 18.4 6 2.2
Sum of the four segments 45.3 6 3.8
PMF curves for each segment are provided in the Supporting Informa-
tion (Supporting Information Fig. S7).
Table 4. Same as Table 3, except with a shifted segmentation pattern.
Segment sequence Binding free energy (kJ/mol)
PKYV 26.5 6 1.4
KQN 11.3 6 0.9
TLK 212.4 6 2.6
LAT 17.9 6 1.4
Sum of the four segments 43.3 6 3.4
Table 5. CG pulling simulation results for 2-residue segments.
Segment sequence Binding free energy(kJ/mol)
PK 3.2 6 0.6
YV 14.5 6 1.5
KQ 17.4 6 2.1
Sum of the three segments 35.1 6 2.6
FULL PAPERWWW.C-CHEM.ORG
Journal of Computational Chemistry 2017, 38, 2007–2019 2017
causing errors in the PMF curves. Thus, the 3-residue segmen-
tation appears to be an appropriate segment length for
obtaining robust binding free energy.
Estimating the binding free energy of mutated peptides
using segmented peptide model
To consider the possibility that a mutation on one segment
might affect the binding free energy of the neighboring seg-
ment, we repeat the pulling simulations of the mutant HAY308A
peptide using the segmented peptide. Specifically, we pull the
segment PKA (which contains the mutation) and segment VKQ
(which neighbors segment PKA) from the binding groove and
compare the simulated binding free energies of these two
segments to those of the corresponding segments in the HA
peptide, leaving the other segments of the peptide in the
binding pocket.
From Table 6, the binding free energy of the segment PKA
clearly decreases due to the mutation of Y to A. The binding
free energy for the segment VKQ, however, appears to be
almost the same, which suggests the mutation in the PKA seg-
ment has little effect on the neighboring 3-residue VKQ seg-
ment. In addition, we observe no conformational change in
segments NTLKLAT and their corresponding binding pockets
on MHCII based on visual inspection before and after the
mutation, suggesting the mutation has no effect on the bind-
ing free energy of these two segments either. Therefore, we
can add the binding free energy of PKA|VKQ (Table 6) and
NTL|KLAT (Table 3) to obtain the total binding free energy,
which is close to the experimental result.
Conclusions
We performed both atomistic and course-grained (CG)
Weighted Histogram “pulling” simulations of both whole pepti-
des and segmented peptides from the MHCII molecule along
center of mass (COM) and PEEL reaction coordinates. All simu-
lation results are summarized in Table 7. We find the binding
free energy estimations obtained using CG MD are less prone
to large error caused by inadequate sampling than when using
atomistic MD (tests 1–3 in Table 7). This is likely because we
can achieve a much longer simulation time (almost 500-fold)
with CG MD than with atomistic MD, allowing sampling of
enough microstates in the former. Nevertheless, estimating the
binding free energy by pulling the whole peptide using CG
MD still has limitations when sampling weak peptide-binding
groove interactions. This is due to the fact that the chosen 1-
D reaction coordinate in our work does not guarantee appro-
priate sampling of the voluminous configuration space that a
13-resdiue peptide can adopt. We, therefore, proposed seg-
menting the peptide to demonstrate that a 1-D reaction coor-
dinate is sufficient to extract accurate binding free energies of
3-mer segments (tests 5–7 and 9 in Table 7) with the remain-
der of the peptide left in the pocket, and that with a single
anchor residue in each segment the total free energy can be
obtained by adding the free energy contributions of these
short segments. In addition, the segmented peptide model
allows us to rapidly predict the effect of single-residue muta-
tions on the binding free energy. Using much larger-scale
computations, it should be possible to apply our CG umbrella
sampling method with this segmented peptide strategy to
predict binding free energies of hundreds or thousands of
Table 6. CG simulation results for HAY308A and HA.
Segment sequence
Binding free
energy(kJ/mol)
Segment
sequence
Binding free
energy (kJ/mol)
PKA 9.1 6 1.8 PKY 26.2 6 1.1
VKQ (in HAY308A) 22.8 6 1.4 VKQ (in HA) 20.9 6 2.5
Table 7. Summary of main simulation results compared with experimental results.
Effect studied
Peptide
model
Pulling
coordinate Peptide
Sim. DG
(kJ/mol)
Exp. DG
(kJ/mol)
Sim.
DDGY308A
(kJ/mol)
Exp.DDGY308A
(kJ/mol)
1 Reaction Coordinate (Atomistic) Whole COM HA 53.8 6 2.9 46.6
Whole PEEL-THR318 HA >217
2 Reaction Coordinate (CG) Whole COM HA 47.3 6 1.4
Whole PEEL-PRO306 HA 43.1 6 1.6
Whole PEEL-THR318 HA 48.1 6 1.7
3 Reaction Coordinate (CG) Whole COM CLIP 44.6 6 2.6 45.1
Whole PEEL-VAL305 CLIP 42.0 6 1.5
Whole PEEL-ALA318 CLIP 53.8 6 1.1
4 Multiple Residues Mutation Whole COM HA 47.3 6 1.4 46.6
Whole COM YAK 44.6 6 2.6 41.1
5 Peptide Segmentation Whole COM HA 47.3 6 1.4 46.6
Segmented COM HA 45.3 6 3.8
6 Segmentation Location Segmented COM HA 45.3 6 3.8
Segmented COM HA 43.3 6 3.4
7 Segment Length Segmented COM HA 45.3 6 3.8
Segmented COM HA 33.3 6 4.4
8 Single Residue Mutation Whole COM HA 47.3 6 1.4 13.8 6 1.8 19.1
Whole COM HAY308A 33.5 6 1.2
9 Single Residue Mutation Segmented COM HA 45.3 6 3.8 15.2 6 5.1
Segmented COM HAY308A 30.1 6 3.4
FULL PAPER WWW.C-CHEM.ORG
2018 Journal of Computational Chemistry 2017, 38, 2007–2019 WWW.CHEMISTRYVIEWS.COM
peptide variants to MHC class II molecules, with implications
for the rational design of peptides for immunotherapy.
Acknowledgments
We thank Dr. Shihu Wang and Kyle Huston for helping with the sim-
ulation setup. We also thank Mason Smith and Eshita Khera for
many helpful and stimulating discussions. Notes: The authors
declare no competing financial interest.
Keywords: MHC � peptide � peptide-MHC binding affinity �coarse-grained � binding free energy � umbrella sampling method
How to cite this article: M. Huang, W. Huang, F. Wen, R. G.
Larson. J. Comput. Chem. 2017, 38, 2007–2019. DOI: 10.1002/
jcc.24845
] Additional Supporting Information may be found in the
online version of this article.
[1] J. S. Blum, P. A. Wearsch, P. Cresswell, Annu. Rev. Immunol. 2013, 31, 443.
[2] J. M. Blander, P. Nair-Gupta, Mol. Innate Immun. 2013, 4, 401.
[3] L. C. Eisenlohr, Mol. Immunol., 2013, 55, 169.
[4] C. Watts, Biochim. Biophys. Acta BBA - Proteins Proteomics 2012, 1824,
14.
[5] P. E. Jensen, Nat. Immunol. 2007, 8, 1041.
[6] G. L. Pira, F. Ivaldi, P. Moretti, F. Manca, J. Biomed. Biotechnol. 2010,
2010, 325720.
[7] M. Nielsen, O. Lund, S. Buus, C. Lundegaard, Immunology 2010, 130,
319.
[8] H.-G. Rammensee, Curr. Opin. Immunol. 1995, 7, 85.
[9] D. Rognan, L. Scapozza, G. Folkers, A. Daser, Biochemistry (Mosc.) 1994,
33, 11476.
[10] R. Yaneva, S. Springer, M. Zacharias, Biopolymers 2009, 91, 14.
[11] U. Omasits, B. Knapp, M. Neumann, O. Steinhauser, H. Stockinger,
Mol. Simul. 2008, 34, 781.
[12] S. J. Marrink, A. H. de Vries, A. E. Mark, J. Phys. Chem. B 2004, 108,750.[13] L. Monticelli, S. K. Kandasamy, X. Periole, R. G. Larson, D. P. Tieleman,
S.-J. Marrink, J. Chem. Theory Comput. 2008, 4, 819.
[14] S. J. Marrink, D. P. Tieleman, Chem. Soc. Rev. 2013, 42, 6801.
[15] J. S. Hub, B. L. de Groot, D. van der Spoel, J. Chem. Theory Comput.
2010, 6, 3713.
[16] S. Kumar, J. M. Rosenberg, D. Bouzida, R. H. Swendsen, P. A. Kollman,
J. Comput. Chem. 1992, 13, 1011.
[17] O. I. Olaposi, H. Tsuyoshi, Am. J. Bioinforma. Res. 2015, 5, 1.
[18] A. May, R. Pool, E. van Dijk, J. Bijlard, S. Abeln, J. Heringa, K. A.
Feenstra, Bioinforma. Oxf. Engl. 2014, 30, 326.
[19] H. Zhang, P. Wang, N. Papangelopoulos, Y. Xu, A. Sette, P. E. Bourne, O.
Lund, J. Ponomarenko, M. Nielsen, B. Peters, , PLoS One 2010, 5, e9272.
[20] L. J. Stern, J. H. Brown, T. S. Jardetzky, J. C. Gorga, R. G. Urban, J. L.
Strominger, D. C. Wiley, Nature 1994, 368, 215.
[21] T. S. Jardetzky, J. C. Gorga, R. Busch, J. Rothbard, J. L. Strominger, D. C.
Wiley, EMBO J. 1990, 9, 1797.
[22] A. K. Sato, J. A. Zarutskie, M. M. Rushe, A. Lomakin, S. K. Natarajan, S.
Sadegh-Nasseri, G. B. Benedek, L. J. Stern, J. Biol. Chem. 2000, 275,
2165.
[23] C. A. Painter, A. Cruz, G. E. L�opez, L. J. Stern, Z. Zavala-Ruiz, PLoS One
2008, 3, e2403.
[24] H. J. C. Berendsen, D. van der Spoel, R. van Drunen, Comput. Phys.
Commun. 1995, 91, 43.
[25] W. Humphrey, A. Dalke, K. Schulten, J. Mol. Graph. 1996, 14, 33.
[26] M. Zacharias, S. Springer, Biophys. J. 2004, 87, 2203.
[27] J. K€astner, Wiley Interdiscip. Rev. Comput. Mol. Sci. 2011, 1, 932.
[28] Y. Duan, C. Wu, S. Chowdhury, M. C. Lee, G. Xiong, W. Zhang, R. Yang,
P. Cieplak, R. Luo, T. Lee, J. Caldwell, J. Wang, P. Kollman, J. Comput.
Chem. 2003, 24, 1999.
[29] W. L. Jorgensen, J. Chandrasekhar, J. D. Madura, R. W. Impey, M. L.
Klein, J. Chem. Phys. 1983, 79, 926.
[30] S. Nos�e, Mol. Phys. 1984, 52, 255.
[31] W. G. Hoover, Phys. Rev. A 1985, 31, 1695.
[32] M. Parrinello, A. Rahman, J. Appl. Phys. 1981, 52, 7182.
[33] S. Nos�e, M. L. Klein, Mol. Phys. 1983, 50, 1055.
[34] T. Darden, D. York, L. Pedersen, J. Chem. Phys. 1993, 98, 10089.
[35] D. H. de Jong, G. Singh, W. F. D. Bennett, C. Arnarez, T. A. Wassenaar,
L. V. Sch€afer, X. Periole, D. P. Tieleman, S. J. Marrink, J. Chem. Theory
Comput. 2013, 9, 687.
[36] X. Periole, M. Cavalli, S.-J. Marrink, M. A. Ceruso, J. Chem. Theory Com-
put. 2009, 5, 2531.
[37] J. A. Zarutskie, A. K. Sato, M. M. Rushe, I. C. Chan, A. Lomakin, G. B.
Benedek, L. J. Stern, Biochemistry (Mosc.) 1999, 38, 5878.
[38] C. A. Painter, M. P. Negroni, K. A. Kellersberger, Z. Zavala-Ruiz, J. E.
Evans, L. J. Stern, Proc. Natl. Acad. Sci. USA 2011, 108, 19329.
[39] H. J. C. Berendsen, In Computer Simulation in Materials Science; M.
Meyer, V. Pontikis, Eds.; Springer: Netherlands, 1991; pp. 139–155.
[40] H. J. C. Berendsen, J. P. M. Postma, W. F. van Gunsteren, A. DiNola, J. R.
Haak, J. Chem. Phys. 1984, 81, 3684.
[41] K. J. Huston, R. G. Larson, Langmuir 2015, 31, 7503.
[42] S. Genheden, U. Ryde, J. Comput. Chem. 2010, 31, 837.
[43] A. Laio, M. Parrinello, Proc. Natl. Acad. Sci. USA 2002, 99, 12562.
[44] A. Laio, F. L. Gervasio, Rep. Prog. Phys. 2008, 71, 126601.
[45] G. Bussi, F. L. Gervasio, A. Laio, M. Parrinello, J. Am. Chem. Soc. 2006,
128, 13435.
[46] B. Ensing, M. De Vivo, Z. Liu, P. Moore, M. L. Klein, Acc. Chem. Res.
2006, 39, 73.
[47] T. Mandal, R. L. Marson, R. G. Larson, Soft Matter 2016, 12, 8246.
[48] S. J. Marrink, H. J. Risselada, S. Yefimov, D. P. Tieleman, A. H. de Vries,
J. Phys. Chem. B 2007, 111, 7812.
[49] F. Wen, O. Esteban, H. Zhao, J. Immunol. Methods 2008, 336, 37.
Received: 17 January 2017Revised: 21 April 2017Accepted: 6 May 2017Published online on 28 June 2017
FULL PAPERWWW.C-CHEM.ORG
Journal of Computational Chemistry 2017, 38, 2007–2019 2019


![RESEARCH ARTICLE Open Access Comprehensive analysis of MHC ... · tide presentation by the classical MHC class II molecules [1,2]. A newly synthesized classical MHC class II mol-ecule,](https://static.fdocuments.net/doc/165x107/5f7f16d4b027dd7008560d94/research-article-open-access-comprehensive-analysis-of-mhc-tide-presentation.jpg)