“Efficient bifunctional gallium-68 chelators for … bifunctional gallium-68 chelators for...
41
Supplementary Material (ESI) for Chemical Communications This journal is (c) The Royal Society of Chemistry 2011 Efficient bifunctional gallium-68 chelators for positron emission tomography: tripodal tris(hydroxypyridinone) ligands. David J. Berry a , Yongmin Ma a,b , James R. Ballinger a , Richard Tavaré a , Alexander Koers a , Kavitha Sunassee a , Tao Zhou b , Saima Nawaz a , Gregory E. D. Mullen a , Robert C. Hider b , and Philip J. Blower a * King’s College London. a Division of Imaging Sciences and Biomedical Engineering, The Rayne Institute, St Thomas’ Hospital, London, SE1 7EH, UK. b Institute of Pharmaceutical Science, Franklin Wilkins Building, London, SE1 9NH, UK. Supporting Information 1. Chemical syntheses. Page S2 2. High resolution LC-MS analysis of CP256, Ga-CP256 and Fe-CP256. Page S10 3. HPLC of non-radioactive Ga-CP256 and 67 Ga-CP256 complexes. Page S15 4. Protocol for 68 Ga radiolabelling for titration studies. Page S17 5. Protocol for 67 Ga radiolabelling for titration studies. Page S21 6. Measuring stability in human serum. Page S24 7. Measuring stability in human apo-transferrin solution. Page S27 8. Conjugation of YM-103-chlorosuccinimide or YM-103 with C2Ac protein, Radiolabelling radiolabelling and in vitro functional assay. Page S33 9. In vivo imaging studies of bioconjugate. Page S40 S1 Electronic Supplementary Material (ESI) for Chemical Communications This journal is © The Royal Society of Chemistry 2011
-
Upload
hoangtuyen -
Category
Documents
-
view
229 -
download
0
Transcript of “Efficient bifunctional gallium-68 chelators for … bifunctional gallium-68 chelators for...
Supplementary Material (ESI) for Chemical Communications This journal is (c) The Royal Society of Chemistry 2011 Efficient bifunctional gallium-68 chelators for positron emission tomography: tripodal tris(hydroxypyridinone) ligands. David J. Berrya, Yongmin Maa,b, James R. Ballingera, Richard Tavaréa, Alexander Koersa, Kavitha Sunasseea, Tao Zhoub, Saima Nawaza, Gregory E. D. Mullena, Robert C. Hiderb, and Philip J. Blowera* King’s College London. a Division of Imaging Sciences and Biomedical Engineering, The Rayne Institute, St Thomas’ Hospital,
London, SE1 7EH, UK. b Institute of Pharmaceutical Science, Franklin Wilkins Building, London, SE1 9NH, UK. Supporting Information 1. Chemical syntheses. Page S2
2. High resolution LC-MS analysis of CP256, Ga-CP256 and Fe-CP256. Page S10
3. HPLC of non-radioactive Ga-CP256 and 67Ga-CP256 complexes. Page S15
4. Protocol for 68Ga radiolabelling for titration studies. Page S17
5. Protocol for 67Ga radiolabelling for titration studies. Page S21
6. Measuring stability in human serum. Page S24
7. Measuring stability in human apo-transferrin solution. Page S27
8. Conjugation of YM-103-chlorosuccinimide or YM-103 with C2Ac
protein, Radiolabelling radiolabelling and in vitro functional assay. Page S33
9. In vivo imaging studies of bioconjugate. Page S40
S1
Electronic Supplementary Material (ESI) for Chemical CommunicationsThis journal is © The Royal Society of Chemistry 2011

1. Chemical syntheses
Methods CP256
O
OOH
OHO
OOH
ClO
OOH
O
OOH
OH
O
O
OH
OBn
O
O
O
OBn
O N
O
O
OBn
O
N
O
OH
OBn
NN
OOBn O
O
N
OOBn
NH2
Scheme S1. Synthesis of 2-amido-3-hydroxypyridin-4-one 19 and the intermediates 13-18.
Materials and methods: (a) SOCl2, 25oC; (b) Zn/HCl, H2O, 70oC; (c) HCHO, NaOH, H2O, 25oC;
(d) BnBr, NaOH, CH3OH/H2O, 70oC; (e) dihydropyran, p-toluenesulphonic acid, CH2Cl2, 25oC;
(f) NH2CH3/H2O, EtOH, 80oC; (g) HCl, EtOH, 80oC; (h) Ph3P, DIAD, phthalimide, THF, 0-
25oC; (i) NH2NH2/H2O, EtOH, 80oC.
13 14 15
(a) (b) (c) (d)
(f)
16
(g)
(h) (i)
12
17 19
18
S2
Electronic Supplementary Material (ESI) for Chemical CommunicationsThis journal is © The Royal Society of Chemistry 2011

OO O
Scheme S2. Synthesis of tripodal chelator CP256 (9). Materials and methods: (a) Triton B, Tert-
butyl acrylate, DME, 70oC; (b) T-1 Raney Ni, H2, 25oC, EtOH; (c) CH3COCl, Et3N, CH2Cl2, 0-
25oC, (d) HCOOH; (e) 19, DCCI, HoBt, DMF 25oC; (f) Pd/C, H2, HCl, CH3OH, 25oC.
YM-103
HN
O
NHH2N
O
N
OBnO
HN
O
NHN
H
O
N
O
BnOO
N
O
O
HN
O
NHN
H
O
N
O
HOO
N
O
OCl
NCOOH
O
O
N
O
O
O
ON
O
OH2N
COOH
HN
O
NHN
H
O
N
O
HOO
N
O
O
3
3
3
a b c
d
26 27
28 =
29
30
25
3
10
e
Scheme S3: Synthesis of maleimide linked hexadentate chelator 10. a) maleic anhydride/DMF; b)
DCC/NHS/DMF; c) 28/DMF; d) BCl3/DCM; e) Et3N/DCM.
O2N
O
OtBu
OtBu
OtBuO
NH2
O
OtBu
OtBu
OtBuO
N
O
OtBu
OtBu
O
OtBuO
HCH3
N
O
OH
OHO
OHO
H
O
CH3
N
ON
N
O
N
N
O
N
N
O
O
O
H
O
CH3
H
HH
BnO
BnO
OBn
20 21 22
23
24
(a) (b) (c) (d)
(e) (f)
9
NO2CH3
OH
(CP256)
N+
OHN
N+
OH
OH
N
N+
OH
NO
N
O
O
H
O
CH3
H Cl
H
OH
H(60)
Cl
Cl
S3
Electronic Supplementary Material (ESI) for Chemical CommunicationsThis journal is © The Royal Society of Chemistry 2011

Scheme S1
Intermediates 13-16 [1], 17-19 [2] and 20-21 [3] and were synthesised by previously described
literature methods.
Scheme S2
4-Acetylamino-4-(2-tert-butoxycarbonyl-ethyl)-heptanedioic acid di-tert-butyl ester (22)
To 5 ml CH2Cl2 was added 1 g of triester 21 (2.4 mmol, 1 equiv) and 0.3 g triethylamine (2.9 mmol,
1.2 equiv.) The solution was cooled to 0oC with an ice bath and 0.23 g acetyl chloride (2.9 mmol,
1.2 equiv) was added dropwise. The solution was stirred for a further 4 hours and allowed to warm
slowly to room temperature. The solution was poured into a separating funnel and washed with 2 X
15 ml HCl (5% aqueous) and 1 X 15 ml concentrated NaCl. The solution was dried over Na2SO4
and the solvent was removed in vacuo. The residue was dissolved in minimal EtOAc and loaded
onto a silica column, where it was purified by column chromatography with EtOAc and hexane
(1:1) to give 0.79 g of a white solid in 72% yield. 1H NMR (DMSO-d6) σ 7.2 (s, 1H [CONH]) 2.0 (m, 6H [CH2-CH2-COO-tbu]3) 1.8 (s, 3H [CH3-
CO]) 1.7 (m, 6H [CH2-CH2-COO-tbu]3) 1.35 (s, 27H [CH2-CH2-COO-tbu]3)
m/z 458 (M+H)+ 475 (M+NH4)+ [ES+]
4-Acetylamino-4-(2-carboxy-ethyl)-heptanedioic acid (23)
1.5 g of triester 22 (3.28 mmol) was added to 20 ml formic acid (96%) and stirred for 4 hours.
After this time the formic acid was removed by azeotropic distillation with 5 X 20 ml portions of
toluene. The crude residue was recrystallised from EtOH and petroleum spirit to give 0.9 g of off-
white crystals in 93% yield. 1H NMR (DMSO-d6) σ 12 (s, 3H [CH2-COOH]) 7.2 (s, 1H [N-H]) 2.1 (m, 6H [CH2-CH2-
COOH]3) 1.8 (m, 6H [CH2-CH2-COO-tbu]3) 1.7 (s, 3H [CH3-CO])
m/z 290 (M+H)+ [ES+]
S4
Electronic Supplementary Material (ESI) for Chemical CommunicationsThis journal is © The Royal Society of Chemistry 2011
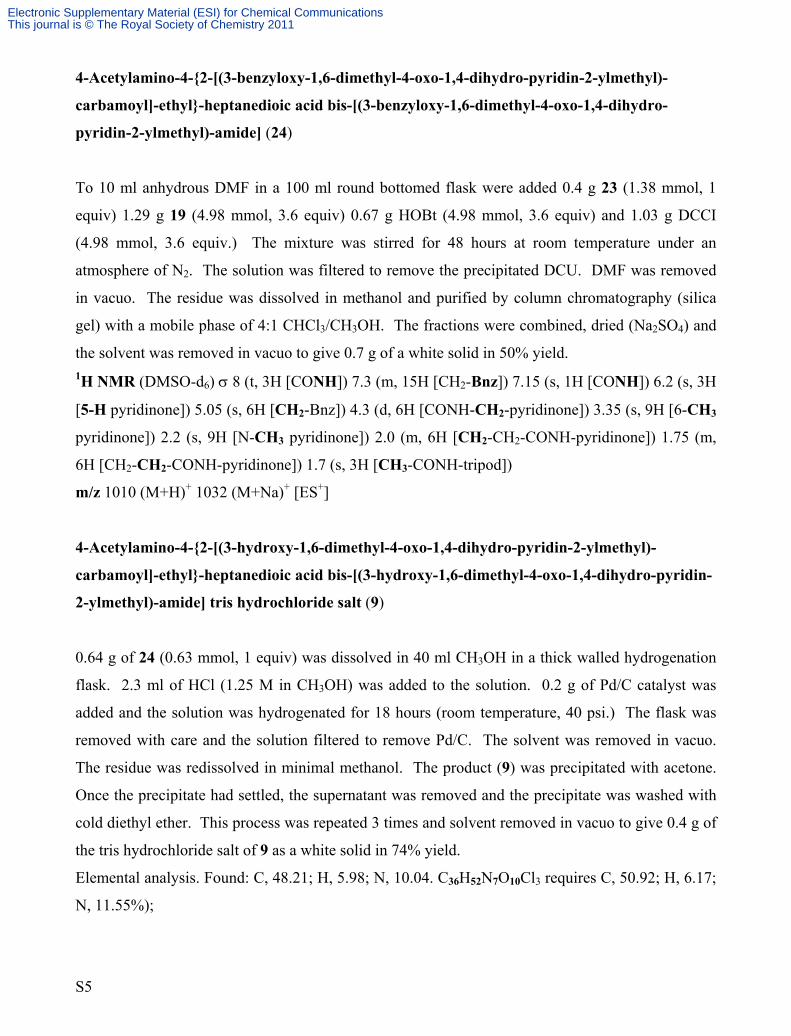
4-Acetylamino-4-{2-[(3-benzyloxy-1,6-dimethyl-4-oxo-1,4-dihydro-pyridin-2-ylmethyl)-
carbamoyl]-ethyl}-heptanedioic acid bis-[(3-benzyloxy-1,6-dimethyl-4-oxo-1,4-dihydro-
pyridin-2-ylmethyl)-amide] (24)
To 10 ml anhydrous DMF in a 100 ml round bottomed flask were added 0.4 g 23 (1.38 mmol, 1
equiv) 1.29 g 19 (4.98 mmol, 3.6 equiv) 0.67 g HOBt (4.98 mmol, 3.6 equiv) and 1.03 g DCCI
(4.98 mmol, 3.6 equiv.) The mixture was stirred for 48 hours at room temperature under an
atmosphere of N2. The solution was filtered to remove the precipitated DCU. DMF was removed
in vacuo. The residue was dissolved in methanol and purified by column chromatography (silica
gel) with a mobile phase of 4:1 CHCl3/CH3OH. The fractions were combined, dried (Na2SO4) and
the solvent was removed in vacuo to give 0.7 g of a white solid in 50% yield. 1H NMR (DMSO-d6) σ 8 (t, 3H [CONH]) 7.3 (m, 15H [CH2-Bnz]) 7.15 (s, 1H [CONH]) 6.2 (s, 3H
[5-H pyridinone]) 5.05 (s, 6H [CH2-Bnz]) 4.3 (d, 6H [CONH-CH2-pyridinone]) 3.35 (s, 9H [6-CH3
pyridinone]) 2.2 (s, 9H [N-CH3 pyridinone]) 2.0 (m, 6H [CH2-CH2-CONH-pyridinone]) 1.75 (m,
6H [CH2-CH2-CONH-pyridinone]) 1.7 (s, 3H [CH3-CONH-tripod])
m/z 1010 (M+H)+ 1032 (M+Na)+ [ES+]
4-Acetylamino-4-{2-[(3-hydroxy-1,6-dimethyl-4-oxo-1,4-dihydro-pyridin-2-ylmethyl)-
carbamoyl]-ethyl}-heptanedioic acid bis-[(3-hydroxy-1,6-dimethyl-4-oxo-1,4-dihydro-pyridin-
2-ylmethyl)-amide] tris hydrochloride salt (9)
0.64 g of 24 (0.63 mmol, 1 equiv) was dissolved in 40 ml CH3OH in a thick walled hydrogenation
flask. 2.3 ml of HCl (1.25 M in CH3OH) was added to the solution. 0.2 g of Pd/C catalyst was
added and the solution was hydrogenated for 18 hours (room temperature, 40 psi.) The flask was
removed with care and the solution filtered to remove Pd/C. The solvent was removed in vacuo.
The residue was redissolved in minimal methanol. The product (9) was precipitated with acetone.
Once the precipitate had settled, the supernatant was removed and the precipitate was washed with
cold diethyl ether. This process was repeated 3 times and solvent removed in vacuo to give 0.4 g of
the tris hydrochloride salt of 9 as a white solid in 74% yield.
Elemental analysis. Found: C, 48.21; H, 5.98; N, 10.04. C36H52N7O10Cl3 requires C, 50.92; H, 6.17;
N, 11.55%);
S5
Electronic Supplementary Material (ESI) for Chemical CommunicationsThis journal is © The Royal Society of Chemistry 2011

1H NMR (DMSO-d6) σ 8.8 (t, 3H [CONH]) 7.25 (s, 1H [CONH]) 7.1 (s, 3H [5-H pyridinone]) 4.5
(d, 6H [CONH-CH2-pyridinone]) 3.8 (s, 9H [6-CH3 pyridinone]) 2.55 (s, 9H [N-CH3 pyridinone])
2.1 (m, 6H [CH2-CH2-CONH-pyridinone]) 1.8 (m, 6H [CH2-CH2-CONH-pyridinone]) 1.7 (s, 3H
[CH3-CONH-tripod]) 13C NMR (DMSO-d6) σ 21.0 (CH3), 24.0 (CH3CO), 29.8 (CCH2CH2), 30.5 (CCH2CH2), 35.2
(NHCH2), 39.2 (NCH3), 57.2 (NHC), 113.2 (C-5H in pyridinone), 139.4 (C-2 in pyridinone), 143.5
(C-3 in pyridinone), 148.8 (C-6 in pyridinone), 161.1 (C-4 in pyridinone), 169.4 (CH3CO), 173.8
(CONH).
m/z 740.3631 (M+H)+ (10% rel. abundance) 370.6843 (M+2H)2+ (100% rel. abundance) HRMS
[ES+]
00"00 05'00 10'00 15'00 20'00 25'00 min
UV_A
00"00 05'00 10'00 15'00 20'00 25'00 min
0
50
100
150
200
mAU
Figure S1. HPLC trace of CP256 ligand.
Scheme S3
The synthesis of compound 28 has been reported previously. [4]
Succinimido 3-maleimidopropanoate (27)
A solution of β-Alanine (1.8 g, 20 mmol) and maleic anhydride (2 g, 20 mmol) in DMF (30 mL)
was stirred at room temperature for 3h. After the solid was completely dissolved, N-
hydroxysuccinimide (NHS; 2.3 g, 20 mmol) and dicyclohexylcarbodiimide (DCC; 4.6 g, 24 mmol)
was added into the solution and the mixture was stirred at room temperature overnight. The solution
S6
Electronic Supplementary Material (ESI) for Chemical CommunicationsThis journal is © The Royal Society of Chemistry 2011

was filtered and the precipitate was washed with water (100 ml) and dichloromethane (100 ml). The
filtrate was collected and the organic layer was washed with 3x50 ml 5% NaHCO3 and one time
with brine. The organic layer was dried with Na2SO4 and dichloromethane removed under reduced
pressure to obtain a white solid (55%). This solid does not need further purification and can be
directly used for next coupling step. 1H NMR (CDCl3, 400MHz): δ 2.82 (s, 4H, two succinimido-
CH2), 3.02 (t, J=7.0 Hz, 2H, COCH2), 3.94 (t, J=7.0 Hz, 2H, NCH2), 6.74 (s, 2H, two CH).
Synthesis of compound 29:
The activated acid 27 (6 mmol) and amine 28 (5 mmol) in anhydrous DMF (50 ml) was stirred at
room temperature for one day. The solvent was removed under reduced pressure and the residue
was purified on a silica gel column using chloroform:methanol (8:2) as an eluent to afford a white
foam (81%). 1H NMR (CDCl3, 400MHz): δ 2.05 (brs, 6H, CH2), 2.15 (s, 9H, CH3), 2.23 (brs, 2H, CH2), 2.29
(brs, 6H, CH2), 2.41 (t, J=6.6 Hz, 2H, CH2), 3.32 (brs, 2H, CH2), 3.36 (s, 9H, CH3), 3.73 (t, J=6.6
Hz, 2H, CH2), 4.35 (s, 6H, CH2), 4.87 (s, 6H, CH2), 6.10 (s, 3H, CH), 6.65 (s, 2H, CH), 6.76 (brs,
1H, NH), 7.23-7.30 (m, 15H, ArH), 7.72 (brs, 3H, NH). 13C NMR (CDCl3, 100MHz): 20.81 (CH3),
30.70 (CH2), 31.71 (CH2), 34.43 (CH2), 34.62 (CH2), 34.82 (CH2), 36.31 (CH3), 36.68 (CH2),
57.99, 73.42 (CH2), 118.25 (CH), 128.30 (CH), 128.52 (CH), 128.58 (CH), 134.23 (CH), 136.97,
141.05, 146.35, 148.04, 170.43, 170.66, 171.70, 173.10, 173.23.
ESI-MS: 1190.40 (M+1)+
Synthesis of compound 30:
The benzyl protecting compound 29 in anhydrous DCM under N2 was added boron trichloride (12
equiv) in ice-bath and the mixture was stirred at room temperature for 2 days. The excess BCl3 was
quenched by adding MeOH and followed by 1 mL concentrated hydrochloric acid. The mixture was
evaporated to obtain brown solid, which dissolved in methanol and precipitated with the addition of
acetone. This procedure was repeated three times to afford white solid (72%). 1H NMR (DMSO-d6, 400MHz): δ 1.75-1.84 (m, 6H, CH2), 2.08-2.13 (m, 6H, CH2), 2.21 (t, J=7.1
Hz, 2H, CH2), 2.32 (t, J=7.5 Hz, 2H, CH2), 2.57 (s, 9H, CH3), 2.85 (dd, J=4.1, 8.3 Hz, 1H, one H of
maleic CH2), 3.16 (q, J=6.5 Hz, 2H, CH2), 3.34 (dd, J=8.5, 18.3Hz, 1H, one H of maleic CH2), 3.58
(t, J=7.5Hz, 2H, CH2), 3.89 (s, 9H, CH3), 4.57 (d, J=5.0 Hz, 6H, CH2), 4.99 (dd, J=4.1, 8.5 Hz, 1H
S7
Electronic Supplementary Material (ESI) for Chemical CommunicationsThis journal is © The Royal Society of Chemistry 2011

maleic CH), 7.28 (s, 3H, CH), 7.30 (brs, 1H, NH), 8.09 (t, J=5.6 Hz, 1H, NH), 8.92 (t, J=5.1 Hz,
3H, NH). 13C NMR (DMSO-d6, 100MHz): δ 20.56 (CH3), 29.26, (CH2), 29.98 (CH2), 32.67 (CH2), 34.71
(CH2), 35.27 (CH2), 35.58 (CH2), 35.83 (CH2), 39.00 (CH2), 39.05 (CH3), 49.82 (CH), 56.79,
112.73 (CH), 139.90, 142.69, 148.55, 159.59, 169.12, 170.08, 173.18, 173.36, 173.44.
ESI-MS: 956.27 (M+1)+.
HRMS: Calcd for C44H59ClN9O13 (M+1)+, 956.3921; Found, 956.3953.
Synthesis of compound 10:
Compound 30 (20 mg) in DCM (20 mL) was added excess Et3N and the mixture was stirred at
room temperature overnight. After evaporation to remove the solvent, the residue was loaded on a
solid phase extraction column by dissolving in 1ml 0.1% formic acid solution. The column was
firstly washed with 0.1% formic acid (10 mL) to remove triethylamine hydrochloride salt, followed
by elution with methanol (10 mL). The fraction of the methanol solution was concentrated and dried
by vacuum oven to yield a white powder (80%). 1H NMR (CD3OD, 400MHz): δ 1.94-2.03 (m, 6H, CH2), 2.20-2.29 (m, 6H, CH2), 2.32 (t, J=6.3 Hz,
2H, CH2), 2.38 (s, 9H, CH3), 2.42 (t, J=7.0 Hz, 2H, CH2), 3.31 (q, J=6.7 Hz, 2H, CH2), 3.66 (s, 9H,
CH3), 3.69 (t, J=7.1Hz, 2H, CH2), 4.58 (s, 6H, CH2), 5.25 (s, 3H, NH), 6.29 (s, 3H, CH), 6.81 (s,
2H, CH). 13C NMR (CD3OD, 100MHz): δ 21.03 (CH3), 30.11, (CH2), 31.48 (CH2), 35.43 (CH2), 35.69
(CH2), 36.02 (CH2), 37.21 (CH3), 37.49 (CH2), 59.17, 63.70 (CH2), 114.58 (CH), 129.59, 132.25,
135.57 (CH), 147.38, 148.87, 171.12, 172.26, 172.98, 173.33, 175.89.
ESI-MS: 920.33 (M+1)+.
HRMS: Calcd for C44H58N9O13 (M+1)+, 920.4154; Found, 920.4146. (100 % rel. abundance).
Equipment and consumables
All chemicals were purchased from Sigma Aldrich and Acros Organics and were reagent grade or
better. Solvents were purchased from Fisher Scientific, Sigma Aldrich and VWR. NMR solvents
were purchased from GOSS Scientific and NMR tubes were manufactured by Wilmad. Silica gel
for column chromatography were purchased from Merck. Solid phase extraction column was a
Phenomenex Strata C18-E, 500 mg size, 3 mL volume.
S8
Electronic Supplementary Material (ESI) for Chemical CommunicationsThis journal is © The Royal Society of Chemistry 2011

Samples were dried in a vacuum oven (Gallenkamp, rated to ≤ 250oC) connected to a vacuum pump
(BOC-Edwards.) Samples were hydrogenated on a Parr hydrogenator (room temperature) at 40 psi
with automatic shaking. Infrared Spectra were acquired on a Perkin Elmer Spectrum one FTIR
using KBr disks. The software used was called “Spectrum.” 1H-NMR spectra were acquired on a 400 MHz Ultra-sheild magnet (Bruker) and with XWin-NMR
software. Spectra were analysed on MestReNova sotware version 5.3 (Mestrelab Research). Mass
spectrometry samples were submitted to the EPSRC Mass Spectrometry Centre, Swansea or the
Mass Spectrometry facility, King’s College, London. Samples at EPSRC were run on a Waters
ZQ4000 quadrupole mass spectrometer (ESI), a Finnigan MAT 95 XP high resolution double
focusing mass spectrometer (EI, CI) or a Micromass Quattro II quadrupole mass spectrometer (EI).
Samples at King’s College were run on a Thermofisher LCQ DECA XP ion trap mass spectrometer.
High resolution LC-MS was performed at the Division of Imaging Sciences, King’s College,
London on an Agilent 6520 Accurate-Mass Q-TOF LC/MS connected to an Agilent 1200 HPLC
system with vacuum degasser, quaternary pump, variable wavelength detector and autosampler.
Isotopic distributions were calculated using Molecular Weight Calculator version 6.46. The
resulting graph data were extracted and processed in Microsoft Excel 2003.
HPLC analysis of the CP256 ligand was performed on Agilent 1200 series HPLC with quadrupole
pump, vacuum degasser, variable wavelength detector (14 μl standard loop, set to 254 nm) and
manual syringe injector (Rheodyne 7725i). The HPLC column was an Agilent Eclipse XDB-C18
(5 μm, 4.6 mm X 150 mm) with a guard column. The acquisition and analysis software was Gina
Star version 5.01 (Raytest). Flow rate was 1 ml/min.
Time (min)
A (%)
B (%)
0
95
5
2
95
5
15
5
95
20
5
95
25
95
5
Table S1. Gradient for HPLC analysis of CP256 ligand.
S9
Electronic Supplementary Material (ESI) for Chemical CommunicationsThis journal is © The Royal Society of Chemistry 2011

2. High resolution LC-MS analysis of CP256, Ga-CP256 and Fe-CP256
Results
Molecular formulas and calculated monoisotopic masses
CP256: C36 H49 N7 O10 (M = 739.3541)
Ga-CP256: C36 H46 N7 O10 Ga (M = 805.2562)
Fe-CP256: C36 H46 N7 O10 [56Fe] (M = 792.2656)
Sample
LC retention
time (mins)
Species
m/z
(calculated)
m/z
(found)
Relative
abundance
(%)
CP256
5.1
(M + H)+
740.3614
740.3618
10
(M + 2H)2+
370.6843
370.6858
100
Ga-CP256
5.3
(M + H)+
806.2635
806.2635
70
(M + Na)+
828.2454
828.2444
25
(M + 2H)2+
403.6354
403.6366
100
(M + H + Na)2+
414.6263
414.6268
50
(M + 2Na)2+
425.6173
425.6186
25
Fe-CP256
5.4
(M + H)+
793.2728
793.2741
55
(M + Na)+
815.2548
815.2559
15
(M + 2H)2+
397.1401
397.1424
100
(M + H + Na)2+
408.1310
408.1320
45
(M + 2Na)2+
419.1220
419.1230
22
Table S2. LC-MS results of CP256 and its Ga and Fe complexes.
S10
Electronic Supplementary Material (ESI) for Chemical CommunicationsThis journal is © The Royal Society of Chemistry 2011

Isotopic distribution modelling
Isotopic distribution for (C36H46N7O10Ga + H)+
Isotopic distribution for (C36H46N7O10Fe + H)+
m/z: Calculated/(found)
% Relative abundance: Calculated/(found)
m/z: Calculated/(found)
% Relative abundance: Calculated/(found)
806.2635/ (806.2635)
100.00/(100.00)
791.2775/ (791.2779)
6.33/(5.47)
807.2635/ (807.2655)
42.59/(41.73)
792.2775/ (792.2768)
2.69/(2.92)
808.2635/ (808.2634)
77.28/(76.99)
793.2775/ (793.2741)
100/(100)
809.2635/ (809.2653)
30.34/(29.20)
794.2775/ (794.2765)
44.72/(42.20)
810.2635/ (810.2670)
7.56/(7.36)
795.2775/ (795.2782)
12.14/(10.88)
Isotopic distribution for (C36H49N7O10 + 2H)2+
m/z: Calculated/(found)
% Relative abundance: Calculated/(found)
370.6843/ (370.6858)
100.00/(100)
371.1843/ (371.1869)
42.64/(51.38)
371.6843/ (371.6887)
10.93/(14.26)
Table S3. Calculated and experimental isotopic distributions of Ga-CP256 and Fe-CP256 and the CP256 ligand.
S11
Electronic Supplementary Material (ESI) for Chemical CommunicationsThis journal is © The Royal Society of Chemistry 2011

5x10
0
0.2
0.4
0.6
0.8
1
1.2
1.4
1.6
1.8
2
2.2
2.4
2.6
2.8
3
3.2
3.4
3.6
+ESI Scan (5.288 min) Frag=100.0V 14082010 Ga-CP256 run 1.d
806.2635
808.2634
807.2655
809.2653
810.2670
Counts (%) vs. Mass-to-Charge (m/z)801 802 803 804 805 806 807 808 809 810 811 812 813 814 815 816
Figure S2. Mass spectrum showing (M + H)+ where M = Ga-CP256
Figure S3. Mass spectrum showing (M + H)+ where M = Fe-CP256
S12
Electronic Supplementary Material (ESI) for Chemical CommunicationsThis journal is © The Royal Society of Chemistry 2011

6x10
0
0.2
0.4
0.6
0.8
1
1.2
1.4
1.6
1.8
2
2.2
2.4
2.6
2.8
3
3.2
3.4
3.6
3.8
4
4.2
4.4
4.6
4.8
5
5.2
5.4
+ESI Scan (5.087 min) Frag=100.0V 14082010 CP256 run 1.d
370.6858
371.1869
371.6887
372.1898372.6903369.6786 370.1797 373.1874 374.6805369.1882368.2716 375.1842
Counts (%) vs. Mass-to-Charge (m/z)368 368.5 369 369.5 370 370.5 371 371.5 372 372.5 373 373.5 374 374.5 375 375.5
Figure S4. Mass spectrum showing (M + 2H)2+ where M = CP256
Methods
Preparation of complexes:
Ga-CP256
1 mg CP256 was dissolved in 1 ml methanol to give a ligand concentration of 1.18 mM (based on
tris HCl of CP256 with RMM of 848.) This solution was added to 0.3 mg Ga(NO3)3 (RMM 255,
anhydrous basis) to give a 1:1 metal to ligand stoichiometry at a concentration of 1.18 mM.
Fe-CP256
The Fe3+ complex was produced in an analogous procedure to the Ga3+ complex, but with
Fe(NO3)3.9H2O (RMM = 386) as the metal source.
Equipment and consumables
Samples were analysed by high resolution LC-MS. The HPLC system was an Agilent 1200 system
with vacuum degasser, quaternary pump, variable wavelength detector (14 μl standard loop), and an
autosampler. The mass spectrometer was an Agilent 6520 Accurate-Mass Q-TOF LC/MS.
Samples were acquired using Agilent Masshunter workstation acquisition software (B.02.01) and
S13
Electronic Supplementary Material (ESI) for Chemical CommunicationsThis journal is © The Royal Society of Chemistry 2011

data was analysed using Agilent Masshunter Qualitative analysis software (B.02.00). The HPLC
column used was an Agilent Zorbax SB C18 cartridge column (2.1mm X 30mm, 3.5 μm.)
Following chromatography, the column eluant was split, with 90% passing to the VWD and 10%
passing to the mass spectrometer. The gradient was operated at 0.5 ml/min and the mobile phase
was a gradient using mass spectrometry grade reagents: A = H2O + 0.1% formic acid (Fluka,
34673) and B = methanol + 0.1 % formic acid (Fluka, 34671). The gradient is given in Table S3.
Spectra were acquired using electrospray ionisation in positive mode using reference mass
correction with hexakis(1H,1H,3H-tetrafluoropropoxy)phosphazine (C18 H18 N3 O6 P3 F24, m/z =
922.0098 [M + H]+). The cone voltage was 100V. Isotopic distributions were calculated using
Molecular Weight Calculator version 6.46.
Time (min)
A (%)
B (%)
0
95
5
1
95
5
10
5
95
20
5
95
23
95
5
30
95
5
Table S4. Gradient for LC-MS analysis of CP256 and the Fe3+ and Ga3+ complexes.
S14
Electronic Supplementary Material (ESI) for Chemical CommunicationsThis journal is © The Royal Society of Chemistry 2011

3. HPLC of non-radioactive Ga-CP256 and 67Ga-CP256 complexes.
Figure S5. HPLC traces showing 67Ga-CP256 complex (A) and non-radioactive Ga-CP256
complex (B) The slight difference in retention times is due to the length of tubing between UV and
radioactivity detectors. (80 cm tube length, 0.5 mm OD, leading to a volume in the tubing of 0.16
ml and a time delay of ~ 9-10 seconds).
Preparation of Radioactive 67Ga-CP256 complex for HPLC
A 0.1 mg/ml solution of CP256 in PBS was prepared. To 100 μl of this solution was added 10 μl
(~1 MBq) 67Ga-citrate solution. After 1 min 20 μl of this solution was withdrawn with an HPLC
syringe and injected into the HPLC.
0:00 5:00 10:00 15:00 20:00 mm:ss
0.0
50.0
100.0
150.0
200.0
250.0
mAU
0:00 5:00 10:00 15:00 20:00 mm:ss
0.0
200.0
400.0
600.0
800.0
1000.0
cps
A
B
06:42 (mm:ss)
06:32 (mm:ss)
S15
Electronic Supplementary Material (ESI) for Chemical CommunicationsThis journal is © The Royal Society of Chemistry 2011

Equipment, gradient and conditions.
HPLC analysis was carried out on an Agilent 1200 series HPLC with quadrupole pump, vacuum
degasser, variable wavelength detector (14 μl standard loop, set to 254 nm), gamma detector
(Bioscan FC3600) and manual syringe injector (Rheodyne 7725i). The HPLC column used for all
analyses was an Agilent Eclipse XDB-C18 (5 μm, 4.6 mm X 150 mm) with a guard column. The
analytical software used for radio-TLC and radio-HPLC acquisition and analysis was Laura
4.0.2.75 (Lablogic).
Linear gradient of 10% B at 0 minutes to 90% B at 15 minutes. (A = 0.1% TFA in H2O, B = 0.1%
TFA in methanol.) The flow rate was 1 ml/min. 67Ga for radiolabelling was 67Ga-citrate solution for injection (Mallinckrodt Medical) 74 MBq/ml
(at ref. date; contains 6.5 mM sodium citrate, 135 mM NaCl, 0.9% Benzyl alcohol)
S16
Electronic Supplementary Material (ESI) for Chemical CommunicationsThis journal is © The Royal Society of Chemistry 2011

4. Protocol for 68Ga radiolabelling for titration studies
Results
Ligand conc.
Radiochemical yield (%)
DOTA
HBED
p-SCN-Bn-NOTA
CP256
1 mM
99.0
99.6
99.2
100.0
100 μM
100.0
99.7
99.3
100.0
10 μM
95.3
95.9
80.1
98.3
1 μM
7.4
35.8
3.7
72.9
100 nM
0.4
8.1
0.3
8.3
Table S5. Radiolabelling yields (determined by ITLC) for 68Ga-complexes.
Methods
Preparation of ligands.
1 mM solutions of DOTA, CP256, HBED and p-SCN-Bn-NOTA were prepared in H2O. These
solutions were successively diluted tenfold from the 1 mM solutions to produce solutions with
concentrations of 100 μM, 10 μM, 1 μM and 100 nM. 100 μl aliquots of each of these 5 solutions
(including the 1 mM solution) were placed into separate 1 ml plastic tubes. The samples were then
lyophilised, resulting in 5 tubes for each ligand containing between 10 pmol and 100 nmol ligand.
Purification of 68Ga from 68Ge/68Ga generator.
The 68Ge/68Ga generator was eluted with 6 ml 0.1 N HCl, and the 2 ml containing the peak
radioactivity was taken for purification, as follows.
A SAX column (Chromafix, Macherey Nagel) was equilibrated with 2 ml H2O and dried with 10 ml
air through a syringe. To 2 ml of the generator eluate (60 MBq in 0.1 ml HCl) was added 1.5 ml of
a 36% solution of HCl to give a ~4 M solution with regard to HCl. The 3.5 ml eluate was loaded
onto the SAX column at a rate of 2 ml/min and the column dried with 10 ml air. 100% of the
radioactivity was retained by the column. The column was washed with 300 μl of 5 M NaCl
S17
Electronic Supplementary Material (ESI) for Chemical CommunicationsThis journal is © The Royal Society of Chemistry 2011
solution, with 3 MBq (5%) of the total activity eluted from the column. The column was then
eluted with 250 μl H2O. 28 MBq (45%) of the radioactivity eluted and the solution pH was ~3.
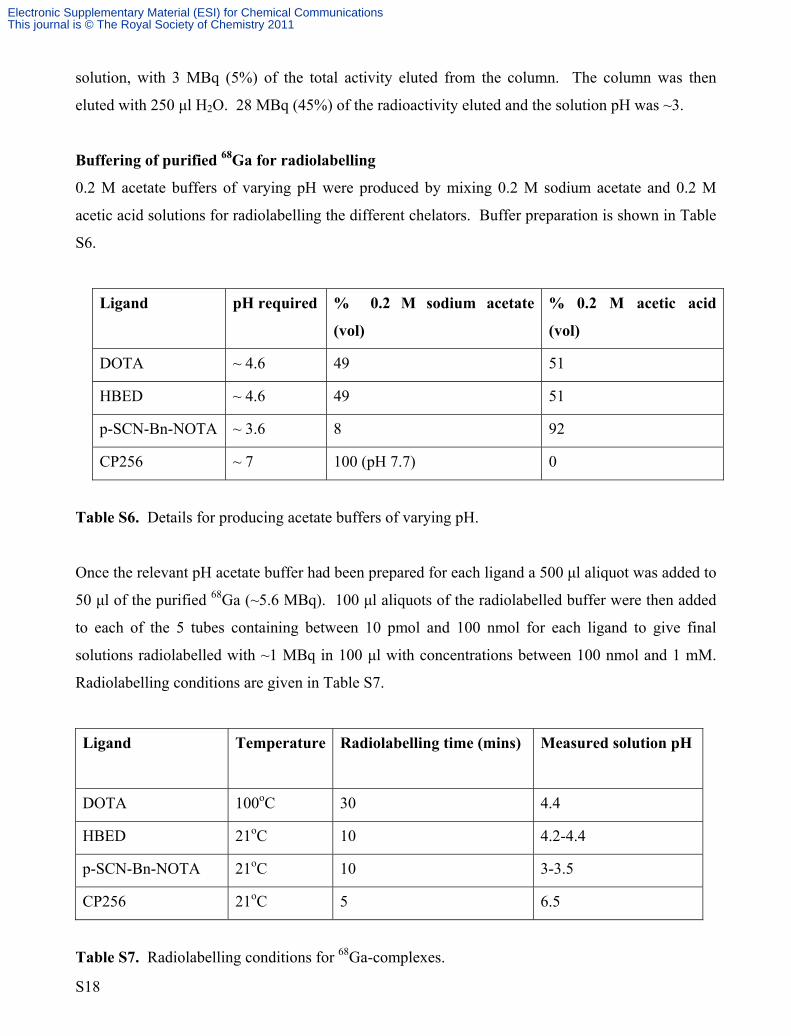
Buffering of purified 68Ga for radiolabelling
0.2 M acetate buffers of varying pH were produced by mixing 0.2 M sodium acetate and 0.2 M
acetic acid solutions for radiolabelling the different chelators. Buffer preparation is shown in Table
S6.
Ligand
pH required
% 0.2 M sodium acetate
(vol)
% 0.2 M acetic acid
(vol)
DOTA
~ 4.6
49
51
HBED
~ 4.6
49
51
p-SCN-Bn-NOTA
~ 3.6
8
92
CP256
~ 7
100 (pH 7.7)
0
Table S6. Details for producing acetate buffers of varying pH.
Once the relevant pH acetate buffer had been prepared for each ligand a 500 μl aliquot was added to
50 μl of the purified 68Ga (~5.6 MBq). 100 μl aliquots of the radiolabelled buffer were then added
to each of the 5 tubes containing between 10 pmol and 100 nmol for each ligand to give final
solutions radiolabelled with ~1 MBq in 100 μl with concentrations between 100 nmol and 1 mM.
Radiolabelling conditions are given in Table S7.
Ligand
Temperature
Radiolabelling time (mins)
Measured solution pH
DOTA
100oC
30
4.4
HBED
21oC
10
4.2-4.4
p-SCN-Bn-NOTA
21oC
10
3-3.5
CP256
21oC
5
6.5
Table S7. Radiolabelling conditions for 68Ga-complexes.
S18
Electronic Supplementary Material (ESI) for Chemical CommunicationsThis journal is © The Royal Society of Chemistry 2011
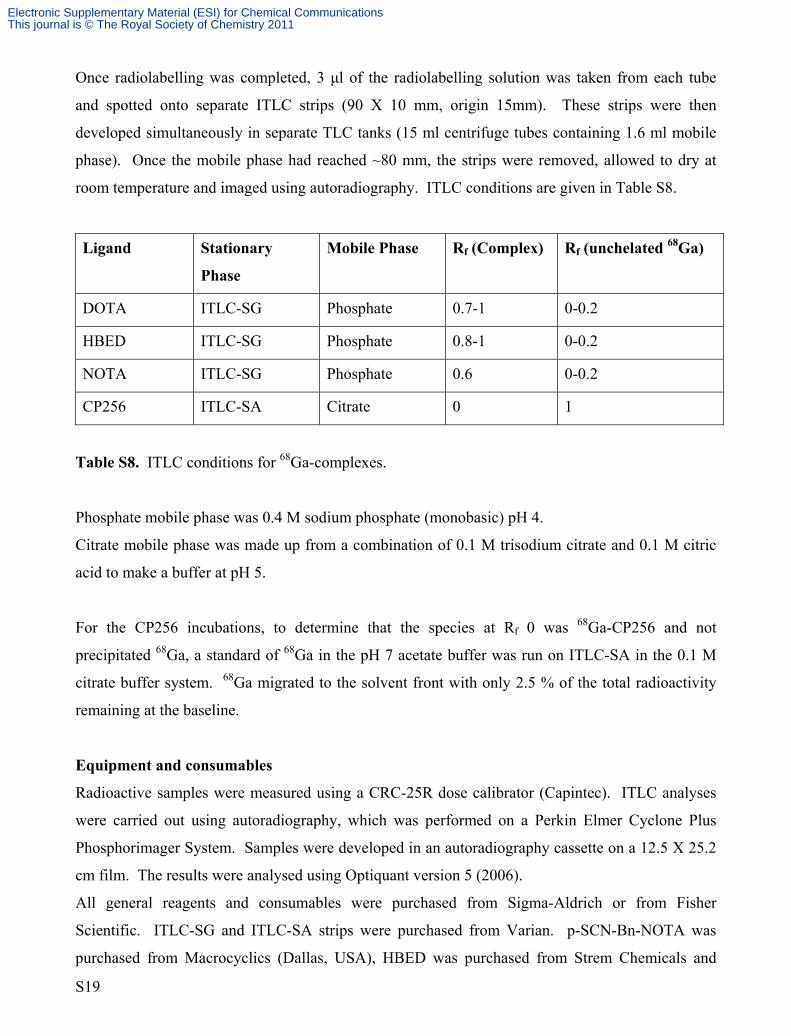
Once radiolabelling was completed, 3 μl of the radiolabelling solution was taken from each tube
and spotted onto separate ITLC strips (90 X 10 mm, origin 15mm). These strips were then
developed simultaneously in separate TLC tanks (15 ml centrifuge tubes containing 1.6 ml mobile
phase). Once the mobile phase had reached ~80 mm, the strips were removed, allowed to dry at
room temperature and imaged using autoradiography. ITLC conditions are given in Table S8.
Ligand
Stationary
Phase
Mobile Phase
Rf (Complex)
Rf (unchelated 68Ga)
DOTA
ITLC-SG
Phosphate
0.7-1
0-0.2
HBED
ITLC-SG
Phosphate
0.8-1
0-0.2
NOTA
ITLC-SG
Phosphate
0.6
0-0.2
CP256
ITLC-SA
Citrate
0
1
Table S8. ITLC conditions for 68Ga-complexes.
Phosphate mobile phase was 0.4 M sodium phosphate (monobasic) pH 4.
Citrate mobile phase was made up from a combination of 0.1 M trisodium citrate and 0.1 M citric
acid to make a buffer at pH 5.
For the CP256 incubations, to determine that the species at Rf 0 was 68Ga-CP256 and not
precipitated 68Ga, a standard of 68Ga in the pH 7 acetate buffer was run on ITLC-SA in the 0.1 M
citrate buffer system. 68Ga migrated to the solvent front with only 2.5 % of the total radioactivity
remaining at the baseline.
Equipment and consumables
Radioactive samples were measured using a CRC-25R dose calibrator (Capintec). ITLC analyses
were carried out using autoradiography, which was performed on a Perkin Elmer Cyclone Plus
Phosphorimager System. Samples were developed in an autoradiography cassette on a 12.5 X 25.2
cm film. The results were analysed using Optiquant version 5 (2006).
All general reagents and consumables were purchased from Sigma-Aldrich or from Fisher
Scientific. ITLC-SG and ITLC-SA strips were purchased from Varian. p-SCN-Bn-NOTA was
purchased from Macrocyclics (Dallas, USA), HBED was purchased from Strem Chemicals and
S19
Electronic Supplementary Material (ESI) for Chemical CommunicationsThis journal is © The Royal Society of Chemistry 2011
DOTA was purchased from Sigma Aldrich. 5 M NaCl solution was purchased from Sigma Aldrich.
SAX cartridges (SAX SPEC, Chromafix 30-PS-HCO3, 45mg) were purchased from Macherey-
Nagel, Germany. 68Ge/68Ga generator was an Eckert & Ziegler IGG100, 1.1 GBq nominal activity.
The pH of buffers was determined using a pH 0-14 glass electrode (Denver Instruments) connected
to a Denver Ultrabasic pH meter. The pH meter was calibrated using mercury free buffer solutions,
pH 4.00, 7.00 and 10.00 (Reagecon). The pH of radioactive samples was determined using pH
strips with ranges of 0-14 (Fisher), 3.8-5.5 (Fluka) and 6.0-8.1 (Fluka).
S20
Electronic Supplementary Material (ESI) for Chemical CommunicationsThis journal is © The Royal Society of Chemistry 2011
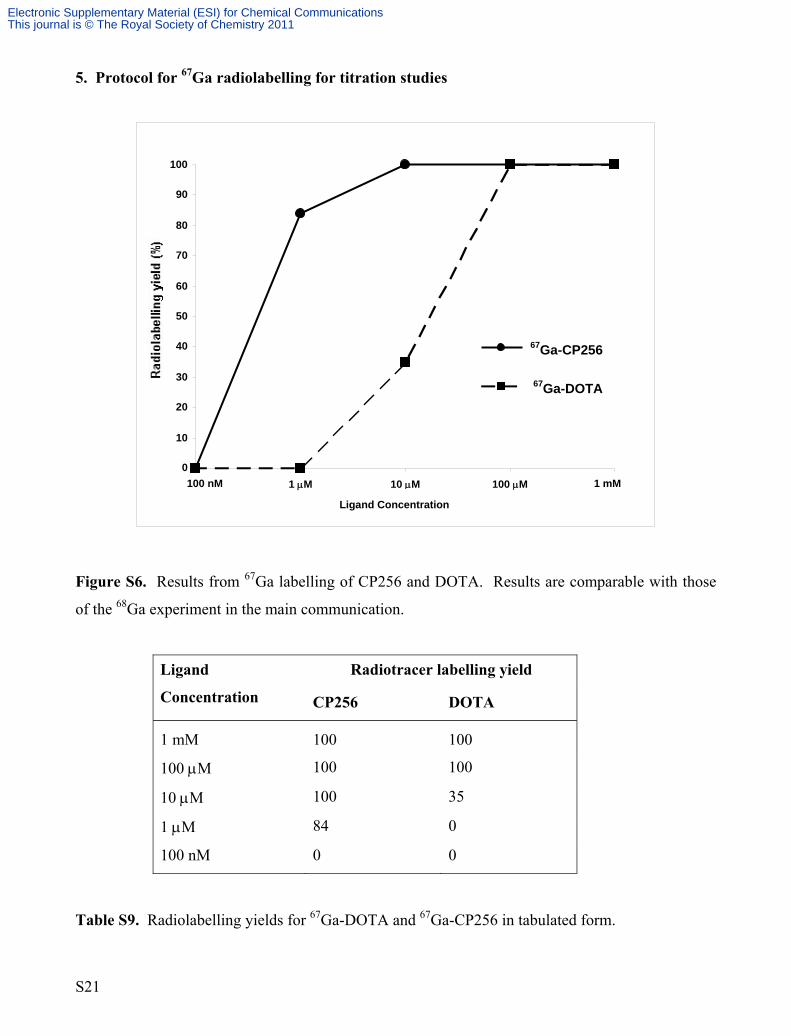
5. Protocol for 67Ga radiolabelling for titration studies
0
10
20
30
40
50
60
70
80
100
90
67Ga-CP256
67Ga-DOTA
100 nM 1 mM 1 μM 10 μM 100 μM
Ligand Concentration
Figure S6. Results from 67Ga labelling of CP256 and DOTA. Results are comparable with those
of the 68Ga experiment in the main communication.
Radiotracer labelling yield
Ligand
Concentration
CP256
DOTA
1 mM
100
100
100 μM 100 100
10 μM 100 35
1 μM 84 0
100 nM 0 0
Table S9. Radiolabelling yields for 67Ga-DOTA and 67Ga-CP256 in tabulated form.
S21
Electronic Supplementary Material (ESI) for Chemical CommunicationsThis journal is © The Royal Society of Chemistry 2011

Complex
Stationary Phase
Rf (Complex)
Rf (unchelated 67Ga)
67Ga-DOTA
Silica gel
0.4
0 & 0.8-1
67Ga-CP256
Silica gel
0
1
Table S10. TLC results for radiolabelling experiments with 67Ga-citrate. A standard of 67Ga-citrate
using the same TLC system as for 67Ga-DOTA showed 67Ga-citrate to have Rf values of 0 & 0.8-1.
Methods
Radiolabelling
1.25 mM stock solutions of each ligand were prepared in PBS (CP256) or acetate buffer, pH 4.6
(DOTA) The stock solution was diluted 10 fold by successive addition of the radiolabelling buffer
to create extra solutions with ligand concentrations of 125 μM, 12.5 μM, 1.25 μM and 125 nM.
Eighty microlitres of each solution was added to a plastic microcentrifuge tube and radiolabelled
with 20 μl of 67Ga-Citrate (1.5 MBq) to produce radiolabelled solutions with final ligand
concentrations of 1 mM, 100 μM, 10 μM, 1 μM and 100 nM. A metal heater block (containing oil
in the wells) was used to heat the 67Ga-DOTA solution.
Ligand
Labelling buffer
Labelling temperature
Labelling time
Measured pH
DOTA
Acetate
80oC
45 min
4.6
CP256
PBS
25oC
1 min
6.6
Table S11. Radiolabelling conditions for 67Ga-DOTA and 67Ga-CP256.
TLC analysis
Silica TLC plates were spotted with 1 μl of radiolabelled complex at the origin, which was marked
at 5 mm in pencil. Spots were allowed to dry on silica gel TLC plates but not for ITLC-SG strips.
The plates were placed in a developing chamber (100 ml wide necked sample bottle) filled with a 3
mm depth of the mobile phase. Stationary phases and mobile phases are listed in Table S12. The
TLC plate was developed until the solvent front had reached a distance of up to 65 mm. The plates
S22
Electronic Supplementary Material (ESI) for Chemical CommunicationsThis journal is © The Royal Society of Chemistry 2011

were removed from the developing chamber and dried in an oven set at 80oC. Radiochemical yields
were determined using either a TLC scanner or by electronic autoradiography.
Radiotracer
Mobile phase
Stationary phase
67Ga-CP256
Methanol/citric acid (0.5 M)/ammonium
formate (10% w, v) [40/20/40]
Silica gel
67Ga-DOTA 67Ga-citrate
Sodium citrate (aq) [0.3 M]
Silica gel
Table S12. TLC conditions for 67Ga-DOTA and 67Ga-CP256.
Equipment and consumables
TLC analyses were carried out on a Mini-Scan TLC scanner with FC3600 detector and γ detector
probe (laura 4.0.2.75 software) or on a Packard Instant Imager (electronic autoradiography) with
Imager version 2.05 software. The gas mixture was 1% isobutane, 2.5% carbon dioxide and 96.5%
argon (Air products).
Acetate buffer solution pH 4.6 (Sigma Aldrich 31048-1L).
S23
Electronic Supplementary Material (ESI) for Chemical CommunicationsThis journal is © The Royal Society of Chemistry 2011
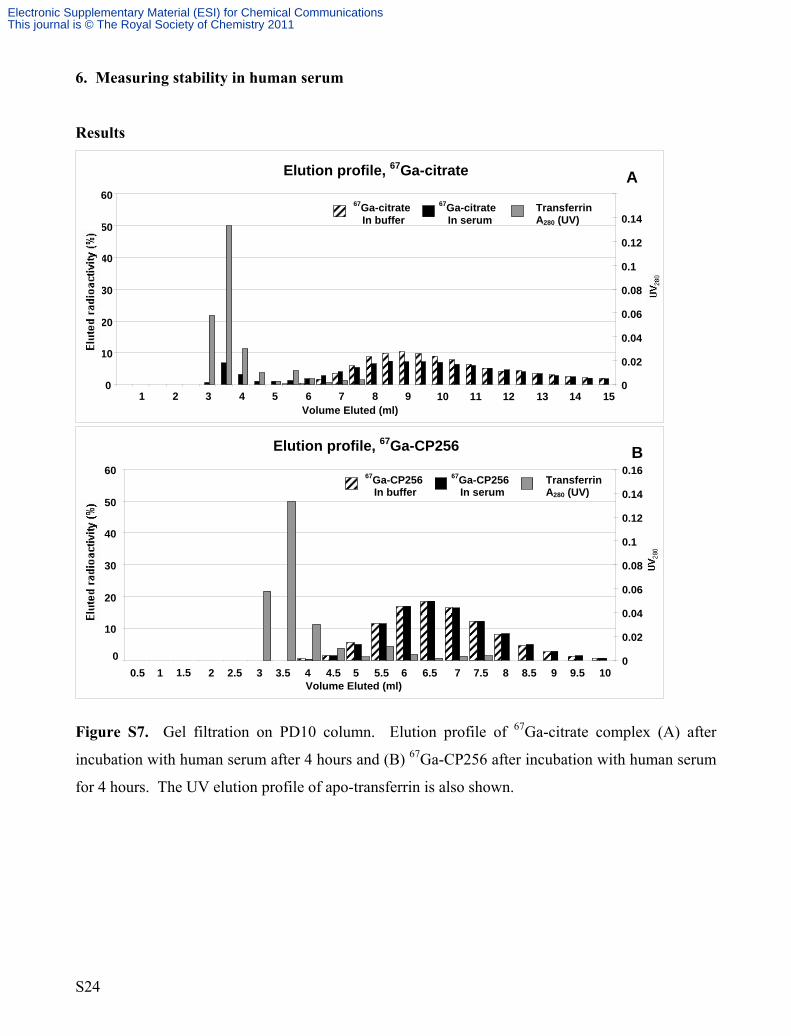
6. Measuring stability in human serum
Results
Elution profile, 67Ga-citrate
0
10
20
30
40
50
60
1 2 3 4 5 6 7 8 9 10 11 12 13 14 15Volume Eluted (ml)
0
0.02
0.04
0.06
0.08
0.1
0.12
0.14
Figure S7. Gel filtration on PD10 column. Elution profile of 67Ga-citrate complex (A) after
incubation with human serum after 4 hours and (B) 67Ga-CP256 after incubation with human serum
for 4 hours. The UV elution profile of apo-transferrin is also shown.
Series3
Transferrin A280 (UV)
A 67Ga-citrate In buffer
67Ga-citrate In serum
Elution profile, 67Ga-CP256
0
10
20
30
40
50
60
Volume Eluted (ml)
0
0.02
0.04
0.06
0.08
0.1
0.12
0.14
0.16 Series3
B
Transferrin
0.5 1 1.5 2 2.5 3 3.5 4 4.5 5 5.5 6 6.5 7 7.5 8 8.5 9 9.5 10
67Ga-CP256 In buffer
67Ga-CP256 In serum A280 (UV)
S24
Electronic Supplementary Material (ESI) for Chemical CommunicationsThis journal is © The Royal Society of Chemistry 2011

Methods
Radiolabelling of 67Ga-CP256 for serum stability
A solution of 0.1 mg/ml CP256 was prepared in PBS. An aliquot of 10 μl 67Ga-citrate was added to
100 μl ligand. After 5 minutes, QC was performed by HPLC using the same gradient system as for
the non-radioactive Ga-CP256 complex.
Incubation of tracers.
Two 200 μl aliquots of human serum were incubated at 37oC in a metal heater block. To one serum
incubation was added 20 μl of 67Ga-CP256 and to the second incubation was added 67Ga-citrate as a
standard.
Aliquots of 20 μl of both tracers were incubated at 37oC in 200 μl PBS buffer as a reference.
Gel filtration using a PD10 column
For 67Ga-CP256: PD10 columns were equilibrated with 25 ml PBS buffer. After 4 hours, 20 μl of 67Ga-CP256 (incubated in serum) was added to the top of the column, which was then eluted with
PBS buffer. The PD10 columns were eluted with 15 ml in 30 X 0.5 ml fractions, collected in
plastic microcentrifuge tubes. All tubes were counted in a gamma counter. The standard elution
profile of 67Ga-CP256 (in PBS buffer) from a PD10 column was determined by loading 20 μl of the 67Ga-CP256 stock onto a PD10 column. Elution and gamma counting was the same as for the
incubation in serum.
This protocol was repeated for the 67Ga-citrate incubation.
Equipment and consumables
TLC and ITLC analyses were carried out on a Mini-Scan TLC scanner with FC3600 detector and γ
detector probe. The same probe and detector from the same system was also connected to the
HPLC system, an Agilent 1200 series with quadrupole pump, degasser, UV detector and manual
syringe injector, which was fitted with a 20 μl loop. The HPLC column used for all analyses was
an Agilent Eclipse XDB-C18 (5 μm, 4.6 mm X 150 mm) with a guard column. The analytical
software used for radio-TLC and radio-HPLC was Laura 4.0.2.75 (Lablogic). Radioactive samples
were counted for 10 seconds (window 101-110) on a 1282 Compugamma Gamma Counter (LKB
Wallac) using Ultroterm software. UV spectrophotometry of apo-transferrin was performed on a
S25
Electronic Supplementary Material (ESI) for Chemical CommunicationsThis journal is © The Royal Society of Chemistry 2011

Cary UV spectrophotometer with Cary WinUV software. The wavelength was set at 280 nm. The
dose calibrator used for measuring radioactivity in samples was a CRC-25R (Capintec).
All general reagents and consumables were purchased from Sigma-Aldrich or from Fisher
Scientific. Specialist chemicals and consumables were purchased as follows: Acetate buffer
solution pH 4.6 (Sigma Aldrich 31048-1L); human serum (Sigma Aldrich H4522); human apo-
transferrin (Sigma Aldrich T5391-10MG); Sartorius Vivaspin 500 30 kDa MWCO filters (Fisher
Scientific FDP-875-025B); PD10 columns (GE Healthcare 17-0851-01); 67Ga-citrate solution for
injection (Mallinckrodt Medical) 74 MBq/ml (at ref. date; contains 6.5 mM sodium citrate, 135 mM
NaCl, 0.9% Benzyl alcohol); glass TLC plates (silica gel 60, F254, 250 mm X 750 mm) (Merck);
ITLC-SG strips (Pall Sciences). p-SCN-Bn-NOTA was purchased from Macrocyclics (Dallas,
USA.)
S26
Electronic Supplementary Material (ESI) for Chemical CommunicationsThis journal is © The Royal Society of Chemistry 2011

7. Measuring stability in human apo-transferrin solution:
Results
Size exclusion chromatography
0
10
20
30
40
50
60
1 2 3 4 5 6 7 8 9 10 11 12 13 14 15 Volume Eluted (ml)
0
0.02
0.04
0.06
0.08
0.1
0.12
0.14
0.16
Elution profile, 67Ga-citrate
67Ga-citrate In buffer
67Ga-citrate In apo-transferrin
Transferrin A280 (UV)
Figure S8. Gel filtration on PD10 column. (A) Elution profile of 67Ga-citrate complex after
incubation with apo-transferrin after 4 hours incubation. The UV elution profile of apo-transferrin
is also shown.
Elution profile, 67Ga-DOTA
0
5
10
15
20
25
30
1 2 3 4 5 6 7 8 9 10 11 12 13 14 15Volume Eluted (ml)
0
0.02
0.04
0.06
0.08
0.1
0.12
0.14
0.16 Series3
67Ga-DOTA In buffer
67Ga-DOTA In apo-transferrin
TransferrinA280 (UV)
Figure S9. Gel filtration elution profile of 67Ga-DOTA complex after 4 hours incubation in apo-
transferrin solution; 100 μM DOTA radiolabelling concentration.
S27
Electronic Supplementary Material (ESI) for Chemical CommunicationsThis journal is © The Royal Society of Chemistry 2011

Figure S10. Gel filtration on PD10 column. Elution profile of 67Ga-CP256 complex after 4 hours
incubation in apo-transferrin solution (A) 100 μM radiolabelling solution (B) 10 μM radiolabelling
solution.
Volume Eluted (ml)
Elution profile, 67Ga-CP256 (100 μM radiolabelling solution)
0
5
10
15
20
25
1 2 3 4 5 6 7 8 9 10 11 12 13 14 15 0
0.02
0.04
0.06
0.08
0.1
0.12
0.14
0.16
A
67Ga-CP256 In buffer
TransferrinA280 (UV)
67Ga-CP256 In apo-transferrin
0
5
10
15
20
25
1 2 3 4 5 6 7 8 9 10 11 12 13 14 15Volume Eluted (ml)
0
0.02
0.04
0.06
0.08
0.1
0.12
0.14
0.16
Elution profile, 67Ga-CP256 (10 μM radiolabelling solution)
B
67Ga-CP256 In buffer
TransferrinA280 (UV)
67Ga-CP256 In apo-transferrin
S28
Electronic Supplementary Material (ESI) for Chemical CommunicationsThis journal is © The Royal Society of Chemistry 2011

Measuring stability using 30 KDa MWCO filters
Complex
% Radioactivity retained by 30 KDa MWCO filter
In reference buffer
(after 4 hours)
In apo-transferrin solution
(after 4 hours)
67Ga-citrate (6.5 mM)
1.7 ± 0.5
73.0 ± 4.1 67Ga-CP256 (10 μM) 3.5 ± 1.3 3.9 ± 0.8 67Ga-CP256 (100 μM) 4.9 ± 0.5 3.8 ± 0.5 67Ga-DOTA (100 μM) 1.5 ± 1.7 2.6 ± 0.8
Table S13. Retention of 68Ga-complexes on MWCO filters in apo-transferrin vs control samples in
buffer.
0
10
20
30
40
50
60
70
80
90
In apo-transferrin In buffer
Stability of 67Ga-Tracers using 30 kDa MWCO filters
67Ga-Citrate (6.5 mM)
67Ga-CP256 (10 μM)
67Ga-CP256 (100 μM)
67Ga-DOTA (100 μM)
Figure S11. Binding of 67Ga-citrate, 67Ga-CP256 and 67Ga-DOTA to 30 kDa MWCO filters.
(Graphical representation of results from Table S8.)
S29
Electronic Supplementary Material (ESI) for Chemical CommunicationsThis journal is © The Royal Society of Chemistry 2011
Methods
Preparation of apo-transferrin solution
50 mM TRIS-HCl buffer (pH 7.5) was prepared by dilution of a 1 M stock solution. Sodium
bicarbonate was added to a concentration of 25 mM. A 2.5 mg/ml (32 μM) solution of apo-
transferrin was prepared in this buffer.
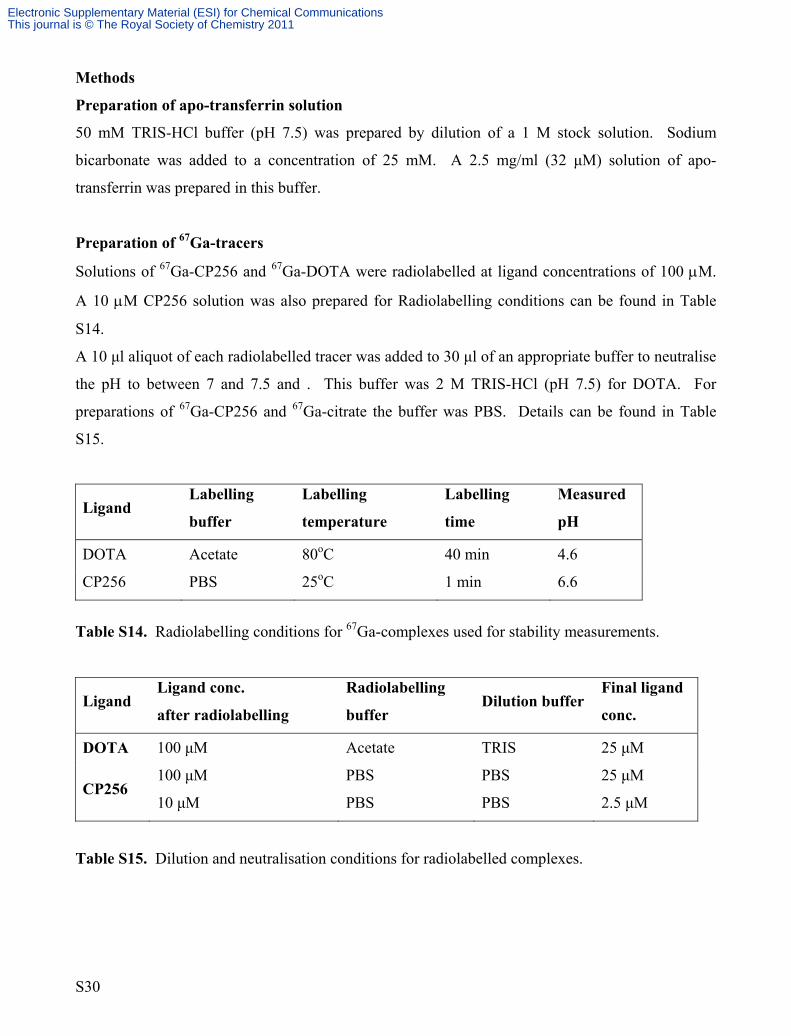
Preparation of 67Ga-tracers
Solutions of 67Ga-CP256 and 67Ga-DOTA were radiolabelled at ligand concentrations of 100 μM.
A 10 μM CP256 solution was also prepared for Radiolabelling conditions can be found in Table
S14.
A 10 μl aliquot of each radiolabelled tracer was added to 30 μl of an appropriate buffer to neutralise
the pH to between 7 and 7.5 and . This buffer was 2 M TRIS-HCl (pH 7.5) for DOTA. For
preparations of 67Ga-CP256 and 67Ga-citrate the buffer was PBS. Details can be found in Table
S15.
Ligand Labelling
buffer
Labelling
temperature
Labelling
time
Measured
pH
DOTA
Acetate
80oC
40 min
4.6
CP256 PBS 25oC 1 min 6.6
Table S14. Radiolabelling conditions for 67Ga-complexes used for stability measurements.
Ligand Ligand conc.
after radiolabelling
Radiolabelling
buffer Dilution buffer
Final ligand
conc.
DOTA
100 μM
Acetate
TRIS
25 μM
CP256 100 μM
10 μM
PBS
PBS
PBS
PBS
25 μM
2.5 μM
Table S15. Dilution and neutralisation conditions for radiolabelled complexes.
S30
Electronic Supplementary Material (ESI) for Chemical CommunicationsThis journal is © The Royal Society of Chemistry 2011

For tracer incubations in apo-transferrin
Equilibration and elution of PD10 columns was the same as for the serum incubations with the
exception that 25 mM sodium bicarbonate was added to the PBS elution buffer. The standard
elution profiles of 67Ga-citrate, 67Ga-CP256 and 67Ga-DOTA were determined by adding 20 μl of
each tracer that had been incubated in the reference buffer (50 mM TRIS-HCl containing 25 mM
sodium bicarbonate) and eluting the columns as described above.
To calculate the percentage of total eluted activity for each 0.5 ml fraction
Total eluted radioactivity for each column was calculated by adding together the counts for each of
the 30 fractions. Eluted activity for each fraction was then calculated by the following equation:
Counts per fraction . Total counts (for all 30 fractions)
X 100
Determination of tracer stability using 30 kDa MWCO microcentrifuge filters
PBS (100 μl, containing 25 mM bicarbonate) was applied to the top section (filter section) of the
tube. The incubation solution (5 μl) for each tracer (after 4 hours) was added and the tube was
spun in a microcentrifuge at 10,000 g for 8 minutes. Another 100 μl PBS was applied to wash and
the tube was spun again at 10,000 g for a further 8 minutes. The filter section of the tube was
removed and counted separately from the tube in a gamma counter. Percentage binding of the
radioactivity to the MWCO filter was calculated using the following equation:
__________Counts from filter section____________ X 100
Counts from filter section + counts from tube section
The analysis was done in triplicate after 4 hours for the apo-transferrin incubations. The analysis
was done 6 times (6 tubes) for the incubations in the 50 mM TRIS-HCl reference buffer. Average
values were taken as described above.
Equipment and consumables.
The equipment and consumables were the same as for part 6, with the following additions:
Samples were centrifuged using an Eppendorf centrifuge 5424 microcentrifuge.
S31
Electronic Supplementary Material (ESI) for Chemical CommunicationsThis journal is © The Royal Society of Chemistry 2011

Sartorius Vivaspin 500 30 kDa MWCO filters were purchased from Fisher Scientific (FDP-875-
025B).
S32
Electronic Supplementary Material (ESI) for Chemical CommunicationsThis journal is © The Royal Society of Chemistry 2011

8. Conjugation of YM-103-chlorosuccinimide or YM-103 with C2Ac protein, radiolabelling and in vitro functional assay.
Results
Conjugation
C2A is a small protein that recognises phosphatidylserine displayed on cells undergoing apoptosis.
It has been engineered with a cysteine residue to facilitate site-specific labelling with thiol-reactive
agents. [5] The protein was conjugated with CP256 using either YM-103 or the chlorosuccinimide
analogue (11) (see figure S16). The same product was obtained for both conjugation reactions. The
average molecular weight of C2A is 14997. The found average molecular weight of the C2Ac-YM-
103 conjugate was 15970.87, which corresponds to the C2Ac-YM-103 conjugate with an additional
iron atom and without 3 hydrogen atoms, as shown in figure S12. C2Ac and the C2Ac-YM-103
conjugate elute during LC-MS with two peaks between 26.6 and 30 minutes. The first peak,
extracted as a mass spectrum between 26.6 and 28.1 minutes (figure S12, A) contains the C2Ac-
YM-103 conjugate (figure S12, B) and the second, between 28.1 and 29.6 minutes (figure S12, C)
contains a mixture of the C2Ac-YM-103 conjugate and unmodified C2Ac (with a mass of
14997.40).
S33
Electronic Supplementary Material (ESI) for Chemical CommunicationsThis journal is © The Royal Society of Chemistry 2011

C
B
A
6x10
0
0.2
0.4
0.6
0.8
1
1.2
1.4
1.6
1.8
2
2.2
2.4
2.6
2.8
3
3.2
3.4
3.6+ESI Scan (28.111-29.580 min, 92 scans) Frag=225.0V C2Ac-Ga.d Deconvoluted (Isotope Width=7.3)
15970.87
14997.40
16150.6014592.14 15452.29 16360.28 16663.5014116.62
Counts vs. Deconvoluted Mass (amu)14200 14400 14600 14800 15000 15200 15400 15600 15800 16000 16200 16400 16600 16800
6x10 +ESI Scan (26.657-28.111 min, 91 scans) Frag=225.0V C2Ac-Ga.d Deconvoluted (Isotope Width=7.3)
0
0.5
1
1.5
2
2.5
3
3.5
4
4.5
5
5.5
6
6.515970.87
15834.8414998.0914736.33 16578.0714119.53 14426.39
14200 14400 14600 14800 15000 15200 15400 15600 15800 16000 16200 16400 16600 16800Counts vs. Deconvoluted Mass (amu)
S34
Electronic Supplementary Material (ESI) for Chemical CommunicationsThis journal is © The Royal Society of Chemistry 2011

Figure S12. Positive mode ESI mass spectrum showing (A) total ion chromatogram, (B)
deconvoluted mass spectrum from 26.6-28.1 minutes containing C2Ac-YM-103, (C) deconvoluted
mass spectrum from 28.1-29.6 minutes containing a mixture of C2Ac and C2Ac-YM103.
Radiolabelling
Figure S13. Radio-ITLC chromatograms of (A) 68Ga-C2Ac and (B) 68Ga-C2Ac-YM-103
conjugate. Radioactivity at Rf 0 (10 mm) is radiolabelled protein and free, unchelated 68Ga at Rf 1
(65 mm).
S35
Electronic Supplementary Material (ESI) for Chemical CommunicationsThis journal is © The Royal Society of Chemistry 2011

Figure S13 (B) shows that after 5 minutes incubation with 68Ga, the C2Ac-YM-103 conjugate was
radiolabelled in 100% yield, compared with unmodified C2Ac (figure S13 (A)), which showed
some free 68Ga. After 15 minutes of incubation with 68Ga, the radiolabelled 68Ga-C2Ac-YM-103
conjugate was eluted eluted from a gel filtration column. Figure S14 shows that the radiolabelled
C2Ac-YM-103 elutes in the fractions where a protein of this size elutes in a PD10, whereas 68Ga-
C2Ac elutes as a wide band, indicating dissociation of 68Ga and instability of the radiolabelling.
Figure S14. Gel filtration chromatogram (PD-10) showing radiolabelling of C2Ac and the C2Ac-
YM-103 conjugate.
In vitro functional asssay on 68Ga-C2Ac-YM-103.
The 68Ga-labelled C2Ac-YM-103 conjugate showed specific calcium dependent binding to
phosphatidylserine (PS) in a red blood cell binding assay, as shown in figure S14. This indicates
that the protein is still functional, despite the maleimide conjugation. The EC50 = 1.15 mM Ca2+.
The R value was 0.99718.
S36
Electronic Supplementary Material (ESI) for Chemical CommunicationsThis journal is © The Royal Society of Chemistry 2011
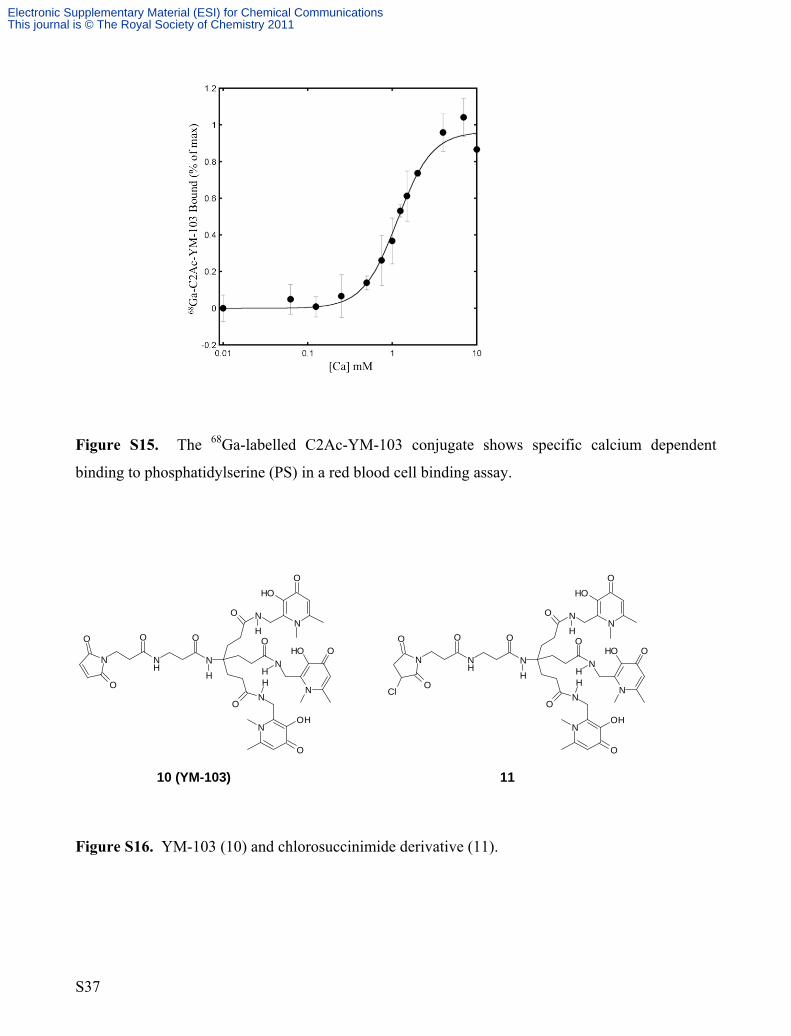
Figure S15. The 68Ga-labelled C2Ac-YM-103 conjugate shows specific calcium dependent
binding to phosphatidylserine (PS) in a red blood cell binding assay.
O O
Figure S16. YM-103 (10) and chlorosuccinimide derivative (11).
N
ON
N
O
OH
N
NN
N
O
O
O
H
OH
H
OH
H
OH
NH
O
N
O
O N
ON
N
O
OH
N
N
OH
NO
N
O
O
H
OH
H
OH
H
OO
NH
N
OCl
10 (YM-103) 11
S37
Electronic Supplementary Material (ESI) for Chemical CommunicationsThis journal is © The Royal Society of Chemistry 2011

Methods
Conjugation of C2Ac and YM-103.
C2Ac [5] (2 mg in a solution of 2mg/mL) was treated with a 3:1 molar excess of YM-103 (10) or its
chlorosuccinimide derivative (11) (see figure S16) for 4 hours at room temperature. The mixture
was purified using a PD-10 column pre-equilibrated with PBS + Chelex and analysed by LC-MS.
68Ga radiolabelling of C2Ac and C2Ac-YM-103 conjugate.
100 µg of C2Ac or C2Ac-YM-103 at a concentration of 1 mg/mL was used. 200 µL of
preconcentrated 68Ga was added to the conjugate to give a final volume of 300 µl. At 5 minute
intervals, 2 µL of the mixture was spotted on ITLC-SG and the chromatogram developed using 0.1
M citrate buffer as the mobile phase.
Red Blood Cell assay
The binding of radiolabelled 68Ga-C2Ac-YM-103 to PS on red blood cells (RBC) was performed
according to a literature method.[6] A commercial preparation of preserved human RBC was
obtained from Beckman-Coulter (High Wycombe, UK). Calcium titrations of RBC were performed
in a buffer of 50 mM HEPES-sodium, pH 7.4, 100 mM NaCl, 3 mM NaN3, with 1 mg/mL BSA as
carrier protein. Reactions were prepared with a final concentration of 1 nM 68Ga labelled C2Ac-
YM-103 and calcium; RBC were then added, and the reaction (1 mL) was incubated for 8 min at
RT. The cells were then centrifuged (3 min at 9000 rpm the supernatant was removed, and the cells
were resuspended in 1 ml assay buffer containing the same concentration of calcium used during
the incubation step. The cells were centrifuged again, the supernatant was removed, and the pellet
was resuspended in 0.7 ml assay buffer plus 10 mM ethylenediaminetetraacetic acid (EDTA) to
release 68Ga labelled C2Ac-YM-103 bound in a calcium-dependent manner. After centrifugation to
remove the RBC, the released labelled 68Ga-C2Ac-YM-103 in the supernatant was measured using
a gamma counter. The EC50 was calculated as described in the literature using the equation Y =
[Ca]N/([Ca]N + EC50N) where Y = B/Bmax, B is the observed amount of radiolabelled protein bound
at a given calcium concentration, and Bmax is the concentration of radiolabelled protein bound at
saturating calcium concentrations. Curve fitting was performed using a nonlinear curve fit by a
routine based on the Levenberg-Marquardt algorithm using Kaleidagraph (Synergy Software,
Reading, US).
S38
Electronic Supplementary Material (ESI) for Chemical CommunicationsThis journal is © The Royal Society of Chemistry 2011
Equipment.
The Radio-TLC analysis was preformed on a miniGITA star TLC scanner with Gina Star software
version 4.07 (Raytest). Samples were centrifuged using an Eppendorf centrifuge 5424
microcentrifuge. Gamma counting was performed on a 1282 Compugamma Gamma Counter (LKB
Wallac)
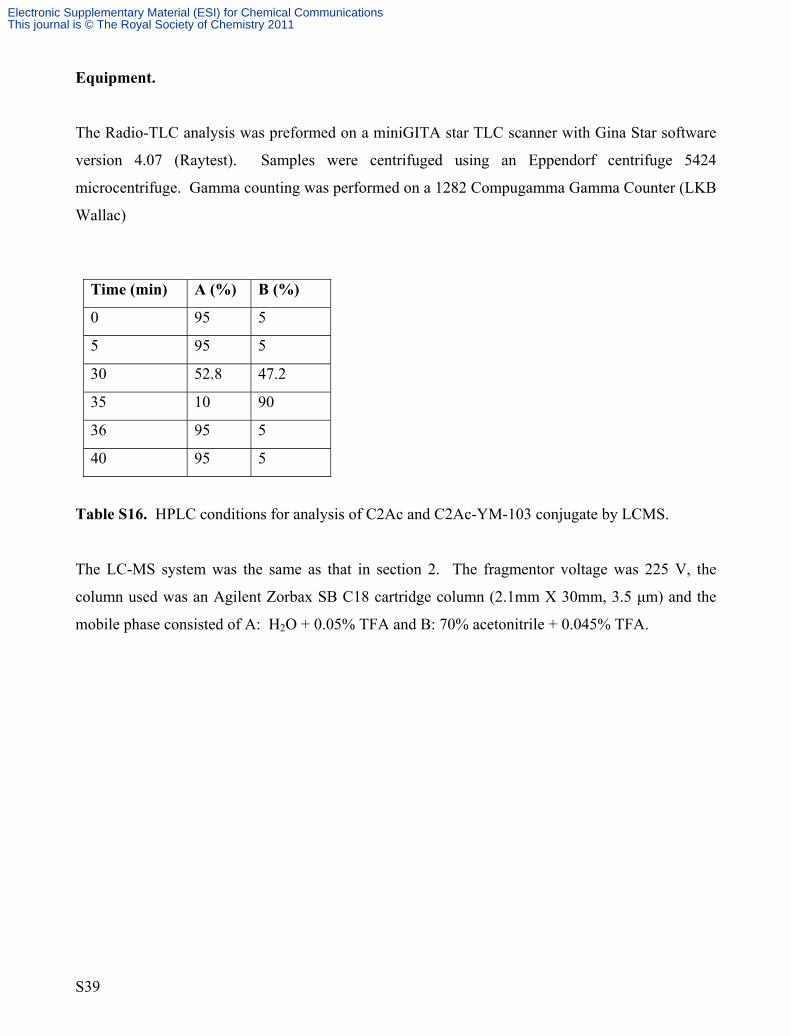
Time (min) A (%) B (%)
0 95 5
5 95 5
30 52.8 47.2
35 10 90
36 95 5
40 95 5
Table S16. HPLC conditions for analysis of C2Ac and C2Ac-YM-103 conjugate by LCMS.
The LC-MS system was the same as that in section 2. The fragmentor voltage was 225 V, the
column used was an Agilent Zorbax SB C18 cartridge column (2.1mm X 30mm, 3.5 μm) and the
mobile phase consisted of A: H2O + 0.05% TFA and B: 70% acetonitrile + 0.045% TFA.
S39
Electronic Supplementary Material (ESI) for Chemical CommunicationsThis journal is © The Royal Society of Chemistry 2011
9. In vivo imaging studies of bioconjugate
Results
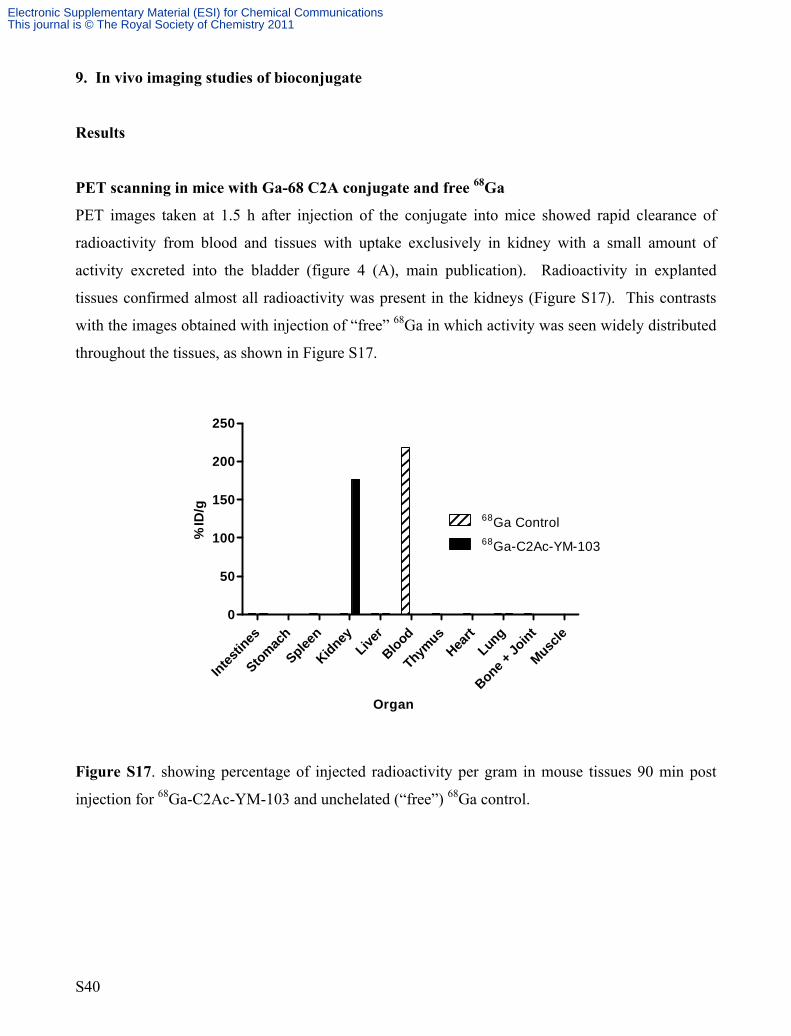
PET scanning in mice with Ga-68 C2A conjugate and free 68Ga
PET images taken at 1.5 h after injection of the conjugate into mice showed rapid clearance of
radioactivity from blood and tissues with uptake exclusively in kidney with a small amount of
activity excreted into the bladder (figure 4 (A), main publication). Radioactivity in explanted
tissues confirmed almost all radioactivity was present in the kidneys (Figure S17). This contrasts
with the images obtained with injection of “free” 68Ga in which activity was seen widely distributed
throughout the tissues, as shown in Figure S17.
Organ
% ID
/g
Intestin
es
Stomach
Spleen
KidneyLive
rBlood
Thymus
Heart
Lung
Bone + Jo
int
Muscle
0
50
100
150
200
250
68Ga Control68Ga-C2Ac-YM-103
Figure S17. showing percentage of injected radioactivity per gram in mouse tissues 90 min post
injection for 68Ga-C2Ac-YM-103 and unchelated (“free”) 68Ga control.
S40
Electronic Supplementary Material (ESI) for Chemical CommunicationsThis journal is © The Royal Society of Chemistry 2011
S41
Methods
PET scanning in mice with 68Ga-C2Ac-YM-103.
The 68Ga labelled C2A conjugate, synthesised as described above, or unchelated 68Ga in acetate
buffer, was filtered through a 0.22 μm filter an injected into C57B/6 mice (n = 4, 10 MBq in 100 μl
for each animal). PET/CT scans were acquired 90 min post injection using a NanoPET/CT scanner
(Bioscan, Paris, France) with PET acquisition time 1800 s, coincidence relation: 1-3. Image
reconstruction: OSEM with SSRB 2D LOR, energy window: 400-600 keV, filter: Ramlak cutoff 1,
number of iterations/subsets: 8/6.
Animals were sacrificed at 90 min and explanted organs counted in a gamma counter to determine
biodistribution.
References
1. Z. D. Liu, S. Piyamongkol, D. Y. Liu, H. H. Khodr, S. L. Lu and R. C. Hider, Bioorg. Med.
Chem., 2001, 9, 563.
2. Z. D. Liu, R. Kayyali, R. C. Hider, J. B. Porter and A. E. Theobald, J. Med. Chem., 2002, 45,
631.
3. G. R. Newkome, R. K. Behera, C. N. Moorefield and G. R. Baker, J. Org. Chem., 1991, 56,
7162.
4. T. Zhou, H. Neubert, D. Y. Liu, Z. D. Liu, Y. M. Ma, X. L. Kong, W. Luo, S. Mark and R. C.
Hider, J. Med. Chem., 2006, 49, 4171.
5. R. Tavaré, R. Torres Martin De Rosales, P. J. Blower and G. E. D. Mullen, Biocon. Chem.,
2009, 20, 2071.
6. J. F. Tait, D. F. Gibson and C. Smith, Anal. Biochem., 2004, 329, 112.
Electronic Supplementary Material (ESI) for Chemical CommunicationsThis journal is © The Royal Society of Chemistry 2011