Efficiency Reporting Structure
45
of South Australia DELIVERING IMPROVED WATER USE EFFICIENCY ACROSS THE MURRAY- DARLING BASIN Milestone Report Development of a Water Use Efficiency Reporting Structure Apri 1 2003
Transcript of Efficiency Reporting Structure

of South Australia
DELIVERING IMPROVEDWATER USE EFFICIENCYACROSS THE MURRAY- DARLING BASIN
Milestone Report
Development of a Water Use
Efficiency Reporting Structure
Apri 1 2003
r
i
i
i kal11711DARWGBASINCOMIVIISSION
Murray Darling Basin Commission
Strategic Investigations and Education Program
12003
411111111111111111111111 ACROSS THE MURRAY - DARLING BASIN
DELIVERING IMPROVED
WATER USE EFFICIENCY
Milestone 5 Report
Development of a Water Use Efficiency
Reporting Structure
Dan Me'drum and Sarah Rhodes
Environmental Analysis and Research UnitDepartment for Environment and Heritage SA
April 2003
Thanks to Matt Book and Renee FielkeCentral Irrigation TrustBarmera
I1GcARiMGN1 Fpu
environmentand heritage r....-_... Government
of South Australia

DEVELOPMENT OF A WATER USE EFFICIENCY REPORTING STRUCTURE CONTENTS
CONTENTS
1. INTRODUCTION 1
1.1. Tools, Data Capture and Data Analysis 1
1.2. Tools and Users 4
2. WUE REPORTING STRUCTURE 6
2.1. SCOPING STUDY 6
2.2. WUE Module PROPOSAL 12
3. IIT TRIAL PHASE 2 21
3.1. Cobdogla Irrigation district 21
3.1.1. Background 21
3.1.2. Crop Types 22
3.1.3. On -farm Irrigation Systems 25
3.1.4. Property Size Profile 26
3.1.5. Participants in Irrigation Management Training 27
3.1.6. Water Use Efficiency 29
3.2. Secondary IIT Trials 30
3.2.1. Kingston 30
3.2.2. Cooltong and Ral Ral 30
4. RECOMMENDATIONS FOR COST SHARING 31
4.1. Operational Costs 31
4.2. Management Costs 32
4.3. Tangential Costs 33
5. RESULTS COMMUNICATION PROGRAM 34
5.1. Communication Tactics 34
5.1.1. Brand the project 34
5.1.2. Communication Network 34
5.1.3. Presentations and Publications 35
DEVELOPMENT OF A WATER USE EFFICIENCY REPORTING STRUCTURE CONTENTS
5.1.4. Media Program
5.1.5. Promotional Kit
TABLE OF FIGURES
Figure 1: Irrigation Inventory Tool and District Irrigation Database
Figure 2: Water Use Efficiency Tool Basic Principles
Figure 3: Water Use Efficiency Tools Tools and Users
Figure 4: WUE Calculation for NRM The options
Figure 5 WUE Module Customised Menu
Figure 6 Settings Form
Figure 7 Select the district database
Figure 8 Confirm database
Figure 9 Report Level
Figure 10 WUE Indicators
Figure 11 Select Rain Station
Figure 12 Report Period
Figure 13 Table Selection form
Figure 14 Display Table Query
Figure 15 Results Table
Figure 16 Display Map Query
Figure 17 Results Map
Figure 18 Major Crop Types for Cobdogla Irrigation District 1993/94 2001
Figure 19 Crop Type by Water Use Efficiency for 2001/02
Figure 20 On -Farm Irrigation Systems 1993/94 2001 /02
Figure 21 Irrigation System by Water Use Efficiency for 2001/02
Figure 22 Property Area by Water Use Efficiency 2001/02
Figure 23 Irrigation Management Training by WUE for 2001/02
Figure 24 Median WUE of Irrigators With Et Without Irrigation Training
/02
37
37
2
3
4
12
13
13
14
14
15
16
16
17
18
18
19
19
20
23
24
25
26
27
28
29
DEVELOPMENT OF A WATER USE EFFICIENCY REPRORTING STRUCTURE INTRODUCTION
1. INTRODUCTION
The Murray - Darling Basin Commission (MDBC) has supported this project in order
to develop a set of tools to facilitate practical and reliable Water Use Efficiency
(WUE) monitoring, assessment and reporting at a range of scales. The scope of
the project is to focus upon WUE where irrigation is effected by pressurised
delivery of water to horticultural land uses. In this arena, differences in
monitoring, assessment and reporting needs have been detected and can be
grouped as factors of the following drivers:
Water Management Agencies need to report on salinity and water
management targets
Irrigators are under increasing pressure to report their irrigation
management to Agencies and Processors
Water Use Efficiency is seen as a prime indicator of sustainable water
management, with targets incorporated into recent policy and
regulation
Irrigators do not have a convenient method of reporting WUE
1.1. Tools, Data Capture and Data Analysis
In response to these needs, the project partners have undertaken to develop the
following prototype tools:
Irrigation Inventory Tool (IIT):
A Geographic Information Systems (GIS) based tool for facilitating
consistent, standardised capture of several of the key data sets
necessary for WUE calculation (Meldrum, Rhodes a Argus, 2002)
Output: District Irrigation Database
Water Use Efficiency Module (WUEM):A GIS -based module, which
increases the functionality of a commonly used proprietary software
package to enable WUE assessment and reporting to take place using
standardised inputs
Output: Outlet /Licence, Property and District Level WUE Report
-1.
DEVELOPMENT OF A WATER USE EFFICIENCY REPRORTING STRUCTURE INTRODUCTION
. Farm Level Water Management Module (FLWMM):A Visual Basic
application which will use Microsoft Access tables and customised
algorithms for on -farm monitoring and assessment of water use
Output: A range of WUE performance indicators (Adams, 2002)
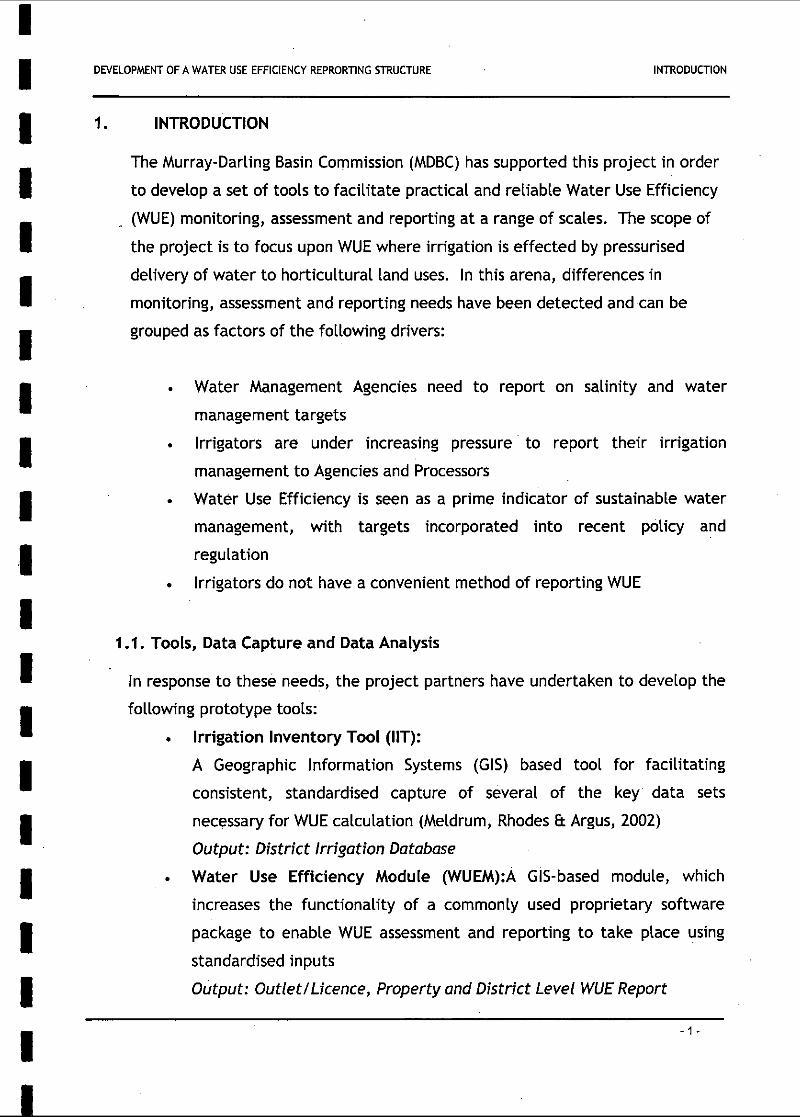
This report focuses on the development of a WUE reporting structure to be
implemented through the ultimate development and delivery of the WUE and
FLWM modules.
DigitalOrtho-
photography
IrrigatorSurvey
Irrigation
Inventory
Tool
GIS(ArcMap)
T
PropertyPlan
1:1,000
Crops by PatchCrop Type /Category/Variety
Crop RootstockInterplantings
Year Planted
Irrigation Systems by PatchOn -farm Irrigation Systems
Scheduling MethodSoil Water Monitoring Devices
Valve Units
Drainage by Patch
PP"On -farm Drainage Systems
Drainage Disposal/ Drainage Hazards
yTo Growers I
Farm LevelWater Management
Module
District
Irrigation
Database
Figure 1: Irrigation Inventory Tool and District Irrigation Database
The prototype Irrigation Inventory Tool (IIT) and its resulting District Irrigation
Database depicted in figure one establishes the baseline data necessary for WUE
calculation. The IIT standardises the way that these baseline data sets are
captured. As a bare minimum, the IIT enables spatial capture of crop
composition to type level (e.g. Citrus, Vines, Stonefruit etc.) with qualification
made as to the age of the plantings. In the trial phase of this project, this
information is captured from a base of highly accurate digital Orthophotography
and irrigator interview. Using this approach, the GIS is able to calculate highly
accurate areas for crop plantings, a key factor in ensuring WUE calculations
2-

DEVELOPMENT OF A WATER USE EFFICIENCY REPRORTING STRUCTURE INTRODUCTION
performed using the data are accurate enough to support informed decision
making.
The prototype IIT has been designed with flexibility and adaptation in mind. It
has the capacity to increase the detail of crop mapping to rootstock level while
also facilitating the capture of supporting data sets such as irrigation
management techniques, drainage capabilities and training participation. In
offering this flexibility, the IIT enables continual improvement in the WUE
knowledge base to be applied broadly, while providing the data sets enabling
rigorous analysis of the results. This can be achieved through investigation of
the relationships between the results themselves and management techniques
and impediments.
At whichever level of detail is selected for formulation of the District Irrigation
Database, it is imperative that water use is tied very closely to each
homogeneous crop unit. The IIT provides a means of doing this in a manner
which matches the scale of inventory conducted. Water can be linked to crops
at any level from the individual irrigation system valve unit, through metered
areas, licensed properties, up to bulk water delivery at the district scale.
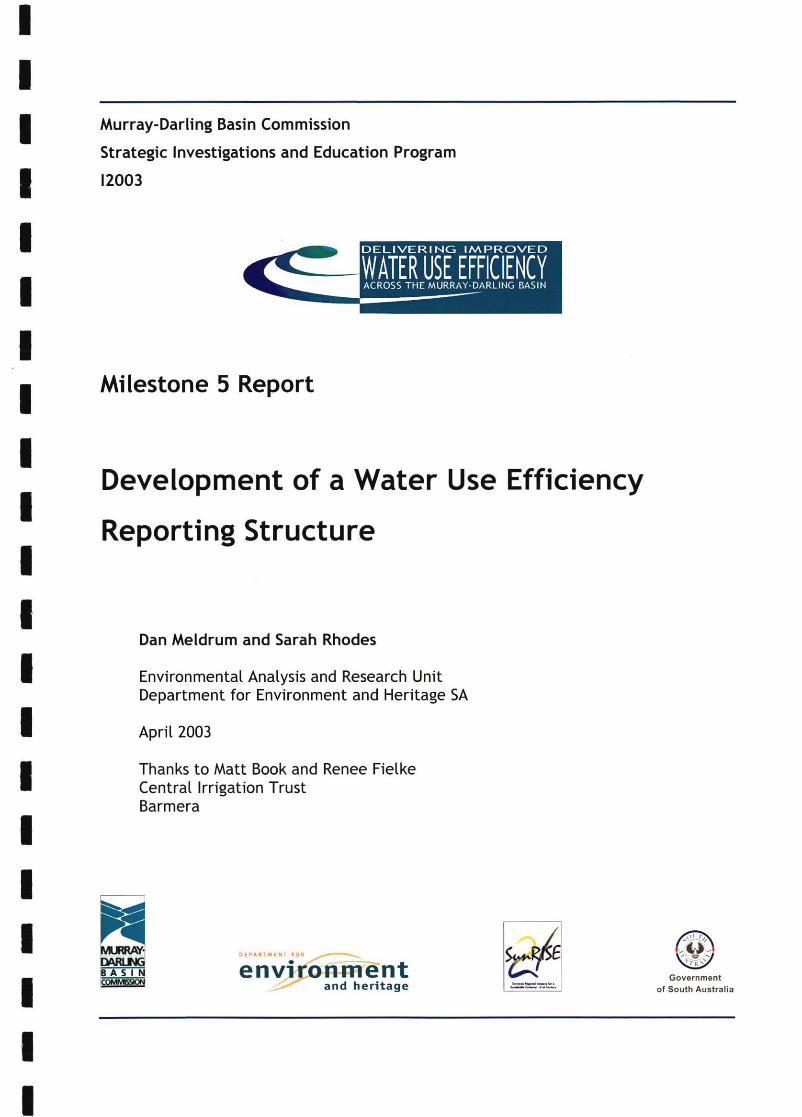
CropFactors
WaterConsumption
DistrictIrrigationData Base
CropComposition
Outlet / Licence
r
Evaporation
WUE Reporting Tool
crop water requirementconsumption + precipitation 100
Long Term Average Annual Conditions
Actual Measured Conditions
GIS data held in the DistrictIrrigation Data Base is linked withCrop Factors and Evaporation datato calculate Crop WaterRequirement
Crop Water Application is derivedfrom consumption and rainfall atan outlet, licence, property ordistrict scale
Annual WaterBalance Evaluation
< 100 provides excesswater into drainage
> 100 puts crops understress85% is target
efficiency for irrigators
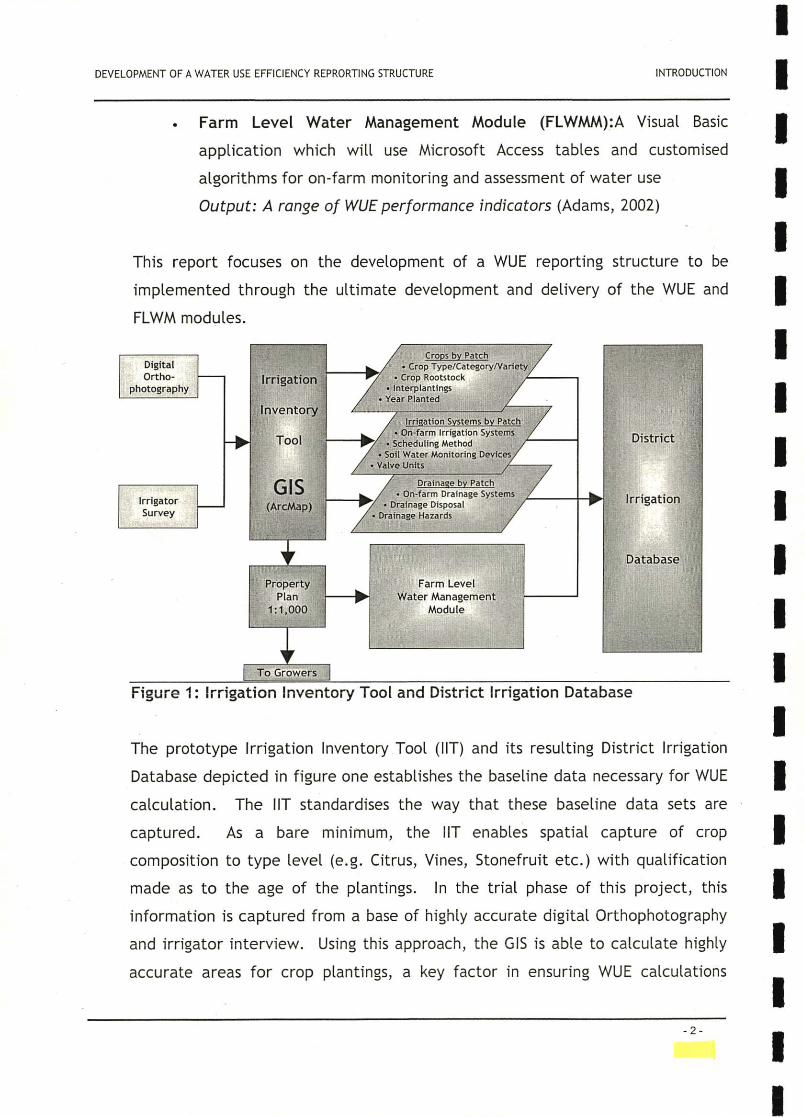
Figure 2: Water Use Efficiency Tool Basic Principles
-3-
DEVELOPMENT OF A WATER USE EFFICIENCY REPRORTING STRUCTURE INTRODUCTION
Figure two outlines the basic operation of the proposed WUE reporting structure.
The calculation of Natural Resource Management (NRM) focussed WUE indicators
involves linking crop factor tables and evaporation data to crop data to generate
a theoretical crop water use or crop water requirement. This becomes the
numerator in an Annual Water Balance Evaluation equation, the denominator
being the crop water application, derived from a sum of rainfall and
consumption. A detailed description of the proposed calculation process is
outlined later in this report along with brief discussion of other indicators that
the IIT /WUEM combination will have the capacity to deliver.
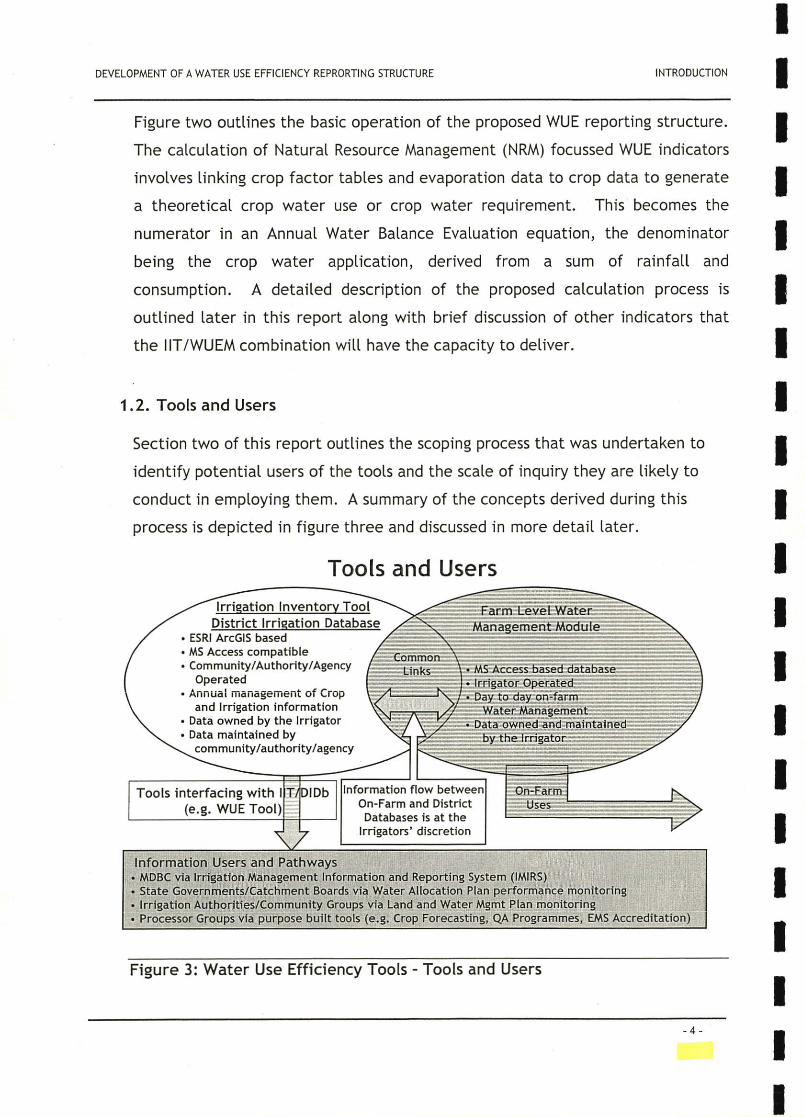
1.2. Tools and Users
Section two of this report outlines the scoping process that was undertaken to
identify potential users of the tools and the scale of inquiry they are likely to
conduct in employing them. A summary of the concepts derived during this
process is depicted in figure three and discussed in more detail later.
Tools and Users
Irrigation Inventory ToolDistrict Irrigation Database
ESRI ArcGIS basedMS Access compatibleCommunity /Authority /AgencyOperated
Annual management of Cropand Irrigation information
Data owned by the IrrigatorData maintained bycommunity /authority /agency
CommonLinks
Farm Level WaterManagement Module
MS Access based databasIrrigator Operated
/ Day to day on -farmWater Management _.
Data owned and maintainedby the Irrigator
Toots interfacing with I(e.g. WUE Tool)
T/DIDb Information f ow betweenOn -Farm and DistrictDatabases is at the
Irrigators' discretion
On -FarmUses
Information Users and PathwaysMDBC via Irrigation Management Information and Reporting System (IMIRS)State Governments /Catchment Boards via Water Allocation Plan performance monitoringIrrigation Authorities /Community Groups via Land and Water Mgmt Plan monitoringProcessor Groups via purpose built tools (e.g. Crop Forecasting, QA Programmes, EMS Accreditation)
Figure 3: Water Use Efficiency Tools Tools and Users
4

DEVELOPMENT OFA WATER USE EFFICIENCY REPRORTING STRUCTURE INTRODUCTION
Figure three defines the boundaries between organisational query of WUE
performance and query conducted by individuals in the form of self - assessment.
While the FLWMM proposes a model for highly detailed investigation geared
towards improvement based on direct action, the IIT /WUEM combination
provides a mechanism for data capture and analysis that facilitates:
Community ownership of the issue
Targeted resource allocation and education
Multi -scale reporting
Regulation
The proposed reporting structure, while making the definition between
information relevant at these different scales, allows for transfer of information
between all levels with individual irrigators able to access district held data and,
in turn, feed value added information generated on -farm up the tree to assist
with better decision making. Figure three also alludes to the possibility of
interfacing other secondary tools through establishment of partnerships between
communities, natural resource managers and industry groups.

DEVELOPMENT OF A WATER USE EFFICIENCY REPRORTING STRUCTURE IIT TRIAL PHASE 2
2. WUE REPORTING STRUCTURE
In proposing the establishment of the WUE reporting structure outlined in this
report, the key goals for this project are:
To provide standardised yet flexible methodologies for calculation
of a broad range of WUE indicators
Ensure the indicators considered cater for the needs of the major
users of the information
Ensure the indicators calculated are appropriate for use at the
scale of the data sources used to calculate them
Generate a series, of outputs that facilitate management of the
water resource by reporting WUE indicators transparently,
consistently and concisely
These goals are guided by the principle that the data capture tools developed in
this project form, not only the basis for WUE calculation for NRM purposes, but
generate a significant community resource which may be used for collective
approaches to tackling a range of irrigation related issues. As such, the IIT and
FLWMM are seen as primary tools, crucial in establishing the data resource, and
the WUEM is seen as a secondary tool that will interface with this data resource
in a way that will engage the entire irrigation community.
2.1. SCOPING STUDY
In order to develop a picture of WUE activities currently being undertaken in the
horticultural regions of the Basin, a series of meetings has been conducted from
Griffith to Adelaide with consideration also given to activities in and around
Toowoomba in QLD. The following summarises the findings of those meetings
and defines the scope under which such a reporting structure should seek to add
value. Several of the key points arising in the interview series are listed while
table one groups the responses of participants into a matrix that focuses on
three key themes:
DEVELOPMENT OF A WATER USE EFFICIENCY REPRORTING STRUCTURE IIT TRIAL PHASE 2
Data Capture and Storage
Monitoring, Assessment and Resource Allocation
Indicators
Agriculture NSW, Griffith (NSW)
Iva Quarisa & Michael Grabham
WUE Benchmarking project (funded through the Murrumbidgee Horticultural
Council) involved flying 1:30,000 aerial photos for horticulture plan to re -fly
every 5 years. Rice is mapped from 1:50,000 photos.
WUE Benchmarking project involved 25 irrigators recording irrigation events on
a card system on a voluntary basis. Some used the cards others did not record
all the necessary information. Results were stored in a spreadsheet.
Results of WUE Benchmarking project used for LWMP reporting and to feedback
to the irrigator.
There are no reporting requirements for horticulture at present, however most
properties in gazetted horticulture areas are allocated 12 ML /ha.
Rice is restricted to 6 ML /ha for all land suitable for rice production, however
the irrigator is only allowed to grow 1/3 of the rice suitable land to rice
(therefore the 6 ML /ha allocated to the remaining 2/3 can be applied to the
area grown to rice).
NSW Ag employ Farm Planning Officers to assist irrigators attending Farmwise
courses and develop irrigated property plans. The target is to assist 850
irrigator's complete plans.
NSW Ag interested in indicators such as ML /ha, $ /ha, T /ML and $ /ML for the
project area.
Murrumbidgee Irrigation, Griffith (NSW)
Sigrid Tijs & Leander Wiseman
Murrumbidgee Horticultural Council conducts an annual paper survey for crops
of 50 -100 irrigators. MI obtains this data and stores it in an Access database.

DEVELOPMENT OF A WATER USE EFFICIENCY REPRORTING STRUCTURE IIT TRIAL PHASE 2
WUE indicators include ML /ha, tonnes /ML, $ /ML (personal use only), and
Annual Water Balance (AWB) calculations performed using locally collected ETD
and crop coefficients (from CSIRO Land and Water)
Workshops are held for the growers on how to calculate $ /ML arbitrary values
are used for $ for the different crop types and qualities. Difficult to obtain
accurate prices from irrigators, so district average values for crop types are
obtained from industry marketing boards (eg Wine Marketing Board).
MI has spatial data for rice, horticulture, channels, outlets, etc and produce
maps using ESRI ArcMap software.
CSIRO Land and Water, Griffith (NSW)
Dr Shahbaz Khan & Dr Evan Christen
Concerns raised over how the WUE indicator values would be interpreted and
used for policy decisions. Emphasised the need to highlight the accuracy of the
WUE calculation.
Recharge from rainfall is entirely dependent on the management of the crops,
eg. the presence of winter crops between rows.
Found that deep drainage caused by excessive irrigation is highest in Spring,
during the first few irrigations, due to the full soil profile after winter rains.
Some suggestions on using testwell data to estimate water use efficiency and
felt contribution from ground water should be included in the daily water
balance calculation.
CSIRO provide accurate local crop coefficients and ETo for daily water balance
calculations.
Department of Land and Water Conservation (DLWC), Leeton (NSW)
Allan Brink
. Rice is the only crop with specific reporting requirements under LWMP. There
are no reporting requirements for horticulture.
DEVELOPMENT OF A WATER USE EFFICIENCY REPRORTING STRUCTURE IIT TRIAL PHASE 2
It is a condition of licence that rice growers complete and return a grower
survey, however it is not a regulatory requirement if it is not returned the
grower receives no licence the following year (100% return rate).
Water consumption records are vague due to additional water supply from up
to 2 or 3 bores, and difficulty in mapping water distribution within the
property.
LWMPs specify a maximum of 16ML /ha to be applied to rice (this can change
according to seasonal change). 12ML to grow the crop + 2ML to wet the
paddock + 2ML of drainage (surface runoff). If 16ML /ha is exceeded the land is
then classed as unsuitable for rice.
Department of Land and Water Conservation (DLWC), Deniliquin (NSW)
Tod Spencer
New Act coming soon (Water Management Act). The Act will include efficiency
rates for different crops (ML /ha).
Efficiency in tonnes of rice /ML of water delivered is calculated at a regional
scale.
Assessment of the irrigation district efficiency rather than individual property
efficiencies.
Rice is mapped from SPOT satellite images (20 metre pixels).
Murray Irrigation manages LWMPs and DLWC audit the LWMP funding.
Murray Irrigation Ltd, Deniliquin (NSW)
David. Watts
The SWAGMAN Series of models was developed jointly by CSIRO and Murray
Irrigation Ltd. This is similar to the IIT and FLWMM (crop mapping from
orthophoto and grower survey).
LWMPs have targets and initiatives set out, eg. 12mm of rain must be retained
on -farm, total farm plan guidelines require water to be quality tested before
being released into stormwater.
Murray Irrigation undertakes on -farm WUE calculation.
DEVELOPMENT OF A WATER USE EFFICIENCY REPRORTING STRUCTURE IIT TRIAL PHASE 2
Primary Industries (formally NRE), Tatura (VIC)
David Lawler, Andy McAllister, Chris Nicholson E Greg Richards
Seasonal variation (ie. drought) can cause large variations in irrigation
Tatura region has more annual crops than perennials, therefore the variability
on a property within each year is difficult to account for.
Satellite imagery was used to map broad -acre crops.
There are no set requirements to report on WUE in Victoria, but there are
limits to the quantity of water an irrigator can apply to a property (usually
about 10 ML /ha).
Whole Farm Planning encourages irrigators to use water more efficiently
through providing incentives for assistance and information. Assistance
includes re -use systems, laser grading, channel improvements and irrigation
system design.
Canneries conduct surveys of horticultural growers (only those supplying fruit to
the cannery) for crop forecasting and production planning purposes (called a
Fruit Census).
Primary Industries conducts an Irrigated Culture Census for Goulburn- Murray
Water (GMW) every 4 years (1997 ft 2001 completed). This involves collecting
crop information on a property basis down to the variety level.
Whole Farm Planning is the emphasis for Primary Industries, looking at
biodiversity, drainage issues and WUE.
Primary Industries (formally NRE), Irymple (VIC)
Dr Mark Kristic, Maxine Schake, Yasmin Chalmers, Jenny Treeby, Deanne
Burrows Ft Louise ?
It was suggested that it would be beneficial for the water ordering system to
have images of property, outlet and value boundaries on screen so the irrigator
to select which patches they wanted to order water for. An incentive scheme
exists in Victoria where irrigators who receive assistance through the scheme
must record their irrigation information on data sheets for 2 years. This is to
-10-

DEVELOPMENT OF A WATER USE EFFICIENCY REPRORTING STRUCTURE IIT TRIAL PHASE 2
prove that they are using the resources they received efficiently. This
information includes similar information to that collected through the FLWMM.
Primary Industries in Tatura are studying the potential use of effective canopy
area to adjust the crop coefficients instead of age and cope with different
canopy management. Suggested investigation of effective canopy area in
comparison to the age adjustment factor currently used in our WUE methods.
Primary Industries was interested in looking at developing a common set of
farm level irrigation record sheets for horticulture.
Western Murray Irrigation, Dareton (NSW)
Anthony Couroupis
Western Murray Irrigation produce an Annual Licence Report (for their bulk
licence) which reports on WUE using a similar method to that in the IIT.
Suggested including an option in the IIT WUE module to substitute ETD data into
the WUE calculation rather than using the LTAA data from the WAP.
DEVELOPMENT OF A WATER USE EFFICIENCY REPRORTING STRUCTURE IIT TRIAL PHASE 2
2.2. WUE Module PROPOSAL
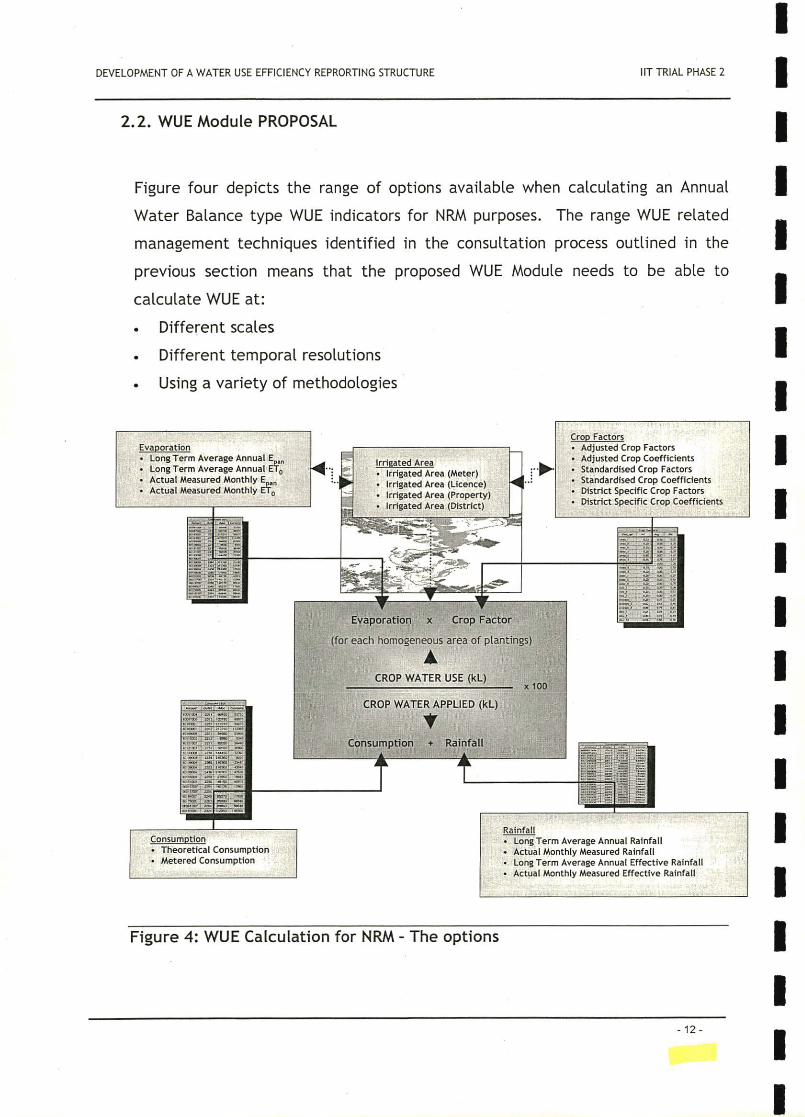
Figure four depicts the range of options available when calculating an Annual
Water Balance type WUE indicators for NRM purposes. The range WUE related
management techniques identified in the consultation process outlined in the
previous section means that the proposed WUE Module
calculate WUE at:
Different scales
Different temporal resolutions
Using a variety of methodologies
EvaporationLong Term Average Annual E.Long Term Average Annual ET,Actual Measured Monthly E.,,Actual Measured Monthly ETa
jrn -i._t_'.'rtT
Irrigated AreaIrrigated Area (Meter)Irrigated Area (Licence)Irrigated Area (Property)Irrigated Area (District)
needs to be able to
Crop FactorsAdjusted Crop FactorsAdjusted Crop CoefficientsStandardised Crop FactorsStandardised Crop CoefficientsDistrict Specific Crop FactorsDistrict Specific Crop Coefficients
i-
Evaporation x Crop Factor
(for each homogeneous area of plantings)
ACROP WATER USE (kL)
CROP WATER APPLIED (kL)
Consumption + Rainfall
x 100
ConsumptionTheoretical ConsumptionMetered Consumption
m
RainfallLong Term Average Annual RainfallActual Monthly Measured RainfallLong Term Average Annual Effective RainfallActual Monthly Measured Effective Rainfall
Figure 4: WUE Calculation for NRM The options
-12-

DEVELOPMENT OF A WATER USE EFFICIENCY REPRORTING STRUCTURE IIT TRIAL PHASE 2
The proposed WUE module will be developed as a customised menu (Figure 5)
within ESRI ArcMap software using the Visual Basic (VB) programming language
and ArcObjects. This menu will activate a series of forms allowing the user to
set the parameters for the WUE calculation.
IFile Edit View Insert Selection Tools Window _
I D a tiA a + (11:52,032
Editor Jg,.t: I
Figure 5 WUE Module Customised Menu
The first form to appear in the WUE calculation process will ask the user to
select the State, District and Irrigation Season for which WUE will be calculated.
These parameters will be selected from a series of pick lists, as shown in Figure
6.
1
W.District andSeasoC
Select State
Select District
Select Season
Cancel I
SA
ICOBDOGLA
j2001I2002 r.l
OK
Figure 6 Settings Form
The user will then be prompted to select the District Irrigation Database (Figure
7), as created by the IIT.
- 13 -

DEVELOPMENT OF A WATER USE EFFICIENCY REPRORTING STRUCTURE IIT TRIAL PHASE 2
Look in h GDB
Jffff
_O3D_2032_ LD.mdb
061) 2002.mdb
Name: ICOBD_2002.mdb
Show of type: I Personal Geodatabases
Figure 7 Select the district database
The name of this database will be crosschecked with the District and Season
selected on the previous form. If the variables do not match, the user will be
asked to re- select these parameters before continuing. If the district and season
match the selected database, a message will confirm the database to be used in
the calculation (Figure 8).
JDatabase name is COBD 2002,mdb
OKI
Figure 8 Confirm database
The WUE reporting level will need to be selected. There will be options to
calculate WUE at outlet or licence, property, district or bulk licence levels (see
Figure 9); the smallest unit being the outlet or licence, up to the largest level at
district scale. The WUE of a valve unit is not calculated within the WUE module.
The Valve Unit Level Report option is available for collating and reporting valve
unit indicators calculated through the Farm Level Water Management Module
(FLWMM).
In most cases, the consumption information is recorded at outlet or licence
level. For a calculation at this scale, the crop water use information for each
-14

DEVELOPMENT OF A WATER USE EFFICIENCY REPRORTING STRUCTURE IIT TRIAL PHASE 2
homogeneous patch is summed to the outlet level. WUE is then calculated for
this outlet or licence. At the property level, there may be more than one outlet
within a property. In this case, the crop water use and the outlet consumption
are summed for each homogeneous patch prior to WUE calculation. The same
procedure is used for the District scale calculation, with the crop water use
summed for each homogeneous patch, and the consumption for every outlet in
the district being tallied. The WUE is then calculated using these two summed
figures, giving a district level WUE result.
Select the Level of WUE Reporting
C Valve Unit Level Report (from FLWMM)
f Outlet / Private Licence/ Meter Level
Ç. Property Level
f District Level
t' Bulk Licence
Figure 9 Report Level
A number of different WUE indicators will be able to be calculated within the
WUE module. Figure 10 displays the proposed form for selecting the various WUE
indicators.

Barmera
DEVELOPMENT OF A WATER USE EFFICIENCY REPRORTING STRUCTURE IIT TRIAL PHASE 2
Calculation Method ? ;.
Please Select a WUE Indicator to calculate
Annual Water Balance Indicators
t' Long Term Average Climatic Conditions (LTA)
Method 'pan Evaporation / Crop Factors
r Actual Measured Monthly Climatic Conditions (AMM) i
Method7 rli ir¡^
I Include vegetable _çlopsincälçulätiöri
Other Indicators
r Yield Based Indicators
Choose the Desired Inputs for the Calculation
CancelI
OK
Figure 10 WUE Indicators
Under the Water Allocation Plan for the River Murray Prescribed Watercourse
(WAP), the method for calculating WUE is defined as:
Crop factors x evaporation
Water applied + rainfallX 100
This calculation uses long -term effective rainfall and Epan evaporation
information, and crop factors with age adjustments. This option is available
from the pick lists on the Calculation Method form, as shown in Figure 10. ET0
evaporation data and crop coefficients can also be used to calculate WUE. Both
these methods of calculation can be done using either long -term rainfall and
evaporation information or actual measured data.
I. Rain Station -Io]XISelect Rain Station to be used for Calculation
Cancel OK
Figure 11 Select Rain Station
- 16 -

DEVELOPMENT OF A WATER USE EFFICIENCY REPRORTING STRUCTURE IIT TRIAL PHASE 2
There is an option on this form asking the user whether or not to include
vegetable crops. The crop factors available in the WAP for vegetables assume all
vegetable crops are planted in a particular month. This assumption is not always
correct and as a result, a WUE calculation that excludes vegetables may be the
most accurate. If a user has access to more accurate crop factors for vegetables
they may wish to include this crop in the calculation.
Yield based indicators will also be available within the WUE module. This option
will allow WUE to be calculated based on tonnes of crop yield per mega litre of
water used, or dollars obtained per mega litre.
The next form to appear will ask the user to select the rainfall station nearest to
the chosen district to be used for the calculation (Figure 11).
WUE will be able to be calculated either annually or quarterly (Figure 12). The
ability to calculate WUE quarterly may be beneficial when attempting to monitor
the progress of one's WUE throughout the year. This will assist irrigators in
identifying problems and improving irrigation practises in order to achieve higher
WUE.
Report Pe bd?
Select the Report Period
C. Annual
C 1 st Quarter (Jul -Sep)
C 2nd Quarter (Oct -Dec)
r 3rd Quarter [Jan Mar)
r 4th Quarter (Apr -Jun)
CancelOK I
Figure 12 Report Period
4.
The rainfall, evaporation, crop factors /coefficients, age adjustment factors and
consumption tables can be selected using the form in Figure 13. These tables
- 17 -

DEVELOPMENT OF A WATER USE EFFICIENCY REPRORTING STRUCTURE IIT TRIAL PHASE 2
can be imported from anywhere on the users system and will be subsequently
stored in either the District Irrigation Database or the WUE_Tool.mdb.
It is proposed to set up a database (called WUE_Tool.mdb) to store tables used in
the WUE calculation, but not directly related to the individual District Irrigation
Databases. For example, the rainfall, evaporation, crop factor and age
adjustment tables may be used for the WUE calculation in more than one
district. It is these tables that will be stored in the WUE_Tool.mdb. Tables
relating only to one District Irrigation Database, such as consumption
information, will be stored within the district database.
Select Rainfall Table
I tblR ain_SA_2001 _LTA
Select Evaporation Tabes' " "' " " ""
i tblE vap_SA_2001 _LTA_E PAN
Select Consumption Table
jtblCons_SA_COBD 2001_YR
1
§, Select Crop Factor or Crop Coefficient Table
tb1CrFc_SA_LTA_E PAN
Select Age Factor Table
l tbld.gef_SA_LTA_E PAN
Cancel
Browse
Ll Browse
Browse
_i Browse
Browse 1
OK
`NOTE: The names of the tables in this form are working names only. More meaningfull names are to be generated.
Figure 13 Table Selection form
Once all the parameters and tables required for the WUE calculation have been
selected, the WUE module will compile the results. A message will appear
asking the user if they would like to see a table of results (Figure 14).
Do you want to display the results table ?
Yes
Figure 14 Display Table Query
- 18 -

DEVELOPMENT OF A WATER USE EFFICIENCY REPRORTING STRUCTURE IIT TRIAL PHASE 2
If 'Yes' is chosen, a table similar to that in Figure 15 will be displayed on the
screen. An option button will appear allowing the user to print the table to a
chosen printer.
41
o1..de1 ToTaFieo ITaecwa ITdeWee CONSUMPTIWLE Comments
2101 5547 38.02 582 673W
21100 756.19 66.57 7.92 75710
2104 550.13,4 36.95 6.02 58.590.
2105 98185 30.79 6.46 52300
2106 124.19.
-3662- 5.09 43510._..2107 561.34 3058 617 63250
2106. 479.55 3836 527 41480
120 74826 5415
5 63990
3.80 25400
2109, 535992111 32721 24.24
2118. 310.16 2191 3811 31100
2119; 2590 370 25950
8.83 66730
2121! 49297 36.11 541 35990
2121 52300 3985 575 49350. . .
2123 1,061.10 8920 1166 68240
2125: 25891 71.86 294 19510
1261 537.33 439/ á95 . 46040
2127, 238.56 1602 262 21890.._._..2129:.. 77304 68.36 ._....1086] 75740
15_ 29277 16041 ._._..3.221 24600
2131; __.77.66 6.861 216602132: 541.75 12.55' 616 27040133: 49619 4233'._._...-545 45460
2134 31581 55 58150_.
2135' 487.10 Z9.381:38 517 501102136. 44638 .29.51-._._5.ló 3184Ó
2137 501.52 1196 5.51; 69110138 45591 34.81 5.22' 37740139 524.71 3619 577 57250
.
140 436.69 7621 I BO 41200.....__ _._...tp 0 0 340 0
523479.95
57 58 .. . _.54.85 Goo( sl with ro á excluded76.70GcpfslwihroCFexclAed .._._.__. _..41.4082.901
2
61&b6619!88.001
73.371Gg{InlhroCFexcluded88.3173.OÌ .__ ...90.24
103.46
85.461
66.081 .. . .. . .__BI.99'OapSf.1wäroCFareluded.........,..58.33
....30.58 Gs+vie) voihsaCFexcluded131.08'Gopls) void, roCFexcluded
8395.513453.50
81.33Gods)voannoCFexüded58.89
8221 Gcnls) with no CF excluded61.10
RW7916
1
0 GaWi¡1coRE17 excluded. No mwmvllon Ip..e
. .6} f 0 s
!.
Figure 15 Results Table
The user will also have the option of generating a map of the chosen district. A
message box will prompt the user for a response to the question 'Do you want to
view a map of the results ?' (Figure 16).
Do you want to view a map of the results
Yes1
No I CancelI
Figure 16 Display Map Query
If the users choses 'Yes', a map, such as the one displayed in Figure 17, will be
displayed on the screen.

DEVELOPMENT OF A WATER USE EFFICIENCY REPRORTING STRUCTURE IIT TRIAL PHASE 2
b. c* v.nao& r ,1 d
.'"" ..
11421AMOlatIATOO7.1.1
4.
o
.._1 9al,.
It - 44ualgt.'31,,a.
Figure 17 Results Map
DEVELOPMENT OF A WATER USE EFFICIENCY REPRORTING STRUCTURE IIT TRIAL PHASE 2
3. IIT TRIAL PHASE 2
3.1. Cobdogla Irrigation district
In order to establish a baseline set of data for use in validation of the results
calculated using the WUE module, it has been required that generation of the
proposed indicators should take place using the relatively manual process of Arc
Macro Language (AML). This section outlines the analysis conducted on data
captured using the IIT using AML methodologies and will be used to ensure that
results calculated using the WUE module are correct.
3.1.1. Background
The total irrigated area mapped along the River Murray in South Australia has
increased over the last 15 years. The Murray Darling Basin Commission (MDBC)
imposed a cap on water diversions from the River Murray in 1994. This cap may
have led to the expansion of irrigation areas along the River, which has most
likely been driven by:
uptake of unused allocations,
enhanced water supply infrastructure,
increased efficiency of water use,
water traded from interstate.
In addition to this, there has been replanting of irrigated crops and upgrading of
their associated infrastructure in the past decade. Rehabilitation of irrigation
supply systems in Government irrigation districts commenced in 1992 in the
Cobdogla and Moorook irrigation districts, followed by Cadet and Mypolonga in
1994. This involved the conversion of supply infrastructure from open channels
and gates to pressurised pipes and metered outlets, allowing more reliable,
accurate and efficient delivery of irrigation water to irrigators.
A Geographic Information System (GIS) was set up to monitor the land use
change within these districts via a series of indicators. These included grower
surveys to collect crop type and irrigation system information, as well as- 21 -
DEVELOPMENT OF A WATER USE EFFICIENCY REPRORTING STRUCTURE IIT TRIAL PHASE 2
monitoring groundwater levels and grower participation in training courses. The
indicators recorded substantial change in all four irrigation districts relating
primarily to types of crops grown and methods of irrigation application. This
period of change also coincided with Si increase in the demand for grapes for
wine production. Rehabilitation provided a catalyst for change to more efficient
production.
The methodology used to conduct the 2001 /02 survey was vastly different to
that used in the four previous surveys (1993/94, 1995/96, 1996/97 and 1998/99).
The earlier surveys involved mapping cropped areas from aerial photography at
1:10 000 scale, using drive -by surveys and local knowledge to identify the crop
type and year planted. The irrigation system information was acquired from SA
Water and correlated to the crop information. The crop and irrigation surveys
were integrated, allowing the drive -by surveys to assist in identifying the
irrigation systems from the road.
The 2001/02 base data was mapped at a scale of 1:2 000 using digital ortho-
photography. On- ground surveyors from Central Irrigation Trust (CIT) collected
the crop and irrigation system information through grower interviews, using a
standardised survey form. This data was subsequently entered into a District
Irrigation Database using the IIT.
These five data sets have formed the basis of, and allowed, a number of change
detection processes to be undertaken. The water use efficiency (WUE) of
several variables within the district will also be examined.
3.1.2. Crop Types
Cobdogla Irrigation District has experienced vigorous growth and significant
change since rehabilitation of the irrigation supply systems commenced. Time -
series analyses of the five crop surveys have detected an increase in total area
planted for Cobdogla by 409 hectares to 3,095 hectares in 2001/02.
.22-

DEVELOPMENT OF A WATER USE EFFICIENCY REPRORTING STRUCTURE IIT TRIAL PHASE 2
The expansion of the wine industry in South Australia has led to land use changes
and crop expansion in Riverland districts. This is evident in the Cobdogla
Irrigation District where the expansion of vine plantings has led to the crop
continuing to dominate horticulture in the area. Figure 18 shows the continued
growth of vines in the district with decreased plantings of citrus, stonefruit and
vegetables. In the 2001 /02 irrigation season, vines constituted over 85% of the
planted area in Cobdogla, up from 70% in 1993/94. Vegetable crops experienced
the most significant decline with a 10% reduction in planted area since 1993/94.
100
90
80
70
60
50
40
30
20
10
0
Citrus Stonefruit Vegetables Vines Other
1993/94
1996/97
1998/99
2001 /2002
Figure 18 Major Crop Types for Cobdogla Irrigation District 1993/94 -
2001/02
The age profile for the major crop types in Cobdogla reflects the recent
expansion of vine plantings in the district (Table 1). Surveys conducted in
1993/94, 1998/99 and 2001/02 have been used for this analysis. Since 1994, 1
916 hectares of vines have been planted, representing 72% of the area under
vines in 2001/02. The addition of over 1 594 hectares of young vines between
1994 and 1998 indicates a period of rapid growth in the region, with the 2001 /02
survey data recording a reduced rate of expansion. In comparison to vines, the
net increase in citrus and stonefruit crops is relatively insignificant, with only 27
hectares and 39 hectares of new plantings respectively between 1994 and 2001.
- 23

DEVELOPMENT OF A WATER USE EFFICIENCY REPRORTING STRUCTURE IIT TRIAL PHASE 2
Table 1 Major Crop Type by Age for Cobdogla 1993/94 - 2001/02
Citrus Vines Stonefruit
Ages 93/94 98/99 01/02 93/94 98/99 01/02 93/94 98/99 01/02
0- 1 years 7 10 4 119 782 322 8 6 9
2 - 4 years 96 13 6 973 812 885 64 24 8
5 years and over 65 60 65 793 999 1452 45 32 28
Total Hectares 168 83 75 1886 2594 2659 117 62 45
For the 2001 /02 survey, crop water use efficiency was calculated based on the
crop age and type. Figure 19 displays the water use efficiency of the major crop
types. The results indicate that at the time of survey, the majority of citrus
crops were between 61% and 80% efficient. Vine grower efficiency tended to be
evenly distributed across two categories, making them between 61% and 100%
efficient. Of all the properties growing stonefruit, the majority were over 150%
water use efficient. This is an excessively high WUE result and may be
attributed to the grower applying less water than is usually required for crop
production, due to the reduced demand for fruit.
45
40
35
30
25
20
15
10
Citrus (n = 232) Vines (n = 3625) Stonefruit (n = 239)
1-40%n 41 - 60%
061 -80%
p 81 - 100%
101-120%121-150%p 151%+
`NOTE: Water Use Efficiency is measured using long -term annual average Epan evaporation and effective rainfall.
Figure 19 Crop Type by Water Use Efficiency for 2001/02
Although the majority of the stonefruit irrigators are over 150% efficient, a
general pattern of water use efficiency exists among the three major crop types.
- 24 -

DEVELOPMENT OF A WATER USE EFFICIENCY REPRORTING STRUCTURE IIT TRIAL PHASE 2
There are a few irrigators in the lower efficiency categories, the majority
between 61% and 100% and a few irrigators in the higher WUE groups. The
results indicate that only a small percentage of crops are over irrigated, and that
most plantings are being efficiently managed.
3.1.3.On -farm Irrigation Systems
Five on -farm irrigation system surveys have been conducted for Cobdogla
Irrigation District, representing the 1993/94, 1995/96, 1996/97, 1998/99 and the
2001/02 seasons. These data indicate that changes to irrigation systems have
also occurred as a result of the rehabilitation process.
The trend in on -farm irrigation system types in the Cobdogla Irrigation District
persists with properties continuing to adopt drip, overhead and under tree
sprinklers. The number of properties under furrow irrigation has declined
further; the 2001 /02 survey indicating furrow represents less than 4% of the total
area with systems. This change can be attributed to the rehabilitation process
with the improved method of water delivery to properties providing an incentive
for irrigators to adopt more efficient irrigation systems.
60
50
10
0
Drip Furrow Overhead Undertree
1993/94
D 1995/96
®1996/97
1998/99
2001/02
Figure 20 On -Farm Irrigation Systems 1993/94 - 2001/02
- 25 -

DEVELOPMENT OF A WATER USE EFFICIENCY REPRORTING STRUCTURE IIT TRIAL PHASE 2
Figure 21 illustrates a common distribution of WUE amongst the major irrigation
systems in the Cobdogla Irrigation District in 2001 /02. The majority of irrigators
with flood /furrow irrigation, and overhead or under canopy sprinklers are
irrigating between 61% and 100% efficiency. However, most of those with drip
irrigation tend to be distributed across three WUE categories; 61- 80 %, 81 - 100%
and 121 150 %. The relatively uniform distribution of different irrigation
systems in WUE categories indicates that perhaps there are other factors, aside
from irrigation system type, that influence WUE. Irrigation management
40
35
30
25
20
15
10
5
0
Drip Flood /Furrow Overhead Unde Canopy
01 - 40%
041 -60%0 61 - 80%
081 - 100%0 10 -120%121 -150%®151 %+
techniques are likely to play a pivotal role in determining the WUE of a property.
*NOTE: Water Use Efficiency is measured using long -term annual average Epan evaporation and effective rainfall.
Figure 21 Irrigation System by Water Use Efficiency for 2001/02
3.1.4. Property Size Profile
The size of properties in relation to WUE was examined for the 2001 /02 survey.
Figure 22 illustrates that the majority of properties with 2 or more hectares are
between 61% and 100% efficient. Those properties of less than 2 hectares are
more evenly distributed across all seven categories of WUE. The analysis also
shows that as the area of a property decreases, the distribution of properties in
the WUE categories increases.
26

DEVELOPMENT OF A WATER USE EFFICIENCY REPRORTING STRUCTURE IIT TRIAL PHASE 2
50
45
40
35
30
25
20
15
10
5
0- .9 2 -4.9 5 -9.9 10 -14.9
Property Size (hectares)
15+
p1-40%p41 -60%
61 - 80%
® 81 - 100%
p101-120%
121-150%D 151%+
*NOTE: Water Use Efficiency is measured using long -term annual average Epan evaporation and effective rainfall.
Figure 22 Property Area by Water Use Efficiency 2001/02
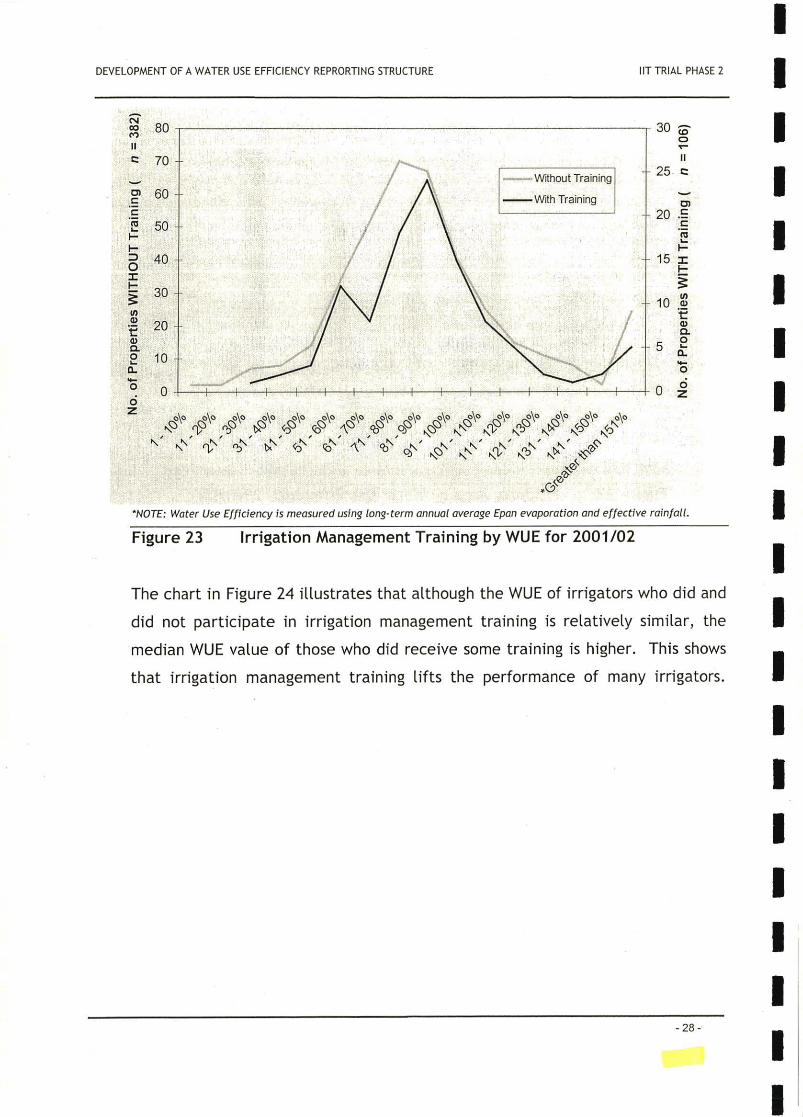
3.1.5. Participants in Irrigation Management Training
Of all irrigators who responded to the question regarding irrigation management
training in the Cobdogla Irrigation District, approximately 20% had participated
in some form of irrigation management training. Figure 23 compares the WUE of
irrigators who did and did not participate in irrigation management training. The
curve that represents those irrigators who did receive some training reveals a dip
around the 61 80% category. However, the results indicate a relative similarity
between the two groups.
DEVELOPMENT OF A WATER USE EFFICIENCY REPRORTING STRUCTURE IIT TRIAL PHASE 2
Nco 808II
c 70
co 60
L1 50IIO
40
_H 30--
E 20
ó 10A.
óO Ì + I I I 1 I I + I I I ; 1 1
Without Training
With Training
o
Z \ \ \ \ \ \ \ 1 \ \ \ \ \ 1 1 \Ooo OooOoo Ooo
OooOoo
Ooo Ooo Ooo Ooo Ooo Ooo Ooo Ooo Oooooh 0 1 ,\O N`L ^`3 \D'
ti Nti>
,5 .' / .' N.' ,' .' , - , , , ' ti cL `5 r
30 cñ
I I
25 z
rn20 .E
I15 =
10 ái
dc.5 °á
o
0 oz
'NOTE: Water Use Efficiency is measured using long -term annual average Epan evaporation and effective rainfall.
Figure 23 Irrigation Management Training by WUE for 2001/02
The chart in Figure 24 illustrates that although the WUE of irrigators who did and
did not participate in irrigation management training is relatively similar, the
median WUE value of those who did receive some training is higher. This shows
that irrigation management training lifts the performance of many irrigators.

DEVELOPMENT OF A WATER USE EFFICIENCY REPRORTING STRUCTURE IIT TRIAL PHASE 2
85
84
83
82
81
80
79
78
77
Without
Training
With
Training
"NOTE: Water Use Efficiency is measured using long -term annual average Epan evaporation and effective rainfall.
Figure 24 Median WUE of Irrigators With Ft Without Irrigation Training
3.1.6. Water Use Efficiency
Using the method outlined in the Water Allocation Plan for the River Murray
Prescribed Watercourse (and described in section X.X), the WUE of the
Cobdogla district in 1997/98 was 85 %. Since then, the WUE of the district has
decreased to 80 %. Due to the rehabilitation of the supply systems and the
consequent replacement of furrow irrigation with more efficient systems, we
would expect to see an increase in WUE. The reduction in WUE can be
attributed to the altered crop and irrigation system mapping techniques
employed for the 2001 /02 survey. The increased accuracy of the patch mapping
in 2001/02 has resulted in a decrease in the amount of irrigated area mapped.
This reduction in area significantly affects the results of the WUE calculation,
implying that the same amount of water is applied to a smaller area. In fact,
the area mapped using the previous method was not a true representation of the
irrigated area. The 2001/02 data and WUE results therefore more accurately
reflect the WUE of the district.

DEVELOPMENT OF A WATER USE EFFICIENCY REPRORTING STRUCTURE IIT TRIAL PHASE 2
3.2. Secondary IIT Trials
Having the IIT installed in the latter part of 2002, CIT have undertaken to survey
all of the district they operate using the methodologies proposed by this project.
Two of these districts are formally involved in this project, Kingston -on- Murray
near Overland Corner and Chaffey (Cooltong and Ral Ral) north of the Renmark
Irrigation Trust.
3.2.1. Kingston
Kingston is a small district comprising some 181 hectares. Patching and property
identification was completed in 1 day. Crop surveying took 10 days to complete
and data entry into the IIT District Irrigation Database took 1.5 days. Data is
about to be used to calculate Water Use Efficiency using the prototype WUE
module as part of a target under Milestone six.
3.2.2. Coo(tong and Rai Rai
Collectively, these two districts form the District of Chaffey. As a whole it is
larger than Kingston. It is slightly different from other districts in that it has a
history of this type of data collection and, as such has existing GIS databases, the
most up -to -date being 2000. However, these databases are not immediately
compatible with the IIT.
The 2000 crop survey data was imported into ArcMap to overlay the 2002 aerial
photo image of the district. Maps were printed showing the 2000 survey data on
the 2002 map and posted to growers. CIT are now following up on corrections
and changes made to properties since the 2000 survey, with 18 % of the district
completed so far. Once collected, the new information will then be entered into
the IIT, and then new maps (2003 aerial photo and 2002 -2003 irrigation season
data) will be printed and posted to the irrigators. So far, map set up, printing
and postage has taken six days while follow -up surveys have taken three.
- 30 -
DEVELOPMENT OF A WATER USE EFFICIENCY REPORTING STRUCTURE RECOMMENDATIONS FOR COST SHARING
4. RECOMMENDATIONS FOR COST SHARING
Cost sharing can be considered in three sections. Firstly there are those costs
related directly to production of WUE results. These are the operational costs.
Secondly, there are costs associated with software maintenance and update that
can be referred to as management costs. The third group of costs can be
referred to as tangential costs and can be associated with spin -off activities
initiated as a result of the establishment of a community data resource. Splitting
potential costs into these three groups reflects the potential for distinct groups
or organisations to take responsibility for them. However, while these distinct
groups have been given some consideration in the following section, the
situation, in reality, is quite dynamic and management structures put in place to
deal with the costs of- implementation should recognise this. It may actually be
the case that the best method of cost sharing sees individual organisations
contributing to each of these cost classes.
4.1. Operational Costs
The magnitude of operational costs will be directly related to frequency of
survey and /or reporting requirement. The key components include:
Software ft Hardware acquisition
Production of Orthophotography
Production of Property Plans
Irrigator Survey and Data Entry
Secondary Data Acquisition (e.g Climatic Information)
Report Generation
It is recommended that those requiring the information to be collected should
bear the bulk of these costs. Partnerships may be struck to reduce this burden
especially if certain tangential costs are foreseen. It is recommended that
widespread consultation take place prior to conduction of such activities to
ascertain the potential stakeholders /partners and engage them in the planning
process at the earliest possible point. The Milestone Four report outlines some
of these costs in dollar terms and breaks them down into "start up" and
- 31

DEVELOPMENT OF A WATER USE EFFICIENCY REPORTING STRUCTURE RECOMMENDATIONS FOR COST SHARING
"ongoing" costs. However, a full assessment of costs will be outlined in the final
report when it is possible to consider the project components (IIT, WUEM and
FLWMM) and their associated activities as a complete package.
4.2. Management Costs
Management costs are related to the upkeep and maintenance of the software
developed as part of this project. They can be split into two key components:
. Currency with host software platforms
These costs will be incurred when new versions of the host software are
widely adopted. In the main, they may be negligible as the software has
been designed to operate on relatively new platforms that use common
programming languages to perform their operations. The ESRI suite of ArcGIS
products can be assumed to have a considerable product life as they are
broadly acknowledged as leaders in the field and have a history of longevity
between significant revisions. Minor costs may be expected to be borne by
tool operators and will be associated with such processes as database
upgrade. However, significant revisions to the host software platform will
require contribution from the MDBC in order to ensure the currency of the
tools and protect the investment of the tool operators in data acquisition and
maintenance. This is particularly true is subsets of the information stored at
the district level are to be fed up the tree for informing policy makers
through a mechanism such as the Irrigation Management Information
Reporting System (IMIRS).
Currency with industry/processor standards
These costs are associated with ensuring that the standard data coding
structures built into the tools are maintained. This is essential for facilitating
data capture in an environment where the data are dynamic. Examples of
this include the planting of new varieties of crops, the adoption of new32
DEVELOPMENT Of A WATER USE EFFICIENCY REPORTING STRUCTURE RECOMMENDATIONS FOR COST SHARING
irrigation systems and the proliferation of new crop types driven by market
demands (e.g. the Wine boom). It is reasonable to expect some investment
in these costs by industry /processor groups since the information store in the
district irrigation database will provide valuable forecasting data and could
provide the basis for accreditation of irrigators through schemes such as
Environmental Management Systems. Bodies such as Horticulture Australia or
processor groups such as cannery companies or large wineries may be keen to
invest in this area.
4.3. Tangential Costs
Tangential costs are those associated with requested modification to the tools
operations to facilitate the establishment of partnerships with groups whose
sole focus is not WUE. These partnerships should be investigated and sought
after to enhance the ongoing viability of WUE inquiry. Costs associated with
these types of activities should be borne entirely by the partners for whom
the modifications are to be incorporated. Benefits will include improved
relationships between irrigators and regulators through the integration of NRM
activities with economic stimuli thus making NRM activities relevant in the
planning and operation of the whole farm.
- 33 -

DEVELOPMENT OF A WATER USE EFFICIENCY REPRORTING STRUCTURE COMMUNICATION PROGRAM
5. RESULTS COMMUNICATION PROGRAM
5.1. Communication Tactics
The following communication tactics are recommended to complement tactics
being undertaken as part of the broader Irrigated Regions Communication
Strategy. The tactics outlined here are common to all projects under the
Watermark umbrella. Annotation describes the current status of the task.
See Appendix 1 for a detailed list of Communication Tactics.
5.1.1. Brand the project
a) Create a logo for the WUE project and a distinctive visual style for
communication materials, which complements the new Watermark and
MDBC SIEtE style guide. COMPLETED
b) Create a template for PowerPoint presentations, reports and emails.
COMPLETED
5.1.2. Communication Network
a) Develop a master contact list and internal /external email networks.
b) Send letter to irrigators informing them of the WUE project and how they
can be involved, CIT, November 2001. COMPLETED
c) Target existing email list servers (e.g. MDBC, LAWNinfo) to report on
project progress and trial outcomes. IN PROCESS
d) Send letter to irrigators informing them of the survey and requesting their
cooperation and time. COMPLETED
e) Send follow -up letter to irrigators thanking them for their cooperation,
report on results of the survey and provide CIT growers with a property
plan. COMPLETED
- 34 -

DEVELOPMENT OF A WATER USE EFFICIENCY REPRORTING STRUCTURE COMMUNICATION PROGRAM
5.1.3. Presentations and Publications
a) Information Session, Mildura, May 2001, July 2002, late 2002 *, late
2003 /early 2004 *. IN PROCESS
b) Communication Strategy Meeting, Mildura, May 2001. COMPLETED
c) Working Group, Mildura, May 2001. COMPLETED
d) Information Session,.Tatura, 1 June 2001, late 2002 *, late 2003 /early
2004 *. COMPLETED
e) Presented a paper outlining the project at the ANCID conference, Bunbury,
WA, July 2001. COMPLETED
f) Information Session, Griffith, 8 -9 August 2001, late 2002 *, late 2003 /early
2004 *. COMPLETED
g) Participated in the Riverland Field Days, Monash, 12 -13 September 2001.
COMPLETED
h) Presentation to Industry Development Board Horticulture, Adelaide,
February 2002. COMPLETED
i) Presentation to the MDBC Partnership workshop, Hepburn Springs, March
2002. COMPLETED
j) Presentation to the River Murray Catchment Water Management Board,
Adelaide, April 2002. COMPLETED
k) Presentation to the River Murray Catchment Water Management Board,
Murray Bridge, May 2002. COMPLETED
L) Display a poster at the Irrigation Association Australia conference, Sydney,
21 -23 May 2002. COMPLETED
m) "National workshop to initiate establishment of national standards for
irrigated crop water balance and ETc field methodologies ", 27 June 2002.
COMPLETED
n) Information Session, Berri, July 2002, late 2002 *, late 2003 /early 2004 *. IN
PROCESS
o) ESRI User Group Meeting, 3 July 2002. COMPLETED
p) Presentation to Riverland Citrus Group, 4 July 2002. COMPLETED
q) Publish the Crop Standard, August 2002. PENDING
- 35 -

DEVELOPMENT OF A WATER USE EFFICIENCY REPRORTING STRUCTURE COMMUNICATION PROGRAM
r) Present at OZRI 2002 Conference on IIT, 27 -28 August 2002. COMPLETED
s) Present a paper on the project progress at the ANCID Conference,
September 2002. COMPLETED
t) Presentation at Riverlink forum, 28 October 2002. COMPLETED
u) Grower Information Day, Loxton Centre, 8 November 2002. COMPLETED
v) Present at MDBC Irrigation Forum, McLaren Vale, 13 -15 November 2002.
COMPLETED
w) Present at Sunraysia Rural Water Board, 14 November 2002. COMPLETED
x) Present the FLWMM to Jim Hauion, Loxton Centre, 25 November 2002.
COMPLETED
y) Present the FLWMM to the Bookpurnong Irrigators group, 6 December 2002.
COMPLETED
z) Present the FLWMM and IIT to representatives of the Onkaparinga
Catchment Water Managment Board, 22 January 2003. COMPLETED
aa) Present the IIT and FLWMM and obtain feedback through Interstate
Information Exchange tour, Griffith, Leeton, Deniliquin, Tatura, Mildura
and Dareton, 27 -31 January 2003. COMPLETED
bb) Present the FLWMM and IIT to South East Benchmarking project
management committee, 10 March 2003. COMPLETED
cc) Present the FLWMM and IIT to Renmark Citrus Growers group, 11 March
2003. COMPLETED
dd) Present the FLWMM and IIT to Waikerie Citrus Growers group, 12 March
2003. COMPLETED
ee) Present the FLWMM and IIT to Loxton Citrus Growers group, 12 March 2003.
COMPLETED
ff) Present the FLWMM and IIT to Barossa Viticulture Technical Committee
including representatives from the Northern Adelaide Planis Catchment
Water Management Board, 18 March 2003. COMPLETED
gg) Present the FLWMM at the DWLBC Seminar Series, Adelaide, 19 March
2003. COMPLETED
hh) Participate in the Central Irrigation Trust Irrigation Efficiency Expo, May
2003. COMPLETED
-36-

DEVELOPMENT OF A WATER USE EFFICIENCY REPRORTING STRUCTURE COMMUNICATION PROGRAM
ii) Participate in the WUE workshop, Dubbo, 6 May 2003. COMPLETED
jj) Present at the Irrigation Association Australia conference, Dubbo, 7 May
2003. COMPLETED
kk) Present at the ANCID conference, July 2003. PENDING
ll) Publish a paper in an irrigation /horticulture journal /magazine.
PENDING
mm) Target existing newsletters to report on project progress and trial
outcomes. PENDING
'Date is unconfirmed
5.1.4. Media Program
nn) Select a media spokesperson and review their media skills, and potential
launch of the IIM tool in the Riverland. PENDING
a) Prepare press releases for local media regarding project trials and
outcomes. PENDING
5.1.5. Promotional Kit
a) Create a WUE fact sheet. PENDING
b) Create a brochure for the WUE project. PENDING
c) Create posters of irrigator case studies. PENDING
d) Establish a WUE project website and look at including an overview and
context of the project, a project fact sheet, contact information, a
summary of the project outcomes, updates on progress of the project, and
a feedback mechanism. PENDING
e) Develop a standard Microsoft PowerPoint presentation of the Irrigation
Inventory Tool to demonstrate the tools application and use. PENDING
- 37 -

Partner categories targetedStrategy Tactics /Evaluation Responsibility Timing1 2 3 4 5 6 7 8
Brand the ProjectCreate a logo for the WUE project and adistinctive visual style for communicationmaterials, which complements the newWatermark and MDBC SI &E style guide.
Project Management Team,UM and FLWMM WorkingGroups
August 2002
i i i i i V/ i j Create a template for PowerPointpresentations, reports and emails.
Project Management Team,DEH
August 2002
j i i CommunicationNetwork
Develop and review a master contact listand intemaliextemal email networks.
DEH Established & Ongoing
Send letter to irrigators informing them of theWUE project and how they can be involved.
CIT, PIRSA November 2001 &November 2002
Target existing email list servers (e.g. MDBCWatermark Projects, LAWNinfo) to report onproject progress and trial outcomes.
Project Management Team Ongoing
Send letter to irrigators informing them of thesurvey and requesting their cooperation andtime.
CIT, SunRISE 21 Inc. Pre 01 -02 survey &pm 02 -03 survey
Send follow -up letter to irrigators thankingthem for their cooperation, report on theresults of the survey and provide CITgrowers with a property plan.
CIT, SunRISE 21 Inc.
Presentations andPublications
Information Session, Mildura. Project Management Team May 2001, July 2002, late2002 *, late 2003 /early 2004"
Communication Strategy Meeting, Mildura. Project Management Team May 2001
Working Group, Mildura. Project Management Team May 2001
Information Session, Tatura. Project Management Team 1 June 2001, late 2002 *, late2003 /early 2004'
Present at the ANCID conference, Bunbury,WA.
Project Management Team(Gerrit Schrale)
July 2001
lllllw NM 111111. lllIII M I S r IIIII MEP

11111 MSS III IlIMI 0 ION IIN lllllllls MI ll IlllMI
Partner categories targetedStrategy Tactics /Evaluation Responsibility Timing
1 2 3 4 5 6 7 8
Presentationsand Publications
Information Session, Griffith. Project Management Team 8-9 August 2001, late 2002',late 2003 /early 2004'
Participate in the River land Field Days, Monash. DEH, PIRSA 12 -13 September 2001
V Presentation to Industry Development BoardHorticulture, Adelaide.
Project Management Team February 2002
1 1 V 1 1 Presentation to the MDBC Partnership workshop,Hepburn Springs.
Project Management Team March 2002
Presentation to the River Murray Catchment WaterManagement Board, Adelaide.
Project Management Team April 2002
j Presentation to the River Murray Catchment WaterManagement Board, Murray Bridge.
Project Management Team May 2002
1 1 V V Display posters at the Irrigation Association Australiaconference, Sydney.
PIRSA - ICMS May 2002
Information Session, Beni. Project Management Team July 2002, late 2002', late2003 /eady 2004
V ESRI User Group Meeting, Adelaide. DEH 3 July 2002
Presentation to Rivedand Citrus Group. Project Management Team 4 July 2002
1 V 1 .1 V 1 Publish the Crop Standard. DEH August 2002
1 V OZRI 2002 Conference, Brisbane. Project Management Team 27 -28 August 2002
1 1 Present a paper on the project progress at theANCID Conference.
Project Management Team September 2002
Grower Information Day, Loxton Centre PIRSA 8 November 2002
V V V 1 1 Present at and participate in Irrigation Forum,McLaren Vale, SA.
DEH, PIRSA 13-15 November 2002
Present at Sunraysia Rural Water Board. SunRise21, PIRSA 14 November 2002
Presentation of the FLWMM to Jim Hallion, LoxtonCentre.
PIRSA 25 November 2002

A0
Partner categories targeted Strategy Tactics /Evaluation Responsibility Timing1 2 3 4 5 6 7 8
Presentationsand Publications
Publish a paper in an irrigation or horticulturejournal/magazine.
Project Management Team December 2002,,,,,,, Presentation of the FLWMM to Bookpumong irrigatorsGroup.
PIRSA 6 December 2002- ,,, Present the FLWMM and IIT to representatives ofOnkaparinga Catchmentt Water Managment Board.
DEH, PIRSA 22 January 2003- ,, Present the IIT and FLWMM and obtain feedbackthrough Interstate Information Exchange tour.
DEH, PIRSA 27 -31 January 2003
-,,,,,,-III,,,,,,1H
Present the FLWMM and IIT toB nchmarking project management co
DEH. PIRSA 10 MatvhNh 2003
FLWMM and IIT to Renmark CitrusGrowers
DEH, PIRSA 11 March 2003-III-,,, FLWMM and IIT to Waikerie CitrusGrowers group
DEH, PIRSA 12 March 2003
Present the FLWMM and IIT to Loxton Citrus Growers DEH, PIRSA 12 March 2003
Present the FLWMM and IIT to Barossa ViticultureTechnical Committee including representatives fromthe Northern Adelaide Planis Catchment WaterManagement Board.
DEH, PIRSA 18 March 2003
-,,,,,,/ ,,,,,/ ,/. /
the FLWMM to DWLBC Seminar Series,Adelaide.
PIRSA 19 March 2003
Participate in Central Irrigation Trust IrrigationEfficiency Expo.E
DEH, PIRSA May 2003_ Participate in the WUE Workshop, Dubbo. PIRSA 6 May 2003, / , Present at the Irrigation Association Australiaconference.
Project Management Team 21 -23 May 2003
"National workshop to initiate establishment of nationalstandards for irrigated crop water balance and ETc fieldmethodologies ".
Project Management Team 27 June 2002
llll liii OS SEEM 1111, NMI 0 III Si ON Ma

DEVELOPMENT OF A WATER USE EFFICIENCY REPRORTING STRUCTURE COMMUNICATION PROGRAM
-41-