Efficiency Maine Trust Home Energy Savings Program Final
85
Efficiency Maine Trust Home Energy Savings Program Final Evaluation Report November 30, 2011 Prepared for: Efficiency Maine Trust 151 Capitol Street, Suite 1 Augusta, ME 04330 Prepared by: The Cadmus Group, Inc. / Energy Services 57 Water Street Watertown, MA 02472 617.673.7000
Transcript of Efficiency Maine Trust Home Energy Savings Program Final

Efficiency Maine Trust
Home Energy Savings Program
Final Evaluation Report
November 30, 2011
Prepared for:
Efficiency Maine Trust 151 Capitol Street, Suite 1 Augusta, ME 04330
Prepared by:
The Cadmus Group, Inc. / Energy Services 57 Water Street Watertown, MA 02472 617.673.7000

Prepared by: Allison Bard
Dave Korn Cheryl Winch
Ryan Cook Andrew Carollo
Shannon Donohue Mark Sevier
The Cadmus Group, Inc. Acknowledgment: This material is based upon work supported by the Department of Energy under Award Number DE-EE0000368. Disclaimer: This report was prepared as an account of work sponsored by an agency of the United States Government. Neither the United States Government nor any agency thereof, nor any of their employees, makes any warranty, express or implied, or assumes any legal liability or responsibility for the accuracy, completeness, or usefulness of any information, apparatus, product, or process disclosed, or represents that its use would not infringe privately owned rights. Reference herein to any specific commercial product, process, or service by trade name, trademark, manufacturer, or otherwise does not necessarily constitute or imply its endorsement, recommendation, or favoring by the United States Government or any agency thereof. The views and opinions of authors expressed herein do not necessarily state or reflect those of the United States Government or any agency thereof.

Efficiency Maine Trust HESP Evaluation September 25, 2012
The Cadmus Group Inc. / Energy Services i
Contents
Executive Summary ..............................................................................................I
1. Introduction ................................................................................................1
1.1 Evaluation Objectives .................................................................................................... 1
1.2 Program Description ...................................................................................................... 1
1.3 Evaluation Design ......................................................................................................... 1
2. Methodology ...............................................................................................3
2.1 Impact Evaluation Methodology ................................................................................... 3
Sampling 3
Site Visits 3
Engineering and Simulation Analysis 4
Utility Billing Analysis 4
Verified Savings and Realization Rate 5
Net Savings and Attribution Analysis 6
Cost-Effectiveness Analysis 6
2.2 Survey Research Methodology ...................................................................................... 7
Survey Sampling 7
Survey Analysis 7
3. Participant Profile and Characteristics ....................................................9
3.1 Demographics ................................................................................................................ 9
3.2 Descriptive Statistics ................................................................................................... 10
Fuel and Distribution Type 10
HVAC Distribution System 14
Water Heating Type and Fuel 19
3.3 Site Visit Observations ................................................................................................ 21
4. Impact Analysis Findings ....................................................................... 29
4.1 Gross Savings .............................................................................................................. 29
4.2 Net-To-Gross Analysis ................................................................................................ 30
Freeridership Analysis 31
Spillover Analysis 32
NTG 33

Efficiency Maine Trust HESP Evaluation September 25, 2012
The Cadmus Group Inc. / Energy Services ii
4.3 Program-Level Savings ............................................................................................... 33
4.4 Utility Bill Review ...................................................................................................... 36
4.5 Job Impacts .................................................................................................................. 38
4.6 Cost-Effectiveness ....................................................................................................... 38
Total Resource Cost Test 38
SEP-RAC Test 41
4.7 Carbon Emission Displacement .................................................................................. 41
5. Survey Analysis Findings ....................................................................... 44
5.1 Motivations and Decisions .......................................................................................... 44
Initial Program Participation 44
Participation Motivations 47
Participation Decision Factors 49
5.2 Barriers ........................................................................................................................ 50
5.3 Satisfaction .................................................................................................................. 51
Satisfaction with Program Administration 53
Satisfaction with Program Results 54
6. Recommendations and Conclusions .................................................... 56
6.1 Energy-Efficiency Recommendations ......................................................................... 56
6.2 Program Recommendations ......................................................................................... 58
Appendix A: Net-to-Gross Evaluation Overview ................................................i
Appendix B: Limitations of Increasing Heating System Efficiency with Existing Distribution Systems ........................................................................ viii
Appendix C. Insulating Basements ....................................................................x
Appendix D. Contacting Fuel Providers............................................................xi
Efficiency Maine Trust HESP Evaluation September 25, 2012
The Cadmus Group, Inc. / Energy Services iii
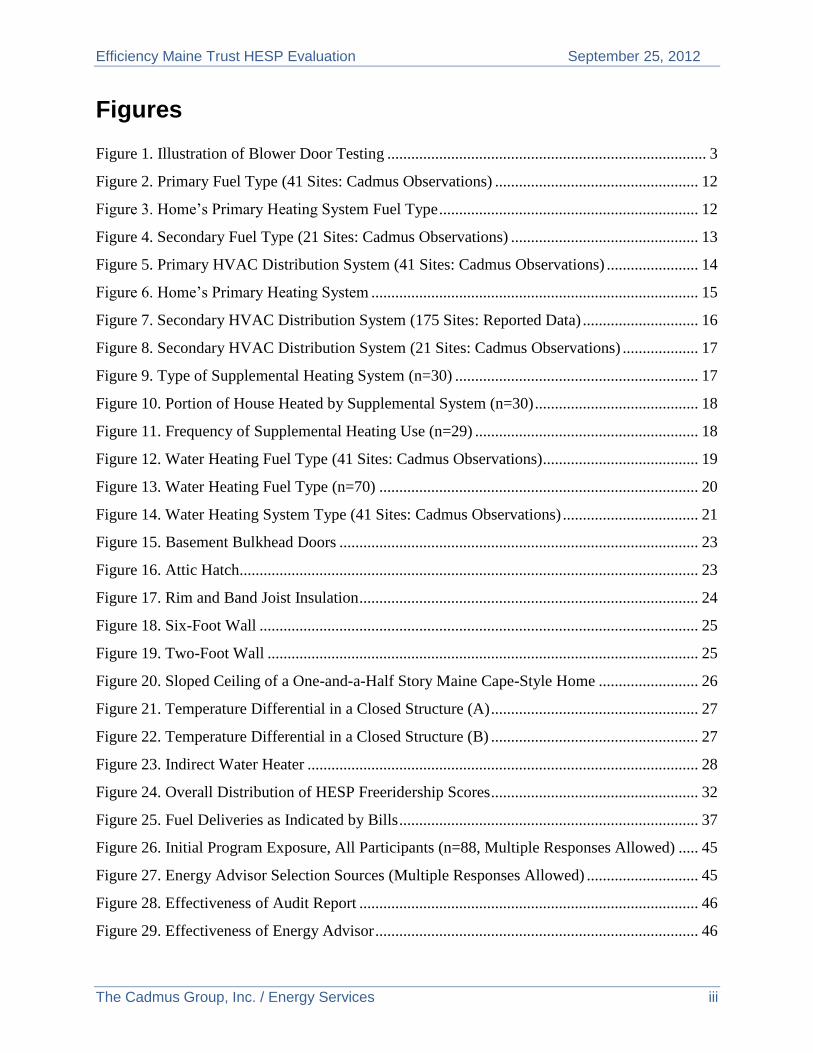
Figures
Figure 1. Illustration of Blower Door Testing ................................................................................ 3
Figure 2. Primary Fuel Type (41 Sites: Cadmus Observations) ................................................... 12
Figure 3. Home’s Primary Heating System Fuel Type ................................................................. 12
Figure 4. Secondary Fuel Type (21 Sites: Cadmus Observations) ............................................... 13
Figure 5. Primary HVAC Distribution System (41 Sites: Cadmus Observations) ....................... 14
Figure 6. Home’s Primary Heating System .................................................................................. 15
Figure 7. Secondary HVAC Distribution System (175 Sites: Reported Data) ............................. 16
Figure 8. Secondary HVAC Distribution System (21 Sites: Cadmus Observations) ................... 17
Figure 9. Type of Supplemental Heating System (n=30) ............................................................. 17
Figure 10. Portion of House Heated by Supplemental System (n=30) ......................................... 18
Figure 11. Frequency of Supplemental Heating Use (n=29) ........................................................ 18
Figure 12. Water Heating Fuel Type (41 Sites: Cadmus Observations)....................................... 19
Figure 13. Water Heating Fuel Type (n=70) ................................................................................ 20
Figure 14. Water Heating System Type (41 Sites: Cadmus Observations) .................................. 21
Figure 15. Basement Bulkhead Doors .......................................................................................... 23
Figure 16. Attic Hatch................................................................................................................... 23
Figure 17. Rim and Band Joist Insulation ..................................................................................... 24
Figure 18. Six-Foot Wall .............................................................................................................. 25
Figure 19. Two-Foot Wall ............................................................................................................ 25
Figure 20. Sloped Ceiling of a One-and-a-Half Story Maine Cape-Style Home ......................... 26
Figure 21. Temperature Differential in a Closed Structure (A) .................................................... 27
Figure 22. Temperature Differential in a Closed Structure (B) .................................................... 27
Figure 23. Indirect Water Heater .................................................................................................. 28
Figure 24. Overall Distribution of HESP Freeridership Scores .................................................... 32
Figure 25. Fuel Deliveries as Indicated by Bills ........................................................................... 37
Figure 26. Initial Program Exposure, All Participants (n=88, Multiple Responses Allowed) ..... 45
Figure 27. Energy Advisor Selection Sources (Multiple Responses Allowed) ............................ 45
Figure 28. Effectiveness of Audit Report ..................................................................................... 46
Figure 29. Effectiveness of Energy Advisor ................................................................................. 46

Efficiency Maine Trust HESP Evaluation September 25, 2012
The Cadmus Group, Inc. / Energy Services iv
Figure 30. Recommended Improvements ..................................................................................... 47
Figure 31. Home Energy Audit Motivations ................................................................................ 48
Figure 32. Energy Improvement Installation Motivations ............................................................ 48
Figure 33. Influences on the Decision to Invest in Energy Improvements ................................... 49
Figure 34. Interactive Influence of Federal Tax Credit and Rebate ............................................. 50
Figure 35. Overall Program Satisfaction ...................................................................................... 52
Figure 36. Likeliness to Recommend ........................................................................................... 52
Figure 37. Post-Program Home Comfort Level Improvements (Multiple Responses Allowed) 54
Figure 38. Post-Program Heating System Usage .......................................................................... 55
Figure 39. 41 Site Total Energy Savings: HESP Database ........................................................... 56
Figure 40. 41 Site Total Energy Savings: Cadmus Observations ................................................. 57
Figure 41. Condensing Boiler Efficiency Curve.......................................................................... viii

Efficiency Maine Trust HESP Evaluation September 25, 2012
The Cadmus Group, Inc. / Energy Services v
Tables
Table 1. Program and Evaluation Period Metrics ........................................................................... 2
Table 2. Summary of Evaluation Tasks .......................................................................................... 2
Table 3. Participant Sampling ......................................................................................................... 7
Table 4. Demographic Information ................................................................................................. 9
Table 5. HESP Participant Home Descriptive Statistics ............................................................... 10
Table 6. Primary Fuel Type .......................................................................................................... 11
Table 7. Secondary Fuel Type ...................................................................................................... 13
Table 8. Primary HVAC Distribution System .............................................................................. 14
Table 9. Water Heating Fuel Type ................................................................................................ 19
Table 10. Water Heating Type ...................................................................................................... 20
Table 11. Behavioral Statistics ..................................................................................................... 21
Table 12. Reasons for Blower Door Test Incompletes ................................................................. 22
Table 13. HESP Realization Rate: Measure-Level ....................................................................... 29
Table 14. Comparison between Reported Database and Verified Infiltration Values .................. 30
Table 15. HESP Freeridership Results.......................................................................................... 31
Table 16. Qualitative Spillover Responses Attributable to Program ............................................ 33
Table 17. HESP NTG Results ....................................................................................................... 33
Table 18. Annual Energy Savings by Measure Type in MMBTUs .............................................. 34
Table 19. Annual Energy Savings in MMBTUs ........................................................................... 34
Table 20. Annual Energy Savings by Fuel Type (in Consumption Units) ................................... 35
Table 21. Lifetime Energy Savings in MMBTUs ......................................................................... 35
Table 22. Lifetime Energy Saving by Fuel Type .......................................................................... 36
Table 23. TRC Inputs and Assumptions ....................................................................................... 39
Table 24. Annual Savings, Avoided Fuel Costs, and Added Fuel Costs, by Fuel Type .............. 40
Table 25. TRC Results for the HESP............................................................................................ 40
Table 26. Components and Results of the SEP-RAC Test ........................................................... 41
Table 27. Annual and Lifetime Carbon Emissions Displaced from HESP .................................. 43
Table 28. Full Participant Concerns, Prior to Participation (n=18) .............................................. 51
Table 29. Participation Barriers (Multiple Responses Allowed) .................................................. 51

Efficiency Maine Trust HESP Evaluation September 25, 2012
The Cadmus Group, Inc. / Energy Services vi
Table 30. Contractor Work Performance ...................................................................................... 53
Table 31. Rebate Turnaround Times ............................................................................................ 53
Table 32. Satisfaction with Rebate Turnaround Times ................................................................ 53
Table 33. Home Comfort Level Changes ..................................................................................... 54
Table 34. Post-Program Energy Bill Changes .............................................................................. 55
Table 35. Post-Program Energy Bill Expectations ....................................................................... 55
Table 36. Final Gross Realization Rate and Savings—By Measure ............................................ 56
Table 37. Annual Energy Savings by Measure Type in MMBTUs .............................................. 57
Table 38. Assignments of HESP Survey Response Options into Matrix Terminology ................ iii
Table 39. Full HESP Freeridership Scoring Matrix....................................................................... iv
Table 40. Frequency of Freeridership Scoring Combinations ...................................................... vii
Table 41. Fuel Bill Receipt ........................................................................................................... xi

Efficiency Maine Trust HESP Evaluation September 25, 2012
The Cadmus Group, Inc. / Energy Services I
Executive Summary
This report presents the results of an impact evaluation of the Efficiency Maine Trust (Efficiency
Maine or Trust) Home Energy Savings Program (HESP or Program), conducted by The Cadmus
Group, Inc. (Cadmus). The HESP is a residential, whole-house, energy-efficiency program that
targets existing homes in Maine, and is available to any residence in Maine that is heated during
the winter (regardless of occupants’ income levels).
The evaluation addressed the following research objectives:
Determine energy savings;
Evaluate the cost-effectiveness and job creation potential (due to funding from the
American Recovery and Reinvestment Act (ARRA));
Compute carbon emissions reductions and environmental impacts; and
Assess customer satisfaction.
Cadmus understands Efficiency Maine could offer a rebate to Maine residents for whole-home
retrofits because of the availability of ARRA funds. The funds have since been exhausted. The
HESP program structure remains to help residents initiate and complete whole home retrofits and
participants can borrow through the Maine PACE program to help finance the upgrades, but the
monetary rebate/partial reimbursement is no longer offered. However, some of the
recommendations in this report are contingent on the availability of future funding.
Energy Savings
Cadmus visited 41 HESP project sites and, using engineering review and simulation modeling,
estimated gross program savings (verified savings) and realization rates. Cadmus compared
verified savings with the limited number of utility bills available. Given the number of bills and
variability of fuel deliveries, this was a qualitative assessment, rather than a formal billing
analysis. Cadmus determined net savings via a customer survey.
As a result of the analysis, Cadmus determined the following:
The average gross realization rate for the verified measures was 90%. Realization
rates varied among the installed measures and can be found in Table E-1.

Efficiency Maine Trust HESP Evaluation September 25, 2012
The Cadmus Group, Inc. / Energy Services II
Table E-1. Realization Rate by Measure Type
Measure Type Reported Savings Verified Savings Realization Rate Air Sealing 566 585 103%
Attic Hatch 29 18 62%
Basement Insulation 381 305 80%
Ceiling Insulation 568 328 58%
Wall Insulation 462 584 127%
Furnace/Boiler 82 51 62%
Total (41 Sites) 2,087 1,871 90%
Cadmus found that program documented and claimed (reported) HESP measure
installations matched field observations, except at a few sites.
o Cadmus staff conducted blower door testing at 31 of the 41 sites. At these sites, air
sealing results were nearly identical (99%) of values reported by Efficiency Maine.
o The verified area in square feet of insulation was 98% of the reported area.
The Efficiency Maine HESP had a gross program realization rate of 88% and a net
program realization rate of 76%.
o Table E-2 and E-3 compare annual reported energy savings by fuel type with annual
verified gross energy savings by measure type, and by fuel type, respectively. These
data were expressed in MMBTUs, where all fuel types, including electricity, were
converted to MMBTUs.
Table E-2. Annual Energy Savings by Fuel Type
Annual Energy Savings by Fuel Type
(MMBTUs)
Reported Gross
Savings
Verified Gross
Savings
Gross Realization
Rate
Net-to-
Gross (NTG)
Verified Net Savings (Verified Gross *
NTG)
Net Realization
Rate
Measures
(n)
Fuel Oil 132,063 110,638 84% 0.86 95,148 72% 8,373
Natural Gas 1,244 4,965 399% 0.86 4,270 343% 2,070
Propane 763 2,052 269% 0.86 1,765 231% 1,376
Wood 3,635 3,315 91% 0.86 2,851 78% 374
Kerosene 732 615 84% 0.86 529 72% 102
Electric 3,024 2,908 96% 0.86 2,501 83% 749
Corn Pellet 22 17 76% 0.86 15 65% 17
Total (1780 Sites) 141,485 124,509 88% 0.86 107,077 76% 13,061

Efficiency Maine Trust HESP Evaluation September 25, 2012
The Cadmus Group, Inc. / Energy Services III
Table E-3 shows lifetime net energy savings attributable to the HESP.
Table E-3. Lifetime Energy Savings by Fuel Type
Lifetime Energy Savings by Fuel Type
(MMBTUs)
Reported Gross
Savings
Verified Gross
Savings
Gross Realization
Rate
Net-to-
Gross (NTG)
Verified Net Savings (Verified Gross *
NTG)
Net Realization
Rate
Measures
(n)
Fuel Oil 3,044,152 2,569,517 84% 0.86 2,209,785 73% 8,373
Natural Gas 87,296 156,880 180% 0.86 134,917 155% 2,070
Propane 55,068 76,932 140% 0.86 66,162 120% 1,376
Wood 91,216 83,203 91% 0.86 71,555 78% 374
Kerosene 17,617 14,786 84% 0.86 12,716 72% 102
Electric 40,278 37,597 93% 0.86 32,333 80% 749
Corn Pellet 563 426 76% 0.86 367 65% 17
Total (1780 Sites) 3,336,191 2,939,342 88% 0.86 2,527,834 76% 13,061
Carbon Emissions Reductions and Environmental Impacts
Cadmus calculated displaced greenhouse gas emissions, associated with Efficiency Maine’s
HESP. To conduct this analysis, Cadmus used verified net energy impacts, in terms of net tons of
carbon emissions, avoided over the effective useful life of the projects.
Table E-4. Annual and Lifetime Carbon Emissions Displaced from HESP
Fuel Type Total GHG Emissions Displaced Tons CO2e Annual Lifetime
All Fuels (without Biomass) 8,443 196,735
Biomass 347 8,707
Cost-Effectiveness of ARRA-Funded Programs
Table E-5 presents results of cost-effectiveness analysis, based on the Total Resource Cost
(TRC) Test, calculated using gross reported savings, adjusted realized savings, and adjusted net
savings. The HESP is comfortably cost-effective in all three scenarios.

Efficiency Maine Trust HESP Evaluation September 25, 2012
The Cadmus Group, Inc. / Energy Services IV
Table E-5. Program TRC
Value Reported Gross
Savings Scenario Verified Gross
Savings Scenario Verified Net
Savings Scenario MMBTU Savings 141,485 124,509 107,077
Avoided Energy Benefits $70,097,059 $59,597,884 $51,254,180
Added Energy Costs $6,879,199 $4,710,016 $4,050,614
Participant Incremental Costs $16,387,212 $16,387,212 $14,093,002
Program Delivery $1,078,868 $1,078,868 $1,078,868
Marketing $642,111 $642,111 $642,111
Administration $187,155 $187,155 $187,155
TRC Benefits $70,097,059 $59,597,884 $51,254,180
TRC Costs $25,174,546 $23,005,363 $20,051,751
TRC Ratio 2.78 2.59 2.56
The DOE SEP-RAC test is an alternate, cost-effectiveness metric, evaluating whether projects
save at least 10 million source BTUs (10 MMBTUs) annually, the threshold for ARRA-funded
programs. The HESP saves 13.41 net adjusted MMBTU per $1,000 in ARRA expenditures,
passing the SEP-RAC test. Table E-6 provides details of the SEP-RAC test analysis.
Table E-6. Components and Results of the SEP-RAC Test
Category Value RHA MMBTU Savings – Adjusted Gross 124,509
TR MMBTU Savings – Gross 8,762
Total Gross MMBTU Savings 133,271
Net-to-Gross Ratio 86%
Total Net MMBTU Savings 114,613
HESP Incentives (Including Bonus Payments) $6,641,237
Program Delivery $1,078,868
Marketing $642,111
Administration $187,155
Total ARRA Expenditures $8,549,371
MMBTU/$1000 13.41
Customer Satisfaction
This evaluation included talking with HESP participants about their program experiences.
Cadmus conducted surveys, overseeing implementation of 100 participant surveys by a
subcontractor, the Gilmore Group; this included full participants—defined as those completing
home energy upgrades and receiving an HESP rebate—and partial participants, defined as those
with an energy audit but not following through to completion. Cadmus also talked with
participants during site visits. At the highest level, survey results indicate the following:
Program participants were very satisfied. Field staff described participants as very
satisfied with services and incentives they received. Participants reported being more
comfortable in their homes, and seeing a noticeable decreases in their fuel bills.
o Most full survey participants (87%) reported being “very satisfied” with program
participation.

Efficiency Maine Trust HESP Evaluation September 25, 2012
The Cadmus Group, Inc. / Energy Services V
The HESP rebate motivated participants to initiate the audit and invest in improvements,
as did the possibility of saving money on their energy bills.
The rebate provided a more effective incentive to complete energy upgrades, compared to
tax credits.
Upfront costs presented the most significant participation barrier to making
recommended energy upgrades.
Key Recommendations
Cadmus recommends that Efficiency Maine:
1. Continue to emphasize the importance of thorough air sealing practices.
2. Work with its energy advisors to:
a. Ensure they target areas within the home that will lead to the greatest energy savings
achievements (e.g., empty wall cavities).
b. Emphasize the importance of installation quality.
c. Continue building partnerships and supplying contractors with information that can
be used to help promote program offerings.
3. Consider expanding its current marketing techniques by:
a. Using “homeowner stories” in program promotional channels beyond the
Website.
b. Developing marketing messages that inspire residents’ trust, and highlight
participants’ very positive experiences with program paperwork.
c. Enhancing the “return on investment” (ROI) appeal for low-cost measures to
increase uptake on these recommended improvements.

Efficiency Maine Trust HESP Evaluation September 25, 2012
The Cadmus Group, Inc. / Energy Services I
This page left blank.

Efficiency Maine Trust HESP Evaluation September 25, 2012
The Cadmus Group, Inc. / Energy Services 1
1. Introduction
1.1 Evaluation Objectives The Efficiency Maine Trust (Efficiency Maine or Trust) hired The Cadmus Group, Inc (Cadmus)
to verify energy savings and program effects of the Home Energy Savings Program (HESP). The
HESP was funded by the State Energy Program (SEP) American Recovery and Reinvestment
Act (ARRA) funds. Cadmus’ evaluation estimated the:
Gross and net energy savings impacts over the effective useful life (EUL) of the
program’s actions;
The net tons of carbon not released into the atmosphere over the EUL of projects
implemented;
The number of short-term and long-term, and full-time and part-time jobs generated due
to the program; and
Results of the SEP Recovery Act cost-effectiveness test, applied to the energy impacts
achieved.
1.2 Program Description From December 2009 through 2011, Efficiency Maine delivered a residential whole-house
efficiency program, targeted toward existing homes in Maine. Any Maine home heated during
the winter was eligible to apply for and receive a program rebate, regardless of income level of
the owner or occupant.
Predominantly a weatherization program, HESP focused on air sealing and on wall, attic and
ceiling insulation measures. Other eligible measures included heating system replacement,
domestic hot water (DHW) system replacement, controls, windows, doors, and renewable energy
systems, such as wind or solar.
The program sought to weatherize and improve the overall energy efficiency of residences
throughout Maine and to, on average, achieve 25% total annual energy savings per residence.
The program addressed all fuels (heating oil, kerosene, natural gas, propane, wood, and
electricity), primarily focusing on fuels used for space heating and hot water.
The program offered financial incentives (rebates) to homeowners for the installation of eligible
efficiency measures. The program offered two incentive levels:
Tier 1 (a maximum of $1,500 per home) for projects projected to save at least 25% of the
annual thermal (heating and hot water) energy used in the home; and
Tier 2 (a maximum of $3,000 per home) for more comprehensive projects, such as multi-
measure installations projected to result in energy reductions of 50% or more.
1.3 Evaluation Design The evaluation sample frame was designed to use as much program data as possible, while still
ensuring evaluation participants would have had a chance to observe changes within their home

Efficiency Maine Trust HESP Evaluation September 25, 2012
The Cadmus Group, Inc. / Energy Services 2
post-measure installation, and decreasing the risk that Cadmus technicians would inspect sites
where the installation was incomplete. Considering these factors, the sample frame was defined
as HESP participants who received an energy audit between December 1, 2009, and December
31, 2010. This resulted in a total of 1,780 sites as a part of the evaluation population.
Table 1 shows how the evaluation period compares to the total program period.
Table 1. Program and Evaluation Period Metrics
Metric HESP Program Evaluation Period Audits Completed 5,026 1,780
Rebate Reservations (Actual) 3,667 1,780
Completed Upgrades (Actual) 3,211 1,540
Average Upgrade Cost $8,349 $12,286
Total Cost, All Upgrades $26,810,236 $19,019,182
Average HESP Incentive Paid $2,610 $2,585
Total HESP Incentives Paid $8,380,265 $4,559,951
Cadmus used a variety of techniques to evaluate impacts of the HESP, as shown in Table 2.
Table 2. Summary of Evaluation Tasks
Action Impact Process Details Verify Measure Installation
Conducted 41 site visits (includes on-site, detailed customer interviews) and measurement and verification.
Engineering and Simulation (Modeling) Analysis
Developed revised deemed unit savings estimates for installed measures and conducted an engineering analysis (including engineering review and simulation modeling) to estimate program savings and gross realization rates.
Analyze Energy Bills (limited)
Examined gas, electric, oil, and propane bills as a point of comparison to modeling. After extensive efforts Cadmus obtained 5 gas bills, 15 fuel oil bills, and 2 propane bills. Cadmus was able to report findings for a total of 19 bills (15 fuel oil bills and 4 gas bills).
Survey Participants Conducted telephone survey to measure customer satisfaction and areas for improvements and attribution. (n=70)
Survey Partial-Participants
Conducted telephone survey to measure program awareness and reasons for not participating. (n=30)
The impact analysis compared program savings estimated from Cadmus’ engineering and
simulation modeling (verified savings) to the program’s reported savings. The verified energy
savings were based on data Cadmus collected from the 41 site visits.
Responses from the full and partial participant survey were used to calculate net-to-gross (NTG)
and obtain a qualitative understanding of program spillover.
Verified energy savings were qualitatively compared with energy consumption observed through
the billing data, which was collected separately from Maine fuel providers.
Cadmus estimated additional HESP impacts including the number of jobs created, the program’s
Total Resource Cost (TRC) and MMBTUs saved per $1,000 spent, and the displaced greenhouse
gas emissions in terms of net tons of carbon emissions avoided over the EUL of the measures.

Efficiency Maine Trust HESP Evaluation September 25, 2012
The Cadmus Group, Inc. / Energy Services 3
2. Methodology
2.1 Impact Evaluation Methodology
Sampling
Cadmus designed a site visit sample to reach the goal, stated in the proposal, of a one-tailed
90% confidence and ±10% precision (90/10) across the HESP’s participants. In designing the
sample, Cadmus estimated 41 site visits would be required to reach 90/10.
Site Visits
Cadmus visited 41 HESP sites during the first two weeks in August 2011. During these site
visits, Cadmus technicians:
Offered $25 gift cards as an incentive to participants who agreed to partake in a site visit.
Verified the installation of claimed measures:
o Type of measure;
o Application area of the measure;
o Thickness (where applicable) of the installation; and
o R-Value (where applicable) of the installation.
Documented the quality of the installation and operation.
Gathered efficiency measure characteristics (e.g., furnace model and efficiency setting).
Used infrared cameras or thermal scans (where possible) to check for proper installation
of wall insulation.
Completed blower door tests (where possible) to determine air exchanges per minute to
assess the success of building weatherization. Figure 1 illustrates an installed blower door
during a site visit.
Figure 1. Illustration of Blower Door Testing
Recorded temperature and schedule settings of programmable thermostats.

Efficiency Maine Trust HESP Evaluation September 25, 2012
The Cadmus Group, Inc. / Energy Services 4
Checked aerator and showerhead flow rates through flow bags.
Interviewed participants to better understand their use of their home’s heating system(s).
Gathered the necessary home characteristics (e.g., square footage of home, number of
windows).
Engineering and Simulation Analysis
Cadmus examined HESP program databases, visited 41 sites, and gathered detailed information
about each site, as described in the previous section. Using collected house and user behavior
data, Cadmus used REM/Rate1 software to create a model that simulated the energy performance
of each house and estimated its energy consumption during (1) pre-installation conditions and (2)
post-installation conditions.
To establish the home’s state prior to the weatherization, Cadmus staff interviewed the
homeowner and inspected the structure to determine baseline insulation levels, and assess the
operational mechanical equipment installed. Each home was then modeled based on the level of
energy efficiency observed during the site visit (post-installation conditions: installed measure
and home characteristics) and the level of energy efficiency before participation in the HESP
program as indicated by the homeowner and, where possible, verified by Cadmus (pre-
installation conditions).
Cadmus used REM/Rate to evaluate weather-dependent measures2. Weather-dependent measures
include air sealing, insulation (wall, ceiling, and basement or crawlspace), attic hatch, and
heating equipment. Two REM/Rate models were run for each house, taking into account heating
system type, and observed wall, ceiling, and basement dimensions, and insulation values.
The resulting total home energy savings from the models divided into per-measure energy
savings values. The difference in the pre- and post-consumption was used to estimate energy
savings at the measure level. Cadmus compared the verified savings for each house and measure
to reported values, producing realization rates at the measure level.
Utility Billing Analysis
At the start of the evaluation, Cadmus planned to collect billing data from the 41 site visit
participants to assess their fuel consumption during the 12-month period prior to the installation
of HESP measures, and compare this with their consumption during the 12-month period after
the installation. The intent was to give Cadmus a qualitative view of consumption to compare
with results of the modeling efforts.
1 REM/Rate software produces a home energy rating report based on the RESNET (Residential Energy Services
Network) National HERS Technical Standards. It is endorsed by RESNET and is HERS BESTEST certified.
REM/Rate is designed in accordance with the Mortgage Industry National Home Energy Rating Systems
Standard, a widely accepted standard to gauge home energy performance and apply a HERS rating. Our
experience with REM/Rate has shown it to accurately model insulation and predict energy usage, and provide
accurate and cost-effective energy savings results for typical residential homes. 2 Cadmus verified the installation of hot water, lighting, and appliance measures during site visits.

Efficiency Maine Trust HESP Evaluation September 25, 2012
The Cadmus Group, Inc. / Energy Services 5
Cadmus believed this comparison would be a valuable addition to the evaluation, but anticipated
that the billing analysis could be constrained by the small sample, or difficulty when interpreting
fuel deliveries. Unfortunately, it was more challenging to obtain and interpret fuel data than
expected so the analysis was limited to simple comparison of the billing data with our
engineering analysis of savings for a subsample of sites.
Verified Savings and Realization Rate
Cadmus used data collected from the site visits to complete the engineering and simulation
analysis. This analysis estimated verified energy savings attributable to the HESP. These verified
gross energy savings were then compared with reported gross energy savings to determine
realization rates. For this report, gross realization rate has been defined as follows:
[Verified Gross Energy Savings / Reported Gross Energy Savings = Gross Realization Rate]
Cadmus determined gross realization rates for the following specific measure types:
Air sealing
Attic hatch
Basement insulation
Ceiling insulation
Wall insulation
Furnace/Boiler
The realization rate for furnace or boiler replacement measures resulted from Cadmus’
modification of assumed efficiency levels. Out of the 41 sites sampled, four sites completed
furnace or boiler replacements. The sample of four sites was too small to predict a realization
rate, so Cadmus completed a file review of 247 of the 480 heating system replacements. The
measure’s baseline efficiency was fixed at 80% based on Cadmus’ experience that all but the
oldest units have moderate efficiencies. The nominal furnace efficiency was retained (e.g. 93%),
however the upper level of the replacement boiler efficiency was set to 90% based on our
concern that return water temperatures limit upper level efficiencies in practice. (See Appendix
C for a detailed discussion of condensing efficiencies.) Savings were calculated from these
adjusted efficiency levels and consumption predicted by the implementation contractor. Savings
were further adjusted by a ratio of Cadmus’ modeled consumption and the predicted
consumption which decreased the savings by about 5%.
Cadmus applied measure-level savings estimates to all relevant measures in the population. This
led to verified annual energy savings for the program (in MMBTUs). This was then broken out
by fuel type to obtain annual energy savings (in fuel-specific units).
Then, Cadmus estimated the lifetime verified energy savings by fuel type by applying the EUL
values of the specific measures (as provided in the HESP database) to all measures installed as a
part of the projects within the sample frame.

Efficiency Maine Trust HESP Evaluation September 25, 2012
The Cadmus Group, Inc. / Energy Services 6
Subsequent analysis led to an overall program gross realization rate, which was the ratio of the
total verified gross energy savings to the total reported gross energy savings for the specific
measures.
Net Savings and Attribution Analysis
In the participant survey, Cadmus asked targeted questions to pinpoint attribution of impacts to
SEP ARRA funding. The questions had varied approaches to ensure effects attributable to the
SEP ARRA funds would be differentiated from effects attributable to other funding sources
included in the program (e.g., federal tax credits), and from effects of other events and sources
not related to SEP ARRA funds.
The results of these questions were tabulated and analyzed using methods similar to those of the
overall participant and partial participant surveys.
Cadmus used the survey results to develop estimates of freeridership. These estimates were then
used to compute an NTG ratio. The NTG ratio was applied to the verified gross savings to
determine verified net savings. For this report, net realization rate has been defined as follows:
[Verified Net Energy Savings / Reported Gross Energy Savings = Net Realization Rate]
Additionally, the estimated net savings served as the inputs for the TRC and SEP Recovery Act
Cost (SEP-RAC) tests.
Greenhouse gas emissions reduction equivalents associated with verified energy impacts, in
terms of net tons of carbon emissions avoided over the effective useful life of the projects, were
also calculated using the net verified savings.
Cost-Effectiveness Analysis
Cadmus calculated HESP cost-effectiveness using the SEP-RAC test and the TRC test. The SEP-
RAC test, developed by the Department of Energy (DOE), specifies that, on average, each state’s
portfolio of programs’ energy impacts should be no less than 10 million source BTUs per year,
per $1,000 of SEP ARRA funds spent. The TRC test is an industry-standard metric for
evaluating program cost-effectiveness outlined in the California Standard Practice Manual,3
which compares energy savings benefits (avoided costs) to program administrator and customer
costs.
For the cost-effectiveness tests, Cadmus used net savings determined by verified gross energy
savings and the NTG ratio. This approach will aid the Trust in successfully determining the
program’s cost-effectiveness, with respect to achieving its declared energy-efficiency goals.
3 California Public Utilities Commission (CPUC). 2001. California Standard Practice Manual Economic Analysis of
Demand-Side Programs and Projects. Sacramento, CA: Governor’s Office of Planning and Research, State of
California.
Efficiency Maine Trust HESP Evaluation September 25, 2012
The Cadmus Group, Inc. / Energy Services 7
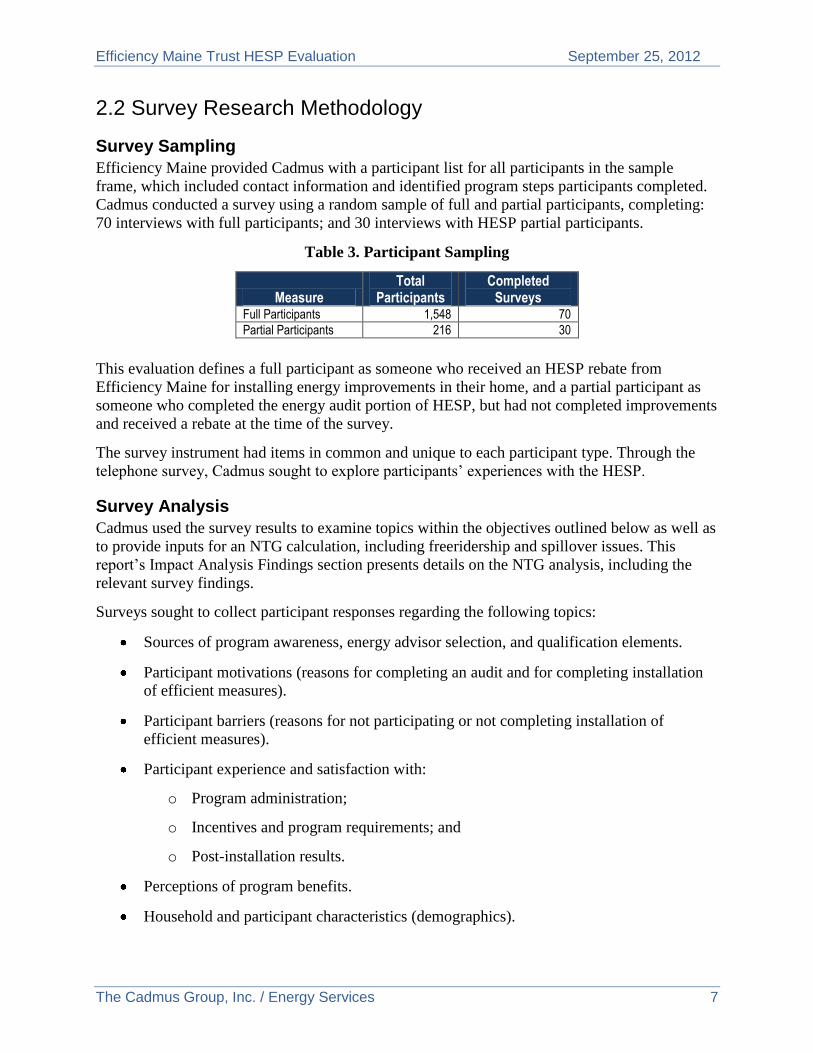
2.2 Survey Research Methodology
Survey Sampling
Efficiency Maine provided Cadmus with a participant list for all participants in the sample
frame, which included contact information and identified program steps participants completed.
Cadmus conducted a survey using a random sample of full and partial participants, completing:
70 interviews with full participants; and 30 interviews with HESP partial participants.
Table 3. Participant Sampling
Measure Total
Participants Completed
Surveys Full Participants 1,548 70
Partial Participants 216 30
This evaluation defines a full participant as someone who received an HESP rebate from
Efficiency Maine for installing energy improvements in their home, and a partial participant as
someone who completed the energy audit portion of HESP, but had not completed improvements
and received a rebate at the time of the survey.
The survey instrument had items in common and unique to each participant type. Through the
telephone survey, Cadmus sought to explore participants’ experiences with the HESP.
Survey Analysis
Cadmus used the survey results to examine topics within the objectives outlined below as well as
to provide inputs for an NTG calculation, including freeridership and spillover issues. This
report’s Impact Analysis Findings section presents details on the NTG analysis, including the
relevant survey findings.
Surveys sought to collect participant responses regarding the following topics:
Sources of program awareness, energy advisor selection, and qualification elements.
Participant motivations (reasons for completing an audit and for completing installation
of efficient measures).
Participant barriers (reasons for not participating or not completing installation of
efficient measures).
Participant experience and satisfaction with:
o Program administration;
o Incentives and program requirements; and
o Post-installation results.
Perceptions of program benefits.
Household and participant characteristics (demographics).

Efficiency Maine Trust HESP Evaluation September 25, 2012
The Cadmus Group, Inc. / Energy Services 8
There were instances where Cadmus received non-responses and “don’t know” responses. As a
result, the base size (n=number of responses) for responses to certain questions fell below 70 for
full participants, 30 for partial participants, or 100 for all participants.

Efficiency Maine Trust HESP Evaluation September 25, 2012
The Cadmus Group, Inc. / Energy Services 9
3. Participant Profile and Characteristics
3.1 Demographics Table 4 shows household and individual characteristics for full and partial HESP participants,
based on the survey data. On average, 2.6 persons were living in HESP participant households.
Full participants tended to have smaller households than partial participants. Specifically, 63% of
full participant households included one or two people living in the home full-time, while 61% of
partial participant households included three or more people living in the home full-time. All full
and partial survey respondents owned their homes.
Full participants were, on average, older than partial participants, with 53% of full participants
ages 55 or older, compared to 27% of partial participants.
The most common income bracket for both full and partial participants was $50,000 to $100,000,
with 54% of participants reporting that level. A total of 35% of partial participants reported
annual household incomes of $100,000 or higher, compared to 16% of full participants. More
full participants (30%) lived in households making $50,000 or less annually than did partial
participants (12%).
Table 4. Demographic Information
Number of people living in home on a full-time basis
Full (n=69) Partial (n=28) Total (n=97) Frequency Percent Frequency Percent Frequency Percent
1 12 17% 3 11% 15 15%
2 32 46% 8 29% 40 41%
3 10 14% 6 21% 16 16%
4 12 17% 7 25% 19 20%
5 1 1% 3 11% 4 4%
6 2 3% 1 4% 3 3%
Homeownership status Full (n=70) Partial (n=30) Total (n=100)
Frequency Percent Frequency Percent Frequency Percent Own 70 100% 30 100% 100 100%
Rent 0 0% 0 0% 0 0%
Age category of survey respondent
Full (n=69) Partial (n=30) Total (n=99) Frequency Percent Frequency Percent Frequency Percent
18 to 24 0 0% 0 0% 0 0%
25 to 34 4 6% 3 10% 7 7%
35 to 44 10 14% 5 17% 15 15%
45 to 54 18 26% 14 47% 32 32%
55 to 64 23 33% 2 7% 25 25%
65 to 74 11 16% 5 17% 16 16%
75 or more 3 4% 1 3% 4 4%
Annual household income Full (n=61) Partial (n=26) Total (n=87)
Frequency Percent Frequency Percent Frequency Percent Less than $25,000 1 2% 1 4% 2 2%
$25,000 up to $50,000 17 28% 2 8% 19 22%
More than $50,000 up to $100,000 33 54% 14 54% 47 54%
More than $100,000 up to $200,000 8 13% 8 31% 16 18%
More than $200,000 2 3% 1 4% 3 3%

Efficiency Maine Trust HESP Evaluation September 25, 2012
The Cadmus Group, Inc. / Energy Services 10
Highest educational attainment Full (n=68) Partial (n=30) Total (n=98)
Frequency Percent Frequency Percent Frequency Percent Less than a high school diploma 1 1% 2 7% 3 3%
Completed high school diploma or equivalent (GED)
4 6% 0 0% 4 4%
Some college 1 1% 2 7% 3 3%
Completed a 2 year or technical degree/certification
5 7% 3 10% 8 8%
Completed a four year degree 25 37% 7 23% 32 33%
Graduate or professional degree-MA, MSc, PhD, LLB
32 47% 16 53% 48 49%
Gender of survey-taker Full (n=70) Partial (n=30) Total (n=100)
Frequency Percent Frequency Percent Frequency Percent Male 42 60% 18 60% 60 60%
Female 28 40% 12 40% 40 40%
3.2 Descriptive Statistics As a part of this evaluation, Cadmus completed basic data analysis to compile descriptive
statistics regarding the homes participating in the HESP. The tables below show reported data as
well as the data collected by Cadmus during the site visits.
Table 5. HESP Participant Home Descriptive Statistics
Fuel and Distribution Type
The subsequent charts and tables show the reported and verified primary heating system and fuel
types for all of the sites within the evaluation period. This analysis was performed for the four
different participant subsets:
1. The data from all projects within the evaluation period as reported in the HESP database.
The population size is 1,780, unless otherwise specified.
2. The data from the projects within the evaluation period that were a part of Cadmus’ site
visit sample as reported in the HESP database. The sample size is 41, unless otherwise
specified.
3. The observed (verified) data from the Cadmus site visits. The sample size is 41, unless
otherwise specified.
4. The responses received from the full and partial participant survey. The sample size is
30, 70, or 100, or specified otherwise.
Statistic Program Reported
Averages (1780 Sites) Program Reported Averages (41 Sites)
Verified Averages (41 Sites)
Occupants 3.09 2.51 Not collected
Living Space Square Footage 2,296 1,948 2,314

Efficiency Maine Trust HESP Evaluation September 25, 2012
The Cadmus Group, Inc. / Energy Services 11
Primary Fuel Type
This section outlines primary fuel types used by the HESP participants, based on program data
and Cadmus site inspections. The majority of residents in Maine heat their homes with oil. This
was also the case with HESP participants as the primary fuel source for three-quarters of all
participants was oil. Nine percent heated their home primarily with natural gas, and 6% primarily
heated with propane.
The distribution of reported primary fuel type of sampled sites was similar to that for the entire
sample frame, showing the random sample generally represented the larger population.
Table 6. Primary Fuel Type
Primary Fuel Type Reported Primary Fuel
Type (Total Sites) Reported Primary Fuel Type
(Sampled Sites) Verified Primary Fuel Type
(Sampled Sites) Fuel Oil 74.94% 68.29% 63.41%
Natural Gas 8.71% 9.76% 19.51%
Propane 6.12% 4.88% 4.88%
Wood 1.97% 2.44% 7.32%
Electric 1.07% 0% 0%
Kerosene 0.96% 0% 0%
Geothermal 0% 0% 2.44%
Pellet Wood 0% 0% 2.44%
Not Listed 6.24% 14.63% 0%
Total (Sites) 1,780 41 41
The fuel types observed during Cadmus’ site visits generally matched that reported in program
data. Oil and natural gas were the two most dominant fuel types. However, Cadmus technicians
documented geothermal and pellet wood as a primary source of fuel for 5% of participants.
There was a higher usage of natural gas and wood observed by Cadmus.

Efficiency Maine Trust HESP Evaluation September 25, 2012
The Cadmus Group, Inc. / Energy Services 12
Figure 2. Primary Fuel Type (41 Sites: Cadmus Observations)
According to the participant surveys, fuel oil was the most common primary heating source fuel,
matching the population at the site visit sample. Gas and propane did not match as closely,
however, participants may not fully understand their fuel use.
Figure 3. Home’s Primary Heating System Fuel Type
Secondary Fuel Type
The HESP program database and Cadmus site visits also captured secondary fuel types. Only a
small portion of the participants (n=175) in the evaluation period reported any secondary fuel
Fuel Oil 63%
Geothermal 3%
Propane 5%
Natural Gas 20%
Wood (Cord) 7%
Pellet Wood 2%

Efficiency Maine Trust HESP Evaluation September 25, 2012
The Cadmus Group, Inc. / Energy Services 13
source in program data. Of those 175, 31% used oil as their secondary source and 21% used
wood. Thirteen percent used natural gas and 12% used propane.
Table 7. Secondary Fuel Type
Secondary Fuel Type
Reported Secondary Fuel Type (Total Sites)
Reported Secondary Fuel Type (Sampled Sites)
Verified Secondary Fuel Type (Sampled Sites)
Corn Pellet 1.14% 0% 0%
Electric 12.00% 0% 0%
Natural Gas 13.14% 20% 4.76%
Kerosene 6.86% 0% 0%
Oil 30.86% 20% 23.81%
Pellet Wood 2.86% 0% 0%
Propane 12.57% 40% 9.52%
Wood 20.57% 20% 57.14%
Solar 0% 0% 4.76%
Total (Sites) 175 5 21
Secondary fuel type was only reported in the HESP database at five of the 41 sampled sites
(12%). During the site visits, Cadmus identified a total of 21sites (16 additional sites) that used a
secondary heating source, with 57% using wood, 24% using oil, 9% propane, 5% natural gas,
and 5% solar.
Program implementation staff has reported energy auditors likely did not record this information
when submitting to Efficiency Maine, which would explain why Cadmus observed additional
secondary heating systems beyond those reported in the database.
Figure 4. Secondary Fuel Type (21 Sites: Cadmus Observations)
Fuel Oil 24%
Propane 9%
Natural Gas 5% Solar
5%
Wood (Cords)
57%

Efficiency Maine Trust HESP Evaluation September 25, 2012
The Cadmus Group, Inc. / Energy Services 14
HVAC Distribution System
Primary HVAC Distribution System
The majority of the participating sites in the HESP used hydronic baseboards (hot water
baseboard) to distribute heat. The second largest portion used a regular velocity duct system
(Table 8). The reported primary heating distribution systems for the sites Cadmus sampled were
similar to overall participant population. Cadmus technicians found similar results on-site.
Table 8. Primary HVAC Distribution System
Primary Distribution System
Reported Primary Distribution System
(Total Sites)
Reported Primary Distribution System
(Sampled Sites)
Verified Primary Distribution System
(Sampled Sites) High Velocity (HV) Duct System 0.11% 0% 0%
HV Duct System with Electronically Commutated Magnet (ECM) Motor
0.11% 0% 0%
Regular Velocity (RV) Duct System 18.20% 19.51% 21.95%
RV Duct System with ECM 0.28% 0% 0%
Electronic Baseboard 0.84% 0% 0%
Electronic Radiant 1.01% 0% 0%
Gravity (75 and 91) 0.28% 0% 0%
Hydronic Baseboard 59.61% 56.10% 58.54%
Hydronic Radiant 2.58% 2.44% 2.44%
Space Heater 4.94% 2.44% 0.00%
Steam, Single Pipe 5.11% 4.88% 9.76%
Steam, Two Pipe 0.67% 0% 0%
Unknown, Other 6.24% 14.63% 7.32%
Total (Sites) 1,780 41 41
Figure 5. Primary HVAC Distribution System (41 Sites: Cadmus Observations)
Regular Velocity (RV) Duct
System 22%
Hydronic Baseboard
59%
Hydronic Radiant
2%
Steam, Single Pipe 10%
Unknown, Other
7%

Efficiency Maine Trust HESP Evaluation September 25, 2012
The Cadmus Group, Inc. / Energy Services 15
HVAC distribution systems were also captured during the participant survey, but with different
results. According to participants in the survey sample, furnaces were the most common type of
primary home heating (50%), with boilers accounting for about one-third (31%), while the
program database and on-site observations showed almost 79% used a boiler, and less than 20%
used a furnace (ducts). Responses to this question could be to the result of customer confusion
about heating systems.
Figure 6. Home’s Primary Heating System
Secondary HVAC Distribution System
Figure 7 displays reported secondary heating system types and fuels for all of the sites where a
secondary fuel source was reported (n=175). Heating with a space heater was the most frequently
observed secondary heating distribution system type at 49%, followed by hydronic baseboard
at 24%.

Efficiency Maine Trust HESP Evaluation September 25, 2012
The Cadmus Group, Inc. / Energy Services 16
Figure 7. Secondary HVAC Distribution System (175 Sites: Reported Data)
Space heaters were the dominant reported secondary heating system type at the five sampled
sites where a secondary fuel source was reported. Hydronic baseboard and electric radiant was
seen as a secondary source by 20%.
Cadmus observed additional secondary heating systems beyond those reported in the database.
Figure 8 summarizes the secondary heating systems found during the site visits: 71% of
inspected sites with a secondary distribution system used wood (fireplace or stove) as a
secondary heating distribution type. It has been reported that contractors likely did not record
this information when submitting to Efficiency Maine.
Regular Velocity (RV) Duct System
11% Electronic Baseboard
8%
Electronic Radiant 1%
Gravity (75) 1%
Hydronic Baseboard
24%
Hydronic Radiant 2%
Space Heater 49%
Steam, Single Pipe 3%
Steam, Two Pipe 1%
Efficiency Maine Trust HESP Evaluation September 25, 2012
The Cadmus Group, Inc. / Energy Services 17
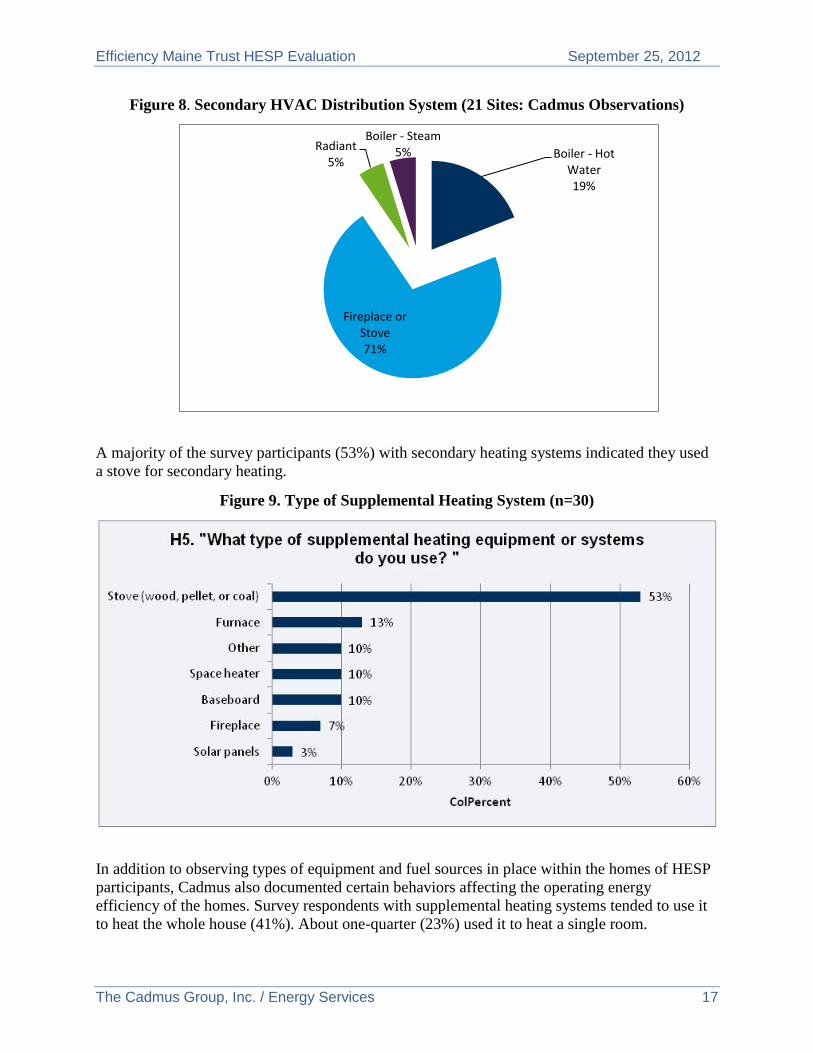
Figure 8. Secondary HVAC Distribution System (21 Sites: Cadmus Observations)
A majority of the survey participants (53%) with secondary heating systems indicated they used
a stove for secondary heating.
Figure 9. Type of Supplemental Heating System (n=30)
In addition to observing types of equipment and fuel sources in place within the homes of HESP
participants, Cadmus also documented certain behaviors affecting the operating energy
efficiency of the homes. Survey respondents with supplemental heating systems tended to use it
to heat the whole house (41%). About one-quarter (23%) used it to heat a single room.
Boiler - Hot Water 19%
Fireplace or Stove 71%
Radiant 5%
Boiler - Steam 5%

Efficiency Maine Trust HESP Evaluation September 25, 2012
The Cadmus Group, Inc. / Energy Services 18
Figure 10. Portion of House Heated by Supplemental System (n=30)
The survey also addressed the frequency with which supplemental heating is used. Half of
survey respondents (50%) did not know how frequently they used the supplemental heating
system. One in five (21%) said they used it all the time.
Figure 11. Frequency of Supplemental Heating Use (n=29)

Efficiency Maine Trust HESP Evaluation September 25, 2012
The Cadmus Group, Inc. / Energy Services 19
Water Heating Type and Fuel
Water Heating Fuel
The program database and Cadmus site visit data also documented the water heating fuel used by
HESP participants. For the sample frame, program data show the majority of customers used oil,
with the second most common fuel electricity; 9% and 8% used natural gas and propane,
respectively.
Table 9. Water Heating Fuel Type
Water Heating Fuel Type
Reported Water Heating Fuel Type (Total Sites)
Reported Water Heating Fuel Type (Sampled Sites)
Verified Water Heating Fuel Type (Sampled Sites)
Electric 23.43% 8.57% 12.20%
Natural Gas 9.44% 11.43% 19.51%
Kerosene 0.22% 0% 0%
Oil 52.08% 68.57% 48.78%
Other 0.67% 0% 0%
Propane 7.58% 8.57% 4.88%
Wood 0.11% 0% 2.44%
Solar 0% 0% 9.76%
Unknown, Other 6.46% 2.86% 2.44%
Total (Sites) 1,780 35 41
Some similarities were seen within the sample frame from the HESP database. The majority of
customers used oil (69%). However, the second largest group used natural gas (11%), closely
followed by propane and electricity (both with 9% of customers using this fuel type).
While the percentages were similar, a few additional fuel types were documented by Cadmus.
Forty-nine percent of the sites sampled used oil to heat their water, 20% used natural gas, and
12% used electricity. However, solar was also a source of heat, with 10% using solar. There is a
higher use of electricity reported in the HESP database.
Figure 12. Water Heating Fuel Type (41 Sites: Cadmus Observations)
Electricity 12%
Fuel Oil 49%
Natural Gas 20%
Unknown 2%
Propane 5%
Solar 10%
Wood 2%

Efficiency Maine Trust HESP Evaluation September 25, 2012
The Cadmus Group, Inc. / Energy Services 20
This information was also captured during the survey, and some similarities were seen. Fuel oil
was also the most common (yet, at a lower observance rate of 38% compared with the other three
data sets) fuel type used for water heaters. There is higher electricity usage; similar to the HESP
database, but different from the verified site data. Figure 13 shows the proportion of different
water heating fuel types.
Figure 13. Water Heating Fuel Type (n=70)
Water Heating System
The charts that follow show the water heating system type documented for all sites in the HESP
database, within the evaluation period and within the sample frame. The third chart shows data
obtained during Cadmus’ site visits. Table 10 shows that 37% of the participants used a storage
tank, 28% had a tankless water heater, and 19% used an indirect water heater.
Table 10. Water Heating Type
Water Heating System Type
Reported Water Heating System Type (Total Sites)
Reported Water Heating System Type (Sampled Sites)
Verified Water Heating System Type (Sampled Sites)
Heat Pump 0.06% 0% 0%
Indirect 19.21% 19.51% 51.22%
On Demand 4.21% 4.88% 0%
Tank 36.52% 24.39% 41.46%
Tank High 4.89% 4.88% 0%
Tankless 28.37% 31.71% 7.32%
Tankless Backup 0.11% 0% 0%
Unknown, Other 6.63% 14.63% 0%
Total 1,780 41 41

Efficiency Maine Trust HESP Evaluation September 25, 2012
The Cadmus Group, Inc. / Energy Services 21
Of sampled sites, the predominant water heating system was tankless water heaters, with 32% of
the 41 participants using this system. Twenty-four percent used a storage tank, and 19% used an
indirect water heater.
Cadmus’ review of the hot water system type produces results different from those in the HESP
database. Forty-six percent of participants used an indirect water heater, 39% used a storage
tank, and only 7% had a tankless water heating system installed, as shown in Figure 14.
Figure 14. Water Heating System Type (41 Sites: Cadmus Observations)
Table 11 shows average water temperature and thermostat settings. The average water
temperature of sites visited was 124 F. This is an efficient setting and typical of what Cadmus
sees in other locations. We do not recommend lower settings because of concerns over bacterial
growth. The average thermostat setpoint on a weekday, when the participant was home, was just
below 67 F. This is lower by several degrees than we see in other locations. The average
setpoint during the week, when the participant was sleeping, was just above 63 F.
Table 11. Behavioral Statistics
Statistic Verified Average (41 Sites)
Water Temperature ( F) 123.9
Thermostat Setpoint Weekday (at home) 66.6
Thermostat Setpoint Weekday (at home while sleeping) 63.4
3.3 Site Visit Observations In this section, Cadmus presents selected observations made during the 41 sites visits.
Cadmus field staff received positive feedback from many program participants, and noted
the following:
Indirect 51% Tank
42%
Tankless 7%

Efficiency Maine Trust HESP Evaluation September 25, 2012
The Cadmus Group, Inc. / Energy Services 22
Overall, participants reported high satisfaction with the program, and were very happy
about services and incentives they received.
Participants displayed a high interest level in home performance during site visits.
Participants were familiar with energy efficiency, and with steps that could be taken to
improve the efficiency of their homes.
Many participants reported being more comfortable in their homes after participation.
Some heating oil users reported a noticeable decrease in fuel use since project
implementation.
Overall, contractor performance was successful and effective. In general, Cadmus found that the
measures reported in the program database were installed. Specific findings include:
Air sealing appears to have been completed excellently, and the quality of contractor air
sealing work was high.
o Results of our blower door tests appear to indicate homes have been tightly sealed, in
some instances exceeding IECC 2009 Code.
o Cadmus completed 31 blower door tests (BD) during the 41 site visits for the HESP
evaluation. Table 12 details the number of sites (n=10) where a BD test was not
performed, and the reasons why Cadmus could not complete them.
Table 12. Reasons for Blower Door Test Incompletes
Reason for Not Completing BD Quantity Participant Declined Test 4
Site Required Two or more BD Kits 3
No Insulation Installed 1
Could Not Pressurize Home 1
Tenant Not Home to Permit Access to Seal Unit 1
Total 10
Bulkhead doors were insulated and sealed with weather-stripping and were generally
very well built (illustrating contractors’ high-quality work). Bulkhead doors were, in
many cases, custom-built doors in the foundation wall, made of plywood and rigid foam
that were weather-stripped.

Efficiency Maine Trust HESP Evaluation September 25, 2012
The Cadmus Group, Inc. / Energy Services 23
o Figure 15 shows insulated and sealed bulkhead doors, which were generally
constructed with 2 inches of rigid foam and plywood. Weather stripping was applied
to seal air leakage.
Figure 15. Basement Bulkhead Doors
Attic hatches and pull-down stairs were similarly weather-stripped and insulated well.
They were pulled tight with clasps, and fit frames well.
o Figure 16 shows a new attic access built by a contractor to replace an existing attic
access. The door was solidly built, and insulated with several sheets of 2 inches of
rigid foam. The door’s perimeter was sealed with rubber weather stripping and
secured with clasps. This is a good example of particularly effective work completed
by the HESP contractor.
Figure 16. Attic Hatch

Efficiency Maine Trust HESP Evaluation September 25, 2012
The Cadmus Group, Inc. / Energy Services 24
Rim joist insulation was also completed well. Figure 17 shows 2 inches of rigid spray
foam applied to rim joists. This type of insulation doubles as an air barrier sealing up the
home.
Figure 17. Rim and Band Joist Insulation
According to Cadmus’ observations, accurate insulation square footage measurements
were made. When verifying the installed square footage of the insulation measures, the
verified and observed values were within 97%4 of the values reported in the HESP
database. As can be expected in any large-scale program, there were some minor
discrepancies noted:
o In a few cases, contractors documented the total area of insulation, rather than simply
documenting what was added. Documenting additional insulation was the appropriate
method of data entry.
o At one site, the program data reported 600 square feet of spray insulation installed in
the basement walls. Cadmus measured only 483 square feet of insulation. Cadmus
explains the estimation difference below:
The wall heights of this basement were between 2 and 6 feet (the result of
completing multiple additions to the home). The original estimate appeared to
have been based on 4 feet of insulation around the entire perimeter (not excluding
areas with shorter foundation walls). Figure 18 and Figure 19 show the layout of
this particular basement.
4 When Cadmus excludes the measures that were not verified as installed, the verified square footages are within
99% of the HESP database reported square footages.

Efficiency Maine Trust HESP Evaluation September 25, 2012
The Cadmus Group, Inc. / Energy Services 25
Figure 18. Six-Foot Wall
Figure 19. Two-Foot Wall
o Infrequently, insulation was installed in areas where it would be marginally effective
(i.e., areas where no, or minimal energy savings would result: adiabatic walls, floor of
a partially conditioned basement, etc…).
Additionally, contractors were diligent when sealing and insulating hard-to-reach areas
and building additions.
o Many participating homes were over 100 years old with many remodels and
additions. Contractors were meticulous, and made great efforts to insulate and seal
areas generally difficult to address.
o Cadmus used infrared cameras (thermal scans) to check for proper installation of wall
insulation5. Figure 20 shows what was seen from infrared inspections performed in
5 These devices work best when the outdoor temperature is 20 degrees less than the indoor temperature. Daytime
temperatures during the site visits in August were in the high 60s to low 70s, but were not overly different from
ambient indoor temperatures. On sunny days, attics with no or limited access could be viable for analysis
because the sun could heat the roof to high-enough temperatures. Ideal conditions for infrared inspection would
require temperatures below 50 degrees Fahrenheit (F) or above 90 degrees F. Consequently, infrared camera
images and results were inconclusive.

Efficiency Maine Trust HESP Evaluation September 25, 2012
The Cadmus Group, Inc. / Energy Services 26
Maine due to a low temperature difference. Framing is barely visible, and possible
insulation voids are not visible at all. This photo illustrates infrared inspection is not
effective during times of low temperature difference between the conditioned space
and the outdoors. Cadmus could achieve useful thermal images at only two of the 41
homes.
Figure 20. Sloped Ceiling of a One-and-a-Half Story Maine Cape-Style Home
We observed that contractors did an excellent job of dealing with closed constructions
(e.g., walls, ceilings). However, based on our experience observing home construction,
there are house elements that are a challenge to insulate.
o The common home type observed in Maine was a cape-style home, with an upper
floor built into the roofline. This type of construction contains cavities that are
“closed-off,” but must be individually insulated. This means the wall and ceiling
interiors are only accessible if holes are drilled, or if framing is modified. Also, when
insulating closed constructions, conditions are not optimal due to plumbing, wiring,
and other obstructions in the cavity. Due to this complexity, contractors and residents
sometimes also deem it cost-prohibitive to pursue complete insulation.
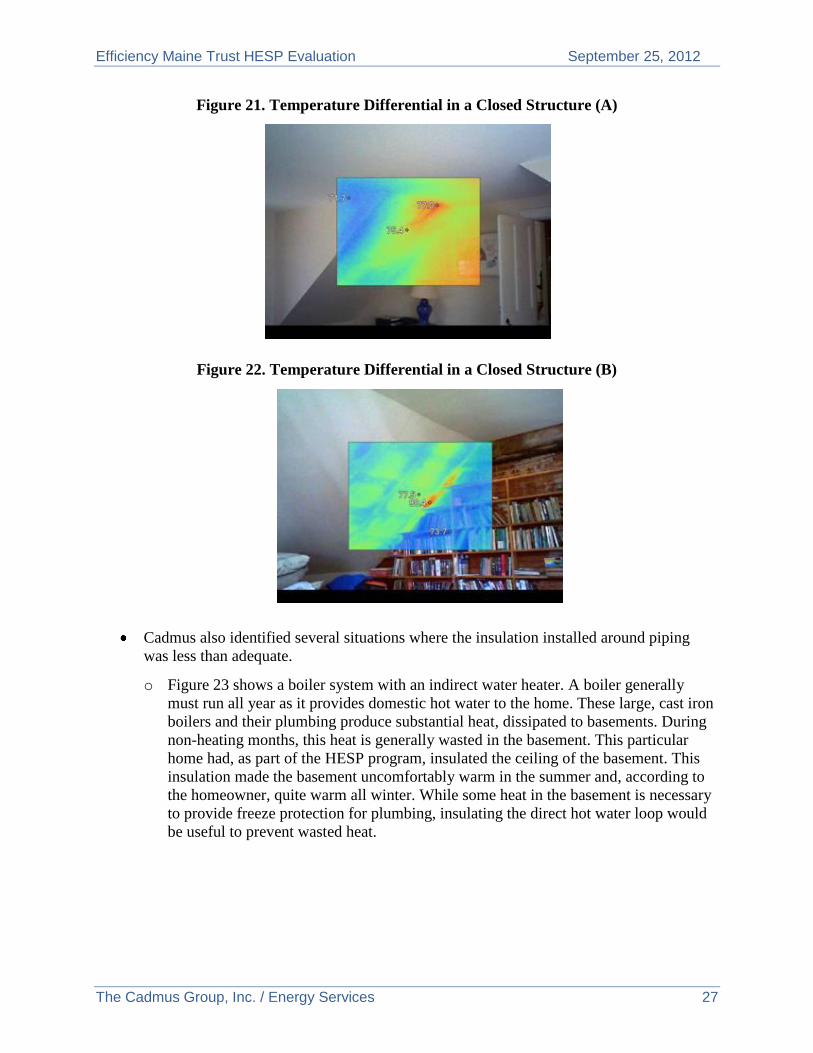
o While infrared inspection of sloped ceilings and walls was inconclusive, site visit
evidence sometimes suggested installed insulation did not always fill the entire
cavity, and the necessary insulation density was not achieved. At one HESP site
(shown in Figure 21 and Figure 22), where IR inspection of the attic was possible, the
ceiling showed insulation voids in hard-to-reach areas: where the roofline changed
and at transitions between sloped and flat ceilings.
Efficiency Maine Trust HESP Evaluation September 25, 2012
The Cadmus Group, Inc. / Energy Services 27
Figure 21. Temperature Differential in a Closed Structure (A)
Figure 22. Temperature Differential in a Closed Structure (B)
Cadmus also identified several situations where the insulation installed around piping
was less than adequate.
o Figure 23 shows a boiler system with an indirect water heater. A boiler generally
must run all year as it provides domestic hot water to the home. These large, cast iron
boilers and their plumbing produce substantial heat, dissipated to basements. During
non-heating months, this heat is generally wasted in the basement. This particular
home had, as part of the HESP program, insulated the ceiling of the basement. This
insulation made the basement uncomfortably warm in the summer and, according to
the homeowner, quite warm all winter. While some heat in the basement is necessary
to provide freeze protection for plumbing, insulating the direct hot water loop would
be useful to prevent wasted heat.

Efficiency Maine Trust HESP Evaluation September 25, 2012
The Cadmus Group, Inc. / Energy Services 28
Figure 23. Indirect Water Heater
Overall, Cadmus found a low incidence of installation issues at the sites visited. Based on
observations during site inspections, contractors were thorough and performed high-quality
work. This is especially impressive, considering the age of some homes and complexity of some
of the insulation and air sealing projects. While most homes that had installed wall insulation as
part of their HESP participation could not be verified for proper density with thermal inspection,
the otherwise high-quality work supported the impression that a thorough job was likely done.

Efficiency Maine Trust HESP Evaluation September 25, 2012
The Cadmus Group, Inc. / Energy Services 29
4. Impact Analysis Findings
4.1 Gross Savings Using Rem/RATE, Cadmus created a model that simulated how energy is used and wasted in a
sampled home in Maine. The models’ inputs included all data collected by Cadmus during site
visits.
The model enabled Cadmus to create energy savings figures for each home and for measures
installed within each home. Cadmus computed measure-level savings for air sealing, attic hatch,
basement insulation, ceiling insulation, wall insulation, and furnace or boiler. The realization rate
of each of these measures is present below in Table 13.
Table 13. HESP Realization Rate: Measure-Level
Measure Type Reported Savings Verified Gross Savings Realization Rate Air Sealing 565 585 103%
Attic Hatch 29 18 62%
Basement Insulation 381 305 80%
Ceiling Insulation 568 328 58%
Wall Insulation 462 584 127%
Furnace/Boiler 82 51 62%6
Total (41 Sites) 2,087 1,871 90%
These measure-level verified gross savings were compared with the HESP database reported
savings to obtain gross realization rates. The resulting realization rates ranged from 58% to
127%. Relative to savings reported in the program database, the Cadmus savings estimates,
based on site visit data and REM/Rate modeling, were higher for wall insulation and air sealing,
but lower for attic hatch, basement and ceiling insulation, and furnace and boiler installations.
The three measures with the lowest realization rates were the ceiling insulation, furnace or boiler
replacement, and attic hatch measures. Ceiling insulation installation, when measured in the field
and modeled using REM/Rate, saved participants 58% of the energy, compared to the program-
reported figures.
The 62% realization rate for furnace or boiler replacement measures resulted from Cadmus’
modification of assumed efficiency levels, as described in the Methods section.
While modeled attic hatch savings were lower than those reported for attic hatch upgrades,
Cadmus engineers believe that this is an important upgrade and that, in some cases, savings
might be higher due to leaky, or poorly insulated existing hatches.
Air sealing showed savings at a level that is 103% of the reported values. Cadmus also
compared reported savings from air sealing with values calculated by Cadmus for the 41 sites in
6 Realization rate is based on file review of furnace or boiler replacement measures.
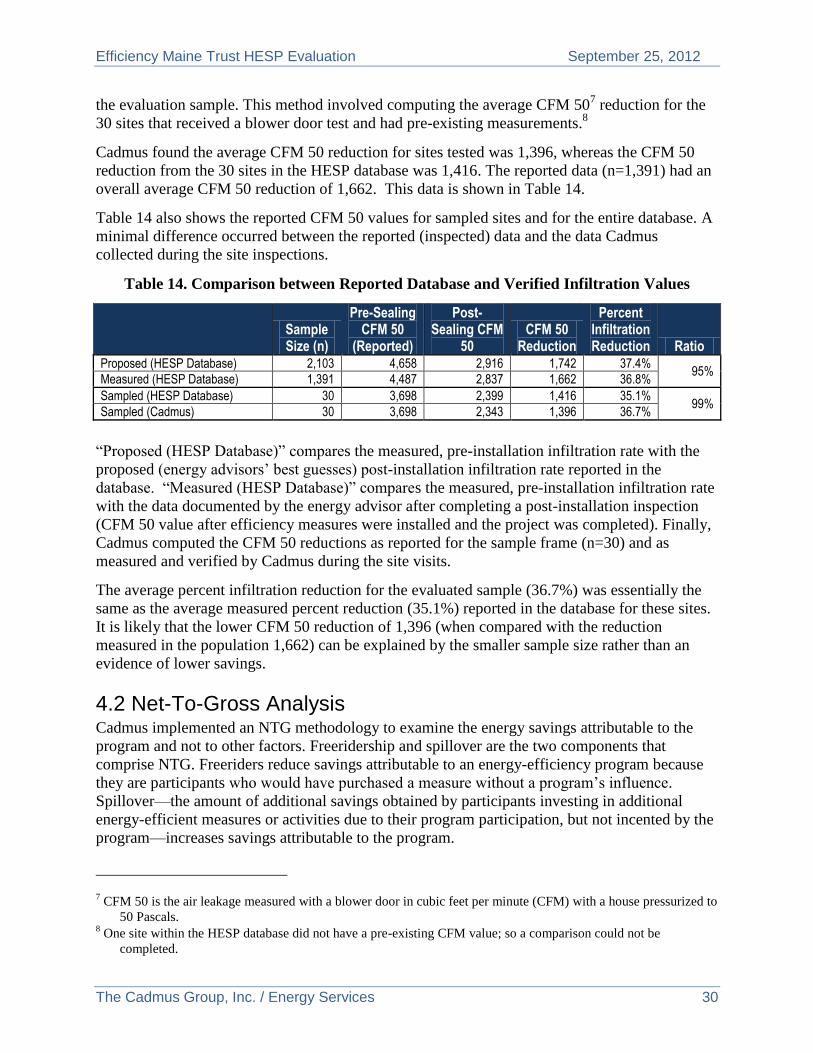
Efficiency Maine Trust HESP Evaluation September 25, 2012
The Cadmus Group, Inc. / Energy Services 30
the evaluation sample. This method involved computing the average CFM 507 reduction for the
30 sites that received a blower door test and had pre-existing measurements.8
Cadmus found the average CFM 50 reduction for sites tested was 1,396, whereas the CFM 50
reduction from the 30 sites in the HESP database was 1,416. The reported data (n=1,391) had an
overall average CFM 50 reduction of 1,662. This data is shown in Table 14.
Table 14 also shows the reported CFM 50 values for sampled sites and for the entire database. A
minimal difference occurred between the reported (inspected) data and the data Cadmus
collected during the site inspections.
Table 14. Comparison between Reported Database and Verified Infiltration Values
Sample Size (n)
Pre-Sealing CFM 50
(Reported)
Post-Sealing CFM
50 CFM 50
Reduction
Percent Infiltration Reduction Ratio
Proposed (HESP Database) 2,103 4,658 2,916 1,742 37.4% 95%
Measured (HESP Database) 1,391 4,487 2,837 1,662 36.8%
Sampled (HESP Database) 30 3,698 2,399 1,416 35.1% 99%
Sampled (Cadmus) 30 3,698 2,343 1,396 36.7%
“Proposed (HESP Database)” compares the measured, pre-installation infiltration rate with the
proposed (energy advisors’ best guesses) post-installation infiltration rate reported in the
database. “Measured (HESP Database)” compares the measured, pre-installation infiltration rate
with the data documented by the energy advisor after completing a post-installation inspection
(CFM 50 value after efficiency measures were installed and the project was completed). Finally,
Cadmus computed the CFM 50 reductions as reported for the sample frame (n=30) and as
measured and verified by Cadmus during the site visits.
The average percent infiltration reduction for the evaluated sample (36.7%) was essentially the
same as the average measured percent reduction (35.1%) reported in the database for these sites.
It is likely that the lower CFM 50 reduction of 1,396 (when compared with the reduction
measured in the population 1,662) can be explained by the smaller sample size rather than an
evidence of lower savings.
4.2 Net-To-Gross Analysis Cadmus implemented an NTG methodology to examine the energy savings attributable to the
program and not to other factors. Freeridership and spillover are the two components that
comprise NTG. Freeriders reduce savings attributable to an energy-efficiency program because
they are participants who would have purchased a measure without a program’s influence.
Spillover—the amount of additional savings obtained by participants investing in additional
energy-efficient measures or activities due to their program participation, but not incented by the
program—increases savings attributable to the program.
7 CFM 50 is the air leakage measured with a blower door in cubic feet per minute (CFM) with a house pressurized to
50 Pascals. 8 One site within the HESP database did not have a pre-existing CFM value; so a comparison could not be
completed.

Efficiency Maine Trust HESP Evaluation September 25, 2012
The Cadmus Group, Inc. / Energy Services 31
Freeridership Analysis
The freeridership estimation9 determined freeridership using patterns of responses to a series of
five simple questions. The questions, which allowed “yes,” “no,” or “don’t know” responses,
dealt with whether participants would have installed the same equipment in the program’s
absence, at the same time, at the same amount, and at the same efficiency. Response patterns to
these questions were assigned freerider scores, and confidence and precision estimates were
calculated on score distributions.
A detailed explanation of Cadmus’ freeridership methodology is included in Appendix A. The
appendix explains the survey design, and describes Cadmus’ freeridership methodology. It also
provides:
Full-text versions of the NTG survey questions administered to participants;
The freeridership scoring matrix, showing all possible combinations of responses to the
freeridership survey questions; and
The scores Cadmus assigned each combination.
After conducting participant surveys, which contained the relevant questions, Cadmus converted
resulting responses into a freeridership score for each participant, using an Excel-based matrix.
Each participant’s freerider score was derived by translating responses into a matrix value, and
then using a rules-based calculation to obtain the final score10
. Table 15 shows results of
freeridership calculations for HESP measures. Overall, the program had an average freeridership
of 14% across all 70 respondents.
Table 15. HESP Freeridership Results
Program N FR
HESP 70 14%*
* ± 4.5% Absolute Precision
Thirty-nine percent (27 out of the 70) answered they would not have installed the measure within
one year, in absence of the HESP. These respondents were scored as 0% freeriders because they
were not seriously considering installing the measure within one year.
Figure 24 shows a distribution of respondents by the freeridership score assigned to each.
Approximately 61% of survey respondents were scored as non-freeriders (0%), while 23% of
respondents are exhibiting low levels of freeridership (12.5% and 25%). Nine percent of
9 This approach is described in the freeridership methodology section in Appendix A. This specific approach was
based on a previously developed approach by the Senior Vice President of the Cadmus Group, M. Sami Khawaja,
Ph.D. It is cited in the National Action Plan for Energy Efficiency (NAPEE) Handbook on DSM Evaluation (2007,
page 5-1), which can be found here: http://www.epa.gov/cleanenergy/documents/suca/evaluation_guide.pdf.
10 Appendix A presents all combinations of responses received for HESP, and the scores assigned to each
combination. Participant responses tended to group around a subset of common patterns. Freeridership scores were
calculated for each measure category, based on the distribution of scores within the matrix.

Efficiency Maine Trust HESP Evaluation September 25, 2012
The Cadmus Group, Inc. / Energy Services 32
respondents are showing a moderate level of freeridership (50%), while 27% of respondents
were scored at a higher level of freeridership (75%). The analysis indicated none of the
respondents were true (100%) freeriders.
Figure 24. Overall Distribution of HESP Freeridership Scores
Spillover Analysis
Participant spillover measures additional energy savings obtained by program participants who
invest in additional energy-efficient measures or activities due to their program participation, but
who are not incented by a program. A “spillover response” survey indicates the participant
reported purchasing or installing other energy-efficiency improvements following their
participation in HESP.
Spillover responses are considered attributed to the program if the respondent answers
participation in HESP was very influential in deciding to make other energy-efficient
improvements or purchases outside the program. As part of this evaluation, participant spillover
savings were not quantified because participants did not provide many responses that could
indicate spillover. Spillover actions mentioned by full participant respondents highly influenced
by the HESP program are listed in Table 16.
61%
9%
14%
9% 7%
0%
10%
20%
30%
40%
50%
60%
70%
0% 12.5% 25% 50% 75%
Pe
rce
nt
of
Re
spo
nd
en
ts
Freeridership Score

Efficiency Maine Trust HESP Evaluation September 25, 2012
The Cadmus Group, Inc. / Energy Services 33
Table 16. Qualitative Spillover Responses Attributable to Program
Spillover Response We did an efficient air cooling system and refrigerator, washer, and dryer
Sealed the basement
Insulation garage door
Weatherizing
Upgraded to more modern air conditioning to save on electricity
Inexpensive minor things like sealing gaps
There's a place from the garage to the attic that is not accessible, and so we poked a whole in the wall, added more insulation
We had the entire house rewired, and put in 30 more outlets so we can plug in energy efficient appliances, and put fans to distribute the air more properly, they are all energy star, the roof, is a metal reflective roof
We figured out that when we don't need hot water we shut off our furnace during the summer, we save oil, because we have a hot water reserve tank
Washer and dryer
Mini split system
Put in all new windows and thermal window
Additionally, six full-participant respondents reported that, after participating in the program,
they purchased CFLs not marked down, discounted, or eligible for a coupon. These respondents
said their participation in HESP was very influential in their decision to purchase additional
CFLs outside the program.
NTG
Table 17 shows NTG calculation results for HESP measures. Because spillover was not
quantified, the net to gross value only takes into account the freeridership rate. Overall, the
program had an average NTG of 86%, across all 70 respondents. The calculation used for the
final NTG estimate for the HESP was: [1 – Freeridership % = NTG].
Table 17. HESP NTG Results
Program N FR NTG
HESP 70 14% 86%
4.3 Program-Level Savings Cadmus used the calculated measure realization rates to determine annual verified gross savings
estimates for the HESP. The evaluation sample (n=41) did not include certain measures, and, in
those instances, Cadmus used a realization rate of 1. To compute annual verified net energy
savings, Cadmus applied the NTG ratio to verified gross savings.

Efficiency Maine Trust HESP Evaluation September 25, 2012
The Cadmus Group, Inc. / Energy Services 34
Table 18 lists the program-level savings by verified measure type.
Table 18. Annual Energy Savings by Measure Type in MMBTUs
Measure Type
Reported Gross
MMBTU Savings
Verified Gross
MMBTU Savings
Gross Realization
Rate NTG
Verified Net
Savings (Verified Gross *
NTG)
Verified Net
Savings
Measures
(n)
Air Sealing 42,993 44,467 103% 0.86 38,242 89% 1,846
Attic Access: Existing (Hatch) 2,107 1,310 62% 0.86 1,127 53% 1,248
HVAC: System (Furnace/Boiler) 14,649 9,139 62% 0.86 7,859 54% 730
Insulation: Attic 30,732 17,756 58% 0.86 15,270 50% 2,849
Insulation: Basement/Floors 20,353 16,309 80% 0.86 14,026 69% 2,656
Insulation: Walls 18,394 23,271 127% 0.86 20,013 109% 967
Remaining Measures 12,257 12,257 100% 0.86 10,540 86% 2,765
Total11 (1780 Sites) 141,485 124,509 88% 0.86 107,077 76% 13,061
Savings were broken out by fuel type. Annual Energy Savings by fuel type (in MMBTUs) can be
seen in Table 19.
Table 19. Annual Energy Savings in MMBTUs
Annual Energy Savings by Fuel Type
(MMBTUs)
Reported Gross
Savings
Verified Gross
Savings
Gross Realization
Rate NTG
Verified Net Savings (Verified Gross *
NTG)
Net Realization
Rate
Measures
(n)
Fuel Oil 132,063 110,638 84% 0.86 95,148 72% 8,373
Natural Gas 1,244 4,965 399% 0.86 4,270 343% 2,070
Propane 763 2,052 269% 0.86 1,765 231% 1,376
Wood 3,635 3,315 91% 0.86 2,851 78% 374
Kerosene 732 615 84% 0.86 529 72% 102
Electric 3,024 2,908 96% 0.86 2,501 83% 749
Corn Pellet 22 17 76% 0.86 15 65% 17
Total (1780 Sites) 141,485 124,509 88% 0.86 107,077 76% 13,061
11 Includes all measures installed within evaluation period.

Efficiency Maine Trust HESP Evaluation September 25, 2012
The Cadmus Group, Inc. / Energy Services 35
Cadmus converted the savings figures into fuel consumption units, as shown in Table 20.
Table 20. Annual Energy Savings by Fuel Type (in Consumption Units)
Annual Energy Savings by Fuel Type
Reported Gross
Savings
Verified Gross
Savings
Gross Realization
Rate NTG
Verified Net Savings (Verified Gross *
NTG)
Net Realization
Rate
Measures (n=13,061)
Fuel Oil (gallons) 953,526 798,827 84% 0.86 686,991 72% 8,373
Natural Gas (therms) 12,440 49,646 399% 0.86 42,696 343% 2,070
Propane (gallons) 8,342 22,423 269% 0.86 19,284 231% 1,376
Wood (cord= 24 MMBTU) 151 138 91% 0.86 119 78% 374
Kerosene (gallons) 5,424 4,558 84% 0.86 3,920 72% 102
Electric (kwh) 886,127 852,013 96% 0.86 732,731 83% 749
Corn Pellet (7400 BTU/lb) 3,030 2,289 76% 0.86 1,969 65% 17
For this report, Cadmus calculated lifetime verified gross and net energy savings generated by
the HESP. Cadmus used the reported EUL of the measure included in the program data to
calculate lifetime verified net energy savings. These data (in MMBTUs) are shown in Table 21.
Table 21. Lifetime Energy Savings in MMBTUs
Lifetime Energy Savings by Fuel Type
(MMBTUs)
Reported Gross
Savings
Verified Gross
Savings
Gross Realization
Rate NTG
Verified Net Savings (Verified Gross *
NTG)
Net Realization
Rate
Measures
(n)
Fuel Oil 3,044,152 2,569,517 84% 0.86 2,209,785 73% 8,373
Natural Gas 87,296 156,880 180% 0.86 134,917 155% 2,070
Propane 55,068 76,932 140% 0.86 66,162 120% 1,376
Wood 91,216 83,203 91% 0.86 71,555 78% 374
Kerosene 17,617 14,786 84% 0.86 12,716 72% 102
Electric 40,278 37,597 93% 0.86 32,333 80% 749
Corn Pellet 563 426 76% 0.86 367 65% 17
Total (1780 Sites) 3,336,191 2,939,342 88% 0.86 2,527,834 76% 13,061
Cadmus also converted lifetime savings figures into fuel consumption units. The results of this
are shown in Table 22.

Efficiency Maine Trust HESP Evaluation September 25, 2012
The Cadmus Group, Inc. / Energy Services 36
Table 22. Lifetime Energy Saving by Fuel Type
Lifetime Energy Savings by Fuel Type
Reported Gross
Savings
Verified Gross
Savings
Gross Realization
Rate NTG
Verified Net Savings (Verified Gross *
NTG)
Net Realization
Rate
Measures (n=13,061)
Fuel Oil (gallons) 21,979,438 18,552,471 84% 0.86 15,955,125 73% 8,373
Natural Gas (therms) 872,964 1,568,801 180% 0.86 1,349,169 155% 2,070
Propane (gallons) 601,841 840,789 140% 0.86 723,079 120% 1,376
Wood (cord= 24 MMBTU) 3,801 3,467 91% 0.86 2,981 78% 374
Kerosene (gallons) 130,496 109,524 84% 0.86 94,190 72% 102
Electric (kwh) 11,801,276 11,015,827 93% 0.86 9,473,611 80% 749
Corn Pellet (7400 BTU/lb) 76,108 57,596 76% 0.86 49,533 65% 17
The verified annual net energy savings of the HESP are 107,077 MMBTUs. The verified net
lifetime energy savings of the HESP are 2,527,834 MMBTUs. These two calculations yield a
gross realization rate of 88%. The final, net realization rate of the Efficiency Maine HESP is
76%.
The Program reported reducing residents’ energy consumption by 40%, on average. Cadmus
observations verify that the Program saved customers 31% in energy savings, on average
4.4 Utility Bill Review As part of this evaluation, Cadmus attempted to obtain direct fuel usage data from billing or
delivery information for selected sites to augment the engineering analysis. The difficulty of
obtaining billing data for the sample sites became apparent as the evaluation progressed.12
It was
challenging to collect viable liquid fuel usage data for Maine residents due to the following:
Unlike other areas of the country, where residents are served primarily by one utility
company, Maine has many different fuel suppliers from which to choose.
o To obtain the fuel oil and propane delivery information, Cadmus had to contact a
large number of individual fuel companies (n=28) directly.
Individuals often chose to use multiple suppliers during the course of a heating season.
Individuals used multiple fuel types.
Utility companies were non-responsive to Cadmus’ requests.
12 In total, Cadmus spent nearly half as much time attempting to collect bills as its staff spent in the field at the 41
houses, yet, satisfactory bills for less than half of the houses were obtained. The process Cadmus used to
attempt to obtain fuel usage information is explained in Appendix D.
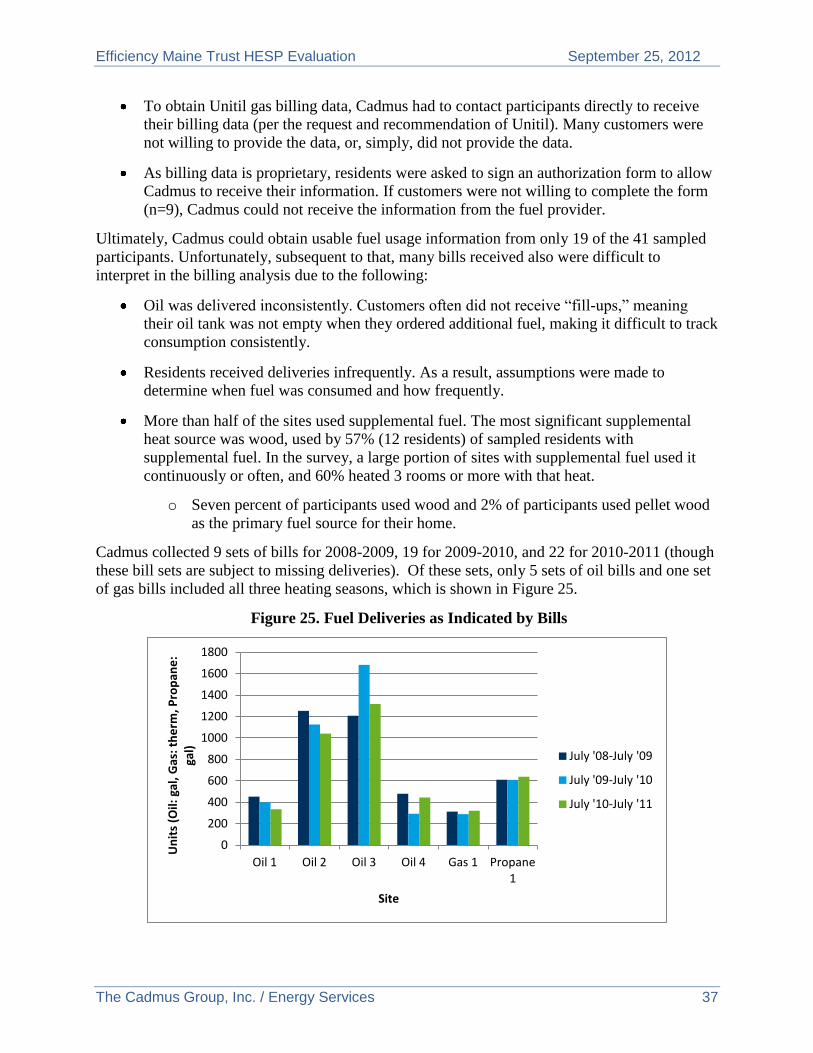
Efficiency Maine Trust HESP Evaluation September 25, 2012
The Cadmus Group, Inc. / Energy Services 37
To obtain Unitil gas billing data, Cadmus had to contact participants directly to receive
their billing data (per the request and recommendation of Unitil). Many customers were
not willing to provide the data, or, simply, did not provide the data.
As billing data is proprietary, residents were asked to sign an authorization form to allow
Cadmus to receive their information. If customers were not willing to complete the form
(n=9), Cadmus could not receive the information from the fuel provider.
Ultimately, Cadmus could obtain usable fuel usage information from only 19 of the 41 sampled
participants. Unfortunately, subsequent to that, many bills received also were difficult to
interpret in the billing analysis due to the following:
Oil was delivered inconsistently. Customers often did not receive “fill-ups,” meaning
their oil tank was not empty when they ordered additional fuel, making it difficult to track
consumption consistently.
Residents received deliveries infrequently. As a result, assumptions were made to
determine when fuel was consumed and how frequently.
More than half of the sites used supplemental fuel. The most significant supplemental
heat source was wood, used by 57% (12 residents) of sampled residents with
supplemental fuel. In the survey, a large portion of sites with supplemental fuel used it
continuously or often, and 60% heated 3 rooms or more with that heat.
o Seven percent of participants used wood and 2% of participants used pellet wood
as the primary fuel source for their home.
Cadmus collected 9 sets of bills for 2008-2009, 19 for 2009-2010, and 22 for 2010-2011 (though
these bill sets are subject to missing deliveries). Of these sets, only 5 sets of oil bills and one set
of gas bills included all three heating seasons, which is shown in Figure 25.
Figure 25. Fuel Deliveries as Indicated by Bills
0
200
400
600
800
1000
1200
1400
1600
1800
Oil 1 Oil 2 Oil 3 Oil 4 Gas 1 Propane 1
Un
its
(Oil:
gal
, Gas
: th
erm
, Pro
pan
e:
gal)
Site
July '08-July '09
July '09-July '10
July '10-July '11

Efficiency Maine Trust HESP Evaluation September 25, 2012
The Cadmus Group, Inc. / Energy Services 38
Given that inventory carry over can significantly impact annual bills, there is no reliable way to
calculate changes in pre- and post-program consumption. The absolute magnitude of the oil bill
yearly deliveries has variability between 2.8 and 6.5 to 1, and many yearly usage amounts are far
lower than expected.
Cadmus determined that the data obtained would not support the statistical billing analysis
proposed as a part of the evaluation.
The fuel savings observed in the limited billing data Cadmus was able to obtain fell below what
was modeled and expected. This likely could be attributed to the following:
The widespread use of supplemental heat. There is clear evidence from field
observations, file records, and surveys that many customers have wood as a secondary
heat source and use it often. The homeowner for Oil 1 indicated that wood is the primary
heat source. Oil 2 uses wood for cold days to supplement oil heat. Oil 3 heats only with
oil. No notes regarding supplemental heat use for Oil 4 and Gas 1 were recorded, but
their use is consistent with use patterns of residents with a substantial use of supplemental
fuel. Propane 1 had converted from kerosene, and it is not known whether any residual
use of kerosene remains.
Missing deliveries, due to price-shopping suppliers and differing delivery dates,
especially relating to summer usage, make it difficult to interpret data as does fuel storage
potential. For example, one homeowner with a small house had 600 gallons of storage
capability and held a large inventory of fuel oil.
4.5 Job Impacts Cadmus estimated the number and type of short-term and long-term jobs generated due to the
HESP. As agreed upon with the Trust, Cadmus took a simple approach to this analysis, using the
U.S. DOE’s analytical protocol, which assumes one job-year is created for every $92,000 in
program spending.
Efficiency Maine’s total ARRA expenditures were calculated at $8,549,371. Per the DOE
analysis, the HESP program should have created approximately 93 job-years through its
implementation.
4.6 Cost-Effectiveness
Total Resource Cost Test
Assessment of cost-effectiveness for the HESP began with a valuation of each energy efficiency
measure’s net “total resource” benefits, as measured by electric avoided costs and the measure’s
total incremental installed costs. The program was deemed cost-effective if its net “total
resource” benefits were positive, as calculated:
where,
1Costs Resource Total
Benefits Resource Total

Efficiency Maine Trust HESP Evaluation September 25, 2012
The Cadmus Group, Inc. / Energy Services 39
and,
The Trust provided cost and savings information as well as the inputs shown in Table 23.
Cadmus calculated TRC results for each HESP project in the evaluation period that had been
modeled with RHA13
in the program database. Measure-level TRC results for RHA homes could
not be calculated as costs were only available and provided at the project level.14
Realization rates calculated by Cadmus were applied to savings values provided by Efficiency
Maine.
Table 23. TRC Inputs and Assumptions
Category Value Discount Rate 4.51%
Line Loss 6.50%
2010 Avoided Costs by Fuel
Electric Energy, Winter Off Peak ($/kWh) $0.06
Electric Energy, Winter On Peak ($/kWh) $0.07
Electric Energy, Summer Off Peak ($/kWh) $0.05
Electric Energy, Summer On Peak ($/kWh) $0.07
Electric Demand, Winter ($/KW) $0.00
Electric Demand, Summer ($/KW) $67.15
Transmission and Distribution ($/KW) $80.00
Natural Gas Heating ($/MMBTU) $9.58
Natural Gas Water Heat ($/MMBTU) $12.32
Kerosene ($/MMBTU) $15.49
Oil ($/MMBTU) $15.95
Propane ($/MMBTU) $24.52
Wood ($/MMBTU) $10.12
Corn Pellet ($/MMBTU) $10.12
13 TRC results could not be calculated for projects where savings were reported using TREAT or REM/Rate.
Measure-level information was not provided for these projects. 14
It would have introduced error into the calculations to attempt to allocate the project level costs to measure level
costs.
emeasurelif
1year
8760i
i
ii )( tavoidedcosimpactNPVBenefits Resource Total

Efficiency Maine Trust HESP Evaluation September 25, 2012
The Cadmus Group, Inc. / Energy Services 40
Table 24 shows annual MMBTU savings, avoided fuel costs, and increased fuel costs for each
fuel type for the HESP. Reported savings reflected total savings associated with projects,
adjusted for any increased fuel consumption as a result of fuel switching. Lighting savings
reflected baseline changes due to Energy Independence and Security Act (EISA) legislation.
Table 24. Annual Savings, Avoided Fuel Costs, and Added Fuel Costs, by Fuel Type
Fuel Type MMBTU Savings Avoided Fuel Costs
Added Fuel Costs
Electric 2,908 $1,571,123 $157,571
Natural Gas 4,965 $2,500,148 $1,425,241
Propane 2,052 $4,825,491 $2,939,778
Oil 110,638 $49,874,294 $187,398
Kerosene 615 $283,394 $0
Wood 3,315 $540,640 $28
Corn Pellet 17 $2,794 $0
Total Adjusted Gross Values 124,509 $59,597,884 $4,710,016
Total Net Values 107,077 $51,254,180 $4,050,614
Incremental participant measure costs were based on reported project costs and standard industry
baseline cost sources the Database of Energy Efficient Resources (DEER) and ENERGY STAR.
Costs were adjusted to reflect federal tax credits, consistent with the California Standard
Practices Manual.
A TRC analysis was conducted on three savings scenarios. The first scenarios calculated cost-
effectiveness using gross reported savings. The second adjusted these gross savings values using
the realization rates described above. The third scenario adjusted both savings and project costs
using a NTG ratio of 86%. In all three scenarios, the HESP passed the TRC test comfortably.
Table 25 presents the results of the TRC analysis.
Table 25. TRC Results for the HESP
Value Reported Gross
Savings Scenario Verified Gross Savings
Scenario Verified Net Savings
Scenario MMBTU Savings 141,485 124,509 107,077
Avoided Energy Benefits $70,097,059 $59,597,884 $51,254,180
Added Energy Costs15 $6,879,199 $4,710,016 $4,050,614
Participant Incremental Costs $16,387,212 $16,387,212 $14,093,002
Program Delivery $1,078,868 $1,078,868 $1,078,868
Marketing $642,111 $642,111 $642,111
Administration $187,155 $187,155 $187,155
TRC Benefits $70,097,059 $59,597,884 $51,254,180
TRC Costs $25,174,546 $23,005,363 $20,051,751
TRC Ratio 2.78 2.59 2.56
15 The California Standard Practice Manual, the industry standard for cost-effectiveness evaluation, notes any added
fuel costs resulting from DSM programs should be considered as components of TRC Costs, rather than as
reductions to TRC Benefits. Here, “added energy costs” refers to these increased fuel costs from fuel-switching
programs. For fuel-switching measures (like replacing a propane furnace with a higher-efficiency natural gas
furnace), there is a reduction in supply costs for one fuel, and an increase for another fuel. The overall effect
should be a decrease in fuel costs. Added fuel costs and avoided fuel costs are separated out so that the avoided
costs can be factored into TRC Benefits, and the added costs can be factored into TRC Costs.

Efficiency Maine Trust HESP Evaluation September 25, 2012
The Cadmus Group, Inc. / Energy Services 41
SEP-RAC Test
The U.S. DOE SEP-RAC test compares net MMBTU savings per $1,000 of ARRA expenditures
(costs).
Costs used in the SEP-RAC test were the sum of all the Trust’s expenditures, related to the
HESP, through the end of the evaluation period. This included measure incentives (excluding
any partner rebates paid by Unitil), program delivery expenditures, marketing costs, and
administrative costs. MMBTU savings were provided for each home.
Similar to the TRC test process, measure-level savings information was provided for homes with
savings evaluated using the RHA method. The realization rates established through engineering
analysis were applied to RHA homes.16
MMBTU savings for both RHA and TREAT or
REM/Rate homes were adjusted using a NTG ratio of 86% (as noted previously).
The DOE SEP-RAC test is an alternate cost-effectiveness metric, evaluating whether projects
save at least 10 million source BTUs (10 MMBTUs) annually, the threshold for ARRA-funded
programs.
The Trust’s Program saved 13.41 net MMBTU per $1,000 in ARRA expenditures, passing the
SEP-RAC test. Table 26 provides details of SEP-RAC test analysis.
Table 26. Components and Results of the SEP-RAC Test
Category Value RHA MMBTU Savings – Adjusted Gross 124,509
TR MMBTU Savings – Gross 8,762
Total Gross MMBTU Savings 133,271
NTG Ratio 86%
Total Net MMBTU Savings 114,613
HESP Incentives (Including Bonus Payments) $6,641,237
Program Delivery $1,078,868
Marketing $642,111
Administration $187,155
Total ARRA Expenditures $8,549,371
MMBtu/$1000 13.41
4.7 Carbon Emission Displacement Cadmus calculated displaced greenhouse gas emissions associated with Efficiency Maine’s
HESP. To conduct this analysis, Cadmus used the verified net energy impacts, in terms of net
tons of carbon emissions avoided over the EUL of the projects. Cadmus used the following tools
16 As savings for TREAT and REM/Rate homes could not be separated by end use or measure type, these savings
were not adjusted.

Efficiency Maine Trust HESP Evaluation September 25, 2012
The Cadmus Group, Inc. / Energy Services 42
in this analysis: the World Resource Institute’s GHG Protocol;17
and the Maine Department of
Environmental Protection (DEP) Greenhouse Gas Worksheet (Worksheet).18
Data used to calculate the displaced greenhouse gas emissions over the EUL, as well as annually,
can be seen in Table 19 (Annual Energy Savings in MMBTUs) and Table 21 (Lifetime Energy
Savings in MMBTUs). Cadmus did not factor in emissions from corn pellets in this analysis as
the amount claimed was insignificant when compared with other fuels.
Cadmus referenced Maine’s DEP requirements for emission factor selection. According to the
DEP, “Greenhouse gas inventories are still evolving and the Department will accept any
emission factor with proper documentation.”19
The three primary sources of emissions factor
information indicated by DEP were:
The World Resource Institute (WRI)/World Business Council for Sustainable
Development;
The U.S. Environmental Protection Agency, AP-42; and
DOE, Energy Information Administration.3
The DEP Worksheet uses emissions factors from the Intergovernmental Panel on Climate
Change (IPCC) National Greenhouse Gas Inventory Program.20
Cadmus utilized this Worksheet
to calculate displaced annual and lifetime greenhouse gas emissions for the HESP. When
possible, emissions factors from the Worksheet were used; however, if a fuel type was not
included in the Worksheet, Cadmus obtained emissions factors from two other primary sources:
the GHG Protocol Initiative;21
and DOE, Energy Information Administration.22
Using the fuel type, the amount of fuel, and the emissions factor, Cadmus calculated carbon
dioxide (CO2) emissions, methane (CH4) emissions, and nitrous oxide (N2O) emissions,
displaced in tons per year. Using the global warming potentials from the 2007 IPCC Fourth
Assessment Report, Cadmus converted the annual and lifetime greenhouse gas emissions
displaced into net tons of CO2 equivalent.
The WRI requires reporting CO2e emissions from biomass separately from GHG emissions from
fossil fuels because biomass emissions are considered accounted for by land-use analysis.23
Therefore, values of total GHG emissions from fossil fuels have been reported separately from
the total CO2e emissions from biomass in this analysis. Table 27 shows the results.
17 http://www.ghgprotocol.org/calculation-tools/all-tools
18 http://maine.gov/dep/air/emissions/ghg-tools.htm
19 http://maine.gov/dep/air/emissions/ghg-rptng.htm
20 http://www.ipcc-nggip.iges.or.jp/public/gl/invs6.htm (as of 2 July 2003), http://maine.gov/dep/air/emissions/ghg-
tools.htm 21
http://www.ghgprotocol.org/templates/GHG5/layout.asp?type=p&MenuId=OTAx 22
http://www.eia.gov/pub/oiaf/1605/cdrom/pdf/e-supdoc.pdf 23
http://www.ghgprotocol.org/calculation-tools/faq

Efficiency Maine Trust HESP Evaluation September 25, 2012
The Cadmus Group, Inc. / Energy Services 43
Table 27. Annual and Lifetime Carbon Emissions Displaced from HESP
Fuel Type Total GHG Emissions Displaced Tons CO2e Annual Lifetime
All Fuels (without Biomass) 8,443 196,735
Biomass 347 8,707
In completing these calculations, Cadmus relied on several assumptions.
The amount of carbon displaced was an estimation, based on best practice tools available. As
referenced above, per Maine’s DEP requirements for emission factor selection, Maine does not
have one singular methodology for calculating displaced carbon emissions at this time. If another
tool was used, calculations could come out slightly differently.
In calculating carbon emissions displaced over the effective useful life of each measure type,
Cadmus applied currently available emissions factors to these savings, by measure and fuel type,
over the effective useful life of the measure.
In the future, depending on legislation and the progression of study in this area, emissions factors
will likely be updated. Thus, the level of rigor for this study is not sufficient to monetize these
carbon data.

Efficiency Maine Trust HESP Evaluation September 25, 2012
The Cadmus Group, Inc. / Energy Services 44
5. Survey Analysis Findings
Through the participant and partial participant surveys, Cadmus found the following:
Program Awareness: Efficiency Maine’s print and media marketing materials reached Maine
residents, and drove program participation. Contractors provided another effective channel to
inform residents about the program and to encourage their continued participation after residents
began to understand benefits gained through implementation of energy-saving improvements.
Program Information Sources: All participant classes used the Efficiency Maine Website as
their primary source for identifying an energy advisor to conduct the home energy assessment or
audit. To select energy advisors, full participants also used contractors they already knew, while
partial participants relied on word-of-mouth and referrals from Efficiency Maine.
Participant Profile: When compared to full participants, partial participants tended to be
younger and have larger households. Household and respondent characteristics identified
through these surveys may prove useful for messaging and segmentation efforts.
5.1 Motivations and Decisions The HESP rebate and the potential to save money on energy bills motivated residents to begin
participating in the program by having an energy audit. Among those who completed energy
upgrades (full participants), respondents indicated the rebate provided a greater incentive than
the federal tax credit. The two incentives’ combined effects may have motivated, at most, an
additional 31% to make improvements.
Participants (full and partial) reported that energy advisors most commonly recommended all
types of insulation and air sealing. These measures were also the ones most commonly installed,
as recorded in the program database.24
Very few survey respondents installed low-cost measures,
such as CFLs and low-flow showerheads, as part of their HESP project. This survey finding is
consistent with data regarding installed measures in the program database.
Initial Program Participation
To better understand outreach channels proving most influential with participants, Cadmus asked
about participants’ initial contacts with the program. HESP participants (both full and partial
combined) most commonly (36%) cited print advertising and media as their first source of
information about HESP. Print advertising included brochures, newspaper ads, and direct
mailings; and media sources included radio and TV spots. After print advertising and media, full
participants most frequently (29%) first learned about the program through a contractor, while
partial participants most often (24%) learned about the program through word-of-
mouth/recommendations from others.
Figure 26 depicts multiple sources first informing full and partial participants about the program.
24 The program database extract, provided by Efficiency Maine for the evaluation, was used to generate the survey
sample.

Efficiency Maine Trust HESP Evaluation September 25, 2012
The Cadmus Group, Inc. / Energy Services 45
Figure 26. Initial Program Exposure, All Participants (n=88, Multiple Responses Allowed)
Figure 27 illustrates reported sources participants utilized to find energy advisors to conduct
home energy audits. Both full (26%) and partial (31%) participants most frequently relied on
Efficiency Maine’s Website to find energy advisors. Full participants (25%) also commonly
called contractors they already knew, while partial participants also relied on family and friends
(28%) and referrals from Efficiency Maine (24%).
Figure 27. Energy Advisor Selection Sources (Multiple Responses Allowed)
Once participants selected an energy advisor, the advisor conducted an energy audit to assess
efficiency measures and improvements to decrease energy use in their homes.

Efficiency Maine Trust HESP Evaluation September 25, 2012
The Cadmus Group, Inc. / Energy Services 46
Both full (94%) and partial (88%) participants found audit reports somewhat to very effective.
More full participants than partial participants found them very effective. Qualitative responses
indicated they found the reports clear and detailed. Participants liked being presented with
options for improvements and their associated savings estimates. A typical positive comment
was: “I was amazed at what energy was saved by doing such little things.”
Conversely, some participants had negative comments, including that they waited “a long time”
to receive the audit report, or, in a couple of cases, never received it. Figure 28 shows
respondents’ ratings for the audit report’s effectiveness.
Figure 28. Effectiveness of Audit Report
Full (97%) and partial (92%) participants also attributed similar effectiveness levels to the
energy advisor. Several respondents indicated the advisor “explained things thoroughly” and
“identified improvements that I wasn’t aware of.” Figure 29 shows respondents’ ratings for the
energy advisor’s effectiveness.
Figure 29. Effectiveness of Energy Advisor
Audits led to recommendations for energy-efficiency improvements to each home.
Improvements recommended through the energy audit process were consistent between full and
partial participants, with floor and crawl space insulation (93%–94%) and air sealing
(89%–92%) most commonly recommended measures. Lower-cost measures, such as CFLs and
low-flow showerheads, were recommended for one-quarter (23%–27%) to one-third of
(33%–35%) participants.

Efficiency Maine Trust HESP Evaluation September 25, 2012
The Cadmus Group, Inc. / Energy Services 47
When partial participants were asked if any of the recommended improvements had been
completed in their homes, two-thirds (67%) said “yes” (33% said “no”). Of the 20 partial
participants that had completed some improvements, attic insulation (65%) was the most
common measure, followed by air sealing (50%) and floor/crawlspace insulation (45%).
Only one participant reported purchasing a CFL, and none reported installing low-flow
showerheads or aerators.
Figure 30. Recommended Improvements
Participation Motivations
To assess program motivations, Cadmus asked survey questions designed to help Efficiency
Maine better understand elements influencing residents to participate in the program.
Figure 31 illustrates reported reasons why full and partial participants chose to receive energy
audits. Desire to identify ways to save money on utility bills (26% of full and partial participants)
and receipt of the program’s rebate (24% of full and partial participants) provided the two most
common motivating factors leading participants to complete a home energy audit.
1%
6%
7%
17%
26%
27%
33%
36%
39%
41%
42%
67%
84%
92%
94%
4%
4%
11%
30%
30%
23%
35%
36%
43%
44%
50%
69%
89%
89%
93%
0% 10% 20% 30% 40% 50% 60% 70% 80% 90% 100%
Efficient cooling system
Heat pump water heater
Solar water heating
Tankless water heater
Duct sealing
Low-flow showerhead
CFLs
Window/door replacement
Efficient furnace/boiler/HP
Water heater pipe insulation
Programmable thermostat
Wall insulation
Attic insulation
Air sealing
Floor/crawl space insulation
Partial
Full

Efficiency Maine Trust HESP Evaluation September 25, 2012
The Cadmus Group, Inc. / Energy Services 48
Figure 31. Home Energy Audit Motivations
When asked to identify the most important reason in deciding to complete energy-efficiency
improvements to their homes after receiving audits, full participants most often cited saving
money on utility bills (28%) or saving energy (21%). Full participants also referenced the HESP
rebate and increasing their homes’ comfort as motivations.
Figure 32. Energy Improvement Installation Motivations
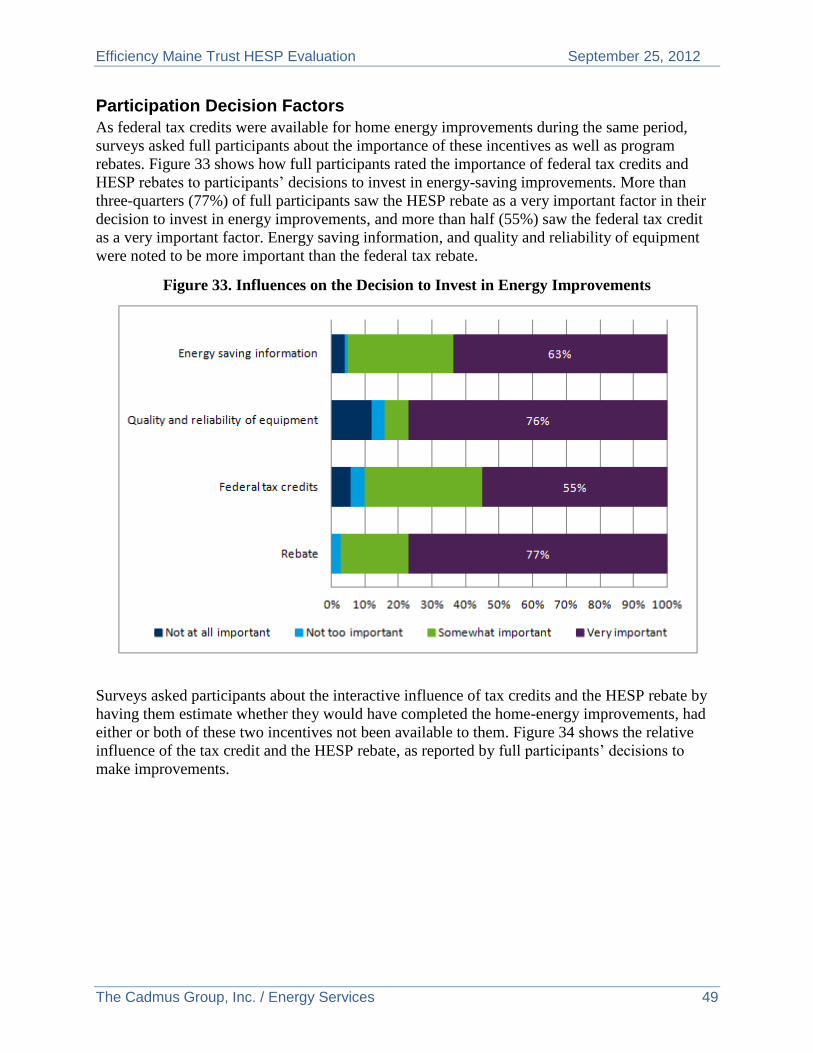
Efficiency Maine Trust HESP Evaluation September 25, 2012
The Cadmus Group, Inc. / Energy Services 49
Participation Decision Factors
As federal tax credits were available for home energy improvements during the same period,
surveys asked full participants about the importance of these incentives as well as program
rebates. Figure 33 shows how full participants rated the importance of federal tax credits and
HESP rebates to participants’ decisions to invest in energy-saving improvements. More than
three-quarters (77%) of full participants saw the HESP rebate as a very important factor in their
decision to invest in energy improvements, and more than half (55%) saw the federal tax credit
as a very important factor. Energy saving information, and quality and reliability of equipment
were noted to be more important than the federal tax rebate.
Figure 33. Influences on the Decision to Invest in Energy Improvements
Surveys asked participants about the interactive influence of tax credits and the HESP rebate by
having them estimate whether they would have completed the home-energy improvements, had
either or both of these two incentives not been available to them. Figure 34 shows the relative
influence of the tax credit and the HESP rebate, as reported by full participants’ decisions to
make improvements.

Efficiency Maine Trust HESP Evaluation September 25, 2012
The Cadmus Group, Inc. / Energy Services 50
Figure 34. Interactive Influence of Federal Tax Credit and Rebate
Without either the rebate or the tax credit, more than two-thirds of participants (69%) would
likely not have made the same improvements. Without the rebate, less than one-third (29%)
would have made the improvements, had only tax credits been available. Without the tax credit,
the rebate sufficiently incented about three-quarters of participants (74%) to make
improvements.
5.2 Barriers The upfront costs of making energy improvements presented the primary reason partial
participants did not follow through with making improvements at this time. Some partial
participants indicated they made improvements, and had submitted a rebate claim form, or were
waiting on contractors’ availability to complete the work.
Although participation barriers can be best understood from a nonparticipant perspective,
surveying nonparticipants fell beyond the evaluation’s scope. To examine barriers to
participation, the survey included a question asking participants to determine whether they had
concerns about participating before pursuing the energy assessment. The survey also included
questions to identify when and why partial participants discontinued their participation.
In terms of general concerns before having the energy assessment, relatively few full (26%) or
partial (24%) participants reported concerns about participating in the program. Most concerns
cited were financial. Among full participants who reported concerns, one-third (33%) cited the
high upfront costs associated with the program, and another third (33%) expressed concerns that
the rebate amount would be too low, and/or they might not ultimately qualify for and receive the
rebate. Others (22%) expressed concerns that the program application and participation process
would “be a hassle” and take too long or too much effort.
31%
74%
29%
69%
26%
71%
0%
20%
40%
60%
80%
Neither(n=68) Only Rebate (n=43) Only Tax Credit (n=42)
Would have made the same improvements
Would NOT have made the same improvements
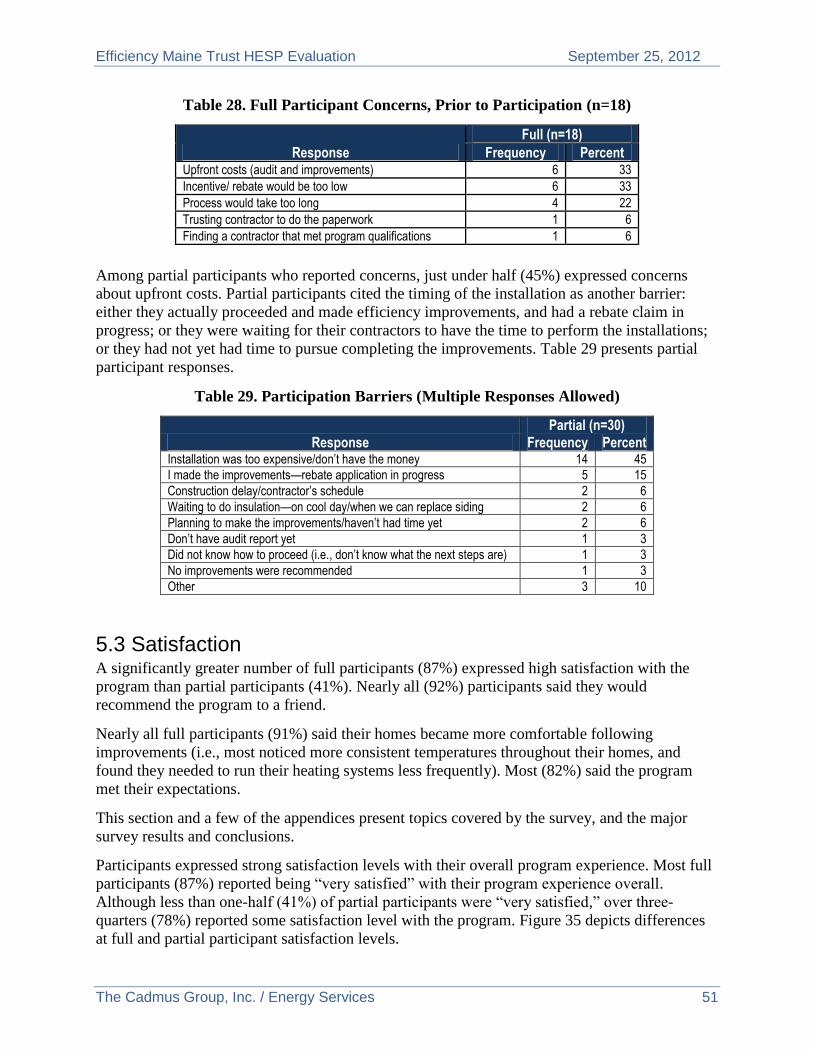
Efficiency Maine Trust HESP Evaluation September 25, 2012
The Cadmus Group, Inc. / Energy Services 51
Table 28. Full Participant Concerns, Prior to Participation (n=18)
Response Full (n=18)
Frequency Percent Upfront costs (audit and improvements) 6 33
Incentive/ rebate would be too low 6 33
Process would take too long 4 22
Trusting contractor to do the paperwork 1 6
Finding a contractor that met program qualifications 1 6
Among partial participants who reported concerns, just under half (45%) expressed concerns
about upfront costs. Partial participants cited the timing of the installation as another barrier:
either they actually proceeded and made efficiency improvements, and had a rebate claim in
progress; or they were waiting for their contractors to have the time to perform the installations;
or they had not yet had time to pursue completing the improvements. Table 29 presents partial
participant responses.
Table 29. Participation Barriers (Multiple Responses Allowed)
Response Partial (n=30)
Frequency Percent Installation was too expensive/don’t have the money 14 45
I made the improvements—rebate application in progress 5 15
Construction delay/contractor’s schedule 2 6
Waiting to do insulation—on cool day/when we can replace siding 2 6
Planning to make the improvements/haven’t had time yet 2 6
Don’t have audit report yet 1 3
Did not know how to proceed (i.e., don’t know what the next steps are) 1 3
No improvements were recommended 1 3
Other 3 10
5.3 Satisfaction A significantly greater number of full participants (87%) expressed high satisfaction with the
program than partial participants (41%). Nearly all (92%) participants said they would
recommend the program to a friend.
Nearly all full participants (91%) said their homes became more comfortable following
improvements (i.e., most noticed more consistent temperatures throughout their homes, and
found they needed to run their heating systems less frequently). Most (82%) said the program
met their expectations.
This section and a few of the appendices present topics covered by the survey, and the major
survey results and conclusions.
Participants expressed strong satisfaction levels with their overall program experience. Most full
participants (87%) reported being “very satisfied” with their program experience overall.
Although less than one-half (41%) of partial participants were “very satisfied,” over three-
quarters (78%) reported some satisfaction level with the program. Figure 35 depicts differences
at full and partial participant satisfaction levels.
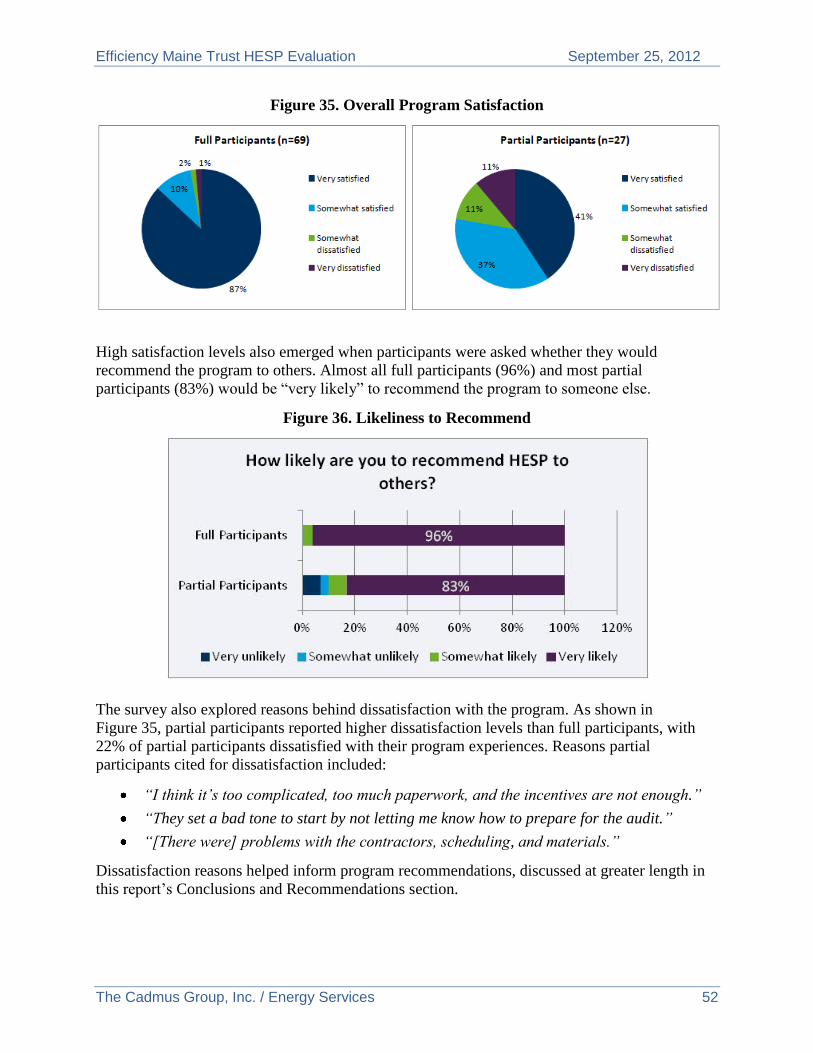
Efficiency Maine Trust HESP Evaluation September 25, 2012
The Cadmus Group, Inc. / Energy Services 52
Figure 35. Overall Program Satisfaction
High satisfaction levels also emerged when participants were asked whether they would
recommend the program to others. Almost all full participants (96%) and most partial
participants (83%) would be “very likely” to recommend the program to someone else.
Figure 36. Likeliness to Recommend
The survey also explored reasons behind dissatisfaction with the program. As shown in
Figure 35, partial participants reported higher dissatisfaction levels than full participants, with
22% of partial participants dissatisfied with their program experiences. Reasons partial
participants cited for dissatisfaction included:
“I think it’s too complicated, too much paperwork, and the incentives are not enough.”
“They set a bad tone to start by not letting me know how to prepare for the audit.”
“[There were] problems with the contractors, scheduling, and materials.”
Dissatisfaction reasons helped inform program recommendations, discussed at greater length in
this report’s Conclusions and Recommendations section.

Efficiency Maine Trust HESP Evaluation September 25, 2012
The Cadmus Group, Inc. / Energy Services 53
Satisfaction with Program Administration
To further investigate participant satisfaction, the survey asked about participants’ experiences
regarding administrative aspects of the program. Questions addressed topics such as: lengths of
time between application submissions and payment receipts (rebate turnaround times),
application processes, contractor performance, and paperwork.
Full participants expressed strong satisfaction with contractors and their work: 84% reported
being “very satisfied” with the level of customer service and professionalism provided by
contractors. As shown in Table 30, 79% of full participants reported being “very satisfied” with
the quality of work performed by their contractors to make the energy-saving improvements to
their home.
Table 30. Contractor Work Performance
Response Full (n=68)
Frequency Percent Very satisfied 54 79
Somewhat satisfied 10 15
Somewhat dissatisfied 4 6
Very dissatisfied 0 0
Once participants completed installation of the efficient measures, they were required to submit a
rebate claim form to Efficiency Maine before they could receive the rebate payments. Reported
rebate turnaround times varied from one week to four months. More than three-quarters (76%) of
full participants found HESP paperwork “very easy” to complete. As shown in Table 31, most
full participants (43%) waited three to four weeks from the time they submitted their rebate
claims form to receipt of a rebate, and 87% received their rebate within eight weeks.
Table 31. Rebate Turnaround Times
Response Full (n=61)
Frequency Percent 1 to 2 weeks 8 13
3 to 4 weeks 26 43
5 to 8 weeks 19 31
More than 8 weeks 8 13
As shown in Table 32, 83% of full participants were “very satisfied” with the time required to
receive rebate payments from Efficiency Maine.
Table 32. Satisfaction with Rebate Turnaround Times
Response Full (n=69)
Frequency Percent Very satisfied 57 83
Somewhat satisfied 5 7
Somewhat dissatisfied 0 0
Very dissatisfied 7 10

Efficiency Maine Trust HESP Evaluation September 25, 2012
The Cadmus Group, Inc. / Energy Services 54
Analysis indicated no correlation between the amount of time required to receive the rebate and
the satisfaction level, as half of respondents in the “more than eight weeks” category reported
being “very satisfied,” and the other half reported dissatisfaction.
Almost all (99%) full participants reported satisfaction with the rebate payment amount.
Satisfaction with Program Results
As shown in Table 33, 91% of full participants reported their homes were more comfortable after
energy-savings improvements, and none reported them as less comfortable.
Table 33. Home Comfort Level Changes
Response Full (n=70)
Frequency Percent More comfortable 64 91
Less comfortable 0 0
About the same 2 3
Don't know/Not enough time to notice a difference 4 6
Figure 37 lists ways participants found their homes more comfortable after completing the
improvements. Most cited consistent temperatures and fewer drafts throughout homes (61% and
34%, respectively).
Figure 37. Post-Program Home Comfort Level Improvements
(Multiple Responses Allowed)
Further, most participants (71%) reported they ran their heating systems less frequently after
energy-saving improvements to their homes (as shown in Figure 38).

Efficiency Maine Trust HESP Evaluation September 25, 2012
The Cadmus Group, Inc. / Energy Services 55
Figure 38. Post-Program Heating System Usage
In addition, nearly two-thirds (64%) of participants reported their energy bills decreasing after
making energy improvements. Three percent reported their energy bills increased, and 11% said
they stayed the same (as shown in Table 34).
Table 34. Post-Program Energy Bill Changes
Response Full (n=70)
Frequency Percent Bills have gone down 45 64
Bills have gone up 2 3
About the same 8 11
Haven't noticed 9 13
Don't know 6 9
As shown in Table 35, most participants (82%) said their energy bills changed as expected
through participating in the program.
Table 35. Post-Program Energy Bill Expectations
Response
Full (n=45)
Frequency Percent
Expectations met 37 82
No 2 4
Don't know 6 13
Nearly all (91%) participants cited increased comfort in their homes as the primary benefit to the
program, followed by a decreased need to run heating systems, and lower bills.

Efficiency Maine Trust HESP Evaluation September 25, 2012
The Cadmus Group, Inc. / Energy Services 56
6. Recommendations and Conclusions
6.1 Energy-Efficiency Recommendations The Efficiency Maine HESP reported savings and program verified savings for the 41 houses
examined were similar, resulting in a realization rate of 90%. Table 36 and Figure 39 and Figure
40 show energy savings results for the 41 evaluated sites.
Table 36. Final Gross Realization Rate and Savings—By Measure
Measure Type Reported Savings Verified Savings Realization Rate
Air Sealing 566 585 103%
Attic Hatch 29 18 62%
Basement Insulation 381 305 80%
Ceiling Insulation 568 328 58%
Wall Insulation 462 584 127%
Furnace/Boiler 82 51 62%
Total (41 Sites) 2,087 1,871 90%
Figure 39. 41 Site Total Energy Savings: HESP Database
Air Sealing 27%
Attic Hatch 2%
Basement 18%
Ceiling 27%
Walls 22%
Furnaces / Boilers
4%

Efficiency Maine Trust HESP Evaluation September 25, 2012
The Cadmus Group, Inc. / Energy Services 57
Figure 40. 41 Site Total Energy Savings: Cadmus Observations
The proportion of boiler savings is small in the charts above because there were a small number
of retrofits in the sample. The proportion in the population is roughly twice as high.
Table 37 shows the overall, annual program-level savings by verified measure type.
Table 37. Annual Energy Savings by Measure Type in MMBTUs
Measure Type
Reported Gross
MMBTU Savings
Verified Gross
MMBTU Savings
Gross Realization
Rate NTG
Verified Net Savings (Verified Gross x
NTG)
Verified Net
Savings
Measures
(n)
Air Sealing 42,993 44,467 103% 0.86 38,242 89% 1,846
Attic Access: Existing (Hatch) 2,107 1,310 62% 0.86 1,127 53% 1,248
HVAC: System (Furnace/Boiler) 14,649 9,139 62% 0.86 7,859 54% 730
Insulation: Attic 30,732 17,756 58% 0.86 15,270 50% 2,849
Insulation: Basement/Floors 20,353 16,309 80% 0.86 14,026 69% 2,656
Insulation: Walls 18,394 23,271 127% 0.86 20,013 109% 967
Remaining Measures 12,257 12,257 100% 0.86 10,540 86% 2,765
Total (1780 Sites) 141,485 124,509 88% 0.86 107,077 76% 13,061
Overall program-reported savings and Cadmus-verified energy savings were similar,
resulting in an 88% gross realization rate and a 76% net realization rate. The verified
program savings are slightly different from the verified measure-level savings due to a slightly
different measure mix.
Air Sealing 31%
Attic Hatch 1%
Basement 16%
Ceiling 18%
Walls 31%
Furnaces / Boilers
3%

Efficiency Maine Trust HESP Evaluation September 25, 2012
The Cadmus Group, Inc. / Energy Services 58
Cadmus draws the following conclusions and makes the following recommendations, based on
the HESP evaluation:
1. Reported savings from air sealing measures were corroborated by Cadmus’ analysis
(103% realization rate). Efficiency Maine should continue to emphasize the
importance of thorough air sealing practices. Air sealing and wall insulation measures
made up the majority of the energy savings among homes reviewed by Cadmus. Stopping
air leakage is arguably the most important energy conservation action, as leaky insulation
does not impede heat. Also, in heating season, houses tend to breathe in through their
basements and out through their top floor ceilings; so these two areas are important areas
to air seal.
2. Efficiency Maine should work with its energy advisors to ensure they target areas
within the home that will lead to the greatest energy savings achievements (e.g.,
empty wall cavities). Improving the product of (the lowest R-value) times (largest area)
has the most benefit, as insulation experiences diminishing returns—a little insulation,
added to an area with none and over a large area, provides a substantial benefit, while a
great deal of insulation added to existing insulation over a similar or smaller area has
lower benefits. Filling existing empty wall cavities tends to show greater savings than
ceilings, as ceilings most often have some insulation as a starting point, and, therefore,
lower savings relative to walls.
3. To allow future comparisons with actual bills, we recommend Efficiency Maine collect
customer billing data as part of the application process, both to assess the need for
efficiency upgrades, and to obtain pre- and post-participation information on a
larger set of homes. Due to the difficulty of obtaining utility billing data after the fact,
Cadmus was ultimately unable to compare our modeling results with billing data for most
sites.
a. Additionally, resident responses and our observations indicate around half of
inspected residences burned wood.
4. Cadmus recommends, in future evaluations, Efficiency Maine consider placing
temperature loggers in homes to see how homes are actually heated, and to obtain
accurate data on heating and water temperatures. We suspect residents may set
temperatures lower on their HVAC and hot water systems than reported.
6.2 Program Recommendations 1. Promotion: Efficiency Maine’s program outreach efforts have successfully reached
residents. Program materials were cited as the primary source of program awareness, and
the Website was identified as a primary source for identifying energy advisors. Cadmus
recommends the Trust continue using the effective marketing methods currently in
place to promote HESP related efforts. As contractors provide another primary
program gateway, Cadmus also recommends the Trust continue building
partnerships, and supplying contractors with information they can use to help
promote program offerings.
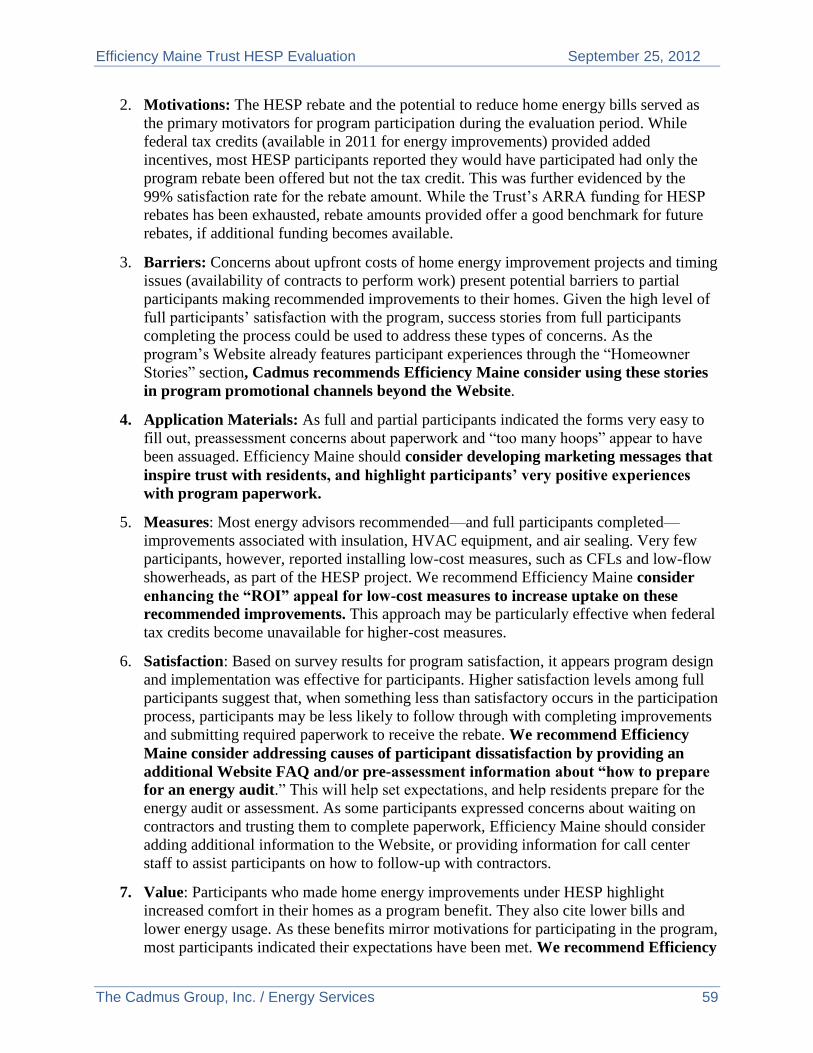
Efficiency Maine Trust HESP Evaluation September 25, 2012
The Cadmus Group, Inc. / Energy Services 59
2. Motivations: The HESP rebate and the potential to reduce home energy bills served as
the primary motivators for program participation during the evaluation period. While
federal tax credits (available in 2011 for energy improvements) provided added
incentives, most HESP participants reported they would have participated had only the
program rebate been offered but not the tax credit. This was further evidenced by the
99% satisfaction rate for the rebate amount. While the Trust’s ARRA funding for HESP
rebates has been exhausted, rebate amounts provided offer a good benchmark for future
rebates, if additional funding becomes available.
3. Barriers: Concerns about upfront costs of home energy improvement projects and timing
issues (availability of contracts to perform work) present potential barriers to partial
participants making recommended improvements to their homes. Given the high level of
full participants’ satisfaction with the program, success stories from full participants
completing the process could be used to address these types of concerns. As the
program’s Website already features participant experiences through the “Homeowner
Stories” section, Cadmus recommends Efficiency Maine consider using these stories
in program promotional channels beyond the Website.
4. Application Materials: As full and partial participants indicated the forms very easy to
fill out, preassessment concerns about paperwork and “too many hoops” appear to have
been assuaged. Efficiency Maine should consider developing marketing messages that
inspire trust with residents, and highlight participants’ very positive experiences
with program paperwork.
5. Measures: Most energy advisors recommended—and full participants completed—
improvements associated with insulation, HVAC equipment, and air sealing. Very few
participants, however, reported installing low-cost measures, such as CFLs and low-flow
showerheads, as part of the HESP project. We recommend Efficiency Maine consider
enhancing the “ROI” appeal for low-cost measures to increase uptake on these
recommended improvements. This approach may be particularly effective when federal
tax credits become unavailable for higher-cost measures.
6. Satisfaction: Based on survey results for program satisfaction, it appears program design
and implementation was effective for participants. Higher satisfaction levels among full
participants suggest that, when something less than satisfactory occurs in the participation
process, participants may be less likely to follow through with completing improvements
and submitting required paperwork to receive the rebate. We recommend Efficiency
Maine consider addressing causes of participant dissatisfaction by providing an
additional Website FAQ and/or pre-assessment information about “how to prepare
for an energy audit.” This will help set expectations, and help residents prepare for the
energy audit or assessment. As some participants expressed concerns about waiting on
contractors and trusting them to complete paperwork, Efficiency Maine should consider
adding additional information to the Website, or providing information for call center
staff to assist participants on how to follow-up with contractors.
7. Value: Participants who made home energy improvements under HESP highlight
increased comfort in their homes as a program benefit. They also cite lower bills and
lower energy usage. As these benefits mirror motivations for participating in the program,
most participants indicated their expectations have been met. We recommend Efficiency

Efficiency Maine Trust HESP Evaluation September 25, 2012
The Cadmus Group, Inc. / Energy Services 60
Maine consider using customer reported energy and cost saving benefits to provide
testimonial endorsements for program promotions.

Efficiency Maine Trust HESP Evaluation September 25, 2012
The Cadmus Group, Inc. / Energy Services i
Appendix A: Net-to-Gross Evaluation Overview
Net-to-gross (NTG) estimates serve as a critical part of demand-side management (DSM)
program impact evaluations as they allow utilities to determine the portion of gross energy
savings influenced by and attributable to their DSM programs, free from the result of other
influences. Freeridership and spillover comprise NTG’s two components. Freeriders are
customers who would have purchased the measure without any program influence. Spillover is
the amount of additional savings obtained by customers investing in additional energy-efficient
measures or activities due to their program participation. Various methods can be used to
estimate program freeridership and spillover. Our baseline evaluation approach uses self-reports
through participant surveys to estimate freeridership for the HESP program. We did not quantify
spillover because the responses received did not indicate a high incidence of spillover.
Survey Design—Freeridership
Cadmus designed survey questions to determine why customers installed a given measure and
the program’s influence over those decisions. The survey goal was to establish what the decision
maker might have done in the program’s absence. Five core freeridership questions are used to
address this:
Would the participant have installed the measure without the program incentive?
Would the participant have installed the same quantity of measures without the program
incentive?
Would the participant have installed the measure to the same efficiency level without the
program incentive?
In the absence of the program incentive, when would the respondent have installed the
measures?
Before they requested the energy audit, had the participant ever previously had an energy
audit done on their home?
Freeridership Survey Questions
Five specific questions were included in the HESP survey instrument’s freeridership portion to
capture the four core freeridership concepts listed above:
1. If only the federal tax credit was available and the HESP rebate was not, would you have
made the same improvements?
2. Let me make sure I understand. When you say you would not have made the same
improvements, do you mean you would not have made any of them or you would have
made only some?
3. And would any of the improvements you would have made been less energy efficient?
4. And when would you have made the improvements? (timing)
5. Before you requested the energy audit, had you ever previously had an energy audit done
on your home?

Efficiency Maine Trust HESP Evaluation September 25, 2012
The Cadmus Group, Inc. / Energy Services ii
Cadmus developed a transparent, straightforward matrix approach to assign a score to
participants, based on their objective responses to these targeted survey questions. Question
response patterns were assigned freeridership scores using a rules-based approach that
decremented a respondent’s freeridership score if a response to a question was not indicative of
freeridership. This specific approach is cited in the NAPEE Handbook on DSM Evaluation, 2007
edition, page 5-1.
The response patterns and scoring weights remain explicit: they can be discussed, changed and
results shown in real time. Our approach provided other important features, including:
Derivation of a partial freeridership score, based on the likelihood of a respondent taking
similar actions in the incentive’s absence.
Use of a rules-based approach for consistency among multiple respondents.
The ability to change weightings in a “what if” exercise, testing the response set’s
stability.
The Cadmus method offers a key advantage by introducing the concept of partial freeridership.
Experience has taught us that program participants do not fall neatly into freerider and not-
freerider categories. For example, partial freeridership scores were assigned to participants with
plans to install the measure; though the program exerted some influence over their decision,
other market characteristics beyond the program also proved influential. In addition, with partial
freeridership, we could utilize “don’t know” and “refused” responses by classifying them as
partial credit, rather than removing the entire respondent from the analysis.
Freeridership was assessed at three levels. First, each participant survey response was converted
into freeridership matrix terminology. Each participant’s combination of responses was then
assigned a score from the matrix. Finally, all participants were aggregated into an average
freeridership score for the entire program category.
Convert Responses to Matrix Terminology
We independently evaluated each survey question’s response to assess participants’ freeridership
level for each question. Each survey response option was converted into a value of “yes,” “no,”
or “partial,” which refers to whether the respondent’s answer for the question was indicative of
freeridership or not.
Table 38 lists five survey questions, their corresponding response options, and the value which
we converted them to (in parentheses). “Don’t know” and “refused” responses were converted to
“partial” for all questions.

Efficiency Maine Trust HESP Evaluation September 25, 2012
The Cadmus Group, Inc. / Energy Services iii
Table 38. Assignments of HESP Survey Response Options into Matrix Terminology
28. And, how about if only the federal tax credit was available and the program rebate was not, would you have made the same improvements?
33. Let me make sure I understand. When you say you would not have made the same improvements, do you mean you would not have made any of them or you would have made only some?
30 / 34. And would any of the improvements you would have made been less energy efficient?
31 / 35. And would you have made the improvements: [Read list]
32 / 36. Before you requested the energy audit, had you ever previously had an energy audit done on your home?
Yes (Yes) Would not have made any
(Yes) Yes (No)
At the same time or within three months of when you actually made the upgrades
(Yes)
Yes (Yes)
No (No) Only some (No) No (Yes) Within three to six
months (Partial)
No (No)
Don't Know (Partial) Don't Know (Partial) Don't Know
(Partial) Six to 12 months
(Partial) Don't Know
(Partial)
Refused (Partial) Refused (Partial) Refused (Partial)
More than a year (No)
Refused (Partial)
Never (No)
Don't Know (Partial)
Refused (Partial)
Participant Freeridership Scoring
After converting survey responses into matrix terminology, we created a freeridership matrix, so
the combination of each participant’s responses to the four questions could be assigned a
freeridership score. To create the matrix, we determined every combination of possible responses
to the four survey questions, and then assigned a freeridership score of 0 to 100% to each
combination. Using these matrices, every participant combination of responses was assigned a
score of 0 to 100%.
Program Category Freeridership Scoring
After assigning a freeridership score to every survey respondent, Cadmus calculated an average
freerider score for the program category. For the purposes of this analysis, a simple average was
taken of the individual respondent level freeridership scores to arrive at the program
freeridership estimate. If accurate program savings information becomes available for these
surveyed participants, the individual freeridership scored can be weighted by measure savings to
arrive at a savings weighted freeridership estimate.
The Cadmus Freeridership Scoring Model
Cadmus has developed an Excel-based model to assist with freeridership calculation and
improve consistency and quality of results. Our model translates raw survey responses into
matrix terminology, and then assigns each participant’s response pattern a score from the matrix.

Efficiency Maine Trust HESP Evaluation September 25, 2012
The Cadmus Group, Inc. / Energy Services iv
Program participants in the sample can be then aggregated by program category to calculate the
average freerider score.
The model incorporates the follow inputs described in this methodology:
Raw survey responses for each participant, along with the program category for their
rebated measure, and energy savings from that measure, if applicable.
Table A2 above represents the converting of the raw survey responses into scoring matrix
terminology (“Yes”, “No”, “Partial”) for each program category.
Custom freeridership scoring matrices for each unique survey type.
The model uses a simple interface, allowing users to quickly reproduce a scoring analysis for any
program category. It displays each participant’s combination of responses and corresponding
freeridership score, and then produces a summary table, providing the average score.
Table 39 contains the full freeridership scoring matrix developed for the HESP program.
Table 39. Full HESP Freeridership Scoring Matrix
28. And, how about if only the federal tax credit was available and the program rebate was not, would you have made the same improvements?
33. Let me make sure I understand. When you say you would not have made the same improvements, do you mean you would not have made any of them or you would have made only some?
30 / 34. And would any of the improvements you would have made been less energy efficient?
31 / 35. And would you have made the improvements…
32 / 36. Before you requested the energy audit, had you ever previously had an energy audit done on your home? Combo
Freeridership Score
Yes x Yes Yes Yes YesxYesYesYes 100.00%
Yes x Yes Yes Partial YesxYesYesPartial 100.00%
Yes x Yes Yes No YesxYesYesNo 75.00%
Yes x Yes Partial Yes YesxYesPartialYes 75.00%
Yes x Yes Partial Partial YesxYesPartialPartial 75.00%
Yes x Yes Partial No YesxYesPartialNo 50.00%
Yes x Yes No x YesxYesNox 0.00%
Yes x Partial Yes Yes YesxPartialYesYes 75.00%
Yes x Partial Yes Partial YesxPartialYesPartial 75.00%
Yes x Partial Yes No YesxPartialYesNo 50.00%
Yes x Partial Partial Yes YesxPartialPartialYes 50.00%
Yes x Partial Partial Partial YesxPartialPartialPartial 50.00%
Yes x Partial Partial No YesxPartialPartialNo 25.00%
Yes x Partial No x YesxPartialNox 0.00%
Yes x No Yes Yes YesxNoYesYes 50.00%
Yes x No Yes Partial YesxNoYesPartial 50.00%
Yes x No Yes No YesxNoYesNo 25.00%
Yes x No Partial Yes YesxNoPartialYes 25.00%

Efficiency Maine Trust HESP Evaluation September 25, 2012
The Cadmus Group, Inc. / Energy Services v
28. And, how about if only the federal tax credit was available and the program rebate was not, would you have made the same improvements?
33. Let me make sure I understand. When you say you would not have made the same improvements, do you mean you would not have made any of them or you would have made only some?
30 / 34. And would any of the improvements you would have made been less energy efficient?
31 / 35. And would you have made the improvements…
32 / 36. Before you requested the energy audit, had you ever previously had an energy audit done on your home? Combo
Freeridership Score
Yes x No Partial Partial YesxNoPartialPartial 25.00%
Yes x No Partial No YesxNoPartialNo 12.50%
Yes x No No x YesxNoNox 0.00%
Partial x Yes Yes Yes PartialxYesYesYes 75.00%
Partial x Yes Yes Partial PartialxYesYesPartial 75.00%
Partial x Yes Yes No PartialxYesYesNo 50.00%
Partial x Yes Partial Yes PartialxYesPartialYes 50.00%
Partial x Yes Partial Partial PartialxYesPartialPartial 50.00%
Partial x Yes Partial No PartialxYesPartialNo 25.00%
Partial x Yes No x PartialxYesNox 0.00%
Partial x Partial Yes Yes PartialxPartialYesYes 50.00%
Partial x Partial Yes Partial PartialxPartialYesPartial 50.00%
Partial x Partial Yes No PartialxPartialYesNo 25.00%
Partial x Partial Partial Yes PartialxPartialPartialYes 25.00%
Partial x Partial Partial Partial PartialxPartialPartialPartial 25.00%
Partial x Partial Partial No PartialxPartialPartialNo 12.50%
Partial x Partial No x PartialxPartialNox 0.00%
Partial x No Yes Yes PartialxNoYesYes 25.00%
Partial x No Yes Partial PartialxNoYesPartial 25.00%
Partial x No Yes No PartialxNoYesNo 12.50%
Partial x No Partial Yes PartialxNoPartialYes 12.50%
Partial x No Partial Partial PartialxNoPartialPartial 12.50%
Partial x No Partial No PartialxNoPartialNo 0.00%
Partial x No No x PartialxNoNox 0.00%
No Yes Yes Yes Yes NoYesYesYesYes 50.00%
No Yes Yes Yes Partial NoYesYesYesPartial 50.00%
No Yes Yes Yes No NoYesYesYesNo 25.00%
No Yes Yes Partial Yes NoYesYesPartialYes 25.00%
No Yes Yes Partial Partial NoYesYesPartialPartial 25.00%
No Yes Yes Partial No NoYesYesPartialNo 12.50%
No Yes Yes No x NoYesYesNox 0.00%
No Yes Partial Yes Yes NoYesPartialYesYes 25.00%
No Yes Partial Yes Partial NoYesPartialYesPartial 25.00%
No Yes Partial Yes No NoYesPartialYesNo 12.50%
No Yes Partial Partial Yes NoYesPartialPartialYes 12.50%
No Yes Partial Partial Partial NoYesPartialPartialPartial 12.50%
No Yes Partial Partial No NoYesPartialPartialNo 0.00%
No Yes Partial No x NoYesPartialNox 0.00%

Efficiency Maine Trust HESP Evaluation September 25, 2012
The Cadmus Group, Inc. / Energy Services vi
28. And, how about if only the federal tax credit was available and the program rebate was not, would you have made the same improvements?
33. Let me make sure I understand. When you say you would not have made the same improvements, do you mean you would not have made any of them or you would have made only some?
30 / 34. And would any of the improvements you would have made been less energy efficient?
31 / 35. And would you have made the improvements…
32 / 36. Before you requested the energy audit, had you ever previously had an energy audit done on your home? Combo
Freeridership Score
No Yes No Yes Yes NoYesNoYesYes 12.50%
No Yes No Yes Partial NoYesNoYesPartial 12.50%
No Yes No Yes No NoYesNoYesNo 0.00%
No Yes No Partial Yes NoYesNoPartialYes 0.00%
No Yes No Partial Partial NoYesNoPartialPartial 0.00%
No Yes No Partial No NoYesNoPartialNo 0.00%
No Yes No No x NoYesNoNox 0.00%
No Partial Yes Yes Yes NoPartialYesYesYes 25.00%
No Partial Yes Yes Partial NoPartialYesYesPartial 25.00%
No Partial Yes Yes No NoPartialYesYesNo 12.50%
No Partial Yes Partial Yes NoPartialYesPartialYes 12.50%
No Partial Yes Partial Partial NoPartialYesPartialPartial 12.50%
No Partial Yes Partial No NoPartialYesPartialNo 0.00%
No Partial Yes No x NoPartialYesNox 0.00%
No Partial Partial Yes Yes NoPartialPartialYesYes 12.50%
No Partial Partial Yes Partial NoPartialPartialYesPartial 12.50%
No Partial Partial Yes No NoPartialPartialYesNo 0.00%
No Partial Partial Partial Yes NoPartialPartialPartialYes 0.00%
No Partial Partial Partial Partial NoPartialPartialPartialPartial 0.00%
No Partial Partial Partial No NoPartialPartialPartialNo 0.00%
No Partial Partial No x NoPartialPartialNox 0.00%
No Partial No Yes Yes NoPartialNoYesYes 0.00%
No Partial No Yes Partial NoPartialNoYesPartial 0.00%
No Partial No Yes No NoPartialNoYesNo 0.00%
No Partial No Partial Yes NoPartialNoPartialYes 0.00%
No Partial No Partial Partial NoPartialNoPartialPartial 0.00%
No Partial No Partial No NoPartialNoPartialNo 0.00%
No Partial No No x NoPartialNoNox 0.00%
No No x x x NoNoxxx 0.00%

Efficiency Maine Trust HESP Evaluation September 25, 2012
The Cadmus Group, Inc. / Energy Services vii
Table 40 shows the unique response combinations from the HESP participant survey sample, and
the number of responses for each combination.
Table 40. Frequency of Freeridership Scoring Combinations
Q28. And, how about if only the federal tax credit was available and the program rebate was not, would you have made the same improvements?
Q33. Let me make sure I understand. When you say you would not have made the same improvements, do you mean you would not have made any of them or you would have made only some?
Q30 / Q34. And would any of the improvements you would have made been less energy efficient?
Q31 / Q35. And would you have made the improvements: [Read list]
Q32 / Q36. Before you requested the energy audit, had you ever previously had an energy audit done on your home?
Freeridership Score
Frequency of
Response String
Yes x Yes Yes No 75.00% 5
Yes x Yes Partial No 50.00% 6
Yes x Yes No x 0.00% 7
Yes x No Yes No 25.00% 5
Yes x No Partial Yes 25.00% 1
Yes x No Partial No 12.50% 3
Yes x No No x 0.00% 6
Partial x Yes Partial No 25.00% 1
Partial x Partial Partial No 12.50% 3
Partial x Partial No x 0.00% 1
Partial x No No x 0.00% 2
No Yes Yes Yes No 25.00% 3
No Yes Yes No x 0.00% 6
No Yes No Yes No 0.00% 3
No Yes No Partial Yes 0.00% 1
No Yes No Partial No 0.00% 3
No Yes No No x 0.00% 5
No No x x x 0.00% 9

Efficiency Maine Trust HESP Evaluation September 25, 2012
The Cadmus Group, Inc. / Energy Services viii
Appendix B: Limitations of Increasing Heating System Efficiency with Existing Distribution Systems
Replacing mechanical equipment in existing homes can be a simple way to improve efficiency
and reduce fuel costs, especially if a heating system is nearing the end of its useful life. However,
the overall system efficiency does not necessarily reach the nameplate Annual Fuel Utilization
Efficiency (AFUE) rating if the heating appliance is not operating under the same circumstances
used during the AFUE testing. AFUE testing conditions are below the condensation temperature
of natural gas exhaust streams: therefore, nameplate ratings assume operational conditions are
below the condensing point of natural gas, which is in the 135 F range.
High-efficiency condensing gas or propane appliances can reach thermal conversion efficiencies
into the mid 90% AFUE range, when operating in a condensing regime, but if return
temperatures are above the condensing temperature of the flue gas, the additional efficiency
boost of condensing the moisture from the flue gas is not realized. Figure 41 is a typical
efficiency curve for condensing boilers.
Figure 41. Condensing Boiler Efficiency Curve
With condensing gas furnaces, the return air temperature is the low end of room temperature,
which might be in the 60-70 F range for most of the population of typical residences—obviously
well below the condensing temperature of natural gas. Thus, condensing gas furnaces can be
relied on to operate in a condensing regime throughout the season.
With gas boilers, the return water temperature is a function of the design of the distribution
system and piping, and in the past has typically been designed around temperatures well above
the condensing temperature of natural gas, most often 180 F LWT, 160 F EWT. Replacing an
85+/-% AFUE boiler with a condensing boiler without reviewing and/or modifying the
distribution system characteristics may mean that the new condensing boiler will condense only
under certain conditions (e.g., light loading, which occurs when a boiler has short firing cycles
with extended off-periods where boiler return water temperatures do not rise above condensing
temperatures), potentially forfeiting the 5-10% AFUE savings being sought.

Efficiency Maine Trust HESP Evaluation September 25, 2012
The Cadmus Group, Inc. / Energy Services ix
In some cases, a homeowner may be willing to experiment with boiler water temperatures to
empirically determine the lowest functional hot water delivery temperature, and incorporate that
information into an outdoor reset controller, but it is more likely settings will be chosen by an
installing contractor based on a rule of thumb that does not lead to insufficient heat call-backs,
and does not condense for a significant amount of the heating season.

Efficiency Maine Trust HESP Evaluation September 25, 2012
The Cadmus Group, Inc. / Energy Services x
Appendix C. Insulating Basements
From the standpoint of a building enclosure surface area, insulating basement walls increases
exterior surface area and total building heat loss over insulating ceilings, but, functionally,
attaining an effective air seal and insulation layer at basement walls is typically easier than for
basement ceilings. Insulating basement walls makes a quasi-outdoor basement space into a
known indoor space, and clarifies the plan for that space, while the typical insulated ceiling does
not. Note that when bringing the mechanical equipment into the conditioned space, there is a
new concern that combustion products are being properly exchanged with outdoors, and not left
to linger indoors.
Basement spaces most often are left to “float” thermally (not directly controlled with a
thermostat), and are quasi-indoors and quasi-outdoors, the exact proportion depending on the
particular basement under review. While insulating the ceiling of the basement might appear to
be a good approach to limit heat loss from upstairs conditioned spaces to the basement, there
tend to be many unsealed penetrations through the floor, and the commonly seen fiberglass
batting provides no resistance to air flow; so drafts into basements tend to warm up and rise up
into the spaces above, bypassing the insulation. Further, most often the heating system resides in
the basement, and complicates the question of the basement being indoors or outdoors, since,
with few exceptions, the heating system loses a noticeable amount of heat to the basement.

Efficiency Maine Trust HESP Evaluation September 25, 2012
The Cadmus Group, Inc. / Energy Services xi
Appendix D. Contacting Fuel Providers
During the Efficiency Maine HESP evaluation, Cadmus contacted the following fuel providers
on behalf of Efficiency Maine and HESP participants.
McKusick
Dead River
Ness Oil
RH Foster
Crowley
Downeast
Bragdon
Mount Blue
Pitt Stop
Fielding's
Fabian
J&S Oil
Colby & Gale
MW Sewall
Bangor Hydro
Gary's Fuel
North Village
AmeriGas
Harvest
Community Energy
Atlantic Heating Company
Lampron Energy
Deer Pond
Maritime Energy
Cadmus began by calling the aforementioned fuel providers to locate a contact within the
company who could approve of the distribution of energy usage information, and could obtain
the necessary energy usage information. Once the connection was made, Cadmus either faxed or
e-mailed the participant’s signed authorization form to the contact with the hopes of receiving
the necessary data in response.
For participants that were customers of Unitil, Cadmus followed a different process. Unitil was
unwilling to provide the energy usage information for its customers – even with a signed
authorization form. As a result, Cadmus relied on the participants themselves to provide their
energy bills. This proved to have a lower than average success rate with two out of five Unitil
customers providing complete bills.
Cadmus made multiple attempts to reach out to fuel providers and customers if the fuel usage
data was not supplied. In some instances, one participant had multiple fuel providers and, if one
fuel provider did not send in the data, that customer fuel usage information was not able to be
used in the comparison. Table 41 shows the results of our attempts to receive fuel usage
information.
Table 41. Fuel Bill Receipt
Fuel Provider Received Not
Received Total
Unitil (only) 2 3 5
Dead River (only) 6 0 6
Downeast (only) 4 1 5
Other/Incomplete 9 7 16
No Viable Form N/A N/A 9
Total 21 11 41