EFFICIENCY IMPROVEMENT OF VERTICAL AXIS … 2016 * Presenting author EFFICIENCY IMPROVEMENT OF...
7
EWEA 2016 * Presenting author EFFICIENCY IMPROVEMENT OF VERTICAL-AXIS WIND TURBINES WITH COUNTER-ROTATING LAY-OUT Nicolas Parneix*, Rosalie Fuchs, Alexandre Immas, Frédéric Silvert Nenuphar, Campus de l’Institut Pasteur de Lille, 1, rue du Professeur Calmette, 59000 Lille, France, www.nenuphar-wind.com Paul Deglaire ADWEN, 60 Avenue du Général de Gaulle, 92800 Puteaux, http://www.adwenoffshore.com/ 1 Introduction Improving the performance of Vertical Axis Wind Turbines (VAWTs) is key to make VAWTs commercially successful. Scientists have investigated several interesting concepts for that purpose: increasing the swept area, especially to limit the losses due to 3D effects, or using flap and pitch systems to control the flow around the blades [1, 2]. Nenuphar, with the Twinfloat concept (see Figure 1), propose to take advantage of all these concepts combined with an aerodynamic effect called counter-rotating effect [3]. The turbine is made of two 2.5MW VAWT on only one floater, to reach a rated power of 5MW. The proximity of the two rotors generates a contraction of the streamtubes that flow in the area between the rotors, thus increasing the air flow rate going through both the swept areas and thereby the performance of the VAWT. This concept has also other advantages: smaller rotors that make easier their fabrication, their installation and Operating and Maintenance (O&M) operations, floater motions reduction thanks to specific control laws and wake reduction leading to an increase in the capacity factor. Simulations presented in this paper are carried out by Computational Fluid Dynamics (CFD) or by a Vortex Panel Method to investigate the streamtubes contraction caused by counter-rotating wind turbines and the impact of the distance between each rotor. This paper presents the main results of this study and the positive impact of counter rotating turbines compared to single turbine performance for floating conditions. Figure 1: The Twinfloat® concept (© Nenuphar)
Transcript of EFFICIENCY IMPROVEMENT OF VERTICAL AXIS … 2016 * Presenting author EFFICIENCY IMPROVEMENT OF...

EWEA 2016
* Presenting author
EFFICIENCY IMPROVEMENT OF VERTICAL-AXIS WIND TURBINES WITH COUNTER-ROTATING LAY-OUT
Nicolas Parneix*, Rosalie Fuchs, Alexandre Immas, Frédéric Silvert Nenuphar, Campus de l’Institut Pasteur de Lille, 1, rue du Professeur Calmette, 59000 Lille, France, www.nenuphar-wind.com Paul Deglaire ADWEN, 60 Avenue du Général de Gaulle, 92800 Puteaux, http://www.adwenoffshore.com/
1 Introduction
Improving the performance of Vertical Axis Wind Turbines (VAWTs) is key to make VAWTs commercially successful. Scientists have investigated several interesting concepts for that purpose: increasing the swept area, especially to limit the losses due to 3D effects, or using flap and pitch systems to control the flow around the blades [1, 2]. Nenuphar, with the Twinfloat concept (see Figure 1), propose to take advantage of all these concepts combined with an aerodynamic effect called counter-rotating effect [3]. The turbine is made of two 2.5MW VAWT on only one floater, to reach a rated power of 5MW. The proximity of the two rotors generates a contraction of the streamtubes that flow in the area between the rotors, thus increasing the air flow rate going through both the swept areas and thereby the performance of the VAWT. This concept has also other advantages: smaller rotors that make easier their fabrication, their installation and Operating and Maintenance (O&M) operations, floater motions reduction thanks to specific control laws and wake reduction leading to an increase in the capacity factor. Simulations presented in this paper are carried out by Computational Fluid Dynamics (CFD) or by a Vortex Panel Method to investigate the streamtubes contraction caused by counter-rotating wind turbines and the impact of the distance between each rotor. This paper presents the main results of this study and the positive impact of counter rotating turbines compared to single turbine performance for floating conditions.
Figure 1: The Twinfloat® concept (© Nenuphar)

EWEA 2016
2/7
2 Model, Material and methods
Based on the Twinfloat® concept (see Figure 1), simulations are carried out to investigate the physical flow around one or two wind turbines, with various distances between the two wind turbines axes. To study the benefits of the counter-rotating concept compared to one VAWT, a vortex code (ARDEMA) has been developed by ADWEN OFFSHORE and NENUPHAR. To get a better modelling of the viscous effects, a CFD (Computational Fluid Dynamics) modelling strategy has also been developed by NENUPHAR. As the flow regime encountered by a typical VAWT is at relatively low speed (Mach Number M < 0.3) and a Reynolds number in the range 1e5 to 1e7, both models consider incompressible flow. The main difference between the two types of calculation is the modelling of the viscous effects: they are inherently calculated in CFD simulations but are calculated using a semi-empirical model in the vortex method code.
2.1 Vortex method ARDEMA combined with a Dynamic Stall model
2.1.1 Inviscid solver
The multi-body vortex code ARDEMA [4, 5] solves the Euler equation (Eq. 2) that is the Navier-Stokes equation under the assumptions that the flow is incompressible, adiabatic and inviscid outside the boundary layer. In these conditions the mass conservation law reduces to Eq.1 and the velocity can be represented as the gradient of a scalar potential (potential flow) (Eq. 3) that satisfies the Laplace equation (Eq. 4).
∇. 𝑞 = 0 (Eq. 1) 𝜕�⃗�
𝜕𝑡+ �⃗�. ∇�⃗� = 𝑓 −
∇𝑝
𝜌
(Eq. 2)
𝑞 = ∇Φ (Eq. 3) ∇²Φ = 0 (Eq. 4)
Laplace equation is a second order linear partial differential equation, so any linear combination of independent solutions (sources, doublets, vortices) is also a solution. The potential velocity solution is found using the Source Doublet formulation with Dirichlet Boundary conditions on the surface and Kutta conditions at each section trailing edges. From potential velocity solution, the pressure is then computed using unsteady Bernoulli’s equation, leading to aerodynamic loads on the sections. ARDEMA was validated against theoretical and experimental cases [4, 5], and is continuously improved and compared to experimental and numerical data.
2.1.2 Viscous correction
The inviscid ARDEMA solver was adapted regarding dynamic stall phenomenon inherent to the complex aerodynamics involved in VAWT. A Beddoes-Leishman (BL) type dynamic stall model [6] [7] was implemented, extending the code validity domain to low TSR. The BL model is coupled with ARDEMA, using the relative velocities and angle of attacks issued from the inviscid solver as model inputs. It implements flow separation, pressure lag and friction lag depending on empirical parameters to compute viscous corrected lift and drag variables.

EWEA 2016
3/7
2.2 CFD
For this study, the CFD simulations are performed by implementing an incompressible flow regime with the commercial solver Ansys-Fluent V15, with a URANS (Unsteady Reynolds-Averaged Navier Stokes) method
and closed with a SST (Shear Stress Transport) k- Turbulence model. This model combines the capacity of
the k- model to model near wall turbulence in rotating flow, with the ability of the k- model to model the free-stream turbulence [8]. CFD 2D simulations are carried out in a horizontal plane situated at the middle of the rotor (see Figure 2).
Figure 2 : 2D model for simulations
The spatial domain (i.e. numerical wind tunnel (NWT)) is decomposed into two distinct sub-domains:
A rectangular outer zone, corresponding to the overall calculation domain, with circular openings
centered on the wind turbines rotational axes.
Circulars inner zones around each wind turbine.
The zones are separated with numerical interfaces. Figure 3 presents the main dimensions and boundary conditions of the overall domain, whereas the Figure 4 presents the blade azimuthal conventions for both wind turbines.
Figure 3 : main dimensions of the numerical wind tunnel Figure 4 : blade azimuthal conventions
Distance between the two VAWT axes
Rotor external circumference
Rotor external circumference

EWEA 2016
4/7
The mesh is composed with prisms at the boundary layers of the blades to respect the numerical criteria of Y+=1, with a growth factor of 1.25, and triangles for the rest of the domain. Finally, the mesh is composed with 1.062 x10⁶ elements. Figure 5 is a representation of the mesh.
Figure 5 : CFD mesh (5a) is the global view of the NWT domain - (5b) is a zoom around a blade - (5c) is a zoom on the prism layer around the blade
3 Results
3.1 Power gain depending on distance between the wind turbines axes
The flow expansion resulting from the blockage effect of the wind turbines is reduced with two counter-rotating wind turbines because of a forced flow as it is showed on the Figure 6.
Figure 6 : Forced flow with counter-rotating wind turbines (CFD simulations)
Colored by the non-dimensional velocity (V/V), with streamlines
Another effect of the forced flow between the two counter-rotating wind turbines is that each wind turbine extracts more energy from the wind (blue curve on Figure 8) than with only one wind turbine (red curve on Figure 8).
5a 5b 5c
EWEA 2016
5/7
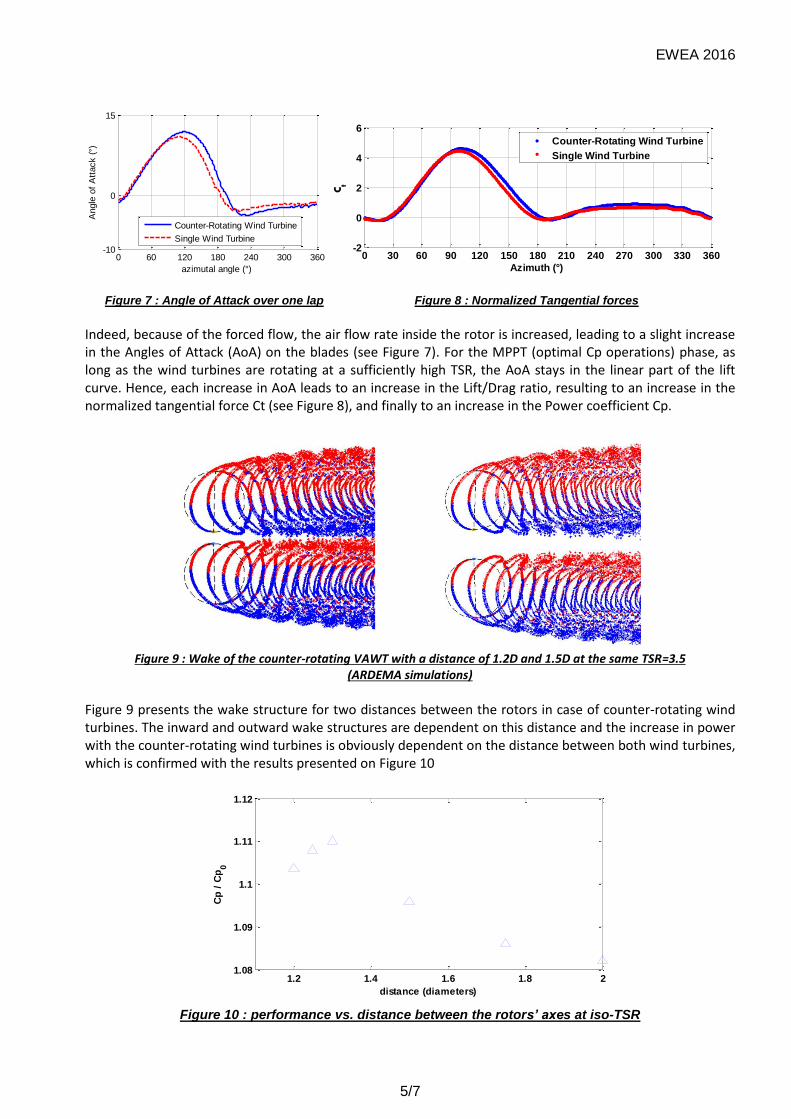
Figure 7 : Angle of Attack over one lap Figure 8 : Normalized Tangential forces
Indeed, because of the forced flow, the air flow rate inside the rotor is increased, leading to a slight increase in the Angles of Attack (AoA) on the blades (see Figure 7). For the MPPT (optimal Cp operations) phase, as long as the wind turbines are rotating at a sufficiently high TSR, the AoA stays in the linear part of the lift curve. Hence, each increase in AoA leads to an increase in the Lift/Drag ratio, resulting to an increase in the normalized tangential force Ct (see Figure 8), and finally to an increase in the Power coefficient Cp.
Figure 9 : Wake of the counter-rotating VAWT with a distance of 1.2D and 1.5D at the same TSR=3.5
(ARDEMA simulations)
Figure 9 presents the wake structure for two distances between the rotors in case of counter-rotating wind turbines. The inward and outward wake structures are dependent on this distance and the increase in power with the counter-rotating wind turbines is obviously dependent on the distance between both wind turbines, which is confirmed with the results presented on Figure 10
Figure 10 : performance vs. distance between the rotors’ axes at iso-TSR
0 60 120 180 240 300 360-10
0
15
azimutal angle (°)
Angle
of
Att
ack (
°)
Counter-Rotating Wind Turbine
Single Wind Turbine
0 30 60 90 120 150 180 210 240 270 300 330 360-2
0
2
4
6
Azimuth (°)
Ct
Counter-Rotating Wind Turbine
Single Wind Turbine
1.2 1.4 1.6 1.8 21.08
1.09
1.1
1.11
1.12
distance (diameters)
Cp
/ C
p0

EWEA 2016
6/7
Figure 11 : Cp vs. TSR curves for the single (blue) and counter-rotating (green) wind turbines
Last but not least, the optimal TSR is also increased by up to 0.4 (10% higher) with counter-rotating wind turbines, which is aerodynamically interesting as long as the operating points are moved away from dynamic stall limits.
4 Conclusion
The paper presents numerical results of two counter-rotating wind turbines with a URANS formulation and with a vortex method. It shows that both numerical tools can realistically simulate the flow around counter-rotating VAWTS. A streamtubes contraction is observed between the two wind turbines, which increases the potential of wind energy that goes through the rotors’ swept areas. A Cp increase of up to 15% at a rotor axis inter-distance of 1.2D has been computed. Further results will be presented in the full paper.
5 Learning objectives
These numerical results provide valuable information about how to increase the efficiency of VAWTs,
thus improving confidence that a next-generation of VAWTs can be designed with higher aerodynamic efficiency. This is a crucial step in order to make VAWTs competitive on the wind energy market.
The next step of this technology development will include experimental tests in a wind tunnel to
validate the numerical tools. The offshore deployment of the Twinfloat® by 2019 will also bring valuable measurements at large-scale to confirm the performance increase numerically calculated or measured on reduced-scale rotors.
3.2 3.4 3.6 3.8 4 4.2 4.4 4.6 4.8TSR
Cp0
Cp0 + 15%
EWEA 2016
7/7
References
[1] S. Ertem, Enhancing the Features of Vertical Axis Wind Turbines with Active Flap Control and Airfoil
Design, Master of Sciences Thesis, Delft University of technology, 2015 [2] B. Paillard, Numerical simulation and optimization of a crossflow axis tidal turbine with active pitch
control, PhD thesis, 2011 [3] J.O. Dabiri, Potential order-of-magnitude enhancement of wind farm power density via counter-rotating
vertical-axis wind turbine arrays, J. Renew. Sust. Energy 3 (2011), 043104. [4] P Deglaire, Analytical aerodynamic simulation tools for vertical axis wind turbines, PhD thesis Uppsala
University 2010 [5] B.A.Sc, K. R. Dixon, The near wake structure of a Vertical Axis Wind Turbine, Delft University of
Technology, Master of thesis, 2008 [6] Leishman, J. G., and T. S. Beddoes, A generalised model for airfoil unsteady aerodynamic behaviour and
dynamic stall using the indicial method, Proceedings of the 42nd Annual forum of the American Helicopter Society, Washington DC, 1986
[7] Beaudet, Laurent, Etude expérimentale et numérique du décrochage dynamique sur une éolienne à axe
vertical de forte solidité, Diss. Université de Poitiers, 2014 (French) [8] Ansys Fluent Theory Guide. Release 15.0, November 2013