EFFICIENCY IMPROVEMENT BY ASSET … No 99/Amit... · the topic “Efficiency Improvement by Asset...
91
Summer Internship Report on EFFICIENCY IMPROVEMENT BY ASSET OPTIMIZATION PROGRAM AND STRENGTHENING OPERATION AND MAINTENANCE PRACTICES OF COAL BASED THERMAL POWER PLANT Under the Guidance of Dr. Manisha Rani Senior Fellow, NPTI, Faridabad & Mr. Bimalendu Mohapatra AGM, Asset Optimization Sterlite Energy Limited (IPP), Jharsugda At STERLITE ENERGY LIMITED, Jharsugda Submitted by : Amit Pramanik MBA (Power Management) Roll No. : 1031220 Sector-33, Faridabad, Haryana-121003 (Under the Ministry of Power, Govt. of India) Affiliated to Maharshi Dayananda University, Rohatak, Haryana AUGUST 2013
Transcript of EFFICIENCY IMPROVEMENT BY ASSET … No 99/Amit... · the topic “Efficiency Improvement by Asset...
Summer Internship Report
on
EFFICIENCY IMPROVEMENT BY ASSET OPTIMIZATION
PROGRAM AND STRENGTHENING OPERATION AND
MAINTENANCE PRACTICES OF COAL BASED THERMAL
POWER PLANT
Under the Guidance of
Dr. Manisha Rani
Senior Fellow, NPTI, Faridabad
&
Mr. Bimalendu Mohapatra
AGM, Asset Optimization
Sterlite Energy Limited (IPP), Jharsugda
At
STERLITE ENERGY LIMITED, Jharsugda
Submitted by : Amit Pramanik
MBA (Power Management)
Roll No. : 1031220
Sector-33, Faridabad, Haryana-121003 (Under the Ministry of Power, Govt. of India)
Affiliated to
Maharshi Dayananda University, Rohatak, Haryana
AUGUST 2013
Page | ii
ACKNOWLEDGEMENT
I would like to extend warm thanks to all the people who had been associated with me
in some way or the other and helped me avail this opportunity for my summer Internship on
the topic “Efficiency Improvement by Asset Optimization Program and Strengthening
Operation and Maintenance Practices of Coal Based Thermal Power Plant”.
I acknowledge with gratitude and humanity my indebtness to my Summer Internship
Project guide Mr. Bimalendu Mohapatra, AGM (IPP)- Asset Optimization, Mr. Pinaki
Dalal, Associate Manager(IPP) and the Technical Team for providing me excellent guidance,
material and motivation under whom I completed my summer internship at Sterlite Energy
Limited.
I would like to thank Mrs. Manju Mam, Deputy Director, NPTI Faridabad for her
support and guidance throughout the project duration.
I would like to thank Mr. S.K. Choudhary, Principal Director (CAMPS) and my
project guide Dr. Manisha Rani, Senior Fellow, NPTI Faridabad who always assisted me in
every possible manner.
Amit Pramanik
Summer Intern
NPTI, Faridabad
Page | iii
DECLARATION
I, Amit Pramanik, Roll No. 99, student of 3rd
semester MBA (Power Management)
of the National Power Training Institute, Faridabad, hereby declare that the Summer
Internship Report entitled “Efficiency Improvement by Asset Optimization Program and
Strengthening Operation and Maintenance Practices of Coal Based Thermal Power Plant”
is an original work and the same has not been submitted to any other institute for the award of
any other degree.
A seminar presentation of the training report was made on 2nd
September, 2013 and
the suggestions approved by the faculty were duly incorporated.
Presentation In-charge
(Faculty)
Signature of the Candidate
(AMIT PRAMANIK)
Counter Signed
Director/ Principal of the Institute
Page | iv
EXECUTIVE SUMMERY
This report is result of efforts to understand key performance indices in Thermal
Power Plant & an attempt to improve them as a student of NPTI during a summer internship
project. Following paragraphs outline summary of background, analysis & recommendations
of the study.
Considering the demand for power in India, commissioning new plants at
approximately Rs. four billion per MW could prove a costly proposition, at this juncture as
the simpler solution of making considerable amount of power available through energy
efficiency improvement, could be an attractive option. In fact, one percent efficiency
improvement would render a reduction of about 3% coal consumption and a consequent
emission reduction as well. India has an installed capacity of 211 766MW (as on January 31,
2013) of which the Thermal share is 141714MW (66%). It is worth considering that even a
1% reduction in auxiliary power consumption from the existing levels would yield 9900MU
of energy annually, worth Rs. 29700 Crs (@ Rs.3 / KWh).
Coal-based thermal power stations are the leaders in electricity generation in India.
This study basically deals with analyzing two of many vital parameters of thermal power
plant – Station heat rate & auxiliary power consumption. These parameters vary widely
across plants and regions, but remain within a wide range, indicating a substantial scope for
increasing thermal power generation in the country, with improved application of existing
technology and without employment of additional resources. The western region is
technically more efficient than other regions and young plants are more efficient than their
old counterparts. We hope that the findings will prove useful to management in devising
appropriate strategies to improve station heat rate and auxiliary power consumption and
altogether generation as a whole.
In this context it becomes imperative to assess the performance and efficiency of coal
based thermal power plant in India. The power plant is considered inefficient if the plants
existing resources or inputs are utilize sub optimally as a consequence of which plants power
generation is less than its potential or maximum possible generation.

Page | v
This report analyze as the key performance index (KPI) of Independent Power Plant
(IPP) of Sterlite Energy Limited (SEL) specially concentrating on station heat rate (SHR).
The report also takes stock of in house asset optimization program of SEL named
„AROHAN‟. This asset optimization program aims to achieve not only synergies of energy
efficiency but overall optimization of organizations tangible as well as intangible assets.
Optimizing assets of the organization not only supports exponential business growth but also
provides congenial work atmosphere. It also helps and designing frame work for various
regulatory and safety compliance and engaging employs for proactive initiative.
It is observed that improving performance of power plants through interventions
aimed at strengthening O&M practices, coupled with required rehabilitation and life
extension interventions is perhaps the quickest and least cost alternative for augmenting
availability of power in the Indian context. It is estimated that the availability of power in the
country can be enhanced by more than 17 percent (as against peak energy deficit of 9
percent) if all the available generation units can be utilized at an average PLF similar to
NTPC units through rehabilitation combined with better O&M practices. Although such high
levels of performance may be difficult to achieve throughout the country. The potential
benefits of focusing on improved power plant performance are clearly immense. Improved
O&M practices are also necessary to sustain the performance of rehabilitated power plants as
well as new power plants. Government of India initiatives in this regard (Perform Archive
and Trade (PAT) Program) also amply demonstrates the potential operational as well as
financial benefits.

Page | vi
LIST OF FIGURE
Figure 1: Organization Structure .................................................................................................... 5
Figure 2: Independent Power Plant Project ..................................................................................... 7
Figure 3: The Growth of power generation in various FYP ............................................................ 9
Figure 4: Power Generation Mix .................................................................................................. 10
Figure 5: Private participation in Power Generation and its increasing trend ................................. 11
Figure 6: Plant Load Factor Trends .............................................................................................. 11
Figure 7: PLF comparison of different sectors .............................................................................. 12
Figure 8: Research Methodology ................................................................................................. 20
Figure 9: Monthly Trends of SHR................................................................................................ 21
Figure 10: Fishbone Diagram of Station Heat Rate....................................................................... 22
Figure 11: Fishbone Diagram of Dry Flue Gas Loss ..................................................................... 23
Figure 12: Fishbone Diagram of Vaccum Pressure ....................................................................... 23
Figure 13: Uncontrollable Parameter............................................................................................ 25
Figure 14: Controllable Parameter ............................................................................................... 26
Figure 15: Super Heater Spray Boxplot ........................................................................................ 27
Figure 16: Reheater Heater Spray Boxplot ................................................................................... 28
Figure 17: Makeup Flow Boxplot ................................................................................................ 29
Figure 18: Asset Optimization Framework ................................................................................... 31
Figure 19: Logo of Arohan-Passion ............................................................................................. 32
Figure 20: DMAIC Steps ............................................................................................................. 32
Figure 22: DMAIC Status Report on PLF .................................................................................... 34
Figure 21: Plant Load Factor Trends ............................................................................................ 34
Figure 23: Specific Oil Consumption ........................................................................................... 35
Figure 24: DMAIC Status of Specific Oil Consumption ............................................................... 36
Figure 25: Trends of Station Heat Rate ........................................................................................ 37
Figure 26: DMAIC Status of Station Heat Rate ............................................................................ 37
Figure 27: Trends of APC ............................................................................................................ 38
Figure 28: DMAIC Status of Auxiliary Power Consumption ........................................................ 39
Figure 29: Trends of Critical Equipment Availability ................................................................... 40
Figure 30: Status Report for Critical Equipment Availability ....................................................... 40
Figure 31: Trends of Station Availability ..................................................................................... 41
Figure 32: Spider Diagram of Process Management ..................................................................... 41
Figure 33: Diagram of Process Management ................................................................................ 44
Figure 34: Performance Diagram of Process Management ........................................................... 45
Figure 35: Enablers and Results of Process Management ............................................................. 46
Figure 36: SHR Deviation in Private Sector Power Plant ............................................................. 50
Figure 37: Perf Improvement Program ......................................................................................... 52
Figure 38: Content Framework of a typical power plant knowledge management platform ........... 59
Figure 39: Proactive Maintenance Management System ............................................................... 61
Figure 40: Maintenance Process Enhancement Steps.................................................................... 62

Page | vii
LIST OF TABLES
Table 1: The energy demand and gap in the year 2012-13 ............................................................ 13
Table 2: Manpower requirement during the 12th FYP .................................................................. 14
Table 3: SHR Affecting Parameter ............................................................................................... 24
Table 4: Controllable and Uncontrollable Parameter .................................................................... 25
Table 5: Auxiliary Power Consumption13 ................................................................................... 38

Page | viii
ABBREVIATION
AO Asset Optimization
CAMPS Centre for Advance Management and Power Studies
CEA Central Electricity Authority
CPP Captive Power Plant
CERC Central Electricity Regulatory Commission
DMAIC Define Measure Analysis Improve & Control
IPP Independent Power Producers
KPI Key Performance Index
MW Mega Watt
PM Performance Management
NPTI National Power Training Institute
NTPC National Thermal Power Corporation
PAF Plant Availability Factor
CBM Computer Based Monitoring
PLF Plant Load Factor
CAPA Corrective Action & Preventive Maintenance
PSP Private Sector Participating
RES Renewable Energy Resource
O&M Operation & Maintenance
GDP Gross Domestic Product
CMMS Computerized Material Management System
VED Vital essential and desirable
VFD Variable frequency device
BFP Boiler feed pump
ABC Activity based costing
KRA Key result area
GOI Government of India
SHR Station heat rate
BOP Balance of plant

Page | ix
PIP Performance
R&M Renovation & modernization
SWAS Steam and water analysis system
C&I Control and Instrumentation
MIS Management Information system
MPD Maintenance Planning Department
FMEA Failure Mode & Affect Analysis
UI Unscheduled Interchange
ABT Availability Based Tariff
ERP Enterprise Resource planning
DCS Digital Control System
QA Quality Assurance
FD Forced Drought
PA Primary Air
CEP Condensate Extract Pump
ACW Auxiliary Cooling Water
MCW Make Up Cooling Water
CT Cooling Tower
CHP Coal Handling Plant
AC Air Consumption
APC Auxiliary Power Consumption

Page | x
CONTENTS
1. ORGANIZATION PROFILE ............................................................................................... 1
1.1 Introduction ................................................................................................................... 1
1.2 Problem Statement......................................................................................................... 2
1.3 Objective ....................................................................................................................... 3
1.4 Scope ............................................................................................................................ 3
1.5 Company Profile............................................................................................................ 4
1.5.1 About Sterlite Energy Limited (SEL) ................................................................ 5
1.5.2 Jharsugda Power Project .................................................................................... 6
2. REVIEW OF INDIAN POWER GENERATION SECTOR................................................ 8
2.1 Indian Economy & Power Requirement ......................................................................... 8
2.2 Power Generation in India ............................................................................................. 8
2.3 Growth In Capacity Addition Since 6th FYP ................................................................... 9
2.3.1 Trend in Type Installed Capacity Dominance of Thermal ................................... 9
2.3.2 Public Vs Private Sector Increasing Role of Private Sector ............................... 10
2.3.3 Performance Trends: PAF/PLF/Efficiency ....................................................... 11
2.3.4 Trends in Demand Supply Gap......................................................................... 12
2.3.5 Increasing Shortage of Skilled Workforce ........................................................ 13
2.3.6 Changes in Technology And Increasing Foreign Suppliers ............................... 14
2.4 Emerging Needs of Generation Sector ......................................................................... 15
2.5 Introduction To A Potential Solution ........................................................................... 16
3. EFFICIENCY IMPROVEMENT ....................................................................................... 17
3.1 Introduction ................................................................................................................. 17
3.2 Station Heat Rate (SHR) .............................................................................................. 18
3.2.1 The New Scenario ............................................................................................ 18
3.2.2 Cost of Generation ........................................................................................... 18
3.2.3 Heat Rate ......................................................................................................... 19
3.2.4 Research Methodology..................................................................................... 20
3.2.5 Present Trends of Station Heat Rate (SHR) ...................................................... 21
3.2.6 Cause And Effect Analysis............................................................................... 21
3.2.7 SHR Affecting Parameter ................................................................................. 24
3.2.8 Uncontrollable Parameter ................................................................................. 25
3.2.9 Controllable Parameter..................................................................................... 26

Page | xi
4. ASSET OPTIMIZATION ................................................................................................... 30
4.1 Introduction ................................................................................................................. 30
4.2 What is Asset Optimization? ........................................................................................ 30
4.3 Needs of Asset Optimization ....................................................................................... 30
4.4 Asset Optimization Framework.................................................................................... 31
4.4.1 DMAIC Project Manager ................................................................................. 32
4.4.2 Key Performance Index of Asset Optimization ................................................. 33
4.4.3 Process Management ....................................................................................... 41
4.4.4 Enablers ........................................................................................................... 43
5. STRENGTHENING O & M PRACTICES IN COAL FIRED POWER GENERATION
PLANT IN INDIA ............................................................................................................... 47
5.1 Introduction ................................................................................................................. 47
5.2 Background ................................................................................................................. 49
5.2.1 Sector Background ........................................................................................... 49
5.2.2 The Plant Load Factor (PLF) ............................................................................ 49
5.3 Key Technical Problem area of O&M Practices in India .............................................. 50
5.4 Developing and Implementing a Performance Improvement Programme ...................... 51
5.5 Enhancement of Operational Practices ......................................................................... 52
5.6 Enhancement of Plant Maintenance Practices............................................................... 59
5.7 Generation Planning and Plant Level Budgeting .......................................................... 63
5.7.1 Existing practices in Generation Planning and Plant Level Budgeting ............... 64
5.7.2 Generation Planning and Transition Steps ........................................................ 66
5.7.3 Plant Level Budgeting and Transition Steps ..................................................... 67
5.8 Management Information Systems ............................................................................... 68
5.8.1 Transition Steps for a Strengthening MIS Framework ...................................... 69
5.9 Purchase & Stores ....................................................................................................... 70
5.9.1 Transition Steps for a Strengthening Purchase and Stores ................................. 71
5.10 Indicative Action Plan for Strengthening O&M Practices ............................................. 72
6. CONCLUSION & RECOMMENDATION ........................................................................ 76
ANNEXURE-I ........................................................................................................................... 77
„5-S‟ Work Place Management ............................................................................................. 77
ANNEXURE-II .......................................................................................................................... 79
BIBLIOGRAPHY ...................................................................................................................... 80

Page | 1
1. ORGANIZATION PROFILE
1.1 INTRODUCTION
This report aims to give an overview of status of efficiency improvement
initiatives undertaken in Vedanta Aluminium Ltd.
The Indian economy has experienced unprecedented economic growth over
the last decade. Today, India is the fourth largest economy in the world, driven by a
real GDP growth of above 6% in the last 5 years (7.5% over the last 10 years). In
2011 itself, the real GDP growth of India was 5th highest in the world, next only to
Qatar, Paraguay, Singapore and Taiwan.
Sustained growth in economy comes with growth from all sectors, among
which growth in infrastructure sector is a key requirement for growth in sectors with
in manufacturing and services. Within infrastructure, growth in power sector is one of
the most important requirements for sustained growth of a developing economy like
India.
Government utility companies, with only three major private sector generation
and distribution companies, traditionally ran the Indian electric power sector until the
mid1990s. Since then the Indian government has pursued a policy of deregulation by
opening it to private sector investment and separating generation from transmission
and distribution of electricity. While there were many goals, a primary objective of
this policy was to ensure a reliable supply of electricity to consumers at affordable
prices.
Deregulation was intended to reduce or eliminate the electricity deficit,
improve the financial performance of the State Electricity Boards (SEBs), and reduce
the government‟s outlay for construction of new electricity supply and subsidies.
After almost two decades of reforms, however, the supply and demand gap of
electricity widened over the years. In 1990-91, the electrical energy deficit was
around 7.7%, and by 2008-09 it grew to 11.1%. The peak power deficit, however,
reportedly declined from around 18% in 1990-91 to 11.9% by 2008-09 (CEA, 2009).

Page | 2
India faces formidable challenges in meeting its energy needs and providing
adequate energy of desired quality in various forms to users in a sustainable manner
and at reasonable costs. India needs to sustain 8% to 10% economic growth to
eradicate poverty and meet its economic & human development goals. Such economic
growth would call for increased demand for energy and ensuring access to clean,
convenient and reliable energy for all to address human development. To deliver a
sustained growth of 8% through 2031, India would, in the very least, need to grow its
primary energy supply by 3 to 4times and electricity supply by 5 to 7 times of today‟s
consumption.
By 2031-32 power generation capacity would have to increase to 778095MW
and annual coal requirement would be 2040mt, if we don‟t take any measures to
reduce requirement. Along with quantity the quality of energy supply has to also
improve. The energy challenge is of fundamental importance to India‟s economic
growth imperatives.
Energy Efficiency could provide the quickest, cheapest and most direct way to
turn these challenges into real opportunities. Rapid growth of any economy requires
huge quantum of energy resources.
India has an installed capacity of 211 766MW (as on January 31, 2013) of
which the Thermal share is 1,41,714MW (66%). It is worth considering that even a
1% reduction in auxiliary power consumption from the existing levels would yield
9900MU of energy annually, worth Rs. 29700 Crs (@ Rs.3 / KWh).
Improving energy efficiency can have many benefits; some of them are as
follows:
A. Meeting global emission reduction targets
B. Meeting global energy saving commitments
C. Ensuring sustainable economic growth
1.2 PROBLEM STATEMENT
Unprecedented fuel hike and importance of equipment‟s life assessment and
subsequent extension have become extremely important concerns for thermal power
stations. Present work is aimed at energy conservation in thermal power plants and

Page | 3
also focusing on increasing the life of boiler components by conducting heat transfer
analysis. Energy conservation in thermal power plant can be done by:
Decreasing energy input i.e. coal input by better combustion efficiency.
Efficient heat utilization
For this purpose, heat transfer analysis of a thermal power station was quite
necessary and this is done by taking a reference unit and doing studies along with the
energy audit team. Most of the Indian thermal power stations are producing power at
very high heat rate at one hand and falling in preventing the life deteriorating
conditions on the other hand. Exhaustive studies of different parameters of a thermal
power plant will be done for efficiency improvement resulting in energy conservation.
This may result in costly fuel saving and better capacity utilisation of a reference unit.
1.3 OBJECTIVE
Efficiency Improvement of a coal based thermal power plant using Asset
Optimization and Strengthening Operation and Maintenance Practices in Coal Fired
Thermal Power Generating Station in India.
1.4 SCOPE
Efficiency Improvement of a coal based thermal power plant can be achieved
through,
Station Heat Rate Reduction
Auxiliary Power Consumption Reduction
Implementing Asset Management frame work
Basic Equipment Care
Process Management (PM) and Condition Based Monitoring (CBM)
Contractor Performance
Spare Parts Management
Budget Cost Control
Standard of Performance (SOP) Compliance
Maintenance Facility
Safety & Regulation
Goal Deployment

Page | 4
Continuous Improvement
Reward and Recognition
Organization Performance Management
Skill Development
Operation and Maintenance Practices
1.5 COMPANY PROFILE
Vedanta Aluminium Ltd is an associate company of the London Stock
Exchange listed, FTSE 100 diversified resources group Vedanta Resources Plc.
Originally incorporated in 2001, VAL is a leading producer of metallurgical grade
alumina and other aluminium products, which cater to a wide spectrum of industries.
VAL has carved out a niche for itself in the
aluminium industry with its superior product quality
based on state-of-the-art technology. The firm
operates a 1 mtpa greenfield alumina refinery and an associated 75 MW captive
power plant at Lanjigarh in the state of Orissa. Plans are afoot to increase the capacity
of the Lanjigarh refinery significantly to 5 mtpa. This is in line with VAL‟s strategy to
promote Lanjigarh as a self sustained manufacturing unit in terms of cost advantage
and resource availability.
VAL has invested in a 0.5 mtpa aluminum smelter and 1215 MW captive
power plant supported by highly modern infrastructure at Jharsuguda, Orissa. In
addition to this, construction of 1.1 mtpa aluminium smelter expansion project at
Jharsuguda is under process. The company intends to expand the fully integrated
aluminium smelting capacity to around 2.6 mtpa in near future.
Jharsuguda is also the site of the 2400 MW Independent Power Plant being set
up by group company Sterlite Energy Ltd to meet the growing demand for power
from both urban and rural consumers.
The idea of sustainable development is deeply ensconced in VAL‟s business
ethos. VAL is committed to the socio-economic transformation of local communities
residing around the plant sites and undertakes several initiatives to promote
sustainable development. The firm has focused on developing modern health

Page | 5
amenities, educational facilities for children and skill development programmes for
adults. Several other programmes have been undertaken to enhance health and
sanitation, promote livelihood generation and improve infrastructure in the villages
surrounding Jharsuguda and Lanjigarh. The firm believes that its development
initiatives will encourage a dedicated team of self motivated individuals to participate
and drive the company‟s growth in the future.
Figure 1: Organization Structure
1.5.1 ABOUT STERLITE ENERGY LIMITED (SEL)
Sterlite Energy Limited
(SEL) is a part of Vedanta
Resources plc , a London listed
FTSE 100 diversified metals and
mining major with Aluminium, Copper, Zinc and Iron ore operations in
India, Australia and Zambia, and a subsidiary of Vedanta group flagship
company, Sterlite Industries (India) Limited. SEL was established to
develop, construct and operate power plants and seeks to become one of
India‟s leading commercial power generation companies.
SEL is well positioned to capitalize on India‟s economic growth,
power deficit and large coal reserves to develop a commercial power
generation business. It shall benefit from Vedanta group‟s experienced and
focused management with strong project execution skills, experience in

Page | 6
building and operating captive power plants, substantial experience in
mining activities and the capacity to finance world-class projects.
1.5.2 JHARSUGDA POWER PROJECT
Sterlite Energy Ltd has taken a major initiative towards the
advancement of the power infrastructure in Orissa through its 4 x 600 MW
coal-based independent power plant (IPP) in Jharsuguda district. The IPP
project envisages a total capital outlay of Rs. 8,200 crores. The two units
have commenced commercial operation since November 2010 and April
2011 respectively. The project is expected to be fully commissioned in the
third quarter of Fiscal 2012.
The power plant entails a number of pioneering achievements in
the Indian power sector. Each of its four units has a capacity of 600 MW,
which makes the units the largest commissioned in India till date. One of
the largest coal handling plants to handle 44,000 MT of coal per day,
which is equivalent to 14 rakes of coal a day and a power generation
capacity to produce 57million units/day. In addition to this, a Hybrid ESP
with fabric filter is being deployed for the first time in an Indian power
plant. The plant also has a dual LP-flow steam turbine and four 160 meters
high natural draft cooling towers. Other important features of the plant
include two 275 meters high multi-flue stacks and a high concentration
slurry disposal (HCSD) system for dry ash and highly concentrated slurry.
The company has made extensive arrangements to source raw
materials for the power plant. The Hirakud Reservoir is being used as a
water source and coal- the chief raw material, is being derived from the IB
Valley coalfield. Power would be supplied to consumers through the high-
voltage power lines.
As a prime advocate of sustainable development, Sterlite Energy
Ltd. puts a premium on environmentally friendly construction technology.
The plant employs hybrid ESP and fabric filter which maintains stack
emission < 50 mg/m3 and HCSD system for ash disposal, which results in
very low consumption of water compared to wet slurry system. The
Page | 7
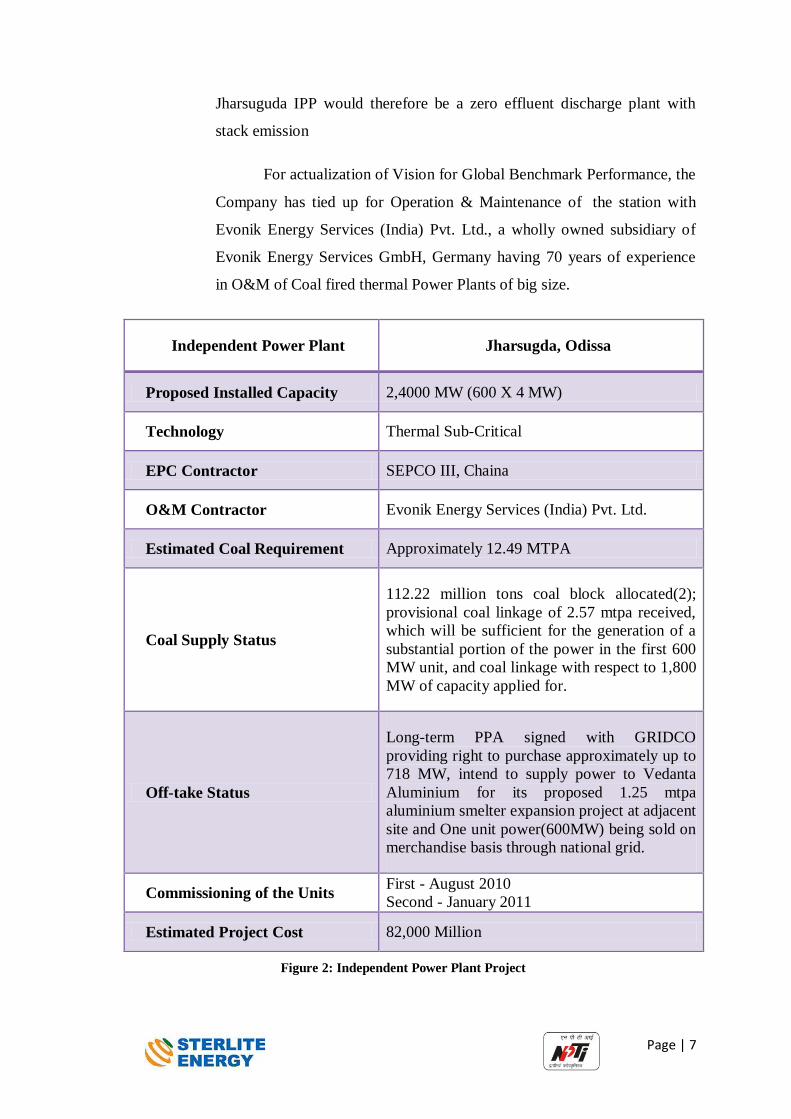
Jharsuguda IPP would therefore be a zero effluent discharge plant with
stack emission
For actualization of Vision for Global Benchmark Performance, the
Company has tied up for Operation & Maintenance of the station with
Evonik Energy Services (India) Pvt. Ltd., a wholly owned subsidiary of
Evonik Energy Services GmbH, Germany having 70 years of experience
in O&M of Coal fired thermal Power Plants of big size.
Independent Power Plant Jharsugda, Odissa
Proposed Installed Capacity 2,4000 MW (600 X 4 MW)
Technology Thermal Sub-Critical
EPC Contractor SEPCO III, Chaina
O&M Contractor Evonik Energy Services (India) Pvt. Ltd.
Estimated Coal Requirement Approximately 12.49 MTPA
Coal Supply Status
112.22 million tons coal block allocated(2);
provisional coal linkage of 2.57 mtpa received,
which will be sufficient for the generation of a
substantial portion of the power in the first 600
MW unit, and coal linkage with respect to 1,800
MW of capacity applied for.
Off-take Status
Long-term PPA signed with GRIDCO
providing right to purchase approximately up to
718 MW, intend to supply power to Vedanta
Aluminium for its proposed 1.25 mtpa
aluminium smelter expansion project at adjacent
site and One unit power(600MW) being sold on
merchandise basis through national grid.
Commissioning of the Units First - August 2010
Second - January 2011
Estimated Project Cost 82,000 Million
Figure 2: Independent Power Plant Project

Page | 8
2. REVIEW OF INDIAN POWER GENERATION
SECTOR
2.1 INDIAN ECONOMY & POWER REQUIREMENT
India experienced unprecedented economic growth of 8%1 for the last several
years. Even after factoring recent developments in global economy & local scenario,
India is likely to maintain 9%2 economic growth over 12
th FYP. These growth rates
are fairly higher than the economic growths observed in developed world and they are
likely to increase our energy requirement at even higher rate.
India is currently facing energy shortage of 8.5% and peak shortage of 10.3%3.
As per the 12th FYP, India‟s energy demand will grow 6% per annum and we would
require installed power generation capacity of about 100 Gigawatts (GW). The power
requirement, besides economic growth, is also driven by Government‟s aim to
provide “power for all”.
Given the above scenario, it is becoming increasingly important for India to
operate existing generation assets at peak of their capacity besides new capacity
additions. A number of plants today are running at sub-optimal plant load factor
(PLF) levels due to various issues like fuel shortages, unplanned shut-down due to
poor maintenance and time taken to rectify the problems. While, we have observed
improvements in Plant Load Factor (PLF) of generating plants (from 57.1% in year
1992-93 to 75.1% in year 2010-114), still there is significant improvement possible.
2.2 POWER GENERATION IN INDIA
The capacity addition during the 11th five year plan FYP has been the highest
till date in any FYP. As on 31st March 2012 the total generation stood at 199877.03
MW5 as per the CEA report. The details of this generation capacity based on type of
generation capacity and ownership of generation capacity is outlined in the following
diagram.
1 Report of the working group on power for 12th plan 2 Report of the working group on power for 12th plan 3 National Electricity Plan (volume 1) Generation Report, January 2012 4 CEA: Operation performance of generating stations in the country during the year 2010-11. 5 CEA: Growth of installed capacity since 6th FYP.

Page | 9
2.3 Growth in Capacity Addition Since 6th
FYP
Plan/Year Thermal
Nuclear Hydro RES Total Coal Gas Diesel Total
End of 6th
FYP 26311 542 177 27030 1095 14460 0 42585
End of 7th
FYP 41237 2343 165 43745 1565 18308 18 63636
End of 8th
FYP 54154 6562 294 61010 2225 21658 902 85795
End of 9th
FYP 62131 11163 1135 74429 2720 26269 1628 105046
End of
10th
FYP 71121 13699 2102 86915 3900 34654 7761 132330
End of
11th
FYP 112022 18381 1200 131603 4780 38990 24503 199877
Figure 3: The Growth of power generation in various FYP
Further analysis of Indian power generation sector over a period of time
reveals following fundamental trends:
2.3.1 Trend in Type Installed Capacity Dominance of Thermal
Thermal power plants comprised nearly 66.9 % of its generation
capacity as on 31st January 2013
6. In the 11
th FYP also the thermal capacity
addition (coal + gas + diesel) was the highest of around 141713.68 MW. This
indicates that thermal power generation has been a dominant source of
electricity.
In the near future, about 100 GW of generation capacity is expected to
be added in 12th
FYP and out of this 63781MW is thermal generation capacity.
This dominance of the thermal power plants will continue in the electrical
power sector.
6 CEA: Annual Report 2011-12, Growth of installed capacity since 6th FYP.

Page | 10
Figure 4: Power Generation Mix
2.3.2 Public Vs Private Sector Increasing Role of Private Sector
Indian economy in general and power sector in particular has seen
liberalization and implementation of enabling framework to allow private
sector participation. The key developments which encouraged private sector
participation in power generation are a) de-licensing of power generation in
Electricity Act 2003, b) competitive bidding framework for power
procurement c) Open access & framework for power trading/power exchanges
d) escrow mechanism for addressing of credit risks in power generation etc.
All these factors have lead to significant interest of private sector in power
generation.
Following chart depicts growth of private sector in power generation space7.
7 MoP: Report of The Working Group on Power for Twelfth Plan (2012-17).
20%
2%
12%
66%
Generation MW
Hydro Nuclear RES Thermal

Page | 11
The private sector accounted for only 14 % of the total installed
capacity as of March 2008. Presently, the private partnership in generation
has increased to 29.49% (January 2013)8. The private sector accounts for
62,459.24 MW of generation capacity out of 211766.22 MW.
2.3.3 Performance Trends: PAF/PLF/Efficiency
Historically, performance of the power plants in India has been poor in
terms of plant availability (PAF), generation (PLF) and efficiency terms.
Recent trends indicate improvement in performance with average PLF of
70.76% in FY12-13 from 57.1% in FY 91-929.
8 CEA: January,2013 report of Installed capacity of all utilities across the country. 9 CEA: Operation performance of generating stations in the country during the year 2010-11.
Figure 5: Private participation in Power Generation and its increasing trend
1934.8
16227
42131
10th FYP 11th FYP 12th FYP proposed
Generation addition in Private Sector
31%
40%
29%
Installed Capacity (January 2013)
Center State Private
65.00%
70.00%
75.00%
80.00%
Average PLF
Average PLF
Figure 6: Plant Load Factor Trends

Page | 12
Though the performance appears to be improving, a detailed analysis
reveals that improvement is mainly driven by increasing private sector
participation and improved performance of the central sector plants. However,
the power plants under the state sector lag behind these two significantly. The
sector wise PLF data10 (as on April, 2012) from CEA indicates following:
As indicated in the above chart, the state sector plants are operating at
very low load factors. The state sector currently accounts for 43 % of the total
installed capacity. This indicates that even a 5% improvement in state sector
plant utilization would add generation equivalent to 4300 MW of capacity.
The plant utilization can be improved through improved availability of plants.
This would require proactive maintenance practices to bring down
unscheduled breakdown of the equipments, thereby increasing the plant
availability. Thus increasing the plant availability will help in increasing the
plant utilization and so its generation.
2.3.4 Trends in Demand Supply Gap
As per CEA report the energy availability in the country has increased
by 5.6% in 2010-11, while the peak demand met has increased by 6% during
the same period. Despite the increase in availability, India faced an energy
10 CEA report : All India plant load factor ( % ) during apr.12
76.68
69.31
81.47
72.53
82.21
71.67
82.13
75.21
Centre State Private All india
Plant Load Factor (PLF) april 2012
Projected Achieved
Figure 7: PLF comparison of different sectors

Page | 13
deficit of 8.5% and a peak deficit of 10.3% in 2010-11. In 2009-10 energy
deficit was 11% and peak demand deficit was 11.9%. It is expected that the
energy deficit and peak deficit will rise to 10% and 13% respectively in 2011-
1211.
The assessment of the anticipated power supply position in the Country
during the year 2011-12 has been made taking into consideration the power
availability from various stations in operation and fuel availability. Forecast of
power requirement and deficit for year 2012-1312:
Table 1: The energy demand and gap in the year 2012-13
Energy Demand Peak Demand
Requirement Availability Deficit Demand Met Deficit
MU MU % MW MW %
Total 998114 911209 8.7 135453 123294 9.0
The above data indicates that we will continue to face energy shortages
for foreseeable future.
2.3.5 Increasing shortage of skilled workforce
With the acceleration in growth of the generation sector there is an
increase in the manpower requirement every year. It was estimated that a total
of 5,10,000 additional manpower would be required for Construction,
Operation and Maintenance of capacity being implemented in the 12th Plan.
Category Construction Operation & Maintenance (Including
7.5% recoupment)
Engineers 2500 45000
Supervisors 3500 80000
Skilled Workers 7000 80000
Semi-skilled Workers 7000 60000
Unskilled Workers 12000 80000
11 CEA annual report 2010-11, Load Generation Balance Report 2011-12 12 Load Generation Balance Report 2012-13

Page | 14
Non-Tech 8000 125000
Total 40,000 4,70,000
Table 2: Manpower requirement during the 12th FYP
To address the issue of Shortage of skilled and trained manpower, an
Adopt an ITI scheme was launched in July 2007 under which project
developers and contractors were asked to adopt it is in the vicinity of their
project sites. Many PSUs and private developers have since adopted it is.
As it can be observed from CEA/MoP estimates, the training &
education infrastructure of India is not likely to cope up to the requirement. To
add to this, it is also observed that the manpower available (both skilled &
semiskilled) lacks the skills & experience required13.
Overall, above two factors (a) Lack of availability of educated/trained
manpower and (b) shortage of skills & experience within available manpower
has lead to higher demand of skilled & experienced personnel. This also is
evident from the attrition rates observed in power sector entities in recent
times14. It is also observed that this organization in the power sector have not
observed such high attrition rates historically & hence not fully equipped to
respond to such challenges. This has also lead to increase in O & M cost for
certain power plants – especially small & medium size power plants. Typical
response chosen by small organizations has been to conduct anticipatory
recruitment to match the attrition, leading to either cost increases or
deterioration of performance.
2.3.6 Changes in technology and increasing foreign suppliers
Though the fundamental principles of power generation have remained
same, technological advancements have lead to supercritical and ultra
supercritical plants with higher temperatures & pressures. Besides these, new
technologies like fluidized bed combustion (AFBC/CFBC/PFBC) are evolving
& getting higher acceptance across the globe. In India, we had our no plants
13 Working group on power report, Tata Strategic Management Report 14 Indian Express article: Power sector faces higher attrition, Dated:12th June, 2012

Page | 15
with such technology till 10th FYP and today, we are seeing that significant
number of plants being built on such advanced technologies. This also poses
a challenge to present workforce to adapt to these changes so quickly,
increasing importance of mid-career trainings & skills up gradation. .
Foreign suppliers mainly Chinese have also increased focus on the
Indian power market due to various factors. All These factors have increased
the need of more professional and skilled personnel. Deployment of skilled
foreign personnel is also important to ensure necessary skills transfer to local
workforce.
We have seen six fundamental trends that are shaping the power
generation sector: a) Dominance of thermal in power generation capacity b)
increasing private sector participation c) Demand Supply Gaps d) Need for
improvement in plant utilization factors e) Increasing shortage of skilled
workforce and f) Chancing technology and increasing foreign suppliers. These
trends are leading to certain requirements for power generation which are
outlined below.
2.4 Emerging Needs of Generation Sector
All above six trends, collectively, indicate that it is imperative for India to
focus on improved asset utilization for existing and upcoming power generation
assets. This would require right O & M practices & expertise. It would be increasingly
important for power generators to
i) Improve plant availability & utilization
ii) Improve efficiency of power generation
iii) Reduce Station Heat Rate
iv) Operation and Maintenance Practices
v) Bring down cost of power generation.
In today‟s competitive markets prices are generally set by market condition. In this
context, power generators have to compete with each other in the market. Industry
would need to learn to cope with this competitive pressure. This implies need for
focusing on efficient operations as the key to profitability. Operation and Maintenance

Page | 16
cost has a direct reflection on the cost of generation and hence there is need to
optimize the same.
2.5 Introduction to a Potential Solution
The requirements of the sector outlined in chapter combined with the
challenges posed by trends analysed above, indicate that we need a solution which can
enable a) harnessing private sector efficiencies, b) maintenance and service delivery
with focus on life cycle costs, c) create opportunities to bring in innovation and
technological improvements and d) enable affordable and improved services to the
users in a responsible and sustainable manner.
All above points indicate to bringing in private sector participation &
competition in to the sector. Following chapter examines suitability of this idea in
Indian power generation sector, especially for the plants already commissioned under
the state GENCOs in detail.

Page | 17
3. EFFICIENCY IMPROVEMENT
3.1 Introduction
Tracking the losses can do energy conservation in a thermal Power Plant. The
tracking of losses can be done by regular energy audit of the TPP. Energy audit
focuses on gray areas. Losses may be controllable or uncontrollable. These losses
need to be identified and a time bound action plan needs to be drawn up for
minimizing such losses. Energy efficiency improvement exercise involving multi
disciplinary activities in existing power plants assume great importance.
Keeping in view of the high capital cost in newer capacity addition,
Sethi(1986) suggested improvement in energy efficiency during conversion from heat
to electricity is one of the potential areas for energy saving. Energy audit will thus go
a long way in improving energy efficiency of existing plants. This requires check on
fuel consumption, auxiliary power consumption, heat rate and heat balance of thermal
systems. There is need of introducing of practice of periodic in house performance
testing of existing plants for determining fuel consumption, boiler efficiency and
turbine heat rate.
National Productivity Council (1994) suggested the following objectives in
Operation & Maintenance (O&M) which may result in achieving the desired
improvements in energy efficiency.
Monitoring Station Heat Rate
Monitoring fuels consumption
Monitoring auxiliary power consumption
Monitoring parameters with respect to design condition
Plugging leakage
Operating efficient units in merit order
Identifying negative impacts on energy efficiency
Preparing for crisis management

Page | 18
3.2 Station Heat Rate (SHR)
Station Heat Rate (SHR) is an important factor to assess the efficiency of a
thermal power station. Efficiency of TPS is a function of station heat rate and it is
inversely proportional to SHR. If SHR reduces, efficiency increases, resulting in fuel
saving. Station heat rate improvement also helps in reducing pollution from TPS. In
this direction, Performance Evaluation Division of CEA had devised a Performa to
monitor the various parameters of efficiency of thermal power stations. On
monitoring, the data of station heat rate parameters had been received. The data of
operating station heat rate parameters so received have been compiled & analysed for
instituting an incentive scheme on Improved Station Heat Rate (SHR) and have been
compared with design SHR of the IPP. The analysis of Station Heat Rate parameters
as given below has been carried out broadly in two categories of the stations with
SHR variation between (a) Controllable Parameter (b) Uncontrollable Parameter
categories have been considered as efficient. All the unit analysed have used coal as
primary fuel to generate power and oil as secondary fuel for starting purposes. The
analysis has been carried out on the unit basis.
3.2.1 The New Scenario
After the Indian Electricity Act 2003 introduce the competition in
power sector. This new competitive scenario, power station must faces,
To reduce the generating cost
To maintain high availability, efficiency and operational flexibility
To meet strict environmental condition
To manage and extend the equipment life including system
modernization
3.2.2 Cost of Generation
The cost of electricity generation is depends upon two types of cost,
one is the fixed cost another is the variable cost. The company wants to
increase their net profit. The company main aim should be reduce the
generation cost. Most of the generation cost is the variable cost. So the
company concentrated on the reduction of variable cost. The overall variable

Page | 19
cost components are the plant availability factor, station heat rate, specific fuel
oil consumption, auxiliary power consumption. The variable cost decides the
competitiveness of the electric units in a generating pool. The unit fuel cost is
the approximately 70% of the total unit variable cost. The main fuel cost
component is the station heat rate (kcal/kWh). To reduce the variable cost
through the heat rate improvement of a coal based electricity generating unit.
3.2.3 Heat Rate
"Heat Rate" is a broad measure of thermal efficiency of a power plant
in the conversion of fuel into electricity. It measures the amount of heat input
in kilo-calories per hour for each kilowatt-hour of electricity produced.
“Unit Heat Rate” is a measurement of electricity generating unit heat
rate factor. This is also effective for the efficiency improvement of a power
plant. The formulae of measuring unit heat rate is,
𝑈𝑛𝑖𝑡 𝐻𝑒𝑎𝑡 𝑅𝑎𝑡𝑒 𝑈𝐻𝑅 =𝑇𝑢𝑟𝑏𝑖𝑛𝑒 𝐻𝑒𝑎𝑡 𝑅𝑎𝑡𝑒 (
𝑘𝑐𝑎𝑙𝑘𝑊
)
𝐵𝑜𝑖𝑙𝑒𝑟 𝐸𝑓𝑓𝑖𝑐𝑖𝑒𝑛𝑐𝑦
“Station Heat Rate” is directly measurement input and output factor of
a power plant. It measure by the following formulae.
𝑆𝑡𝑎𝑡𝑖𝑜𝑛 𝐻𝑒𝑎𝑡 𝑅𝑎𝑡𝑒 𝑆𝐻𝑅
= [𝑆𝑝𝑒𝑐𝑖𝑓𝑖𝑐 𝑐𝑜𝑎𝑙 𝑐𝑜𝑛𝑠𝑢𝑚𝑝𝑡𝑖𝑜𝑛 (𝑘𝑔
𝑘𝑊)
× 𝐺.𝐶.𝑉.𝑜𝑓 𝐶𝑜𝑎𝑙 (𝑘𝑐𝑎𝑙
𝑘𝑔)]
+ [𝑆𝑝𝑒𝑐𝑖𝑓𝑖𝑐 𝑂𝑖𝑙 𝐶𝑜𝑛𝑠𝑢𝑚𝑝𝑡𝑖𝑜𝑛(𝑚𝑙
𝑘𝑊)
× 𝐺.𝐶.𝑉.𝑜𝑓 𝑂𝑖𝑙(𝑘𝑐𝑎𝑙
𝑙𝑖𝑡)]
Where,
𝑆𝑝𝑒𝑐𝑖𝑓𝑖𝑐 𝐶𝑜𝑎𝑙 𝐶𝑜𝑛𝑠𝑢𝑚𝑝𝑡𝑖𝑜𝑛 =𝑇𝑜𝑡𝑎𝑙 𝐶𝑜𝑎𝑙 𝐶𝑜𝑛𝑠𝑢𝑚𝑝𝑡𝑖𝑜𝑛 𝑖𝑛 𝑎 𝑚𝑜𝑛𝑡 (𝑘𝑔)
𝐺𝑟𝑜𝑠𝑠 𝐺𝑒𝑛𝑒𝑟𝑎𝑡𝑖𝑜𝑛 𝑖𝑛 𝑎 𝑚𝑜𝑛𝑡 (𝑘𝑊)
Page | 20
Heat rate deviation also measure by the following formulae.
𝐻𝑒𝑎𝑡 𝑅𝑎𝑡𝑒 𝐷𝑒𝑣𝑖𝑎𝑡𝑖𝑜𝑛 % =(𝑂𝑝𝑒𝑟𝑎𝑡𝑖𝑛𝑔 𝐻𝑒𝑎𝑡 𝑅𝑎𝑡𝑒 − 𝐷𝑒𝑠𝑖𝑔𝑛 𝐻𝑒𝑎𝑡 𝑅𝑎𝑡𝑒)
𝐷𝑒𝑠𝑖𝑔𝑛 𝐻𝑒𝑎𝑡 𝑅𝑎𝑡𝑒× 100
The objective of the plant regarding SHR improvement is that to find out the
parameters which are directly effect on station heat rate. Collect the data of this
parameter and analyzing it to find out the problem area for the deviation of shr.
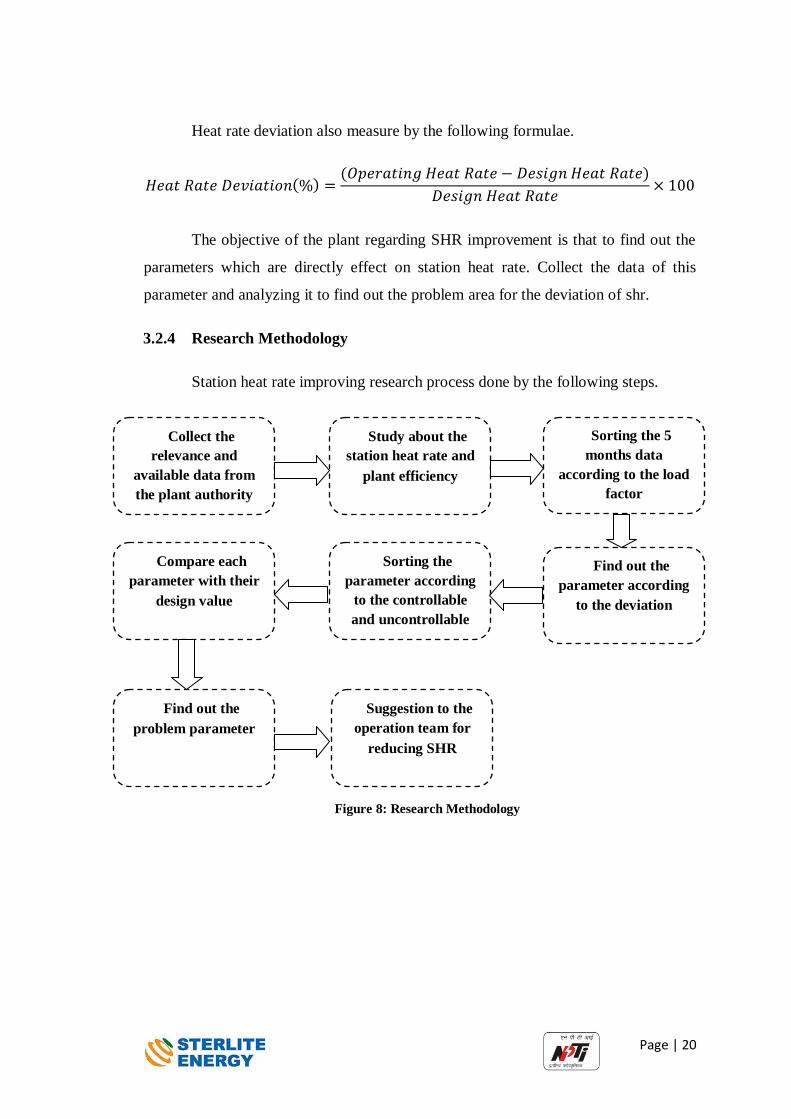
3.2.4 Research Methodology
Station heat rate improving research process done by the following steps.
Collect the
relevance and
available data from
the plant authority
Study about the
station heat rate and
plant efficiency
Sorting the 5
months data
according to the load
factor
Find out the
parameter according
to the deviation
Sorting the
parameter according
to the controllable
and uncontrollable
Compare each
parameter with their
design value
Find out the
problem parameter
Suggestion to the
operation team for
reducing SHR
Figure 8: Research Methodology

Page | 21
3.2.5 Present Trends of Station Heat Rate (SHR)
All the units of the plant are the design same station heat rate. The
design heat rate is 2257kcal/kWh for the entire unit of the plant. But all the
units can‟t maintain the design value. The last five months trends of station
heat rate are shown below figure 3-2. The trend shows that all the units SHR
are very high than the design value. So the company tries to reduce the SHR of
the plant.
3.2.6 Cause and Effect Analysis
When a typical problem, it's important to explore all of the things that
could cause it, before start to think about a solution. That way it can solve the
problem completely, first time round, rather than just addressing part of it and
having the problem run on and on.
Cause and Effect Analysis gives a useful way of doing this. This
diagram-based technique, which combines Brainstorming with a type of Mind
Map, pushes to consider all possible causes of a problem, rather than just the
ones that are most obvious.
2454
2495
2448
23472369
2424
23872374
2506
24302409
2527
2415
2522
2423
2,250
2,300
2,350
2,400
2,450
2,500
2,550
Jan'13 Feb'13 Mar'13 Apr'13 May'13
SHR Trends for Unit 1,2 &3 in (Kcal/KWh)
Unit1 unit2 unit3
Figure 9: Monthly Trends of SHR

Page | 22
Cause and Effect Analysis was originally developed as a quality
control tool, but we can use the technique just as well in other ways. For
instance, we can use it to:
Discover the root cause of a problem.
Uncover bottlenecks in your processes.
Identify where and why a process isn't working.
The fishbone diagram of the station heat rate is shown below figure 3-3,
The station heat rate also depends upon the dry flue gas and condenser vaccum
pressure. The fishbone diagram of dry flue gas is shown figure 3-4 and condenser
vaccum pressure shown figure 3-5.
Figure 10: Fishbone Diagram of Station Heat Rate

Page | 23
Figure 11: Fishbone Diagram of Dry Flue Gas Loss
Figure 12: Fishbone Diagram of Vaccum Pressure

Page | 24
3.2.7 SHR Affecting Parameter
The company SEL outsources their operation and maintenance part of
the plant to the STEAG Energy Service India Pvt. Ltd. Collect the monthly
efficiency report from the plant authority. I got five months efficiency report
of unit 1, 2 and 3. Sort the station heat rate related parameter for analyzing.
These parameters with their design value are listed below.
The five months data of this parameter are collected and grouping
according to the load curve. The load ranges are grouping into four categories
these are, (a) below 300MW (b) 300-400MW (c) 400-500MW (d) 500-
600MW. After the grouping and analyzing this parameter it is easily seen that
some of these parameter are controllable and some parameter are
uncontrollable.
Those parameter are depending upon the load factor or plant load
factor, these are called uncontrollable parameter. Because the measure value
of those parameter are not directly matched with the design value. When the
Serial
No.
Description Units Design
Value
1. Total Coal Flow TPH 410
2. Condensate Flow TPH 1424
3. Feed Water Flow TPH 1863.75
4. Main Steam Flow TPH 1863.75
5. Main Steam Pressure Mpa 16.67
6. 1st Stage Pressure Mpa 12.34
7. Main Steam Temperature oC 538
8. Hot Reheat (HRH) Steam Temp oC 538
9. Super Heater (SH) Spray TPH 0
10. Re Heater (RH) Spray TPH 0
11. Feed Water Temperature at Economizer Inlet oC 276.7
12. Condenser Vaccum Pressure Kpa 10.2
13. Flue Gas (FG) Temperature at Air Pre Heater
(APH) Outlet
oC 136
14. % of O2 at Air Pre Heater Inlet % 3.6
15. % of O2 at Air Pre Heater outlet % 4.67
16. Makeup Flow TPH 0
Table 3: SHR Affecting Parameter

Page | 25
plant load factor is around the 100% then it approximately matched with the
design value.
Those parameter are not depending upon the load factor these are
called controllable parameter. These parameter measured value should be
always approximately same as design parameter value.
The controllable and uncontrollable parameters are shown below table.
Uncontrollable Parameter
Total Coal Flow
Total Air Flow
Condensate Flow
Feed Water Flow
Main Steam Flow
Main Steam Pressure
1st Stage Pressure
% of O2 at Air Pre Heater Inlet
% of O2 at Air Pre Heater outlet
Controllable Parameter
Condenser Vaccum Pressure
Feed Water Temperature at Economizer
Inlet
Main Steam Temperature
Hot Reheat (HRH) Steam Temp
Super Heater (SH) Spray
Re Heater (RH) Spray
Flue Gas (FG) Temperature at Air Pre
Heater (APH) Outlet
Makeup Flow
Table 4: Controllable and Uncontrollable Parameter
3.2.8 Uncontrollable Parameter
According to the plant data below table shows that the uncontrollable
parameters are fully dependent upon the plant load factor of the plant. The
Figure 13: Uncontrollable Parameter

Page | 26
below figure shows that when plant load factor is above 80% then the
uncontrollable parameter also varies in between 80% to 100% of its design
value. Two parameters are more deviation of its design value. So the problem
parameters are,
i) % O2 at Air Pre Heater Inlet
ii) % O2 at Air Pre Heater Outlet
3.2.9 Controllable Parameter
Controllable Parameters are not dependent upon the plant load factor.
So the controllable parameters always meet the design value of the parameter.
If it doesn‟t meet the design value then we can say that the parameters are
problematic. The analyzing values of the five parameters are shown below
Figure 3-4.
The main steam temperature is the very important parameter. From the
analysis table main steam temperature shown that it changes very little of its
design value throughout the entire unit and all the load range. Hot Reheat
Temperature and feed water temperature at economizer inlet also very closer
with its design value. Condenser vaccum pressure parameter performance is
poor in less than 300MW and 300-400MW load range. But it improves in 400-
500MW and 500-600MW load range. Flue gas temperature at air pre heater is
good condition throughout all the units and load range.
The main three controllable parameters are more deviation of its design
value. These parameters are,
i) Super Heater Spray
Figure 14: Controllable Parameter

Page | 27
ii) Re-heater Spray
iii) Makeup Flow
3.2.9.1 Super Heater Spray
The deviations of these three units are analyzed with the box plot
diagram with average load range. The Figure 3-3 shows the boxplot diagram
of unit-1, unit-2 and unit-3 measuring data deviation. The design value of SH
Spray is 0 TPH. But boxplot shows the mean value of the unit-1 is 150 and
50% of collected data lies in between the range approximately 135TPH to
165TPH. The unit-2 mean value is 153TPH and the 50% of the collected data
is higher than the unit-1. Lowest 25% data is more fluctuating tan uni-1. But
unit-3 major 50% data is approximately same as unit-1 but the 25% of upper
data and lower data are highly fluctuating. In compare with its design value
of SH Spray and the actual value is too difference. So high SH Spray is one
of the reason for high station heat rate.
Figure 15: Super Heater Spray Boxplot

Page | 28
3.2.9.2 Re-heater Spray
The re-heater spray is basically used to reduce the re-heater plate
melting temperature. The design value of the RH Spray for this plant is
0TPH. The Figure 3-4 shows that deviation of the RH Spray real time data.
The measured value of RH Spray for unit-1 and unit-3 is higher than the unit-
2 value. The mean value of unit-1 is 23TPH and unit-3 mean value is 24TPH.
Lower and upper 25% of value is highly fluctuated both units. The mean
value of the unit-2 is 15TPH which is less than the other two units. But in
compare to the design value RH Spray is also high. This parameter is also the
reason for high SHR of the plant.
Figure 16: Reheater Heater Spray Boxplot

Page | 29
3.2.9.3 Makeup Flow
Makeup flow is required for a plant to full fill the shortage water. In a
closed cycle steam cycle water should not be shortage. But in real case it never
happen because in steam line huge tapping and measurement instrument are
installed. For the tapping and measurement purpose some amount of steam are
losses. Those losses affect the overall station heat rate.
Makeup flow is required to full fill the shortage of water. Analysis the
measured data of the makeup flow through boxplot. The boxplot diagram
shows the variation of data of five months. The mean value of unit-1 is
13TPH, unit-2 15TPH and unit-3 12TPH. The upper 25% of data are more
fluctuate for all the units of the plat. This parameter is also the reason for high
SHR.
Figure 17: Makeup Flow Boxplot

Page | 30
4. ASSET OPTIMIZATION
4.1 Introduction
Asset Optimization is the process of improving the deployment of assets such
as boiler auxiliaries, turbine auxiliaries and other remote assets to achieve improved
performance, increased asset utilization and lower costs. Simply knowing the location
of assets can achieve efficiencies in resource allocation and routing and greatly
increase the security and recoverability of assets.
Adding intelligent sensors to determine asset conditions can further improve
operating efficiencies. Optimization uses intelligent analytics based on real-time
monitoring inputs and collected data on location and status of transportation assets
and their content to alter business processes for performance improvement.
It includes maintaining a desired level of service for what we want our assets
to provide at the lowest lifecycle cost. Life cycle cost refers to the best appropriate
cost for rehabilitating repairing or replacing an asset.
4.2 What is Asset Optimization?
Asset Optimization is the process of improving the deployment of assets to
achieve improve performance and lower costs of operations with a system based
approach.
4.3 Needs of Asset Optimization
Asset Optimization makes our boilers, compressors, turbines, furnaces, heat
exchanger, pumps, instruments, valves and other process equipments as perfect,
effective, of functional as possible.
Today in Power Sector Company generally bid for supplying power based on
competitive tariff which reflect their overall cost of generation. In order to remain
competitive or to have larger market share the cost of generation should be as lower
as possible. Minimum cost of generation can be achieved by utilizing our fixed asset
to the maximum and reduce wastage to minimum level.
Approaches followed in asset optimization are,

Page | 31
Maximize Equipment Availability & reliability
Maximize turbine efficiency
Reduce Auxiliary power consumption
Optimize specific coal consumption
Reduce Specific Oil consumption
For employee engagement and involvement for proactive initiatives
4.4 Asset Optimization Framework
A holistic asset optimization framework would cover the entire life cycle of
assets and would be supported with the right enablers.
Vedanta Aluminium Limited has designed and implementing asset
optimization programme under the banner of AROHAN-PASSION in all its power
generating units.
Results
Enablers
Process Managemen
t
Figure 18: Asset Optimization Framework

Page | 32
4.4.1 DMAIC Project Manager
The company used a project manager which helps to implementing the
project in a proper manner. The name of the project manager is DMAIC. Which
provide all the information regarding project charter, project roadmap, templates
and tools. The outline of the project manager contains five steps. This steps as
shown in the figure 20.
Figure 19: Logo of Arohan-Passion
Figure 20: DMAIC Steps

Page | 33
4.4.2 Key Performance Index of Asset Optimization
The company set their target which will be achieved through the asset
optimization programme. These targets are called result of asset optimization.
Final goal of the company is increasing cash flow. To achieve goal, company
fixed some business parameters. This will be achieved through this programme.
The company set business parameters or Key Performance Indexes (KPI) are,
Plant Load Factor (PLF)
Specific Coal Consumption
Specific Oil Consumption
Auxiliary Power Consumption (APC)
Plant Availability
4.4.2.1 Plant Load Factor (PLF)
Plant load factor is a measure of average capacity utilization. Plant
load factor is a measure of the output of a power plant compared to the
maximum output it could produce. Plant load factor is often defined as the
ratio of average load to capacity or the ratio of average load to peak load in
a period of time.
𝑃𝑙𝑎𝑛𝑡 𝐿𝑜𝑎𝑑 𝐹𝑎𝑐𝑡𝑜𝑟 =𝑀𝑊𝐺𝑒𝑛𝑒𝑟𝑎𝑡𝑒𝑑
𝑀𝑊𝐼𝑛𝑠𝑡𝑎𝑙𝑙𝑒𝑑
A higher load factor is advantageous because a power plant may
be less efficient at low load factors, a high load factor means fixed costs
are spread over more kWh of output (resulting in a lower price per unit
of electricity), and a higher load factor means greater total output. If the
power load factor is affected by non-availability of fuel, maintenance
shut-down, unplanned break down, or reduced demand (as consumption
pattern fluctuate throughout the day), the generation has to be adjusted,
since grid energy storage is often prohibitively expensive
Page | 34
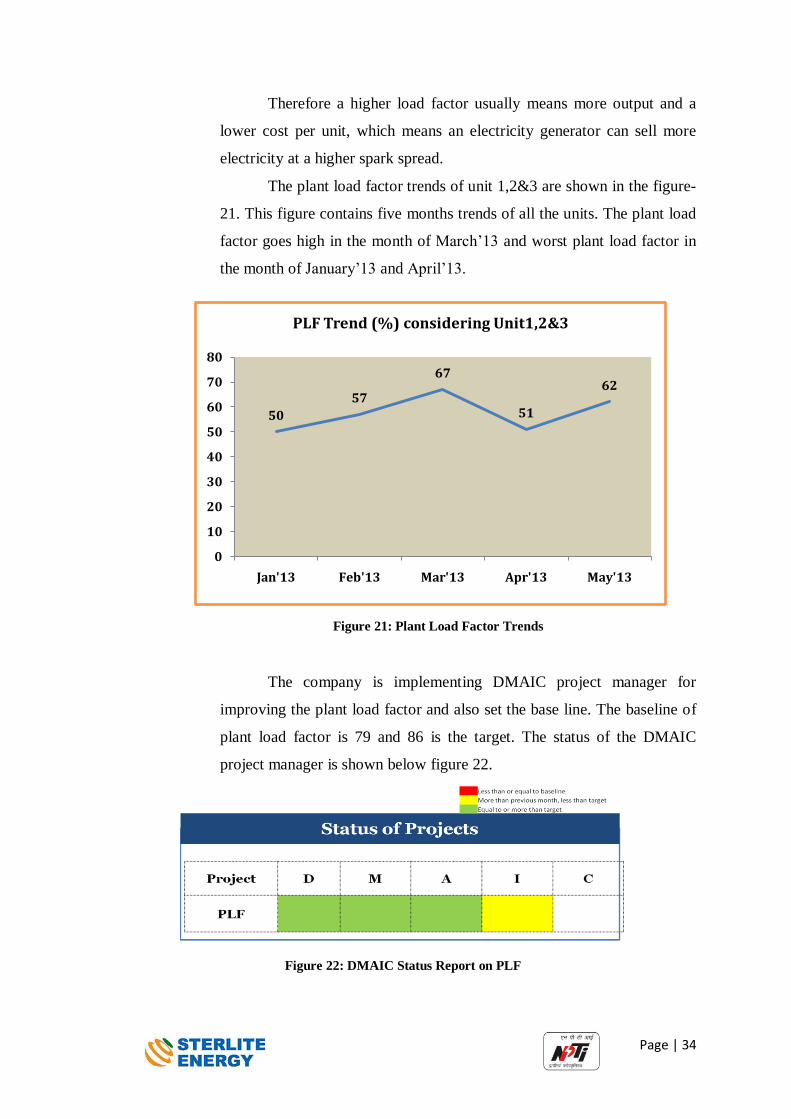
Therefore a higher load factor usually means more output and a
lower cost per unit, which means an electricity generator can sell more
electricity at a higher spark spread.
The plant load factor trends of unit 1,2&3 are shown in the figure-
21. This figure contains five months trends of all the units. The plant load
factor goes high in the month of March‟13 and worst plant load factor in
the month of January‟13 and April‟13.
The company is implementing DMAIC project manager for
improving the plant load factor and also set the base line. The baseline of
plant load factor is 79 and 86 is the target. The status of the DMAIC
project manager is shown below figure 22.
Figure 22: DMAIC Status Report on PLF
50
57
67
51
62
0
10
20
30
40
50
60
70
80
Jan'13 Feb'13 Mar'13 Apr'13 May'13
PLF Trend (%) considering Unit1,2&3
Figure 21: Plant Load Factor Trends

Page | 35
The company is implementing DMAIC project manager for
improving the plant load factor
4.4.2.2 Specific Oil Consumption (SOC)
The Specific Secondary Fuel Oil Consumption for the purpose of
startup-shutdown and flame stabilization. The Central Electricity
Regulatory Committee set the parameter for using the specific oil
consumption. According to the CERC norms SOC for all types of coals,
petroleum coke and vacuum residue is 1.0ml/gross kWh. The secondary
oil is used only for the lighting up of the plant.
The specific coal consumption trends from January to May for
three units are shown Figure 23. The trend shows that the specific oil
consumption of the month of February is very less and below the target. In
the month of January SOC is very high. It means the plant was shut down
many times.
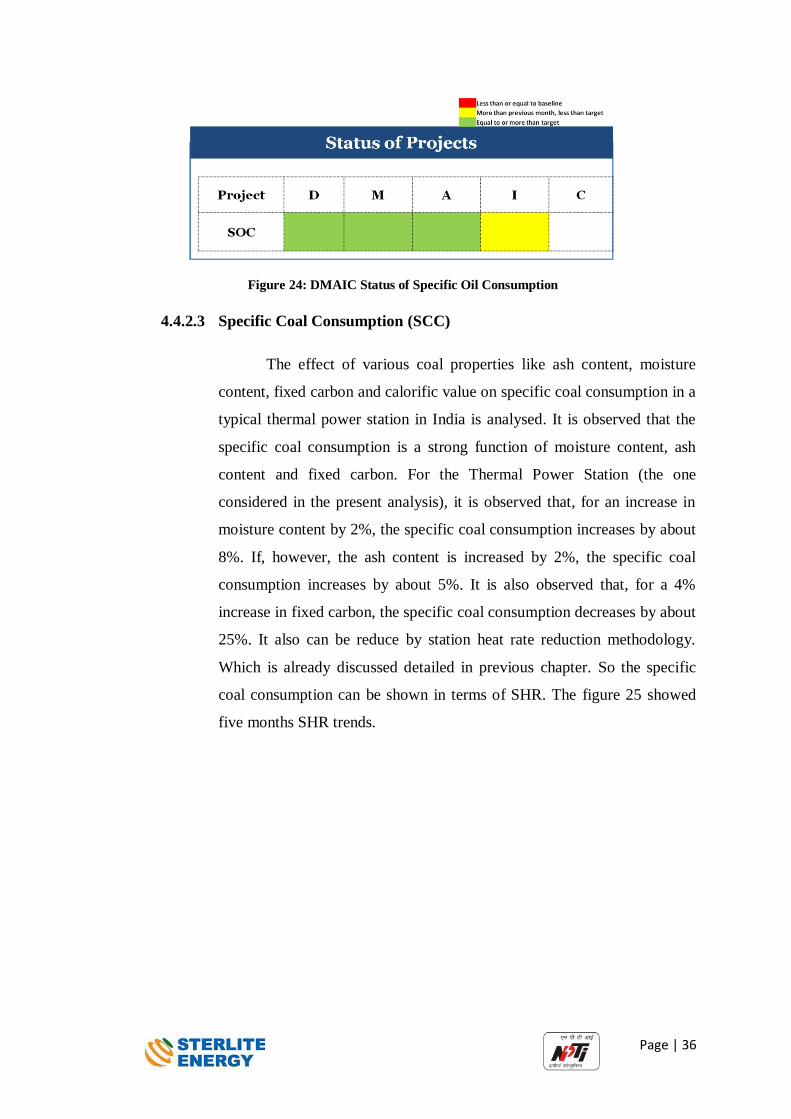
The company set their target to reduce the SOC at 0.1ml/kWh.
That reduction target is gives the benefit for less generation cost. The base
line of SOC is 0.87 which is quite higher than the target value. The figure
24 shows the DMAIC status report of May.
0.64
0.070.13
0.26
0.37
0.00
0.10
0.20
0.30
0.40
0.50
0.60
0.70
Jan'13 Feb'13 Mar'13 Apr'13 May'13
SOC Trend
SOC
Figure 23: Specific Oil Consumption
Page | 36
Figure 24: DMAIC Status of Specific Oil Consumption
4.4.2.3 Specific Coal Consumption (SCC)
The effect of various coal properties like ash content, moisture
content, fixed carbon and calorific value on specific coal consumption in a
typical thermal power station in India is analysed. It is observed that the
specific coal consumption is a strong function of moisture content, ash
content and fixed carbon. For the Thermal Power Station (the one
considered in the present analysis), it is observed that, for an increase in
moisture content by 2%, the specific coal consumption increases by about
8%. If, however, the ash content is increased by 2%, the specific coal
consumption increases by about 5%. It is also observed that, for a 4%
increase in fixed carbon, the specific coal consumption decreases by about
25%. It also can be reduce by station heat rate reduction methodology.
Which is already discussed detailed in previous chapter. So the specific
coal consumption can be shown in terms of SHR. The figure 25 showed
five months SHR trends.

Page | 37
Figure 25: Trends of Station Heat Rate
The design value of unit heat rate is 2257kcal/kWh. But if we are
compare with the graph value of heat rate which is quite high. High
station heat rate is one of the reasons for losses of the plant. Implementing
the DMAIC project manager for reduce the losses. Status report of the
DMAIC is shown in the figure 26.
Figure 26: DMAIC Status of Station Heat Rate
4.4.2.4 Auxiliary Power Consumption (APC)
Power plant produces electrical energy and also consumes a
substantial amount of energy in the form of auxiliary consumption
required for various plant equipment and services. The auxiliary power
consumption varies from 6 – 14 % depending on the plant size and age of
the plant.
2454
2495
2448
2347
2369
2424
23872374
2506
2430
2409
2527
2415
2522
2423
2,250
2,300
2,350
2,400
2,450
2,500
2,550
Jan'13 Feb'13 Mar'13 Apr'13 May'13
SHR Trends for Unit 1,2 &3 in (Kcal/KWh)
Unit1 unit2 unit3

Page | 38
The auxiliary power consumption plays a major role in enriching
the energy efficiency of the thermal power plant. As per the norms APC
should well within the 10%. Since Thermal power plant is also falls under
energy intensive consumer category like railways, metal industries, port
trust etc. Electricity Act features it is paramount importance to analyze the
consumption pattern of the plant and work on various areas so as to boost
up the efficiency of cycles and sub-cycle.
Capacity Group in MW Auxiliary Power Consumption (%)
500 MW 6.63
250 MW 8.80
210 MW 8.77
100-200 MW 10.32
Less than 100 MW 10.31
Table 5: Auxiliary Power Consumption1315
Factors affecting the APC:
Plant load factor = high
Operational efficiency of the equipment = Moderate
Start-up and shutdown = low
Age of the plant = high
Coal quality = Moderate to high
The figure 27 shows auxiliary power consumption trend for all units.
Figure 27: Trends of APC
15 CEA Auxiliary Power Consumption Regulation
9.67
8.36 8.078.59
7.68.17 8.01 8.11 8.19 8.468.19
8.577.91 8.07 8.28
0
2
4
6
8
10
12
Jan'13 Feb'13 Mar'13 Apr'13 May'13
APC trend (%) for unit1,2&3
Unit1 unit2 unit3

Page | 39
The company wants to reduce the auxiliary power consumption
and increase the plant efficiency. In present scenario auxiliary power
consumption of all the units are higher according to the CEA guide line.
Now the company set the target to reduce the APC at 8.0% where base
line is 9.87% of total generation. The APC reduction program status is
shown figure 28.
Figure 28: DMAIC Status of Auxiliary Power Consumption
4.4.2.5 Plant Availability Factor (PAF)
Energy efficiency is the least expensive way for power and process
industries to meet a growing demand for cleaner energy, and this applies
to the power generating industry as well. In most fossil-fuel steam power
plants, between 7 to 15 percent of the generated power never makes it past
the plant gate, as it is diverted back to the facility‟s own pumps, fans and
other auxiliary systems. This auxiliary equipment has a critical role in the
safe operation of the plant and can be found in all plant systems. Perhaps
the diversity of applications is one reason why a comprehensive approach
to auxiliaries is needed to reduce their proportion of gross power and to
decrease plant heat rate.
The plant availability is divided into two availability factor. These are,
i. Critical Equipment Availability
ii. Station Availability
Critical Equipment availability is directly affecting the plant
availability factor. Whether all the equipment of the plant are available
any time. Plant can be stop due to this reason. So this availability is most

Page | 40
important. Present trends of critical equipment availability are show in
figure 29.
Figure 29: Trends of Critical Equipment Availability
The critical equipment availability should be increase for better
plant availability. The company follows the nine steps for maintenance the
plant equipment. The status of the nine steps is shows figure 30.
Figure 30: Status Report for Critical Equipment Availability
Station availability is depends upon various factor. Station
availability is the main reason for 100% PLF. The trends of station
availability shows figure 31.
92.83
97.07
93.45
91.98
93.87
89
90
91
92
93
94
95
96
97
98
Jan'13 Feb'13 Mar'13 Apr'13 May'13
Critical equipment availability (%)
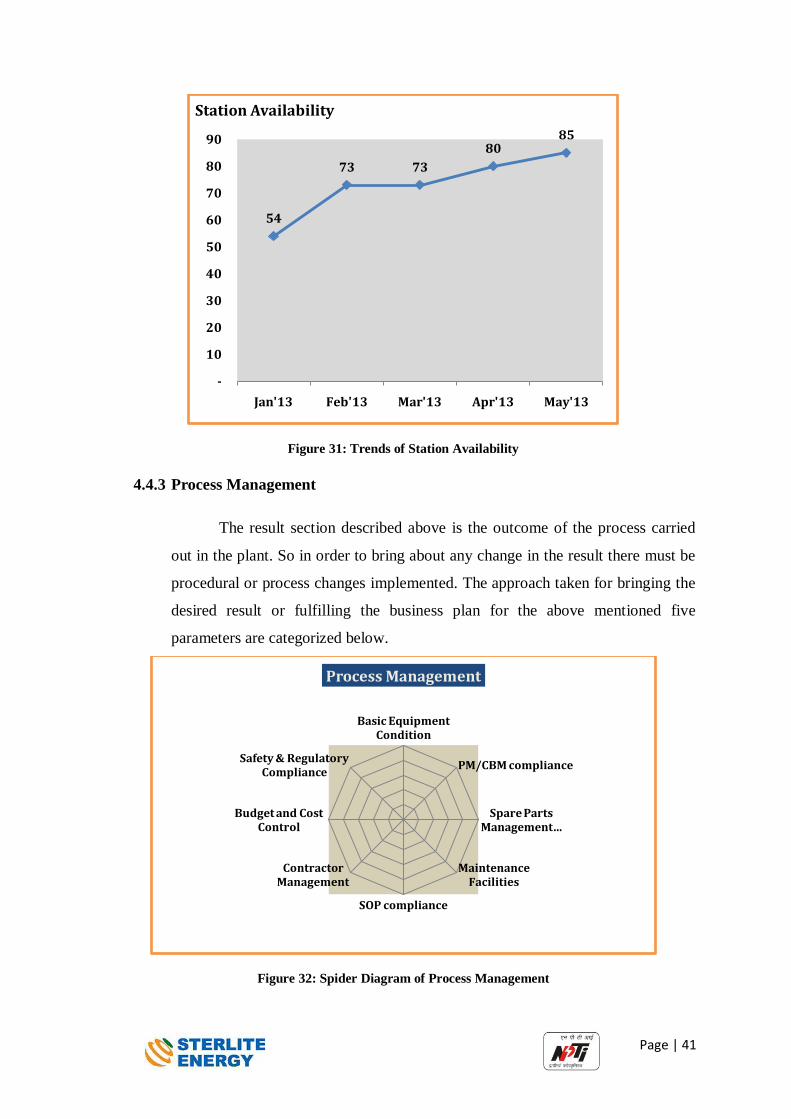
Page | 41
Figure 31: Trends of Station Availability
4.4.3 Process Management
The result section described above is the outcome of the process carried
out in the plant. So in order to bring about any change in the result there must be
procedural or process changes implemented. The approach taken for bringing the
desired result or fulfilling the business plan for the above mentioned five
parameters are categorized below.
Figure 32: Spider Diagram of Process Management
54
73 73
8085
-
10
20
30
40
50
60
70
80
90
Jan'13 Feb'13 Mar'13 Apr'13 May'13
Station Availability
Basic Equipment Condition
PM/CBM compliance
Spare Parts Management …
Maintenance Facilities
SOP compliance
Contractor Management
Budget and Cost Control
Safety & Regulatory Compliance
Process Management

Page | 42
Basic Equipment Condition:
Basic equipment includes all those equipment which are mostly
required to run a power plant effectively. These include various pumps,
transformers, HV & LT drives and monitoring equipment.
There must be a maintenance schedule for various equipment and job
responsibilities should be fixed for the maintenance of the equipments. The
log book of the equipment must be maintained mentioning the date of
maintenance, spares changed, man hours employed etc. Regular analysis of
equipment must be done giving due weightage to corrective action and
preventive action. Planned maintenance schedule must be formulated and
strictly adhered.
Performance Management & Condition Based Monitoring:
Employee must be aware of the SMP and review of PM schedule
adherence. If there is any slippage in adherence proper curative action must be
implemented. The work order logged for the job must be according to the
standard prescribed and if possible in SI system. There must be guidelines for
tracking the adherence to CAPA (corrective action and preventive action).
Moreover the higher authority or management must be made aware of the
equipment availability through regular MTTR and MTBF. So that proper
planning for future course is done in advance.
Contractor Performance:
The contractor must be made aware of the key Performance Indicators
for the respective department in line the business plan. Proper list of tools
must be maintained with proper calibration plan and its implementation
adherence. There must be proper framework for capacity building of the
employee and emphasis must be on skill mapping.
Spare Parts Management:
The management must be aware of the critical spares for respective
equipment. A critical equipment list must be made for the reference of the
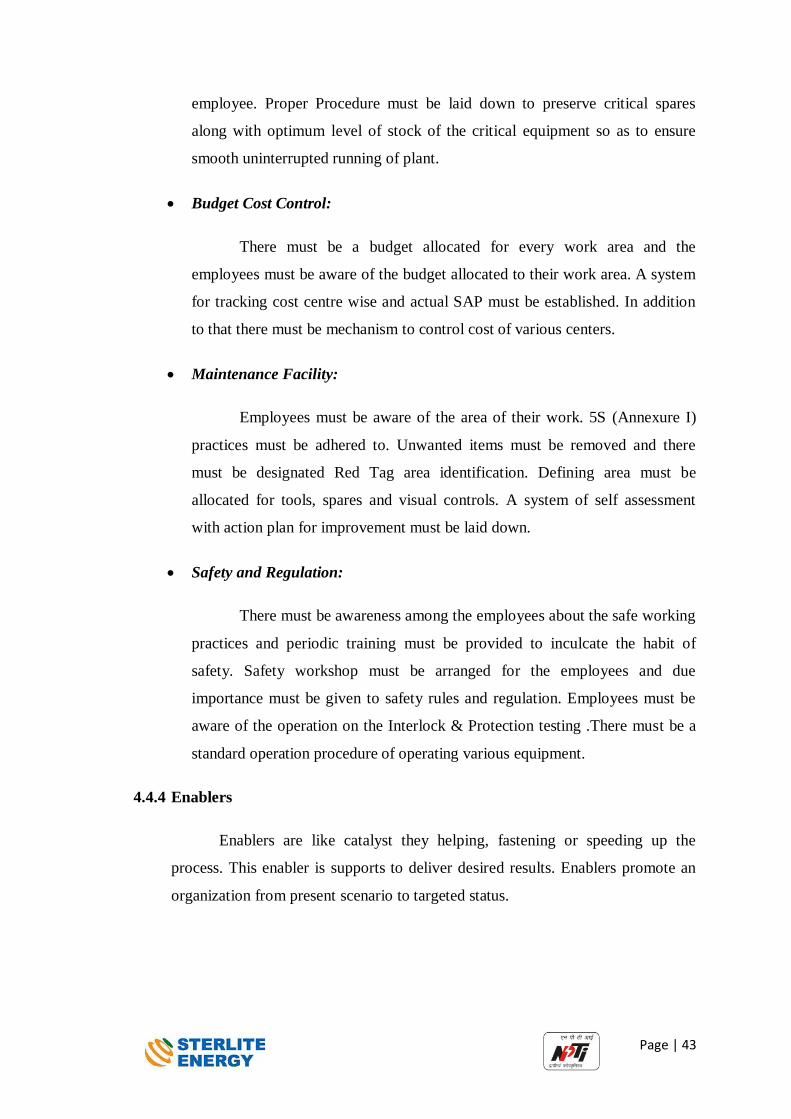
Page | 43
employee. Proper Procedure must be laid down to preserve critical spares
along with optimum level of stock of the critical equipment so as to ensure
smooth uninterrupted running of plant.
Budget Cost Control:
There must be a budget allocated for every work area and the
employees must be aware of the budget allocated to their work area. A system
for tracking cost centre wise and actual SAP must be established. In addition
to that there must be mechanism to control cost of various centers.
Maintenance Facility:
Employees must be aware of the area of their work. 5S (Annexure I)
practices must be adhered to. Unwanted items must be removed and there
must be designated Red Tag area identification. Defining area must be
allocated for tools, spares and visual controls. A system of self assessment
with action plan for improvement must be laid down.
Safety and Regulation:
There must be awareness among the employees about the safe working
practices and periodic training must be provided to inculcate the habit of
safety. Safety workshop must be arranged for the employees and due
importance must be given to safety rules and regulation. Employees must be
aware of the operation on the Interlock & Protection testing .There must be a
standard operation procedure of operating various equipment.
4.4.4 Enablers
Enablers are like catalyst they helping, fastening or speeding up the
process. This enabler is supports to deliver desired results. Enablers promote an
organization from present scenario to targeted status.

Page | 44
Figure 33: Diagram of Process Management
Goal Development:
There must be awareness about the business plan at the plant level and
department level. Proper drill must be followed adhering the KPI‟s to achieve
the primary goal of the plant. There must be proper understanding about the
need and requirement of each department by means of voice of customers.
Awareness must be spread about the various service level agreements between
different departments where each of them are internal customer of each other.
Continuous Improvement:
There must be arrangement for regular and effective tracking of all the
improvement projects with specific framework.
Building capability by means of training on various tools and
methodology to the members involved in the project also includes in the
program.
Reward Recognition & Skill Development:
A comprehensive Reward and Recognition system must be developed
for the employees. There must be awareness among the employees about this
system. The system must be able to evaluate the performance of the
employees and also the shortcomings. Based on these shortcomings there must
Goal Deployment
Skills Development
Continuous Improvement
Reward & Recognition …
Organisation & Performance …
Results
Enablers and Results

Page | 45
be training of the employees focusing on the KSA elements. Training calendar
based on the shortcoming must be based on each employee‟s shortcomings.
The training adherence must be monitored and its effectiveness must be
traceable.
Organization performance management:
This includes the establishment of Asset Optimization war room in
each and every department and coordinating with War rooms of various
departments. This also includes the analysis of KPI of various departments and
determines the effectiveness of the asset optimization program by comparing
the past and present performance of the organization as a whole.
The effect of implementation of asset optimization can be seen from
the performance diagram below figure 34 and 35.
Figure 34: Performance Diagram of Process Management
67%
65%
25%
90%
100%
78%
80%
80%
Basic Equipment Condition
PM/CBM compliance
Spare Parts Management
Practices
Maintenance Facilities
SOP compliance
Contractor Management
Budget and Cost Control
Safety & Regulatory Compliance
Process Management
May April
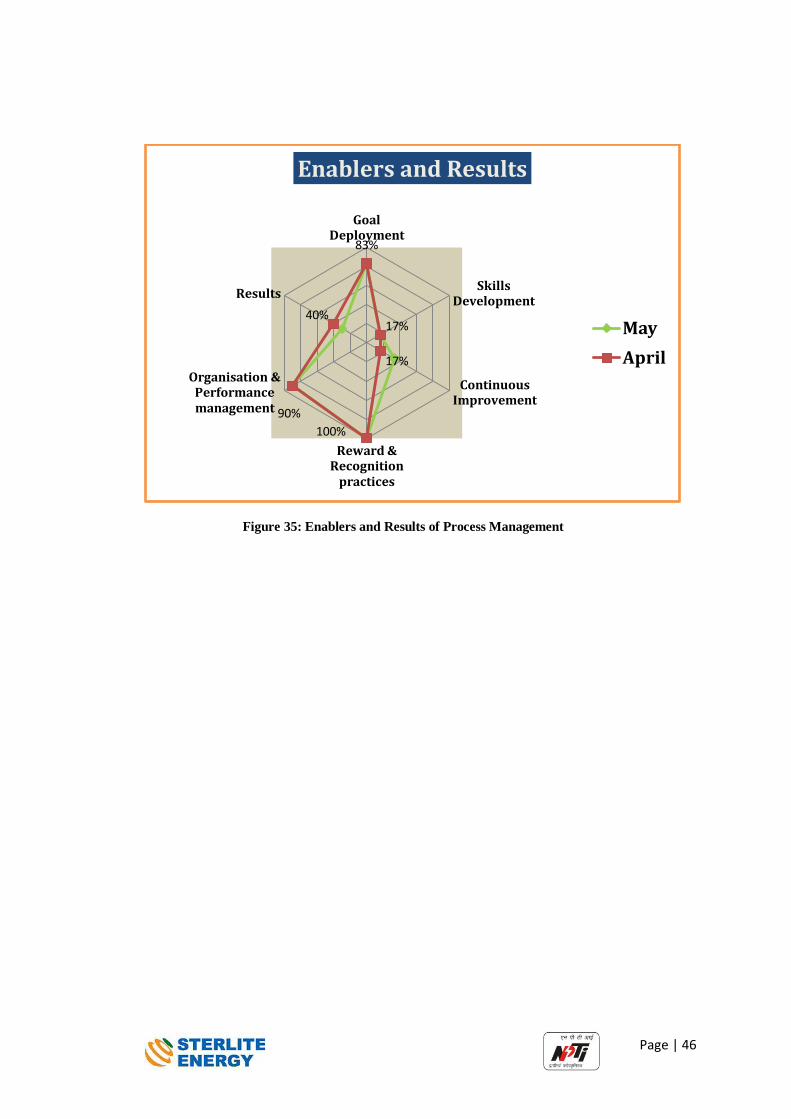
Page | 46
Figure 35: Enablers and Results of Process Management
83%
17%
17%
100%
90%
40%
Goal Deployment
Skills Development
Continuous Improvement
Reward & Recognition
practices
Organisation & Performance management
Results
Enablers and Results
May
April

Page | 47
5. STRENGTHENING O & M PRACTICES IN COAL
FIRED POWER GENERATION PLANT IN INDIA
5.1 Introduction
The Plant Load Factor (PLF) of private-sector thermal power plants in India in
April, 2012 was on an average 82.13 percent compared with 82.21 percent for central-
sector NTPC power plants and 71.67 percent for state-sector power plants. Among the
private-sector power plants also, there is a wide performance range with more than 90
percent PLF for some power plants. It is seen that most of the high performing power
plants have adopted modern Operations and Maintenance (O&M) practices and
systems. There is a significant scope for improving the performance of the
underperforming private-sector power plants just by focusing on the O&M practices /
systems.
Improving performance of private-sector power plants through interventions
aimed at strengthening O&M practices, coupled with required rehabilitation and life
extension interventions is perhaps the quickest and least cost alternative for
augmenting availability of power in the Indian context. If all the available generation
units can be utilized at an average PLF similar to central sector units through
rehabilitation combined with better O&M practices. Although such high levels of
performance may be difficult to achieve across all private-sector power plants, the
potential benefits of focusing on improved power plant performance are clearly
immense. Improved O&M practices are also necessary to sustain the performance of
rehabilitated power plants as well as new power plants. Government of India
initiatives in this regard (Partnership in Excellence – PIE Program) also amply
demonstrated the potential benefits.
For enhancing the O&M practices, multiple interventions are required across
the various aspects including people, technology, process and facilities/infrastructure.
Operational practices improvement will require setting up an Operations and
Efficiency (O&E) cell at the plant which needs to complement the current corporate
performance oversight process. It would also require setting up a Trip Committee at
the plant to analyze the root causes of unforeseen outages. There is also a need for
designing a framework for assessment of losses on commercial basis.

Page | 48
Maintenance practices enhancement shall require short-term interventions in
the form of establishing and strengthening the maintenance planning function through
establishment of a Maintenance Planning Cell along with preparation of a Plant Asset
Database and a Condition Monitoring Plan. Longer term interventions could be
towards investing in a Computerized Maintenance Management System (CMMS) and
developing a decision support system linking maintenance costs to reliability levels of
station.
Generation budgeting process would need to be strengthened through
establishment of an in-house Budget Committee and the preparation of a
comprehensive Budget Manual along with conducting training for the utility
personnel to operate in a performance based budget regime. In the area of Generation
Planning, there is a need to slowly move from the 'Bottom Up' approach (based on
what is readily achievable) of generation target setting to the 'Top Down' approach
(based on the desired level of performance). Enablers for achieving these targets
should be identified and all out efforts be made to achieve them.
There is a need to establish a Quality Assurance function along with
introduction of Quality Assurance Plan in tenders and developing strong vendors
through long-term contracts for spares and services. The existing inventory levels
could be rationalized through classification on Vital-Essential-Desirable (VED) basis
for the ease of setting differential procurement strategies for the same. Also spares
banks could be established to benefit from reduced inventory holding by pooling
spares across plants at close distances.
A deeper appreciation of cost related aspects needs to be inculcated at the
utility through development of a costing framework and establishment of cost codes
and operationalising the same with requisite training to the finance personnel. Over a
long term based on the benefit assessment, the utility may migrate to an Activity
Based Costing (ABC) System.
Human resource related aspects are a key concern with most utilities. In
particular, there is a need to have robust job descriptions with clearly identified
accountabilities to establish Key Responsibility Areas (KRAs) and Key Performance
Indicators (KPIs). The established KRAs and KPIs should feed into an improved
Page | 49
Performance Management process. A structured approach towards training has to be
developed both for the plant and corporate level staff. Given the increasing
complexities of operating the assets in a competitive regime, it is essential that a
rigorous skill gap analysis is conducted and suitable measures taken towards training
and recruitment of staff.
5.2 Background
5.2.1 Sector Background
The Indian power sector suffers from considerable electricity supply shortages
(peak deficit of 9.0 percent and energy deficit of 8.7 percent in 2012-13). The
Government of India (GoI) is addressing this problem both through a major green
field capacity augmentation program and through rehabilitation of existing coal
fired generation capacity. Around thirty percent of India‟s power is owned by
private utilities, and a significant part of this is reported to be in a poor condition,
with plant load factors of about 82.13 percent (with some plants having lower than
55 percent) and station heat rates of about 3,000 kcal/kWh (in some cases up to
3,500 kcal/kWh).
5.2.2 The Plant Load Factor (PLF)
The PLF of private-sector thermal power plants in India in 2012-13 was on
an average 82.13 percent compared with 82.21 percent for NTPC power plants in
the state sector and 71.67 percent for private-sector power plants – clearly
indicating the significant scope for improving performance of state-sector power
plants. However, there is a wide performance range among the state-sector power
plants themselves, with PLF of more than 90 percent for some power plants. It is
also seen that almost all power plants which exhibit high PLF also have better
energy efficiency performance as well – typically less than 10% deviation from the
design heat rate, compared to up to 50% deviation in some cases.

Page | 50
Improving performance of state-sector power plants through interventions
aimed at strengthening operations and maintenance practices is essential to ensure
optimum performance of the power plant both from the Availability as well as
Efficiency aspects.
5.3 Key Technical Problem area of O&M Practices in India
The key technical problem areas typically identified under the Performance
Improvement Program were as follows:
Poor condition of boiler pressure parts with high erosion, overheating,
external corrosion, oxide deposits, weak headers and pressurized furnace etc.
Poor water chemistry has affected the condition of boiler and turbine in many
cases. The water treatment plant is often in a dilapidated condition.
Poor performance of air pre-heaters due to blocked elements and high seal
leakage
Poor performance of the milling system resulting in high un-burnt carbon. This
was often a result of lack of preventive or scheduled maintenance.
Poor condition of Electrostatic Precipitators (ESPs) resulting in high
emissions.
Problems of high axial shift, vibrations and differential expansion in Turbine
0
10
20
30
40
50
0-5% 5-20% Above 20%
SHR Deviation in Private sector Power Plant (2010-11)
Per
cen
tage
of
Po
wer
Pla
nt
Figure 36: SHR Deviation in Private Sector Power Plant

Page | 51
Low vacuum in condenser due to dirty / plugged tubes, air ingress and tube
leakages
High vibrations in Boiler Feed Pumps and Condensate Pumps and passing of
recirculation valves, resulting in low discharge
High pressure heater not in service in most of the units, directly impacting the
energy efficiency performance
Deficiencies in electrical systems including High HT and LT motor failures,
poor condition of DC system, non-availability of Unit Auxiliary Transformer
etc
Poor condition of Balance of Plant (BoP) resulting in under-utilization of
capacities
5.4 Developing and Implementing a Performance Improvement Programme
Achieving significant improvements in plant performance over a short period
requires a “Performance Improvement Program” (PIP) which would identify the key
aspects that hold maximum potential for yielding performance improvements, develop
steps towards addressing those aspects and systematically implement the same. The
PIP process should start with an assessment of the current operational practices both
managerial and technical, including inter-alia an assessment of various technical
subsystems of the plant to bring out the minimum technical interventions needed to
sustain regular functioning of the plant. Such an assessment could also tie-in with a
Residual Life Assessment of the plant which would indicate the need for
rehabilitation (R&M) interventions, including need for upgrading Control and
Instrumentation systems. In Parallel, the PIP process requires steps to be initiated for
strengthening the managerial and organizational systems as described in the later
sections of this note.
The PIP serves as the overall change management theme, covering several
individual activities which are outlined in the subsequent sections of this note. The
overall phases of a PIP are:
Awareness Phase, including unit benchmarking and forecasting worth of unit
improvement.

Page | 52
Identification Phase, including equipment /
component benchmarking, High Impact-Low
Probability benchmarking, trend analysis and
creating a wide range of solution options using
input from many sources.
Evaluation Phase, including using advanced
methods to justify, select optimal timing and
prioritizing among many competing projects as
well as day-to-day O&M decisions, both
reactive and increasingly proactive decision-
making.
Implementation Phase, including using the results of the evaluations to select that
group of projects offering the best use of the limited resources, goal-setting based on
the projects actually chosen for implementation,
It is also essential to track the actual results of implemented projects and
compare these results to the expectations used in the evaluations and finally
incorporating feedback of these results into the first three phases of the process. The
various aspects of change necessary for performance improvement are brought out in
the subsequent sections, starting with industry best practices on operations.
5.5 Enhancement of Operational Practices
Existing Operational Practices in State Sector Coal Fired Power Plants
Operational practices among state-sector power generation utilities in India display a
wide spectrum, with some of the better managed utilities exhibiting superior systems
and procedures, while most of the remaining have critical gaps in several key
operational areas, leading to reduced plant performance in terms of availability,
generation and energy efficiency.
Owing to a legacy of focus on plant load factor, most utilities still do not pay
adequate attention to energy efficiency aspects. Regular energy audits (including
efficiency tests for boiler, turbine and other sub-systems) are not carried out in most
cases. Heat rate and specific oil consumption targets are fixed and monitored for the
station as whole and as a result unit-level energy efficiency related issues do not get
identified and addressed. Auxiliary power consumption is often not measured
Figure 37: Perf Improvement Program

Page | 53
systematically and is generally computed by deducting sent out energy from the total
energy generated. In the absence of any trend analysis and benchmarking,
opportunities for improvement do not get identified.
Coal accountability issues both external and internal to the plant, including
availability and accurate measurement of quantity as well as quality (calorific value)
have a direct bearing on technical and commercial performance of the plant, but
continue to receive less than required attention.
Poor Water Chemistry Water quality and make-up quantity are often not
monitored systematically, leading to operational problems in boiler (for example more
frequent tube failures) and turbine (for example deposits on blades).
In many utilities, well documented operating procedures are not available to
the relevant staff who executes their functions based on personal experience. As a
result, staff response to various situations becomes subjective and may lead to sub-
optimal approaches in addressing operational issues. Such responses may sometimes
cause avoidable tripping and forced outages, and in some cases even reduce
equipment availability, reliability and life. The observations from independent
consultants on one such poorly operated power plant are provided in Text Box-1.
“Text Box-1”: Consultant's Observations on Use of Procedures, Manuals and Instructions
at a Select Power Plant:
Independent Consultants have reported that the various operating procedures are not available
with the plant shift personnel or shift-in-charge in well-documented form. The original OEM
manuals are available in limited quantity for reference on a requirement basis. There is no library or
Centralized documentation centre. The originals are therefore difficult to be located at one place. Signature check-lists for equipment lining up and various systems start-up and shut down were also
not available which is utilized by most utilities for standardizing such operational processes.
Equipment changeover guidelines along with key process diagrams for critical equipments along
with checking procedures at local for critical and non-frequented equipment were also observed to
be absent at the Power Plant. During the field visit, the consultants noted that the Key process
diagrams, Heat balance diagrams and Technical parameters handbook indicating ideal measurement
at various plant load factors are not available with Operation Personnel. Also the consultants
observed that operation personnel did not have at shifts the Key logic diagrams indicating
interlocks, protections and associated C&I details.

Page | 54
Operational data is often relegated to records and not systematically utilized to
generate information on operational and maintenance requirements through trending
and other analysis.
Housekeeping in general is poor in several power plants with heaps of scrap
(including discarded components), coal dust and ash scattered all over the plant,
which is not only reflective of the poor O&M culture, but is also a significant
deterrent to conducting prudent O&M practices. Similarly, safety aspects are also
usually neglected.
Operating Procedures, Manuals and Instructions Proper documentation of
various operating procedures and making such documentation readily available is
critical to enhanced operating practices in power plants. Such documentation would
typically include:
Operations and Maintenance Manuals supplied by the Original Equipment
Manufacturer (OEM). The O&M manuals and the operating procedures based on
them should be made available with the shift-charge engineer at the plant and the
respective maintenance heads.
Technical Handbook for the plant indicating the various equipment
specifications, process parameter limits and critical alarm values. The handbook
should be made available to all operations and maintenance personnel.
Key Process Diagrams, Key Logic Diagrams and Heat Balance Diagrams which
would assist in better operational decision-making, trouble shooting and enable
enhanced operational efficiency.
Signature Check List for start-up, shut-down and all emergency handling
procedures should be available with the Unit in-charges and shift-charge engineer.
In addition, Walk-down Checks should be carried out in each shift by the
respective operational staff responsible for boiler, turbine, balance of plant etc. to
report any abnormalities and take corrective actions. Checklists should be
deployed to ensure that all necessary aspects are verified during the walk-down
checks.

Page | 55
Equipment Changeover Guidelines and Schedule to ensure reliability of stand-
by equipment and balanced utilization. These should also be made available to the
Unit in-charges and shift-charge engineer
Training on Procedures, Manuals and Instructions Further, in all well-run
generation utilities, operating staff are provided exhaustive training to familiarize
them with the above procedures, manuals and instructions. Such trainings include
trainings on „Power Plant Simulator‟. Refresher courses are also conducted for
experienced staff to reinforce awareness of these procedures and reduce complacency
in adherence.
A Central Technical Library needs to be setup preferably under the Head of
O&M at the plant. The library should have an archive of all procedures, manuals and
instructions, as well as latest technical journals in hard and soft copy so that the same
can be accessed on-line by operations and maintenance personnel.
Monitoring of Energy Efficiency Performance In several state owned coal
fired generation plants in India, lack of focus on energy efficiency is reflected by the
absence of adequate mechanisms for monitoring energy efficiency performance. The
industry best practice in this regard is to have Computer-based systems for On-line
Monitoring of Energy Efficiency Performance. Such systems are deployed to monitor,
for each unit in real time, the overall unit heat rate (overall unit efficiency), boiler
efficiency, turbine efficiency, controllable and non-controllable losses, performance
of condensers, regenerative cycle etc. Such a system allows Heat rate to be monitored
on a unit-wise basis (rather than for the whole plant) in real-time through on-line
measurement of coal consumption and electricity generation. The calorific value of
coal however has to be measured off-line and fed manually to the system.
Coal Measurement Systems In order to bring greater accountability and focus
on energy efficiency, it is necessary to have a reliable coal flow measurement device
– separate for each generation unit. This needs to be coupled with adequate systems
for reliable measurement of coal quality in order to determine the amount of heat
being put into the generation unit vis-à-vis the electricity generated.

Page | 56
Auxiliary Consumption Monitoring System is deployed to monitor the energy
consumption and operating parameters of key systems / auxiliaries such as Boiler
Feed Pump (current drawn), Ash Handling System (ash to water ratio), Coal Handling
System (idle running of conveyors) etc.
Steam and Water parameters (conductivity, pH values, PO4) are measured
online in real-time through the Steam and Water Analysis System (SWAS). Similarly,
on-line condensate conductivity measurement system is deployed to determine
condenser tube leakages. Even simple historical trends of such parameters can reveal
malfunctions and areas of potential improvement in plant efficiency.
Specialized and Focused Cells / Committees For effective O&M of power
plants, it is necessary to have specialized and focused cells at each power plant as well
as centralized cells at the headquarters catering to multiple plants. The division of
functions across these plant-level and centralized cells could vary across utilities –
some may have a largely plant based approach (with only critical management inputs
going to centralized cells) while others may have more centralized approach (with
data inputs from plants being provided to specialist experts located at the
headquarters), or a blend of these two. The information technology solutions now
available facilitate adoption of more centralized systems which better utilize precious
technical expertise and enable closer management oversight. However, a minimum
level of expertise at the plant is necessary in any case to cater to day-to-day O&M
requirements at the plant and take necessary actions in real time, while also feeding
information to the centralized cells. The following specialized/focused cells may be
recommended:
Operations and Efficiency (O&E) Cell at the Plant The O&E cell measures
and analyses energy efficiency performance of the plant on a regular basis and
is responsible for strict monitoring of the unit heat rate and its deviations. It
ensures the operation of the plant and auxiliaries at optimum efficiency by
identifying and rectifying gaps in efficiency compared to the design
parameters. This is achieved by ensuring the operation of the unit at rated
parameters and minimizing the consumption of coal, secondary oil, auxiliary
power and make-up water. Another aspect specifically monitored by the O&E
cell is achievement of optimum water chemistry parameters. Some of the tests

Page | 57
routinely carried out by the O&E cell in association with O&M divisions are
(i) Boiler Efficiency, (ii) Air Pre-Heater X- Ratio, (iii) Condenser Efficiency,
(iv) Turbine Cylinder Efficiency, (v) Dirty Pitot Tube Test for Mills, (vi)
Cooling Towers Efficiency, and (vii) Efficiency Tests for Heaters and De-
aerators.
Trip Committee at the Plant Typically, well-run plants have a trip committee
which is entrusted with the task of root cause analysis of trips and suggesting
corrective actions to prevent recurrence of trips. The suggested corrective
actions are typically formulated as an action plan with clearly ear-marked
responsibility center and schedule. Compliance with such recommendations is
monitored at plant as well as corporate levels and an institutional framework
for achieving this is also put in place. Recommendations of the trip committee
also feed into the maintenance plan. In some cases, specialized committees are
also in place for analyzing boiler tube leakages – one of the most frequent
reasons for forced outages. Other causes of forced outage are also analyzed in
detail by what are called as „Forced Outage Committees‟.
Energy Audit Committee at the Plant The Energy Audit Committee is
mandated with preparing the Energy Audit Plan for the plant, conducting in-
house energy audits and coordinating third party external audits at the plant. In
the Indian context, the Energy Conservation Act, 2001 mandates periodic
energy audits for all energy intensive industries (including thermal power
plants). It has been observed that Energy Audits lead to significant
inexpensive performance improvements by enabling capture of low hanging
fruits (energy losses). An efficiency audit should be carried out based on
which the Energy Efficiency indicators should be defined for major energy
consumption/loss centres. However it is also essential to set up mechanisms
and institutional processes for ensuring that the recommendations of the
Energy Audit Committee are evaluated through a cost-benefit assessment and
implemented in a time bound manner.
Pool of Technical Experts across the Organization In order to build-upon the
shared expertise across various power plants, a Pool of Technical Experts is
developed across the organization, deriving expertise in different areas (such
as turbine, boilers, C&I etc) from different locations. From this pool,

Page | 58
Knowledge Teams are derived, which bring knowledge and experience in
different areas from different power plants and provide in-house consultancy
to technical problems at any location.
Daily Operational Review of Plant Performance Structured Daily Plant
Meetings chaired by the head of plant O&M should be held each morning to analyze
the previous day‟s performance and plan the generation target as well as the
maintenance activities for the current day. Relevant inputs from the specialized
cells/committees mentioned above are also discussed in these meetings. Apart from
the daily meetings, a monthly operational review meeting chaired by the head of the
plant should be held to follow-up on O&M aspects as well as other plant issues.
Knowledge Management In any power station a huge amount of operational
data is generated on an ongoing basis which needs to be stored properly for future
reference, analysis and feedback. Moreover, significant data is also regularly churned
out by supporting departments like stores, procurement, finance, environment and
human resources etc. A proper knowledge management framework needs to be
developed in the power plant for its smooth and efficient functioning. Such a
framework would enable the utility to capture, analyze and refer experiences from
different situations including unit tripping, specific problems of various plant systems,
experience pertaining to plant overhauls etc. Utilities having a portfolio of plants of
varying vintage can be expected to have a rich experience across the years of
operation that needs to be captured through a knowledge management initiative.
The process of developing a robust knowledge management framework can be
initiated through implementation of department-level Information Systems (possibly
through modular Enterprise Resource Planning – ERP interventions) which will share
all relevant data for multiple uses and subsequently these systems can be interlinked
to develop a proper knowledge sharing platform.

Page | 59
The knowledge platform also provides various standardized reports for
management decision making and serves as the Management Information System
(MIS) backbone at the plant and corporate levels. Figure-38 provides an indicative
content framework for a typical power plant knowledge management platform. A
separate discussion on MIS is provided in Annexure-II of this note.
5.6 Enhancement of Plant Maintenance Practices
Existing Maintenance Practices in State Sector Coal Fired Power Plants
Based on the review of select power plants by independent consultants it is seen that
there is wide variation in existing maintenance practices in state sector power
generation plants, although even the relatively better utilities do not exhibit practices
comparable with the industry best practices. It is seen that often documented
maintenance procedures have not been developed and deployed even for critical
equipment, especially in case of weaker utilities.
Figure 38: Content Framework of a typical power plant knowledge management platform

Page | 60
Maintenance Related Operational History Comprehensive database of
performance trends and failure history is often not available even for critical assets
such as mills, pumps and balance of plant. Also, where available data is recorded in
hard copy maintenance registers and is not used for failure history analysis or for
monitoring Mean Time Between Failures (MTBF). Failure Modes and Effect Analysis
is usually absent as an institutional practice.
Maintenance Planning Based on the review of select power plants by the
consultants, it is seen that typically there is no dedicated maintenance planning
department – and even when there, it is not effectively contributing to systematic
maintenance planning. Mostly, maintenance planning is being carried out by
individual maintenance groups (boiler / turbine / electrical etc). Long term planning
for overhaul is done 2-3 years in advance, though inadequate planning and
preparation often leads to extension of shutdown-schedule. Spares-planning is carried
out on the basis of past experience rather than a systematic analysis of spares
requirement, leading to imbalance in availability of spares. Spares for planned-
maintenance are planned 6-8 months in advance by the individual maintenance
groups.
There is a limited appreciation of the commercial linkages of plant level
availability and the reliability of individual equipments. Often the commercial
implications of productivity loss (impact on fixed cost recovery) and reduced heat rate
due to poor equipment performance (for example underperforming mills) is not
objectively assessed in the maintenance decision-making process., Prioritization of
maintenance areas based on a pareto analysis of failures is not undertaken.
Condition Monitoring Since most of these plants are relatively old, there is
inadequacy of modern measuring equipments and where available, such equipment is
often not used on a regular basis. Absence of adequate condition monitoring systems
leads to reactive maintenance practices rather than pro-active maintenance practices.
Pro-Active Maintenance One of the hallmarks of top performing generating
companies worldwide is their successful efforts to establish a Pro-active O&M
program, one that uses their equipment reliability, cost and efficiency data to
supplement the recommendations of the equipment manufacturers and the utility‟s

Page | 61
firsthand experience. The key elements of proactive maintenance in power plants are
illustrated through Figure-39.
Steps for Strengthening Maintenance Practices and Establishing Pro-
Active Maintenance:
Establish a Strong Maintenance Planning Department (MPD) at the Plant
The Maintenance Planning function at the Plant should be strengthened in
terms of placing it as the nodal point in both target review and daily decision
making process for day-ahead maintenance plan, in association with
Operations and Efficiency (O&E) Cell. The MPD would be responsible for the
overall planning of the maintenance activities both short-term and long-term.
This includes developing preventive maintenance schedules and ensuring
compliance, formulation of overhauling strategy (for example preparation of
six year maintenance rolling plans), spare parts planning, condition monitoring
and maintenance of equipment history.
Establish a Condition Monitoring (CM) Cell under the MPD Setting up of a
condition monitoring cell at the plant with priority basis will facilitate the
induction of proactive maintenance at the plant. The staffing requirements and
role definitions for the CM cell would need to be defined and adequate
infrastructure in respect of instrumentation shall need to be made available to
make it fully functional.
Figure 39: Proactive Maintenance Management System

Page | 62
CM cell should develop a Condition Monitoring Plan which would include
check-lists and frequency for equipment monitoring. Equipment monitoring
would require a wide array of techniques including among others Vibration
analysis, Shock-pulse analysis, Lubricant oil analysis and Thermo-vision etc.
MPD should carry out Maintenance Process Enhancement Steps in
coordination with respective maintenance departments. (See Figure-40)
i. Creation of a comprehensive asset database at individual departments and
MPD.
ii. Identification of critical equipments in the process train based on past
operating history of the assets.
iii. Failure Modes and Effects Analysis (FMEA), Root Cause Analysis and
Pareto Analysis for the critical equipment.
iv. Updating of Condition Monitoring Plan (including standardized
procedures for condition monitoring of critical equipment) and Operating
Norms / Signature Checks in light of the above.
v. Identification of Key Performance Indicators (KPIs) for maintenance.
Establish a Decision Support System to Facilitate Pro-Active Maintenance
Such a system should be aimed at optimization of power plant reliability
based on the following approach:
Figure 40: Maintenance Process Enhancement Steps

Page | 63
i. Allocation of the risks of production discontinuity to individual assets
and failure modes. This is done through a bottom to top linkage – i.e.
probability weighted impact of equipment/part‟s failure on plant
operation and therefore profitability.
ii. Estimation of returns on reliability enhancement investment for each
asset/part.
iii. Prediction of profit impact of selective maintenance relaxation for
each asset/part.
iv. Comparison of investment costs with risk-reduction returns on both
annualized and plant lifetime basis.
Establish a Technical Database to establish relationship between equipment
aging rate and equipment reliability, equipment reliability and generation
reliability, and optimal power generation and penalty consequences of failure
to generate.
Establishment of a Computerized Maintenance Management System having
modules like-Plant Performance module, Human resource module, Works
Planning module, Materials Management Module, Budget and Cash flow
module, Work Permit module, Costing System module, Financial accounting
system module, Coal Management module, etc. This system will generate
various reports on daily, monthly and annual basis which will be used to
review and take corrective measures for various facets of plant performance.
Similar to the plant level and centralized approaches discussed for operational
aspects in paragraph 28, the maintenance activities could also be organized across
plant level and centralized level. In case of utilities favoring a more centralized
approach, the above suggestions would need to be implemented at the centralized
cells through suitable information technology interventions.
5.7 Generation Planning and Plant Level Budgeting
By virtue of operating in a regulated environment with the regulator setting
the performance norms for operational aspects. Under the prevailing regulatory
regime, tariff levels are typically set for individual generating stations based on
normative performance parameters under an annual tariff approval process (though
some states have introduced multi-year tariffs recently). The normative performance

Page | 64
parameters are determined based on performance during the previous periods and a
comparison with similar plants elsewhere in the country. The annual tariff process
requires the utility to submit the expectations on both fixed and variable costs to the
SERC under the tariff filing process. The fixed costs comprise of O&M costs besides
other standard elements like depreciation, interest charges, return on working capital
(normative basis), return on equity and taxes. With the exception of O&M, the
majority of the other fixed cost elements are maintained by the corporate office and
hence the budgeting/planning at the plant level is primarily limited to O&M
budgeting.
5.7.1 Existing practices in Generation Planning and Plant Level Budgeting
Weak Framework for Generation Planning It is seen that generation
planning process in state power generation utilities in India is often based on a
qualitative input from various operations and maintenance departments. Even
in the relatively better utilities, where all key plant personnel (including shift
in-charges, maintenance in-charges and plant head) are involved in the
generation target setting process, the system is currently more reliant on their
experience and judgment than on hard data analysis. Further, in the select
power plants reviewed by the consultants, there is limited participation from
the maintenance planning cell, where such a cell exists. Also, the generation
planning process does not incorporate any significant inputs from the energy
audits.
Trend Based Generation Planning The generation planning process at state
power generation utilities is typically focused on maintaining status quo of
plant performance and maintaining historical performance levels. As a result,
generation parameters are projected conservatively based on trends from past
years.
Partial Loss Occurrences from Previous Year not Analyzed for setting in
place plans for improved generation levels for the year ahead. Further, limited
focus on commercial analysis of generation loss or operational constraints
during the year results in reduced generation than potentially achievable
output.

Page | 65
Inadequate Focus on Monitoring Tariff Parameters during Operation The
consultants have reported that there is inadequate appreciation at plant and
enterprise level of the commercial implications of the Tariff plan including
Performance targets given by the state electricity regulatory commission. The
monthly / daily target is often not revised to reflect shortfall in generation (if
any) or other plant parameters on a cumulative basis against the regulator
approved benchmarks.
Limited Focus on Other Aspects during Management Review Although
regulatory targets are included during the periodic management reviews of
achievement against generation targets, several other aspects of plant
operation such as commercial performance (cost of generation on fixed /
variable basis), implications of Availability Tariff, status of maintenance
works, inventory position, safety and environmental performance etc. do not
find adequate focus.
Departmental Budgets are prepared mostly on Historical Basis It is seen
from the consultant‟s reports that the departmental budgets are prepared
mostly on historical basis using previous experience and are subject to some
discretion of senior departmental personnel. It is also seen that the explanation
of variance of actual expenditure versus budgetary projections is often
inadequate / lacking.
Inadequate Design of Accounting Codes The Budget compilation exercise
typically takes around a month. Part of this can be attributed to the current
design of accounting codes where there are single codes for repairs and
maintenance items encompassing both supply and labour. This results in the
departments furnishing the information under a single accounting code that
later requires segregation of the supply and labour components. Additionally
often due to non-standardization of reporting template, cost codes are not
represented on the utilizing department budget forwarded to Finance and
Accounts department.
Budgeting for O&M is typically restricted to Regulatory norms The
approved level of O&M expenses in the Annual Tariff Order by the
Regulatory commission is usually set as the Station O&M budget level as a

Page | 66
gross whole. The Tariff order levels thus constitute the sole basis of O&M
budgets for cost control in the station on an aggregate basis.
5.7.2 Generation Planning and Transition Steps
Focus on exceeding regulatory targets on a sustained basis The minimum
plant performance for ensuring commercial operations is defined by the
targets specified by the regulator in the tariff order. Therefore, the utility has
to identify the steps required to achieve / surpass the same on a sustained
basis. The steps identified have to be reflected suitably across generation
planning as well as plant level budgeting.
Scenario Based Approach to Generation Planning The regulatory
framework provides for incentives linked to higher availability of the unit. In
addition, higher generation beyond the Declared Capacity (DC) (within limits
set by the regulator to prevent gaming) can potentially yield higher revenues
through Unscheduled Interchange (U.I.) charges in the prevailing supply
shortage conditions. Therefore, better performing utilities strive to exceed
regulatory targets with respect to availability, while also attempting to
generate beyond the declared capacity. Such utilities plan scenarios for
maximizing generation and while providing resources for concomitant capital
expenditure over a medium term time horizon, especially where regulator has
provided multi-year tariffs.
Operation efficiency needs to be attributed greater focus at both the
corporate and plant level. It is essential that elements of detailed shortfall
analysis, partial loss analysis and inputs from the energy audit reports be
utilized for the preparation of year-ahead plans. However prior to initiating
the same, the utility may also require formalizing an energy audit and
performance review plan for the asset portfolio.
Day-ahead forecasting may be important in states where generation utilities
stand to be affected by Availability Based Tariff. Establishment of an ABT
Cell comprising of personnel skilled in analyzing the impact of ABT would
be important in such cases. Utilities could also develop internal guidelines on
day-ahead generation planning to optimize on commercial implications of
ABT regime.

Page | 67
Adopt an availability based approach to generation planning
i. The plant should target to progressively move towards Zero Forced
Outages. With this aim, the benchmark targets should be set for forced
outages as well as planned maintenance. This should be utilized to
project Availability and derive the PLF projection based on the same.
ii. Assess individual equipment level reliability and performance levels
so that the expected station overall availability can be projected and
steps taken to improve the same, with the aim of meeting the targets
set in the tariff regulations.
Strengthen the generation target review process through
i. Utilization of a commercial basis for evaluation of plant constraints to
prioritize maintenance interventions
ii. Analysis of shortfall at plant on daily basis to develop and implement
recovery plans for shortfalls (if any).
iii. Expansion of topical coverage to address other non technical issues
like stores, finance, human resources in the generation target review
meetings
iv. Strengthening of channels of communication for the review meeting
outcomes via circulation of formalized Minutes and making the same
accessible to plant executive staff at all levels.
5.7.3 Plant Level Budgeting and Transition Steps
Develop a Suitable Budget Manual which will act as a guideline for all
involved in the budget preparation process in the organization. The budget
manual should typically cover the overall framework of the Budgeting
System, detailed budgeting process, budgeting responsibility, time schedule
for budget preparation, and the system for monitoring adherence to budgetary
targets. It also provides the relevant formats for all the above aspects.
Establish Plant Level Budget Committee comprising of Plant Head, O&M
in-charges and various departmental heads. The committee should review the
overall physical targets, examine the budget proposals of the individual cost
centres and prioritize the allocation of resources to them.

Page | 68
Technical Vetting of the Budget is carried out by Operation and Efficiency
(O&E) Cell as well as the Maintenance Planning Department (MPD) at the
plant for operating parameters and maintenance requirements necessary to
meet the proposed budgetary targets. The technically vetted budgetary inputs
from the plant level budget committee are subsequently finalized during the
review by corporate level budget committee.
Budget System should be aligned with Finance and Accounts (F&A) for
account codes and Costing System for cost codes to ensure that variance
against the budgetary targets during the previous years and cost estimates for
planned activities can be fed into the budgeting process.
Periodic Review of Budgetary Performance at Plant and Corporate Levels
Typically performance against budgetary targets should be reviewed at the
plant on a monthly basis and at the corporate level on a quarterly basis, with
the aim of formulating recovery plans, if needed. Review of actual
expenditure against budgetary targets and actual plant performance against
physical targets should typically feed into a periodic review of the impact on
overall profitability.
5.8 Management Information Systems
Existing practices in Management Information Systems Some of the leading
state owned power generation utilities have traditionally had reasonably strong
(though manual or part computerized) MIS systems and are now in the process of
adopting state-of-the-art Enterprise Resource Planning (ERP) systems which would
also cater to their MIS requirements. Some utilities (such as MSPGCL) have even
initiated steps towards remote monitoring of plant performance in real-time at a
centralized facility called the Generation Control Room (GCR) at the corporate office
through a SCADA system. However, Information Technology (IT) infrastructure at
power plants owned by many other state-sector utilities has significant deficiencies –
in some cases virtual absence of any IT infrastructure at the plant is observed. The key
aspects of existing MIS systems at some of the lagging utilities are as follows:
IT Infrastructural Constraints Typically, in poorly performing power plants
with weak IT infrastructure, MIS data is collected manually by the relevant
plant staff. There is absence of Local Area Network (LAN) connectivity and
Page | 69
only limited availability of computers. As a result access to internet and email
is also limited. Officials are not habitual to using computers and are dependent
on specialized computer operators even for basic applications.
MIS design and Process Shortcomings Typically MIS formats being used by
generation utilities report on basic operational data (mainly physical
parameters), and are not amenable to detailed analysis of key plant issues on
commercial terms. This is illustrated in the MIS formats collected by the
consultants from one of the power stations (see Annexure-II). Reports
typically do not adequately cover other power plant aspects such as
maintenance activities, stores, commercial performance, environmental
performance and training of personnel etc. Further, it seen that MIS reports
generated by various departments at the plants often contain duplicate data.
5.8.1 Transition Steps for a Strengthening MIS Framework
Integrated MIS policy for the Organization should be formulated for
implementation across the headquarters and the various plants, covering all
aspects of functioning of the plants – viz. operations, maintenance, stores,
purchase, human resource, safety, environment etc.
Appropriate IT Organizational Structure should be developed Separate MIS
and IT cells would be required at each location. MIS Cell should look after
data collection, compilation, and report preparation while the IT cell will be
responsible for taking care of the technology / hardware related issues. There
has to be a single departmental interface for reporting and information
archival- MIS department preferably in the Technical Secretariat of the Plant
In-charge.
Plant-wide and Company-wide IT infrastructure development All the
executives at the plant should be provided with IT infrastructure with Local
Area Network (LAN) connectivity in the plant and Wide Area Network
(WAN) connectivity across all plants and headquarters.
Development of IT modules to cater to various functional requirements, such
as Computerized Maintenance Management System (CMMS), Materials and
Stores Management System (MSMS), Operation Plant Performance
Management System (OPPMS), Business Planning Module, Finance and

Page | 70
Accounting (F&A) and Human Resource Development modules etc.
Alternatively, generation companies can install Enterprise Resource Planning
(ERP) packages customized for power plant / generation company
requirements encompassing all the above mentioned modules.
MIS interface with Digital Control System (DCS) of the power plant for
automatic generation of management reports. The DCS captures data in real
time without much human interference directly from the various instruments
installed in the plant. This information can be fed into the ERP / MIS system
directly.
5.9 Purchase & Stores
Existing practices in Purchase and Stores Management The existing
practices in purchase and stores management differ significantly across different
utilities, with some of the better utilities have adopted some of the industry best
practices such as rationalized list of inventory items, e-procurement, computerized
inventory management systems and evolved vendor management systems.
On the other hand, the relatively lagging utilities have under-evolved practices
on several fronts. Indents for purchase have to be raised manually by the utilizing
department (with no system of automatic flagging of requirement). The delegation of
powers is not adequate considering the current price levels, often implying that all
purchases have to be approved by the corporate authorities which may require
considerable time causing delays. Absence of suitable quality assurance system and
vendor performance management system imply that related issues are not identified
systematically and remain unaddressed. In most cases material is inspected only after
receipt at the plant.
Plants of some of the lagging utilities have a much higher number of inventory
items than comparable plants of relatively better utilities due to inadequate item
codification and poor inventory management practices. For example, one such lagging
plant has about 46,000 inventory items compared with about 3500 items for a similar
plant of a better managed utility. In the absence of suitable and effective
categorization of store items (with respect to cost, criticality, procurement lead time
and fast moving/slow moving), it is difficult to manage stocks availability while

Page | 71
strategically keeping the costs low and reducing the procurement effort. It is often
difficult to undertake annual physical verification of stocks of all the items in the
stores, especially where inventory management processes are manual.
5.9.1 Transition Steps for a Strengthening Purchase and Stores
Establish a Quality Assurance (QA) System The better performing generation
utilities typically have a stringent quality assurance system which caters to the
requirements of regular maintenance, annual overhauls, major rehabilitation
works as well as new builds (expansion or green-field projects). Such QA
systems extend to both plant level (Field Quality Assurance Cell) and
corporate level (Corporate Quality Assurance Department). They typically
have Quality Assurance Manuals with detailed process documentation. A
Quality Assurance Plan (QAP) is prepared for all major items detailing out the
Checks/Tests to be carried out, Customer Hold Points (CHP) and Acceptance
Criteria. The QAP also details out the stage, location and agency responsible
for testing.
Establish a Vendor Management System Establishing a strong vendor
management system based on enlistment of vendors after due assessment of
vendor‟s manufacturing capabilities (including quality control aspects) and
subsequent monitoring of vendor‟s performance through a Vendor
Performance Appraisal System is critical for ensuring smooth availability of
quality components. Further, utilities could also undertake vendor
development activities aimed at developing more vendors and strengthening
manufacturing practices of existing vendors. Strategic interventions like
pooling of spares requirements across the organization to achieve economies
of scale as well as to elicit greater interest from larger (and more capable)
vendors could also be undertaken.
Tendering Related Aspects Since delays in procurement can imperil smooth
functioning of the plant and timely completion of overhauls, standardization of
tender procedures should be done along with clearly defined delegation of
powers (DoP), responsibility and timelines. Bid documents should be
strengthened to include appropriate provisions for liquidity damages, price

Page | 72
variations (especially for long lead time items) and Quality Assurance Plans.
Utilities could progressively move towards e-tendering which would allow
faster and more efficient procurement while ensuring adherence to required
procedures. The utility should develop strong procurement skills at both the
plant and corporate levels and should conduct suitable trainings in this
direction. Having a materials management manual which also covers
procurement and stores (inventory management) can be useful.
Proper Identification and Codification of Stores Items to achieve
rationalization of inventory levels by bringing out duplication or redundancy
of items. Also, the stores should generate monthly report of inventory
positions with respect to all materials, and an annual report which should be
linked to the physical verification of assets.
An ABC analysis or a Vital-Essential-Desirable (VED) analysis is carried
out for all stores items. This helps in classification of spares in accordance
with an appropriate inventory management and procurement strategy based on
the criticality, cost and lead time of the items. For example, an Automatic
Procurement Process is devised for all fast moving items and consumables by
fixing minimum and maximum reorder levels which are monitored and
procured by the stores personnel themselves. Similarly, an organization-wide
pooling of common high value spares could be organized and systems devised
to share this information across plants.
A suitable Computerized Inventory Management Package linked to the main
Enterprise Resource Management (ERP) System is implemented to cater to all
requirements of stores management.
Finally, a Materials Preservation Manual should be developed which will act
as a reference for the store employees to ensure proper storage of equipment.
5.10 Indicative Action Plan for Strengthening O&M Practices
The O&M strengthening Plan at the utilities will need to be based on ensuring
not only business process turnaround but also instilling in place an improved
organizational culture and climate. The Strengthening plan aimed at transforming the
existing plant practices and creating an agile generation utility shall need to be
overseen and supported by the Utility Management as a Change management

Page | 73
exercise. The improvement activities shall need to be kick-started with a Performance
Improvement Program aimed at disseminating the program benefits and ensuring
readiness within the organization to adapt to the necessary changes that shall be set
out in the individual modules.
A modular approach could be adopted for the entire change management
exercise. Each module shall a number of tasks both technical and management related
with a specific time line as tabulated below:
Module Task
Operation Practices
Enhancement
Redesign of existing O&M Manuals post review of existing
ones along with development of equipment procedures and
conducting training for O&M personnel
Establishing efficiency management as a thrust area through
setting up the Efficiency Monitoring Cell and
institutionalizing procedures for performance testing,
auxiliary energy management, root cause analysis of trips.
The efficiency management is expected to be
complemented by a commercial loss evaluation and
efficiency benchmarking tool which will facilitate analysis
and identification of controllable losses and identify assets
for refurbishment / replacement.
Initiation of Knowledge Management through establishing a
Central Technical library at the Plants and subsequently
creating of a web based system for capturing plant
information, best practices, technical, operational details for
dissemination across the entire utility.
Proactive Maintenance
Creating an asset database to be populated with failure
history, performance characteristics, design data which shall
enable analysis of failure mode and effects. This will lead to
development of a proactive maintenance plan along with the
condition monitoring schedules and reliability assessment
matrix.

Page | 74
Designing and setting up a Decision support system linking
the costs to reliability along with equipment level operating
limits and checklists which shall enable the utility to pre-
empt failures and also utilize cost / reliability information to
substantiate refurbishment / replacement decisions.
Setting up a Computerized Maintenance Management
System (CMMS) at the Plant.
Cost Information System
The costing system shall entail setting up a costing
framework at the plant along with relevant cost codes and
centers. The implementation arrangement shall consist of
creating a cost database, populating it with one time cost
data and conducting training for utility personnel on the
same. Depending upon the current maturity level of the
utility, this can be extended towards designing an Activity
Based Costing system at the Plants.
Generation Planning &
Budgeting
Realignment of existing practices with the future market
scenario.
Establishing a Techno-commercial cell at the plant along
with integration with CMMS based planning.
Setting up of procedures for Equivalent Availability Factor,
Year ahead planning integrated with Energy Audit and
Partial Loss analysis
Developing a Budget Manual along with introduction of a
Performance Based Budget System at the utilities.
Management Information
System
The MIS system at the utilities shall require varying levels
of intervention based on the existing systems with the utility
and shall range from improving existing system through
additional functionalities to developing an IT policy,

Page | 75
establishing a fully fledged IT and MIS system along with
procuring an MIS system via bid route.
Purchasing & Store
Review and Redesign of existing procurement procedures
Institutionalizing Quality Assurance (QA) systems in the
Procurement cycle by setting up QA cell at the Plants,
developing a QAP and setting up checks and controls
within the Procurement Contracts. This will also require
training for Plant Personnel in QA related aspects
Optimization of Inventory levels releasing idle working
capital through review of inventory holding, reorder levels,
creation of a high value spares bank by inventory pooling,
standardization of stores items, automatic procurement
protocols on reorder level basis for fast moving
consumption items.
Organizational Culture &
Climate
Performance Management System by designing the job
description for all positions along with formulating Key
Performance Indicators and Key Result Areas for the
positions. This shall need to be complemented through a
KPI monitoring mechanism through a base line study and
establishing targets and review principles. Improving the
existing system of Training & Development through
conducting a Training Needs Analysis exercise ,
formulating the training scope and strategy along with
developing training course materials and conducting
Training for the Plant Personnel.

Page | 76
6. Conclusion & Recommendation
It‟s important to have competition in Indian Power Generation. The private
sector will bring investment and technology with them that will help in bridging the
gap of the demand and the supply at a faster rate they will in the improvement in the
performance of the existing power plants and thus help in the improvement of the
asset optimization framework and also help in sharing the risk of the owners.
We have enough evidence from both public and private sector which indicates
movement in similar direction. Various other sectors in order to improve the
performance and to speed up the growth have moved to similar line. The telecom
sector the distribution sector the software industries are some example.
As in the case of Sterlite Energy Limited it is observed that asset optimization
programme has positive impact on overall operation of the organization with
significant financial benefits as well. It led to increase return from existing facilities.
The benefits would be better realised if asset optimization programme is
carried forward along with Perform Achieve & Trade (Annexture III) scheme.
Participating in PAT will enhance the monetary benefit of AO and support the
organization‟s drive towards minimizing environmental impact.

Page | 77
ANNEXURE-I
„5-S‟ Work Place Management
What are 5-S?
Five 'S' is an integrated concept for Work Place management.
1-S: SEIRI:
Organization or re-organization is to sort out unnecessary items in the work
place and apply stratification management to discard them e.g. Things not
belonging to that area to be removed from there. If repairing is required,
separate them and get them repaired. If it has to be discarded, decide first
whether it has some scrap value, then sell them at the right time. If the item is
all right but not useful to you, and you can‟t sell them, but can be utilized by
someone else, who needs it send it to them. Items which need to be discarded
must be discarded in such a way that what is discarded will not harm society,
environment and even animals.
2-S: SEITON:
Neatness: Put the things in a proper neat way. Everything should have a
place and everything should be in its place. Decide the place, mark the
place, put label on items. Arrange the items in such a way so that they can be
picked up easily for use. During storage, keep in mind the height, weight, size,
shape, safety etc. of the item. Functional storage of items will help in our day
to-day use and functioning.
3-S: SEISO:
Cleaning: Here cleaning is in the form of cleaning inspection. When we are
doing cleaning, we are also inspecting simultaneously, if something is
unnecessary we are discarding those things under 1S and if during cleaning we
have seen that any item is not kept in its proper place and we put them in its
place, then we are doing under 2S. Hence whenever we are doing „3S‟, it
means that we are doing „1-S‟ and „2-S‟ simultaneously. In addition, we also
check for the health of the machine, the lubrication, electrical connections etc.

Page | 78
Clean your work place completely so that there should not be any dust on
the floor, walls, windows, desk, table, machinery etc. Cleaning should be done
at Macro level first and then individual item wise and finally at micro level.
4-S: SEIKETSU:
Standardization: When we are doing 1-S, 2-S and 3-S, we may be facing
number of problems. In „1-S‟ it is very easy to discard items, but think why
this has become unnecessary, in „2-S‟ if things are not in proper place we
simply put them back in their proper place. Here, we have to think why this
has happened. In 3-S, area is dirty we clean it. Here, again we have to think as
to why this had become dirty. What is the system of cleaning, can we change
the equipment/way of cleaning, can we arrest the source by which the area has
become dirty. All these thinking will give some solution through Brain
Storming. Try to find out good solutions and standardise them as a part of the
system.
5-S: SHITSUKE:
Discipline: This means whatever system we are having or developed under
„4-S‟ they have to be followed in such a way that, standard practices become a
part of our lives. This will help to maintain high levels of work place
organization at all the time.

Page | 79
ANNEXURE-II
Management Information System

Page | 80
Bibliography
The Electricity Journal, May”, 1995 issue.
Building energy efficiency and the remuneration of operation and maintenance
personnel, Francis W.H. Yik, W.L. Lee, C.K. Ng, (2002)
"Entrepreneurial Orientation and the Franchise System: Organizational Antecedents
and Performance Outcomes", Olufunmilola (Lola) Dada, Anna Watson, (2013).
Report of the Working Group on Power for Eleventh Plan (2007-12)
o Volume – II Main Report, Government of India, Ministry of Power, New
Delhi, February 2007.
Indian energy book-2012, World Energy Council
Operation Performance of Generating Stations in the Country during the Year „10-11
o Grid Operation & Distribution Wing Operation Performance Monitoring
Division New Delhi April, 2011
Load Generation Balance Report
o 2011-12 Government of India, Ministry of Power, Central Electricity
Authority
Emerging opportunities and challenges, Indian Energy Congress- 2012- PWC
Report of the Working Group on Power for Twelfth Plan (2012-17)
Government of India, Ministry of Power, New Delhi, January 2012
POSITION PAPER ON THE POWER SECTOR IN INDIA
Department of Economic Affairs, Ministry of Finance, Government of India,
December 2009
Delivering the PPP promise*- A review of PPP issues and activity, PWC
Operation and Maintenance: Power Projects 7th February, 2012 The Crowne Plaza,
New Delhi.
www.indianbusiness.nic.in
www.energywatch.org.in
www.projectmonitor.com
www.investopedia.com
www.indiacore.com
www.prayaspune.com
www.powermin.nic.in
www.cea.nic.in