EFFICACY OF EXOGENOUS PHYTASE AND PROTEASE ENZYMES …
96
Department of Animal and Wildlife Sciences University of Pretoria Page | i EFFICACY OF EXOGENOUS PHYTASE AND PROTEASE ENZYMES ON PERFORMANCE AND GASTRO-INTESTINAL HEALTH IN BROILER CHICKENS By Phokela Jonathan Segobola Submitted in partial fulfilment of the requirements for the degree MASTER OF SCIENCE IN AGRICULTURE MSc. (Agric) ANIMAL SCIENCE In the Faculty of Natural and Agricultural Sciences Department of Animal and Wildlife Sciences University of Pretoria, Pretoria 0002 South Africa November 2016 © University of Pretoria
Transcript of EFFICACY OF EXOGENOUS PHYTASE AND PROTEASE ENZYMES …

Department of Animal and Wildlife Sciences
University of Pretoria
Page | i
EFFICACY OF EXOGENOUS PHYTASE AND PROTEASE ENZYMES
ON PERFORMANCE AND GASTRO-INTESTINAL HEALTH IN
BROILER CHICKENS
By
Phokela Jonathan Segobola
Submitted in partial fulfilment of the requirements for the degree
MASTER OF SCIENCE IN AGRICULTURE
MSc. (Agric) ANIMAL SCIENCE
In the
Faculty of Natural and Agricultural Sciences
Department of Animal and Wildlife Sciences
University of Pretoria, Pretoria 0002
South Africa
November 2016
© University of Pretoria

Department of Animal and Wildlife Sciences
University of Pretoria
Page | ii
DECLARATION
I, Phokela Jonathan Segobola declare that the thesis/dissertation, which I hereby submit for the
degree M.Sc. (Agric) Animal Science at the University of Pretoria is my own work and has
not previously been submitted by me for a degree at this or any other institution.
_____________________ Date: 30 November 2016
Mr. Phokela Jonathan Segobola
© University of Pretoria

Department of Animal and Wildlife Sciences
University of Pretoria
Page | iii
TABLE OF CONTENTS
DECLARATION ii
TABLE OF CONTENTS iii
LIST OF TABLES v
LIST OF FIGURES vii
ACKNOWLEDGEMENTS viii
LIST OF ABBREVIATIONS ix
ABSTRACT x
CHAPTER 1 1
INTRODUCTION 1
CHAPTER 2 2
LITERATURE REVIEW 2
2.1 Introduction 2
2.2 Enzymes in maize-soya based diets 4
2.3 Mode of action of enzymes 4
2.4 Limitation to enzyme digestion 6
2.5 The role of enzymes in feed ingredient and nutrient digestion 6
2.6 Anti-nutritional factors and functions of exogenous enzymes 8
2.7 Strategic selection of exogenous enzymes 16
2.8 Benefits of feeding enzyme cocktails 17
2.9 Enzymes and other additives 18
2.10 Gut health and morphology 18
2.11 Motivation for the study 19
2.12 Hypotheses 21
CHAPTER 3 22
MATERIALS AND METHODS 22
3.1 Preparation of the experimental diets 22
3.2 Performance trial 33
3.3 Gut health measurements 34
3.4 Bone measurements 36
3.5 Chemical analysis of feed 36
3.6 Measurements of broiler performance 40
3.7 Measurements of bone density 40
3.8 Statistical analysis 41
CHAPTER 4 42
RESULTS 42
© University of Pretoria

Department of Animal and Wildlife Sciences
University of Pretoria
Page | iv
4.1 Performance trail 42
4.2 Bone and gut parameters 55
CHAPTER 5 61
DISCUSSION 61
FINANCIAL IMPLICATION 66
CHAPTER 6 68
CONCLUSIONS 68
GENERAL CONCLUSIONS 70
CRITICAL REVIEW 71
CHAPTER 7 72
REFERENCES 72
© University of Pretoria

Department of Animal and Wildlife Sciences
University of Pretoria
Page | v
LIST OF TABLES
Table 2.1: Types of exogenous enzymes, target substrats and production organism (Munir and
Maqsood, 2013) 3
Table 2.2: Ileal phytate P digestibility in broiler chicken fed maize/soybean meal based diets
without and with phytase supplementation (Slominski, 2011) 12
Table 2.3: Apparent CP and ileal amino acid digestibilities (%) of diets supplemented with graded
levels of protease and fed to 22 days old broiler chickens (Angel et al., 2011) 15
Table 3.1: Description of the treatment groups and experimental diets 23
Table 3.2: Manufacturer’s recommended enzyme nutrient contribution in g/kg of complete feed
and enzymes matrix values of enzyme products in g/kg for meat type poultry 25
Table 3.3: Calculated enzymes matrix values for 3kg premix (g/kg) and percentage nutrient
contribution for broiler starter and finisher diets 26
Table 3.4: Raw material composition of experimental starter diets expressed on a fed basis (g/kg)27
Table 3.5: Formulated nutrients values for broiler starter 28
Table 3.6: Nutrient analysis of the experimental starter diets expressed on as is basis (g/kg) 29
Table 3.7: Raw material composition of experimental finisher diets expressed on a fed basis (g/kg)
30
Table 3.8: Formulated nutrient values for broiler finisher 31
Table 3.9: Nutrients analysis of the experimental finisher diets expressed on as is basis (g/kg) 32
Table 3.10: Vaccination program used during the trial period 34
Table 4.1: Least square means of weekly average body weights (BW) of broilers on day 0 to 34
days of age (g/bird) 43
Table 4.1: Least square means of average daily weight gain (ADG) for broilers from day 0 to 34
days of age (g/bird) 45
Table 4.2: Least square means of average daily feed intakes for broilers from day 0 to 34 days of
age (g/bird) 47
Table 4.3: Least square means of cumulative feed intakes (CFI) from day 0 to 34 days of age
(g/bird) 49
Table 4.4: Least square means of weekly feed conversion from day 0 to 34 days of age (g/bird) 50
Table 4.5: Least square means for feed conversion ratio for different treatments from day 0 to day
34 52
Table 4.6: Least square means for average weekly mortality (%) for different treatments from day 0
to day 34 of age 54
© University of Pretoria

Department of Animal and Wildlife Sciences
University of Pretoria
Page | vi
Table 4.7: Least square means of the duodenal and jejunum villi length (VL) and crypt depth (CD)
and VL:CD 56
Table 4.8: Least square means of metatarsal bone mineral measurements 60
Table 5.1: Financial calculation of margin over feed cost for exogenous enzyme(s) supplementation
in broiler starter feed compared to Positive control diets 66
Table 5.2: Financial calculation of margin over feed cost for exogenous enzyme(s) supplementation
in broiler starter feed compared to Positive control diets 67
© University of Pretoria

Department of Animal and Wildlife Sciences
University of Pretoria
Page | vii
LIST OF FIGURES
Figure 2.1: Myo-inositol 1, 2, 3, 4, 5, 6 – hexakis dihydrogen phosphate (IP6) (IUPAC, 1968) 10
Figure 4.1: Body weight of broilers from day 0 to 34 of age 43
Figure 4.2: Weekly average daily weight gain from day 0 to 34 days of age 46
Figure 4.3: Weekly average feed intakes from day 0 to 34 days of age 48
Figure 4.4: Cumulative feed intakes from day 0 to 34 days of age 49
Figure 4.5: Graphical representation of weekly feed conversion ratios from 0 to 34 days of age 51
Figure 4.6: Graphical representation of feed conversion ratio from 0 to 34 days of age 53
Figure 4.7: Weekly mortalities from 0 to 34 days of age 55
Figure 4.8: Graphical representation of villi length to crypt depth ratios of duodenum of a broiler at
28 days of age 57
Figure 4.9: Haematoxylin and eosin staining. Cross section of the duodenum tissue specimen of a
broiler chicken at 28 days of age. 58
Figure 4.10: Graphical representation of villi length to crypt depth ratios of the jejunum of a broiler at
28 days of age 58
Figure 4.11: Haematoxylin and eosin staining slides. Cross section of the jejunum tissue specimen of
a broiler at 28 days of age. 59
© University of Pretoria

Department of Animal and Wildlife Sciences
University of Pretoria
Page | viii
ACKNOWLEDGEMENTS
I am grateful to have been given the opportunity to carry my project under the guidance of Dr Christine
Jansen van Rensburg. Thank you for your scientific inputs, patience, constructive criticism and
determination to see the project to success.
Many thanks to DSM Nutritional Products for providing financial support, premixes and enzymes for
the trial. My sincere gratitude goes to Mrs. Annekie O’Rourke for giving me the opportunity to be
involved with DSM research project. To Mr. Francois Nell, thank you for assisting with the trial set up
and constant guidance throughout.
Thank you to the Nutri Lab staff for all your hard work. Marie Smith and Roelf Coertze for your
assistance with statistical analysis, much appreciated.
Pennville Animal Nutrient Solutions for accurate mixing of trial feed.
Thanks to Bonita and James, for their dedicated assistance with the day to day management of the poultry
house. Many thanks to Njabulo and the M.Sc. students for helping with the weighing and catching.
My parents, sister and brother for the courageous support, special thanks to my brother Madimetja for
physically helping out during late hours. Special appreciation goes to my son Maduele and my wife Jane
for their understanding and courageous support throughout.
Almighty God, for always giving me undistracted Strength, Wisdom, Courage, Persistence and
for His grace.
© University of Pretoria

Department of Animal and Wildlife Sciences
University of Pretoria
Page | ix
LIST OF ABBREVIATIONS
AA Amino Acids
AGP Antimicrobial Growth Promoter
AIA Acid Insoluble Ash
ANF Anti-Nutritional Factors
AME Apparent Metabolisable Energy
BBI Bowman-Birk inhibitor
BWG Body Weight Gain
BW Body weight
CFI Cumulative Feed Intake
CP Crude Protein
CRD Completely Randomised Design
CFCR Mortality corrected feed conversion ratio
ECP Embryonic Chicken Pepsin
GT Granulated Thermostable
FCR Feed Conversion Ratio
GE Gross Energy
GRP Gastrin Releasing Peptide
IP Inositol Phosphate
KSTI Kunitz Inhibitors
ME Metabolisable Energy
MoFC Margin Over Feed Cost
nPP none Phytate Phosphorus
PA Phytic Acid
Pi Inorganic Phosphorus
PP Phytate Phosphorus
PROT Protein
ROI Return On Investment
SMB Soya Bean Meal
SOS Sudden Death Syndrome
XAP Xylanase, Amylase, Protease
WPS Water Soluble Phosphate
© University of Pretoria
Department of Animal and Wildlife Sciences
University of Pretoria
Page | x
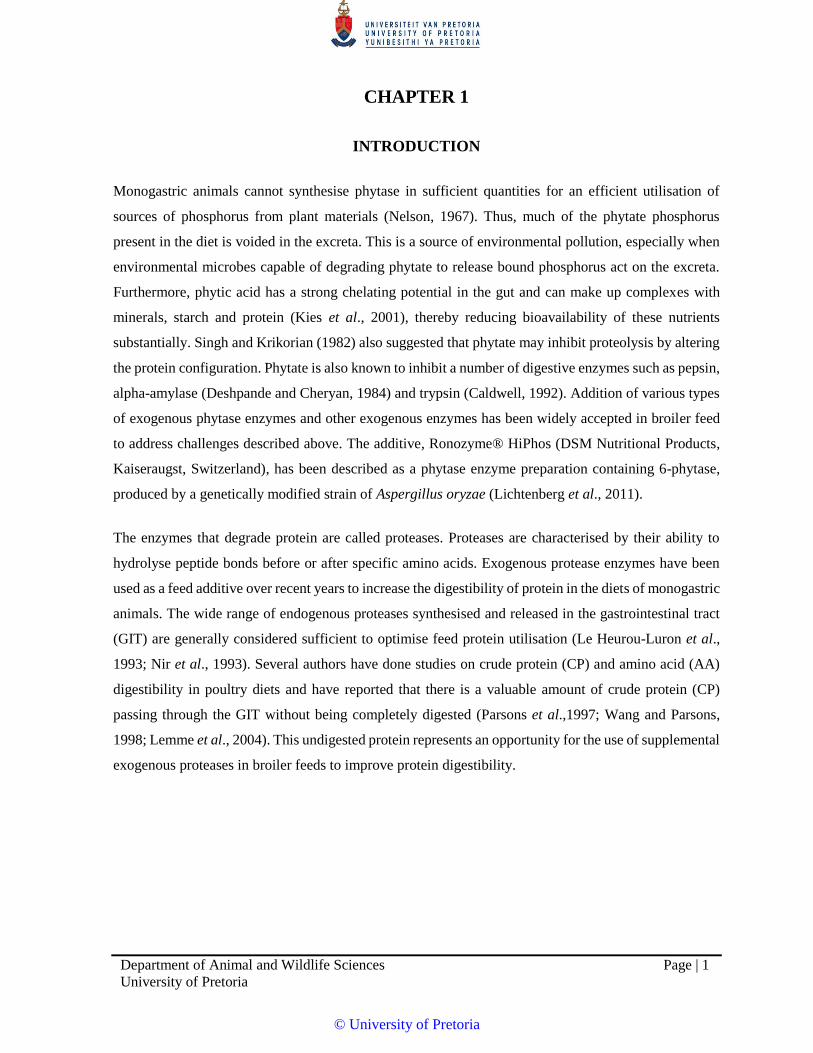
ABSTRACT
The efficacy of exogenous phytase and protease, alone and in combination, or in combination with AGP,
zinc bacitracin on performance and intestinal morphology in broilers was tested. Broilers were fed a diet
containing nutrients at recommended levels (positive control, PC) with no enzyme supplementation or a
diet with lower nutrient density than PC, either without enzyme supplementation (negative control, NC)
or with enzyme(s) (Treatments, Trt). Nutrient specifications of NC1, 2 and 3 diets were decreased by
levels expected to be made available by Ronozyme® HiPhos, Ronozyme® ProAct and a combination of
Ronozyme® HiPhos and ProAct, respectively. The NC1, 2 and 3 diets contained the same level of
nutrients than the NC counterpart, but with the respective enzymes supplemented to the diets. At 34d of
age, body weight (BW), but not feed intake (FI), of NC1 was lower (P<0.05), and feed conversion ratio
(FCR) not significantly different than PC. With the addition of 100 mg/kg of a phytase product (Trt1),
no difference in performance of broilers was noted compared to PC. Broilers in NC2 and Trt2 groups
did not differ in performance from PC, suggesting that nutrients in NC2 were not lowered sufficiently to
limit performance. BW and FI, of NC3 was lower and FCR was not significantly different than PC. With
the addition of phytase and protease (Trt3), performance of broilers was similar to PC. Addition of zinc
bacitracin to Trt3 did not improve any of the performance parameters compared to Trt3. There was no
difference in metatarsal bone ash mass, ash concentrations, densities and percentage Ca and P of birds
fed PC or NC or diets supplemented with enzymes. While no differences were found for the ileum,
phytase supplementation to the diet increased the duodenal villi length: crypt depth from 8.20 (PC) to
10.75 and 10.79 (Trt1 and Trt3, respectively). No differences in this ratio were noted between PC and
the NC diets. The addition of phytase, alone and in combination with a protease, increased the available
nutrient levels, improved duodenal villi height to crypt depth ratio and subsequently improved broiler
production. The study was therefore conducted to determine the efficacy of exogenous phytase and
protease, alone and in combination, or in combination with AGP, zinc bacitracin on performance and
intestinal morphology in broilers from day old to 35 days of age.
© University of Pretoria
Department of Animal and Wildlife Sciences
University of Pretoria
Page | 1
CHAPTER 1
INTRODUCTION
Monogastric animals cannot synthesise phytase in sufficient quantities for an efficient utilisation of
sources of phosphorus from plant materials (Nelson, 1967). Thus, much of the phytate phosphorus
present in the diet is voided in the excreta. This is a source of environmental pollution, especially when
environmental microbes capable of degrading phytate to release bound phosphorus act on the excreta.
Furthermore, phytic acid has a strong chelating potential in the gut and can make up complexes with
minerals, starch and protein (Kies et al., 2001), thereby reducing bioavailability of these nutrients
substantially. Singh and Krikorian (1982) also suggested that phytate may inhibit proteolysis by altering
the protein configuration. Phytate is also known to inhibit a number of digestive enzymes such as pepsin,
alpha-amylase (Deshpande and Cheryan, 1984) and trypsin (Caldwell, 1992). Addition of various types
of exogenous phytase enzymes and other exogenous enzymes has been widely accepted in broiler feed
to address challenges described above. The additive, Ronozyme® HiPhos (DSM Nutritional Products,
Kaiseraugst, Switzerland), has been described as a phytase enzyme preparation containing 6-phytase,
produced by a genetically modified strain of Aspergillus oryzae (Lichtenberg et al., 2011).
The enzymes that degrade protein are called proteases. Proteases are characterised by their ability to
hydrolyse peptide bonds before or after specific amino acids. Exogenous protease enzymes have been
used as a feed additive over recent years to increase the digestibility of protein in the diets of monogastric
animals. The wide range of endogenous proteases synthesised and released in the gastrointestinal tract
(GIT) are generally considered sufficient to optimise feed protein utilisation (Le Heurou-Luron et al.,
1993; Nir et al., 1993). Several authors have done studies on crude protein (CP) and amino acid (AA)
digestibility in poultry diets and have reported that there is a valuable amount of crude protein (CP)
passing through the GIT without being completely digested (Parsons et al.,1997; Wang and Parsons,
1998; Lemme et al., 2004). This undigested protein represents an opportunity for the use of supplemental
exogenous proteases in broiler feeds to improve protein digestibility.
© University of Pretoria

CHAPTER 1 INTRODUCTION
Department of Animal and Wildlife Sciences
University of Pretoria
Page | 1
Ronozyme® ProAct (DSM Nutritional Products Kaiseraugst, Switzerland) is described by Fru-Nji et al.
(2011) to be a purified mono-component serine protease expressed in Bacillus licheniformis, which is
heat stable at the activity of 75,000 PROT/g. One protease unit is equivalent to one PROT which is
defined as the amount of enzyme that releases 1mmol of p-nitro-aniline from 1mM substrate (Suc-Ala-
Ala-Pro-Phe-pNa) per minute at pH of 9 and 37 oC. Ronozyme® ProAct GT is stable to processing
temperature of up to 95 oC (Fru-Nji et al., 2011).
© University of Pretoria
Department of Animal and Wildlife Sciences
University of Pretoria
Page | 2
CHAPTER 2
LITERATURE REVIEW
2.1 Introduction
Zakaria et al. (2010) described the use of exogenous feed enzymes in monogastric diets as an effective
tool to allow flexibility in diet formulation and to lower feed cost, improve digestibility of feed and
reduce environmental pollution. For optimal efficiency, exogenous enzymes need to complement the
function of the endogenous enzymes secreted by the animal itself (Doskovic et al., 2013). In addition,
the quality of the dietary ingredients or primarily the substrate concentration is crucial in the
responsiveness of feed to enzyme supplementation (Cowieson and Ravindran, 2008).
The success of exogenous feed enzymes in improving utilisation of raw ingredients and in animal
performance has resulted in the introduction of a number of commercial enzyme products to the feed
industry as illustrated in Table 2.1.
© University of Pretoria

CHAPTER 2 LITERATURE REVIEW
Department of Animal and Wildlife Sciences
University of Pretoria
Page | 3
Table 2.1: Types of exogenous enzymes, target substrates and production organism (Munir and Maqsood, 2013)
Enzyme name Classification Production organism Targeted function
α – Amylase Carbohydrase Aspergillus ssp, Bacillus spp, Rhizopus Starch hydrolysis
Maltogenic amylase Carbohydrase Bacillus subtilis, d- Balillus
stearothemophilus
Starch hydrolysis and production of
maltose
β – Amylase Carbohydrase Barley malt Starch hydrolysis and production of
maltose
Cellulase Carbohydrase Aspergillus niger Cellulose breakdown
α –Galactosidase Carbohydrase Aspergillus niger, Morteirella vinaceae var,
Saccharomyces spp.
Oligosaccharides hydrolysis
β – Glucanase Carbohydrase Aspergillus spp, Bacillus spp, β-glucans hydrolysis
β – Glucosidase Carbohydrase Aspergillus niger Hydrolyses cellulose degradation
products to glucose
Glucoamylase
(amylo-glucosidase)
Carbohydrase Aspergillus niger, Apergillus oryzae,
Rhizopus niveus, Rhizopus oryzae
Starch hydrolysis with production of
glucose
Hemicellulase Carbohydrase Aspergillus spp, Bacillus spp, Humicola
spp, Trichoerma spp
Break down hemicellulose
Invertase Carbohydrase Aspergillus niger, Sacchatomyces spp Hydrolyse sucrose to glucose and
fructose
Lactase Carbohydrase Aspergillus niger, Aspergillus oryzae, Hydrolyse lactose to glucose and
galactose
β – Mannanase Carbohydrase Aspergillus niger, Bacillus lentus,
Trichoderma spp. Trichoderma reeseic
Beta-mannans hydrolysis
Pectinase Carbohydrase Aspergillus niger, Rhizopus oryzae,
Aspergillus aculeatus
Pectin hydrolysis
Pullulanase Carbohydrase Bacillus acidopullulyticus Starch hydrolysis
Xylanase Carbohydrase Aspergillus spp, Bacillus spp, Humicola
spp., Penicilin spp., Trichoderma spp.
Xylan hydrolysis
Lipase Lipase Aspergillus niger, Candida spp,
Rhizomucor spp, Rhizopus spp.,
Hydrolyses triglycerides,
diglycerides and glycerol
monoesters
Bromelian Protease Pineapple (Ananas comosus) stem and fruit Protease hydrolysis
Ficain Protease Ficus glabrata Protease hydrolysis
Keratinase Protease Bacillus licheniformis Protease hydrolysis
Papain Protease Papaya (Carica papaya) Protease hydrolysis
Pepsin Protease Animal stomach Protease hydrolysis
Protease Protease Aspergillus niger, Aspergillus spp, Bacillus
spp.
Protease hydrolysis
Trypsin Protease Animal pancreas Protease hydrolysis
Catalase Oxidoreductase Aspergillus niger variants, mycrococcus
lysodeikticus
Produces water and oxygen from
hydrogen peroxide
Glucose oxidase Oxidoreductase Aspergillus niger Degrade glucose to hydrogen
peroxide and gluconic acid
Phytase Phytase Aspergillus niger Phytate hydrolysis
© University of Pretoria

CHAPTER 2 LITERATURE REVIEW
Department of Animal and Wildlife Sciences
University of Pretoria
Page | 4
2.2 Enzymes in maize-soya based diets
The early research work done on efficacy of exogenous enzymes focused on wheat and barley based
diets and alleviation of anti-nutritional properties of soluble high molecular weight pentosans. However,
much less work was done on non-viscous grain pentosans such as maize and sorghum (Choct, 2006).
Bach Knudsen (1997) reported that enzyme supplementation to maize based diets has been ignored due
to low concentrations of soluble NSPs of less than 1 g/kg compared to that of wheat of 25 g/kg. Cowieson
et al. (2006), D’Alfonso (2005) and Ravindran et al. (2006) described the low maize solubility being
related to variation in solubility and digestibility of starch and protein as well as the content and relative
reactivity of phytate.
The effectiveness of exogenous enzymes provides the potential to strategically formulate maize-soya
diets by taking into account the relative concentration of indigestible starch, protein and phytate in feed
ingredients. The supplementation of a combination of exogenous carbohydrases, proteases and phytases
to the maize-soya diets allow for the expected significant improvement in digestibility of Ca, P, energy
and amino acids (Cowieson et al., 2006 a and b).
2.3 Mode of action of enzymes
The mechanism of action of supplemental exogenous enzymes to improve profitability of poultry
production was described by Cowieson et al. (2010) as enhancing the apparent digestibility of dietary
nutrients and reducing nutrient requirements of the animal itself. Successful application of exogenous
enzymes to dry diets presupposes that the enzyme will be active in the digestive tract of the animal, and
it must therefore fulfil a number of criteria (Thorpe and Beal, 2001). The enzyme must be active under
the physiological conditions prevailing in the animal’s digestive tract, meaning it must be able to resist
proteolysis by the animal’s endogenous proteases rather than antagonise the animal’s digestive enzymes.
Species differences in the anatomy and physiology of the digestive tract are likely to affect exogenous
enzyme activity in this respect. Partridge (1993) and Dierick and Decuypere (1994) illustrated some of
the species differences in the utilisation of enzymes between poultry and pigs as follows:
1. Anatomical: In poultry, feed passes into the crop, where any added enzymes can act for several
hours at a pH of approximately 6.0 before passing into the acid environment of the gizzard,
whereas in the pig, feed passes directly into the acid environment of the stomach immediately
after ingestion.
© University of Pretoria
CHAPTER 2 LITERATURE REVIEW
Department of Animal and Wildlife Sciences
University of Pretoria
Page | 5
2. Digestive capacity: Poultry have a relatively shorter small intestine and thus reduced possibilities
for enzyme inactivation by the microflora, a shorter mean retention time in the small intestine (1
- 2 hours in poultry versus 4 - 5 hours in the pig) and lower water content in the upper part of the
gastrointestinal tract.
3. Bacterial activity: The importance of the microflora in the gut of poultry is much less than in the
pig.
4. Fibre fermentation: Less fermentation of fibre in poultry than in pigs, due to the much smaller
hind gut in poultry.
© University of Pretoria

CHAPTER 2 LITERATURE REVIEW
Department of Animal and Wildlife Sciences
University of Pretoria
Page | 6
Effectiveness of the enzymes in the digestive tract of animals varies widely, for example, Thacker and
Baas (1996) and Baas and Thacker (1996) demonstrated that 84% of pentosanase and 26% of alpha-
glucanase activity was recovered in the duodenal digesta of pigs 4 hours after feeding diets supplemented
with these enzymes. Approximately 75% of exogenous protease has been detected in the ileal digesta of
young pigs fed protease-supplemented diets.
2.4 Limitation to enzyme digestion
There is extensive research work reporting that maize-soya diets are highly digestible with at least 85%
to 90% of starch, protein and lipids digested. In some diets, digestibility can be as low as 75% allowing
for significant response to enzyme supplementation. Ravindran (2013) described that the digestibility of
maize-soya diets could not be improved close to 100% due to restriction by the amount of substrate,
enzyme characteristics and physiological limitation of the bird. This author reported that in maize-soya
poultry diets, undigested nutrient fractions targeted by enzyme contribution is 25% to 35%. Ravindran
(2013) further described prerequisites for effective exogenous enzyme action as: enzyme source, specific
catalytic activity, resistance to pepsin proteolytic action; substrate concentration and accessibility; and
the physiological state of the digestive tract (pH, moisture content, temperature and the resident time of
the digesta in the gut, especially in the gastric phase as the main point of enzymatic action).
2.5 The role of enzymes in feed ingredient and nutrient digestion
2.5.1 Phosphorus and calcium
In animal feedstuffs, much so in poultry, phosphorus (P) is the third most expensive ingredient after
energy and amino acids. Therefore, sustainable animal production requires optimal utilisation of P to
reduce the cost of feeding. The role of P in animal nutrition has been reviewed by Applegate and Angel
(2008). In their review the authors explained some of the essential roles such as the contribution in
cellular metabolism and energy currency of the cell, intracellular regulatory mechanisms as well as
structural processes such as bone formation. Bone is the main storage organ for P containing 85% of the
body’s total P. Phosphorus is essential in biological systems due to its involvement in both structural and
metabolic processes. It is therefore required for animal production to attain their optimal genetic potential
in growth, feed efficiency and skeletal development.
© University of Pretoria

CHAPTER 2 LITERATURE REVIEW
Department of Animal and Wildlife Sciences
University of Pretoria
Page | 7
The macro-minerals, Ca and P, are the two most abundant minerals in bone constituting approximately
37% and 17% bone ash, respectively (Doyle, 1979). Supply of Ca and P to the animal requires a careful
balance to avoid imbalances that could potentially result in a deficiency of either one or both. The main
consequence of suboptimal levels of these minerals is rickets, caused by either a Ca deficiency or P
deficiency, which may occur when the dietary content of either nutrient is too low, or the dietary content
of one is too high that induces a deficiency of the other.
Kling (1985) has associated elevated incidences of tibial dyscondroplacia (TD) as another consequence
of a sub-optimal supply of Ca and P and subsequent imbalance of Ca: P ratios. There are several other
factors that can lead to P metabolic conditions such as TD even under an optimal P feeding regime, but
rickets should be preventable by correct diet formulation. Calcium has been found to be one of the
minerals that are not only abundant but highly available from most sources. On contrary, P availability
varies widely depending on the source (Whitehead et al., 2004). The differences in the availability of
these nutrients and the importance of maintaining a balanced ratio, together with avoiding excessive use
of P to minimise pollution, dietary levels often fails to meet the requirements (Whitehead et al., 2004).
The availability of dietary P in cereal grains is further complicated by binding of the nutrient in phytate
molecules.
2.5.2 Protein
Hughes and Choct (1999) discussed protein digestion and the complexity of high protein raw ingredients
in poultry diets. The authors reported that protein raw ingredients differ in their chemical composition
and also form linkages with other types of proteins, lipids and carbohydrates in a way that complexity
may affect protein digestibility. Angkanaporn et al. (1994) quantified reduction in protein digestibility
as a result of a depression in digestion of both endogenous and exogenous protein and a subsequent
increase in endogenous secretion of amino acids. Anti-nutritive factors were reported by Hughes and
Choct (1999) as one of the major factors affecting apparent protein digestion and utilisation by the animal.
Bryden (1996) referred to protease inhibitors, lectins, poly-phenolic compounds, saponins, non-starch
polysaccharides and phytate as some of the main anti-nutritive factors found in grain legumes and oil
seed meals.
© University of Pretoria

CHAPTER 2 LITERATURE REVIEW
Department of Animal and Wildlife Sciences
University of Pretoria
Page | 8
Proteins in their nature are heat labile and so are most of the oil seed meals that are extensively used in
poultry diets as sources of protein. The research approaches to improve protein digestibility and
utilisation of ingredients include feed processing and the application of exogenous enzymes. Optimal
processing conditions were reported to be an important factor for improvement of protein digestion.
Friedman (1996) reported that heat treatment may reduce protein quality in the presence of carbohydrates
by the Maillard reaction, protein crosslinking and amino acid racemisation. The ingredients that are not
plant based such as meat meal may vary in the amino acid digestibility due to slaughtering age, time
between slaughter and rendering and the duration of the rendering process (Skurray, 1974).
2.6 Anti-nutritional factors and functions of exogenous enzymes
Enzymes have been used for poultry diets to neutralise the effects of different types of anti-nutritive
factors in grains and cereals. These anti-nutritive factors are undesirable as they reduce digestion and
absorption of nutrients in the diet. There has been an adequate amount of research data showing phytase
enzymes as a feed additive, as it does not only increase the availability of phosphate in plants but also
reduces environmental pollution by reducing the amount of undigested nutrients egested by the animal.
Several other enzyme products are available in the market and are still being evaluated in the feed
industry. Those include protease to enhance protein digestion, lipases to enhance lipid digestion, ß-
galactosidases to neutralise certain anti-nutritive factors in non-cereal feedstuffs, and amylase to assist
in the digestion of starch in young monogastric animals (Khattak et al., 2006).
2.6.1 Non-starch polysaccharides
Non-starch polysaccharides (NSP) in animal feedstuffs are a complex group of components differing
widely in chemical composition, physical properties and physiological activity. NSP includes celluloses,
hemicelluloses and pectins. Masey O’Neill et al. (2014) described cellulose as the most abundant organic
macromolecule consisting of hydrogen-bonded micro-fibrils, comprised of β-1,4-glucose chains while
hemicelluloses include pentosans (in particular arabinoxylans) and β-glucans, as well as mannans,
arabinans, galactans and xyloglucans. Cereal plants mostly consist of pectins, described by Theander et
al. (1989) and Somerville et al. (2004) as pectic polysaccharides containing uronic acid.
© University of Pretoria

CHAPTER 2 LITERATURE REVIEW
Department of Animal and Wildlife Sciences
University of Pretoria
Page | 9
Non-starch polysaccharides directly affect nutrient utilisation by either encapsulating nutrients and/or
depressing digestion through gastrointestinal modifications. The viscous nature of the NSP is the primary
cause for their anti-nutritive effect in poultry, because of the increased bulk and viscosity of the intestinal
contents that decrease the rate of diffusion of substrates and digestive enzymes and hinder their effective
interaction at the mucosal surface (Choct et al., 1996). The concentrations of soluble NSP in wheat are
inversely correlated with their MEn-values in broiler chickens (Annison and Choct, 1991). In addition to
the direct effect of viscous NSP on gut physiology and morphology, there appear to be some indirect
effects that may have important implications on the efficient utilisation of nutrients by the chicken
(Danicke et al., 1999). One such indirect effect may be related to the gut microflora activity measured
by intestinal concentration of volatile fatty acid, the result being colonisation of bacteria in epithelium
of the small intestine as well as the caeca. Fermentation of NSP-rich diets in the gut of broilers will result
in production and accumulation of volatile fatty acids (VFA) in the lumen of the small intestine resulting
in proliferation of facultative microflora (Choct et al., 1996).
2.6.2 Non-starch polysaccharides enzymes (carbohydrases)
The ‘favourable’ mechanisms of dietary NSP-enzymes can be described: reducing the viscosity of the
digesta in the small intestine, increasing the digesta passage and nutrient digestion rate, thereby giving
less substrate and less time for the fermentative organisms to proliferate. This in turn may restore the
normal and efficient ‘endogenous’ enzymatic digestion of nutrients in the small intestine. Enzymes are
‘partially’ counterbalancing the adverse effects of soluble NSP on zoo-technical performance (Bedford
and Classen, 1992; Huyghebaert and De Groote, 1995). Moreover, the bio-efficacy of the NSP-enzymes
is correlated with the fat level and degree of saturation of fatty acids in wheat based-diets (Danicke et
al., 1999). It is, however, not possible to estimate the relative contribution of the improved nutrient
utilisation as well as the ‘selective’ reduction in microbial population.
However, there is evidence that the consequence of a NSP-mediated reduced rate of digestion is much
more radical in the presence of intestinal microflora than in their absence, being caused by the
degradation of both digestive enzymes and bile salts and microbial colonisation of the absorptive surface
area (Smits and Annison, 1996).
© University of Pretoria

CHAPTER 2 LITERATURE REVIEW
Department of Animal and Wildlife Sciences
University of Pretoria
Page | 10
2.6.3 Anti-nutrition of phytate
Phytic acid (myo-inositol 1, 2, 3, 4, 5, 6-hexakis dihydrogen phosphate) is a phosphorylated cyclic sugar
alcohol as shown in Figure 2.1. The anion form of phytic acid, phytate, is the form present in all plants.
Phytate in plants is usually chelated with cations, proteins and/or starches and this chelated form is called
phytin. Ravindran et al. (2000) and Angel et al. (2002) demonstrated that in addition to reducing the
availability of P, phytate also act as an anti-nutrient in the diet, reducing the metabolisable energy (ME)
and overall digestibility of dietary cations and amino acids. Furthermore, it was reported that adverse
effects of phytate on amino acid utilisation are associated with increased losses of endogenous amino
acids that were proportional to the concentration of phytate added to the diet (Ravindran et al., 1999;
Cowieson et al., 2004a; Cowieson and Ravindran, 2007).
Figure 2.1: Myo-inositol 1, 2, 3, 4, 5, 6 – hexakis dihydrogen phosphate (IP6) (IUPAC, 1968)
Over two thirds of P in plant based feedstuffs is not readily available in poultry as it is bound to phytic
acid (PA), which has been commonly thought to be due to the low levels of endogenous phytase
(Bedford, 2000; Woyengo & Nyachoti, 2011). Recent studies have suggested that this is not the case,
and in fact, chickens possess adequate phytase activity in the intestinal mucosa. The primary issue with
phytate digestion is poor substrate solubility in the small intestine due to cation interactions, mainly with
Ca (Maenz and Classen, 1998; Cowieson, et al. 2011). Calcium ions form insoluble complexes with
phytate phosphorus (PP), which hinder phytase activity (Angel et al., 2002). Therefore, lowering dietary
Ca levels can further improve the effect of exogenous phytase on PP degradation. The use of exogenous
phytase to assist the bird in degrading PP has become common practice. Recent studies have shown that
when adding phytase (500 FTU/kg), while at the same time lowering Ca in starter diets from 1.0% to
0.67% in combination with reduced non-PP (nPP) levels, performance of young birds was not affected
(Létourneau-Montminy et al., 2010; Powell et al., 2011).
© University of Pretoria

CHAPTER 2 LITERATURE REVIEW
Department of Animal and Wildlife Sciences
University of Pretoria
Page | 11
2.6.4 Phytase enzymes
Anti-nutritional effects of phytate can be alleviated partly by the use of exogenous phytase. A number
of peer reviewed studies have shown increased P digestibility and utilisation and hence reduced P
excretion into the environment due to phytase addition to poultry diets (Applegate et al., 2003; Penn et
al., 2004; Angel et al., 2006). The liberation of P from phytic acid by phytase has been far from complete
and studies presented in Table 2.2 have shown the level of phytate phosphorus released by addition of
phytase in poultry diets. Although it is generally accepted that with phytase supplementation, the
available phosphorus content of broiler chicken diets can be reduced by approximately 0.1 percentage
point from 0.45% to 0.35%, the phytate P digestibility values reported in Table 2.2 did not show such a
reduction.
© University of Pretoria

CHAPTER 2 LITERATURE REVIEW
Department of Animal and Wildlife Sciences
University of Pretoria
Page | 12
Table 2.2: Ileal phytate P digestibility in broiler chicken fed maize/soybean meal based diets without and with phytase supplementation
(Slominski, 2011)
Phytate released (%)
Study no. Trial length (d) Phytate P (%
of diet) Phytase (U/kg) Control Phytase
Difference
(%) Reference
1 1-21 0.31 250 0.068 0.139 0.071 Camden et al. (2001)
500 0.149 0.081
2 1-21 0.28 500 0.070 0.126 0.056 Tamim et al. (2004)
3 21-28 0.30 500 0.030 0.062 0.032 Rutherfund et al. (2004)
750 0.062 0.032
4 1-21 0.26 1000 0.076 0.130 0.054 Olukosi et al. (2007)
5 12-21 0.26 1000 0.008 0.057 0.049 Leytem et al. (2008)
6 1-21 0.31 600 0.077 0.109 0.032 Woyengo et al. (2010)
Mean 0.29 0.055 0.106 0.051
© University of Pretoria

CHAPTER 2 LITERATURE REVIEW
Department of Animal and Wildlife Sciences
University of Pretoria
Page | 13
2.6.5 Soybean and anti-nutritional factors
The level of anti-nutritional factors (ANF) in animal feed ingredients negatively affect nutrient utilisation
of ingredients and limit the level at which it can be included in the diets of poultry. The type of anti-
nutritional factors in ingredients vary between species and variety of plants (Warenham et al. 1994). Li
et al. (1991) described the high molecular weight soya proteins, glycenin and β-conglycenin, acting as
potential antigenic factors leading to the formation of serum antibodies particularly in young animals.
The different types of ANF in animal feed ingredients include protease inhibitors, lectins, tannins, phytic
acid, alkaloids, cyanogens and indigestible carbohydrates. The protease inhibitors, lectins and phytic
acid, are well described as the main ANF in soybean meal which contribute 30 to 40% of the maize-soya
poultry diets. The most abandoned serine protease inhibitors in SBM are the trypsin inhibitors namely
Kunitz inhibitors (KSTI) and Bowman-Birk inhibitor (BBI). Trypsin inhibitors inactivate the digestive
enzymes, trypsin and chymotrypsin, through binding to the active sites of these proteases, depressing the
activity in the gut. The inhibition of these proteases can result in overstimulated secretion of digestive
enzymes from exocrine pancreas and pancreatic hypertrophy (Rackis and Gumbman, 1981).
The mode of action of lectins as anti-nutritional factors in soybean meal was described by Oliveira et al.
(1989). These glycoproteins were shown to have the ability to bind to cellular surfaces through specific
oligosaccharides or glyco-peptides. Further research indicated that glycoproteins have the ability to bind
to the epithelium of small intestine and resulting in the impairment of brush border. Excessive
accumulation of these glycoprotein result in the ulceration of villi (Oliveira et al., 1989) which was
believed to be the major cause for increased endogenous nitrogen losses and depressed growth rate in
young animals (Pustzai et al., 1990).
In addition to lectins and trypsin inhibitors, complex high molecular weight oligosaccharides found in
soybean meal are verbascose, stachyose and raffinose contributing approximately 6% of soybean meal
dry matter. The limited intestinal capacity of monogastric animals to digest these oligosaccharides due
to lack of endogenous β-galactosidase was reported by Gitzelmann and Auricchio (1965) in an
experiment conducted with children. Wiggins (1984) described the ability of these complex
oligosaccharides to accumulate in the gut causing fluid retention and subsequent increased flow rate of
digesta, which reduces digestibility and absorption of nutrients.
© University of Pretoria

CHAPTER 2 LITERATURE REVIEW
Department of Animal and Wildlife Sciences
University of Pretoria
Page | 14
2.6.6 Protease enzymes
Supplementation of poultry feed with protease enzyme has been applied in recent years as a strategy to
improve protein digestibility. The effect of exogenous proteases added to poultry diets on live
performance are frequently inconsistent (Cowieson and Ravindran, 2008).
The variability and inconsistencies of the performance results can be partially attributed to the following
aspects:
a) the type of proteases tested,
b) experimental design, specifically the negative control diet nutrients and
c) the use of enzyme complexes rather than mono-component enzyme preparations.
A study was presented by Angel et al. (2011) where birds were fed a low protein diet that facilitated a
negative effect on performance. The authors reported improvement in performance when protease was
added at 200 mg/kg. Improvements in apparent CP digestibility of the protease-supplemented diets were
observed when compared with the (PC) positive control (formulated at 22.50% crude protein without
protease) or (LP0) low protein diets (formulated at 20.52% crude protein and amino acids lowered
proportional to PC, no protease supplementation). The effect on amino acid digestibility and graded
levels of supplemental exogenous protease enzymes are shown in Table 2.3.
© University of Pretoria

CHAPTER 2 LITERATURE REVIEW
Department of Animal and Wildlife Sciences
University of Pretoria
Page | 15
Table 2.3: Apparent CP and ileal amino acid digestibilities (%) of diets supplemented with graded
levels of protease and fed to 22 days old broiler chickens (Angel et al., 2011)
Nutrients PC LP0 LP100 LP200 LP400 LP800 SEM P-value
CP 75.6b 77.9b 82.6a 82.6a 82.7a 83.0a 1.3 0.0009
Arginine 86.3b 86.9b 90.1a 90.4a 91.2a 90.9a 1.1 0.0287
Isoleucine 78.1b 79.5ab 82.6a 82.3a 82.9a 83.1a 1.8 0.0361
Leucine 85.4 85.9 86.8 87.1 86.5 86.9 2.6 0.2781
Lysine 78.4b 80.6b 85.9a 85.1a 86.4a 86.6a 1.9 0.0241
Methionine 76.1b 78.4b 82.7ab 83ab 83.9a 83.2a 2.2 0.0421
Phenylalanine 81 82.7 84.2 84.7 84.4 85.1 2.8 0.0828
Threonine 74.2b 75.9b 82.2a 83.3a 83.9a 83.7a 2.4 0.0261
Valine 82.2b 83.6b 86.4ab 88.4a 86.3ab 87.1a 1.4 0.0171
Alanine 77.7 78.5 80.2 80.6 80.1 81.1 2.1 0.0976
Histidine 80.2b 82.1ab 84.2a 85.7a 85.8a 86.1a 1.7 0.0198
Aspartic acid 74.5b 76.1b 82.3a 81.6a 82.5a 82.8a 1.6 0.0103
Cysteine 76.8b 77.7b 81.8a 81.9a 82.1a 82.7a 1.5 0.0219
Glutamic acid 84.3 85.1 86.9 87.1 86.8 87.3 2.2 0.4793
Serine 72.1b 73.6b 78.2a 79.1a 78.7a 78.8a 1.7 0.0204
Tyrosine 77.9 78.9 78.4 79.9 78.4 79.2 2.5 0.1948
Proline 72.7 73.4 74.1 74.5 74 74.8 2.1 0.5159
Glycine 80 79.8 82.1 81.8 82.7 82.1 2.5 0.7434
a,b Means within rows with different superscripts differ (P < 0.05) based on Tukey’s honestly significant difference test. Positive control (PC)
and low protein (LP) diets had 22.50 and 20.52% formulated CP, respectively. Reductions in essential amino acids in LP diets were proportional
to those in CP. LP0 = 0 mg of protease/kg; LP100 = 100 mg of protease/kg; LP200 = 200 mg of protease/kg; LP400 = 400 mg of protease/kg;
LP800 = 800 mg of protease/kg. Formulated (analysed) protease (PROT units/kg) was as follows: PC, 0 (<LOD); LP0, 0 (<LOD); LP100, 7,500
(6,929); LP200, 15,000 (16,374); LP400, 30,000 (33,996); LP800, 60,000 (76,842). LOD = limit of detection
© University of Pretoria

CHAPTER 2 LITERATURE REVIEW
Department of Animal and Wildlife Sciences
University of Pretoria
Page | 16
Three mono-component proteases were also tested by Ghazi et al. (2003). Proteases from Bacillus
subtilis are active at neutral to alkaline pH and the others from Aspergillus niger are active at neutral to
acid pH. Activities of these proteases were 92,000, 36,000, and 33,000 mg respectively, of α-amino
groups formed (expressed as leucine equivalents) per minute per gram of product. These researchers
reported improvements in TME and true nitrogen digestibility when using both proteases from
Aspergillus niger but no effect for protease from Bacillus subtilis.
Walk et al. (2011) reported no effect on broiler performance with the addition of a protease extracted
from Bacillus subtilis. However, in this study the enzyme was added to a summit diet, which may account
for the lack of performance effect. Regression analysis of graded protease supplementation on
performance and AA digestibility showed no significant linear or quadratic effects. More recent studies
have shown that direct addition of a pure protease from Nocardiopsis prasina can lead to significant
increases in CP and AA digestibility in broilers fed soybean meal or full fat soybean meal (Bertichini et
al., 2009; Sorbara, 2009). It was concluded that AA utilisation was on average improved by about 5 %
in soybean meal and 6 % in full fat soybean meal. Furthermore, the same protease has been demonstrated
in several studies to have a positive impact on growth performance and N digestibility of broilers fed
complete maize-soya based diets (Angel et al., 2011; Freitas et al., 2011; Fru-Nji et al., 2011).
2.7 Strategic selection of exogenous enzymes
The strategic selection of any additive or enzyme is dependent on the nature of the positive control (or
normal diet) that is used as starting point for comparison. Cowieson and Bedford (2009) suggested that
for every 10% improvement in the digestibility of the diets there is 50% drop in enzyme efficacy.
As indicated in section 2.6.3, the level of phytate phosphorus or undigested fraction of phosphorus in
conventional poultry diets contributes 30% to 70% of the total phosphorus. The digestibility coefficient
of phosphorus is 0.30. Phytase enzyme is the easiest selection of enzymes used for poultry and pig diets.
The challenge with enzyme selection requires consideration of other non-phytate or multi-enzyme
preparations and their contribution to starch, fat and protein digestion (Cowieson, 2010). When using
different enzymes it might not be the best approach to assume that the nutrient contributions of all the
enzymes will be fully additive. It was further suggested that using one or two enzymes might be an ideal
option to target different substrates in feed ingredients. When the undigested fraction of the diets is
considered, the use of phytase, xylanase, amylase and glucanase can be recommended to offer maximum
response (Cowieson, 2010).
© University of Pretoria

CHAPTER 2 LITERATURE REVIEW
Department of Animal and Wildlife Sciences
University of Pretoria
Page | 17
2.8 Benefits of feeding enzyme cocktails
The use of exogenous multi-enzyme cocktails has been receiving more focus as the number of formulated
ingredients, enzyme types and products increase. Ohh (2011) reviewed multi-enzyme application and
reported that multi-enzyme application enhance animal performance and an effective blend of enzymes
exert relatively better response compared to single enzyme or no enzyme supplementation regardless of
the cost effectiveness. Other authors suggested that the nutritive value of maize and soybean meal based
broiler diets can be enhanced by the combination of amylase, xylanases and protease. Simbaya et al.
(1996) reported a significant improvement in performance when feeding chick diets containing a
combination of amylase, xylanase and protease (5.6% improvement in BWG and 4% in FCR). Cowieson
and Adeola (2005) observed 1.9% improvement in BWG and 2.2% in FCR while Cowieson and
Ravindran (2008) observed 5.8% improvement in BWG and 4.2% in FCR. Findings from these studies
were not attributed to individual action of one enzyme.
In another experiment by Cowieson and Odeola (2005), a cocktail of xylanase, amylase, and protease
(XAP, Danisco Animal Nutrition, UK Limited, Marlborough, Wiltshire, UK Danisco), was tested in
combination with phytase (200 mg of XAP/kg provided a guaranteed minimum of 300 units of xylanase,
400 units of amylase, and 4,000 units of protease/kg; 200 mg of phytase/kg provided a guaranteed
minimum of 1,000 units of phytase/kg). The authors reported an improvement in FCR when the cocktail
was fed alone or in combination with phytase. Combination of XAP cocktail and phytase improved BWG
significantly by 14% and ileal digestible energy by less than 100 kcal/kg. Cowieson and Odeola (2005)
further concluded that supplementation of phytase and XAP individually in a maize-soya meal based
diet is effective in improving nutrient digestibility and performance of broilers fed nutritionally marginal
diets. Furthermore, there may be an additive effect of phytase and XAP on broiler performance, giving
a cost-effective nutritional strategy for the profitable production of poultry products.
© University of Pretoria
CHAPTER 2 LITERATURE REVIEW
Department of Animal and Wildlife Sciences
University of Pretoria
Page | 18
2.9 Enzymes and other additives
The mounting pressure to reduce the use of antimicrobial growth promoters (AGP) as feed additives and
the popularity of exogenous enzymes have resulted in extensive work to evaluate the interaction of the
two. Vukic-Vranjes and Wenk (1993) evaluated the effect of barley based diets supplemented with the
antibiotic, Avoparcin, plus an enzyme complex containing β–glucanase and xylanase or Avoparcin
without the enzyme complex on body weight gain of broiler birds and they did not observe significant
difference between these two groups. Sarica et al (2005) evaluated wheat based diets supplemented with
the antibiotic, flavomycin, plus xylanase based exogenous enzymes or thyme or garlic and the effect on
body weight gain, feed intake and feed conversion ratio of broiler chickens. The author did not observe
significant difference in body weight gain between treatments from days 14 to 35 and from days 1 to 42.
In another broiler study, avilamycin plus xylanase was supplemented to wheat based diets and feed intake
was not significantly affected by this combination (Langhout & Schutte, 1995). In contrary to other
authors, Esteve-Garcia et al. (1997) compared the effect of wheat or barley based diets without
flavomycin with diets supplemented with flavomycin in combination with enzyme preparations
(xylanase or β–glucanase) on broiler performance. Wheat based diets supplemented with flavomycin and
xylanase improved feed efficiency with resultant reduction in intestinal viscosity, while xylanase
preparation alone reduced percentage viscerae mostly due to reduction in intestines. Preparation of
flavomycin and β–glucanase also improved feed efficiency and reduce viscosity and incidences of vent
pasting.
2.10 Gut health and morphology
The gastro-intestinal tract of the broiler chicken is regarded as an important organ for nutrient digestion
and absorption. It is essential for young broiler chicken to start developing this organ immediately post-
hatching. Nitsan (1991) described the rapid growth of the GIT in young broilers as necessary to allow
increased surface area for nutrient digestion and absorption. Gomide et al. (2004) correlated the
development of the intestine to nutrient feed intake and consequently resulting in increased diameter and
weight relative to body weight. This author further described the response of the intestinal mucosa to
external stressors such as the absence or presence of feed and pathogens to be the main precursors of
changes in the villus height (VH), crypt depth (CD), villus density and rate of epithelial turnover.
© University of Pretoria

CHAPTER 2 LITERATURE REVIEW
Department of Animal and Wildlife Sciences
University of Pretoria
Page | 19
The increased villi height and crypt depth ratio (VH:CD) was directly correlated with increased epithelial
cell turnover, although it leads to increased nutrient absorption and performance (Gomide et al., 2004).
In contrast, Xu et al. (2003) reported that the reduced VH to CD ratio resulted in a marked increase in
the endogenous enzyme secretion, reduced nutrient absorption, disease resistance and performance.
2.11 Motivation for the study
Most of the research work on supplementation of exogenous enzymes in broiler chickens published was
done on grains grown under different production conditions compared to South Africa. These grain will
differ in morphology and thus substrate composition. A study by Cromwell et al. (1999) compared crude
protein content of maize from 15 different states in the United States of America and established variation
of between 73.1 g/kg to 90.6 g/kg CP and 2.5 g/kg to 3.0 g/kg lysine. D’Alfonso (2002) found that total
starch content of maize varied from 645.4 g/kg to 696.2 g/kg and amylopectin content of the starch varied
from 732.5 g/kg to 828.6 g/kg across samples tested from 15 countries. Masey O’Neill et al. (2012)
stated that grains such as cereals including maize vary considerably in composition as a result of
environment, growth region, agronomic inputs and variety. Therefore, variability in the morphology of
raw ingredients such as maize which comprises up to 55% of compound broiler diets may have a
substantial effect on performance. The use of local ingredients offers an opportunity for low cost poultry
feeds. However, there is wide variation amongst these ingredients within and between countries of origin
and many times they contain high levels of anti-nutrients or components that variably affect nutrient
utilisation by the broiler chicken.
Extrapolating the data from research done in other countries to local nutrition management in broiler
production is not always ideal (Vieira et al., 2014). In addition, there is a need to understand the effect
of combining exogenous enzymes in the broiler diets and also to quantify investment on return (ROI)
through allocating sound nutrient matrix values to these products. The main question elaborating this
problem is to understand whether a combination of different enzymes, targeting similar nutrients, work
in a synergistic way which may be sub-additive, additive or antagonistic. Cowieson and Adeola (2005)
and Juanpere et al. (2005) categorised the interaction between phytase and carbohydrase enzymes to be
additive or sub-additive. Cell wall material encapsulates high NSP ingredients in the absence of
carbohydrase enzymes and thus protects the phytate to be hydrolysed by exogenous phytase, thus
limiting the efficiency of phytase enzyme. Furthermore, insufficiency of phytase enzyme will prevent
carbohydrases from liberating other nutrients that may be bound with the phytate molecule.
© University of Pretoria

CHAPTER 2 LITERATURE REVIEW
Department of Animal and Wildlife Sciences
University of Pretoria
Page | 20
Limiting nutrients may also compromise performance improvement and response of other enzymes even
though sufficient phytase is present to liberate phosphorus from phytate (Cowieson and Adeola, 2005;
Juanpere et al., 2005).
Very little is understood on the compatibility and synergy between feed protease and phytase when added
to the feed simultaneously (Cowieson and Adeola, 2005). This limits the optimal use of both these
enzymes in broiler diets as accurate matrix (nutrient) values cannot be allocated to the enzymes. There
are countless interactions between enzymes and host animals, the host microflora and also dietary
ingredients (Bedford, 2002). Cowieson and Adeola (2005) concluded that the use of a combination of
different enzymes resulted in significant improvements in feed intake to weight gain ratio (from 0.8% to
10.5%) and body weight gain (from 1.9% to 6.9%) in broilers. They further indicated that phytase and
protease may have an additive effect on broiler performance, and is a cost effective nutritional strategy
for the profitable production of poultry product. The enzyme combination increased the metabolisable
energy value of the feed by 3% and nitrogen retention by 11.7% of both adequate and reduced energy
and amino acid diets (Cowieson and Ravindran, 2008). Woyengo et al. (2010) also found that a
combination of phytase and protease enzymes can act synergistically in improving nutrient utilisation.
Studies have been conducted to investigate the interaction of exogenous enzymes and other feed
additives to alleviate anti-nutritional effects of ingredients and improve gut health with subsequent
improvement in broiler performance. Esteve-Garcia et al. (1997) reported the use of anti-microbial
growth promoters (AGPs) in improving the nutritive value of non-starch polysaccharides in wheat based
diets. The increasing pressure by the consumer to reduce the use of AGPs in poultry diets led to a need
for the feed industry to find alternative feed additives (Humphrey et al., 2002; Botsoglou et al., 2004).
The use of AGPs are banned in most countries but it is still routinely used as additives in broiler diets in
the South African market. Most research conducted on exogenous enzymes was done without accounting
for the inclusion of AGPs in the feed, and therefore the interaction of AGPs with exogenous enzymes,
which is relevant to South Africa specifically, is not clearly understood. The work reported by Hock et
al. (1997) suggests that there might be an interaction between exogenous enzymes and AGPs used in
broiler diets, and that their effects are additive.
© University of Pretoria

CHAPTER 2 LITERATURE REVIEW
Department of Animal and Wildlife Sciences
University of Pretoria
Page | 21
2.12 Hypotheses
a. H0: Supplementing broiler diets with Ronozyme® ProAct or HiPhos will not improve broiler
performance and gut health
HA: Supplementing broiler diets with Ronozyme® ProAct or HiPhos will improve broiler
performance and gut health
b. H0: Supplementing broiler feed with a combination of exogenous enzymes and antimicrobial
growth promoter will not improve broiler performance and gut health
HA: Supplementing broiler feed with a combination of exogenous enzymes and antimicrobial
growth promoter will improve broiler performance and gut health
c. H0: Simultaneous inclusion of Ronozyme® ProAct and HiPhos in broiler diets does not have an
additive effect on broiler performance and gut health (i.e. protease inclusion will not add to the
benefits already obtained by phytase inclusion)
HA: Simultaneous inclusion of Ronozyme® ProAct and HiPhos in broiler diets does have an
additive effect on broiler performance and gut health (i.e. protease inclusion will add to the
benefits already obtained by phytase inclusion, whether the additivity is complete or less than
complete)
This study was undertaken to evaluate the effects of feeding broiler chicken’s exogenous protease,
Ronozyme® ProAct, and phytase, Ronozyme® HiPhos, alone or in combination or in combination with
AGP, zinc bacitracin, on broiler performance parameters and intestinal health as measured by crypt depth
and villi length and the ratios thereof.
© University of Pretoria

Department of Animal and Wildlife Sciences
University of Pretoria
Page | 22
CHAPTER 3
MATERIALS AND METHODS
Two separate experiments were carried out with a total of 1600 and 2080 birds, respectively. For Trial
1, 1600 Ross 308 separate sex day old chicks were randomly allocated to 32 pens with 50 birds per pen.
For Trial 2, 2080 Ross 308 day old chicks were randomly allocated to 32 pens with 65 birds per pen. For
both trials, the birds were sexed and the different sexes were placed in separate pens. Due to a limited
number of pens available, the trial was duplicated in order to obtain more replicates per treatment. Eight
treatments were included in the study, with four replicate pens per treatment (two male pens and two
female pens) for each of Trial 1 and Trial 2, thus eight replicates in total.
The trail was approved by the Animal Ethics Committee of the Faculty of Natural and Agricultural
Science of University of Pretoria (approval number EC029-12).
3.1 Preparation of the experimental diets
Chicks were fed maize-soya based diets fortified with a vitamin-mineral premix which also included a
coccidiostat (Narasin/Nicarbazin, Maxiban®, Elanco Animal Health). The premix also included an
enzyme and anti-microbial growth promoter (AGP) (Zinc bacitracin 15%, Albac®) where appropriate.
The protease used was Ronozyme® ProAct, a commercial enzyme produced by submerged fermentation
of Bacillus licheniformis containing transcribed genes from Nocardiopsis prasina. Ronozyme® ProAct
GT (DSM Nutritional Products, Kaiseraugst, Switzerland) is a mono-component protease with activity
of 75,000 PROT/g. One PROT unit is defined as the amount of enzyme that releases 1 μmol of p-
nitroaniline from 1 μM of substrate (Suc-Ala-Ala-Pro-Phe-nitroaniline) per minute at pH 9.0 and 37 °C.
The phytase which was used in the study was Ronozyme® HiPhos GT (DSM Nutritional Products,
Kaiseraugst, Switzerland). This is a novel commercial enzyme of microbial 6-phytase expressed through
the use of synthetic genes in Aspergillus oryzae with phytase activity of 10 000 phytase units (FYTs).
One phytase unit is defined as the amount of enzyme that releases 1 μmol of inorganic phosphate under
standard conditions (0.25 M acetate buffer pH 5.5, 37 °C and 5 mmol sodium phytate).
© University of Pretoria

CHAPTER 3 MATERIALS AND METHODS
Department of Animal and Wildlife Sciences
University of Pretoria
Page | 23
Experimental diets were formulated to meet minimum nutrient requirements based on commercial feed
specifications (sufficient to meet minimum breed recommendation). Premixes were manufactured by
DSM Nutritional Products (South Africa) and added to compound raw materials at 3 g/kg. Feed was
manufactured in 500 kg or 1000 kg batches and pressed through a cold pelleting system to yield either
crumbles or a 3 mm size pellet and was weighed into 50 kg bags.
3.1.1 Feeding programme and experimental diets descriptions
A two-phase feeding programme was followed in the study. Starter crumbles were fed from placement
to 19 days and finisher pellets were fed from 20 days to slaughter. The different dietary treatments used
in the study is described in Table 3.1.
Table 3.14: Description of the treatment groups and experimental diets
Groups Experimental diets description
PC = Positive Control Diet with standard commercial nutrient levels (No enzymes added)
NC1 = Negative Control 1 Diet with nutrient levels reduced equally to the recommended nutrient
contribution of Ronozyme HiPhos (No enzyme addition)
NC2 = Negative Control 2 Diet with nutrient levels reduced equally to the recommended nutrient
contribution of Ronozyme ProAct (No enzyme added)
NC3 = Negative Control 3 Diet with nutrient levels reduced equally to the recommended nutrient
contribution of Ronozyme HiPhos and ProAct (No enzyme added)
Trt1 = Treatment 1 Diet with nutrient levels reduced equally to the recommended nutrient
contribution of Ronozyme HiPhos (Added 100 mg/kg of HiPhos)
Trt 2 = Treatment 2 Diet with nutrient levels reduced equally to the recommended nutrient
contribution of Ronozyme ProAct (Added 200 mg/kg of ProAct)
Trt3 = Treatment 3 Diet with nutrient levels reduced equally to the recommended nutrient
contribution of Ronozyme HiPhos and ProAct (Added 100 mg/kg of HiPhos
+ 200 mg/kg of ProAct)
Trt4 = Treatment 4 Diet with nutrient levels reduced equally to the recommended nutrient
contribution of Ronozyme HiPhos and ProAct (Added 100 mg/kg of HiPhos
+ 200 mg/kg of ProAct and 50 mg/kg of Albac (Zinc Bacitracin 15% )
© University of Pretoria

CHAPTER 3 MATERIALS AND METHODS
Department of Animal and Wildlife Sciences
University of Pretoria
Page | 24
3.1.2 Calculated nutrient values of the experimental diets and enzyme nutrient contribution
Nutrient matrices were included for the enzymes used in the study to calculate the nutrient specifications
of the starter and finisher diets. Enzyme matrices were allocated as 100% of the nutrient value of
Ronozyme® HiPhos and ProAct and combination of both enzymes on bases of recommended dose of
1000 FYTs/kg for Ronozyme® HiPhos equivalent to 100 mg/kg and 15,000 PROT/kg units equivalent
to 200 mg/kg of Ronozyme® ProAct. Ronozyme® HiPhos contributed available P, total Ca, crude
protein, amino acids and energy matrix values while ProAct contributed crude protein and amino acid
matrix values. The combined effect of the enzymes were assumed to be 100% additive, where 1 + 1 = 2.
Treatment diets were formulated based on the adjustment of nutrient values of the PC diet less enzyme
nutrient contribution as indicated in Table 3.2 less enzyme nutrient contributions.
© University of Pretoria

CHAPTER 3 MATERIALS AND METHODS
Department of Animal and Wildlife Sciences
University of Pretoria
Page | 25
Table 3.2:5Manufacturer’s recommended enzyme nutrient contribution in g/kg of complete feed and enzymes matrix values of enzyme products in g/kg
for meat type poultry
Nutrients for Meat
Poultry Units
Phytase nutrient
contribution in
feed
Phytase
matrix
(100g/kg)
Protease nutrient
contribution in
feed
Protease
matrix
(200g/kg)
Combination
nutrient
contribution in
feed
Combined matrix
values(300g/kg)
Crude Protein g/kg 2.60 25,524 5.5 27,376 8.03 26,758
Digestible Lysine g/kg 0.108 1,085 0.303 1,517 0.412 1,373
Digestible Methionine g/kg 0.041 411 0.178 889 0.219 729
Digestible TSAA g/kg 0.065 649 0.336 1,682 0.401 1,338
Digestible Threonine g/kg 0.065 647 0.497 2,484 0.562 1,872
Digestible Tryptophan g/kg 0.018 183 0.033 165 0.051 171
Digestible Iso-leucine g/kg 0.105 1,053 0.220 1,102 0.326 1,086
Total Ca g/kg 1.776 17,755
1.776 5,918
Available Phosphorus g/kg 1.5 14,600
1.46 4,867
Digestible Phosphorus g/kg 1.2 11,598
1.16 3,866
ME Broiler MJ, ME/kg 0.3141 3,141
0.314 1,047
ME Broiler Kcal, ME /kg 75 750,410
75.0 250,137
ME: Metabolisable energy
© University of Pretoria
CHAPTER 3 MATERIALS AND METHODS
Department of Animal and Wildlife Sciences
University of Pretoria
Page | 26
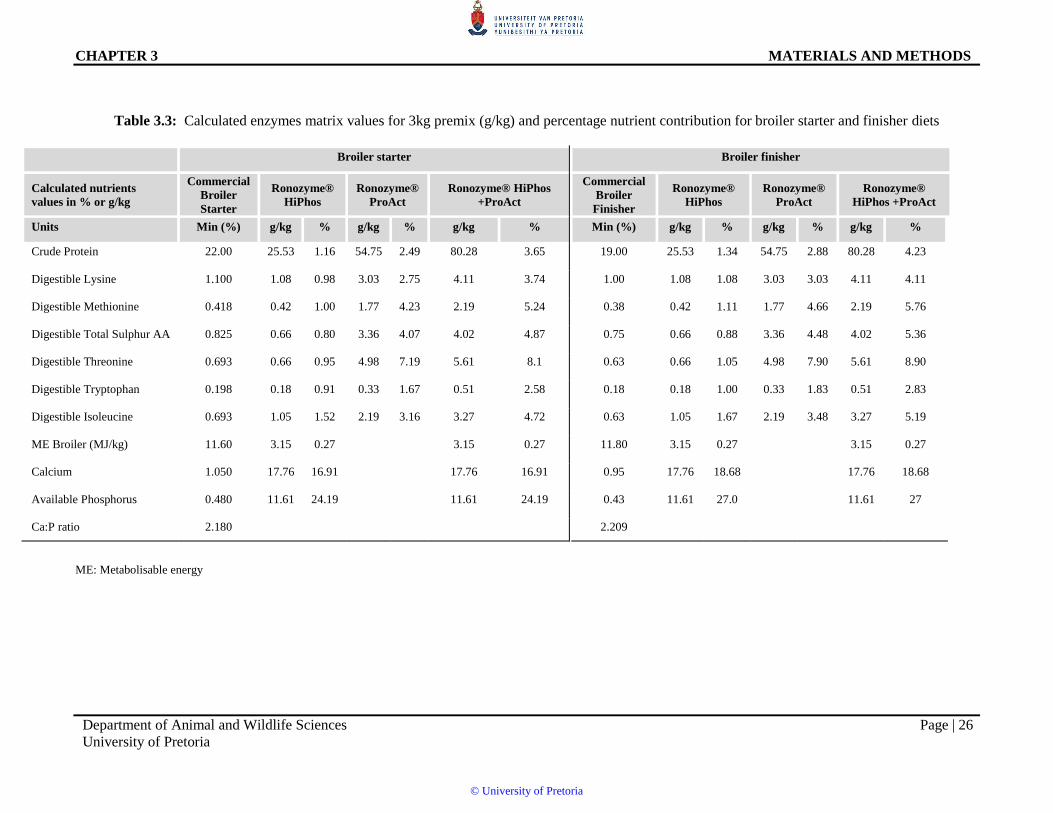
Table 3.3:6Calculated enzymes matrix values for 3kg premix (g/kg) and percentage nutrient contribution for broiler starter and finisher diets
Broiler starter Broiler finisher
Calculated nutrients
values in % or g/kg
Commercial
Broiler
Starter
Ronozyme®
HiPhos
Ronozyme®
ProAct
Ronozyme® HiPhos
+ProAct
Commercial
Broiler
Finisher
Ronozyme®
HiPhos
Ronozyme®
ProAct
Ronozyme®
HiPhos +ProAct
Units Min (%) g/kg % g/kg % g/kg % Min (%) g/kg % g/kg % g/kg %
Crude Protein 22.00 25.53 1.16 54.75 2.49 80.28 3.65 19.00 25.53 1.34 54.75 2.88 80.28 4.23
Digestible Lysine 1.100 1.08 0.98 3.03 2.75 4.11 3.74 1.00 1.08 1.08 3.03 3.03 4.11 4.11
Digestible Methionine 0.418 0.42 1.00 1.77 4.23 2.19 5.24 0.38 0.42 1.11 1.77 4.66 2.19 5.76
Digestible Total Sulphur AA 0.825 0.66 0.80 3.36 4.07 4.02 4.87 0.75 0.66 0.88 3.36 4.48 4.02 5.36
Digestible Threonine 0.693 0.66 0.95 4.98 7.19 5.61 8.1 0.63 0.66 1.05 4.98 7.90 5.61 8.90
Digestible Tryptophan 0.198 0.18 0.91 0.33 1.67 0.51 2.58 0.18 0.18 1.00 0.33 1.83 0.51 2.83
Digestible Isoleucine 0.693 1.05 1.52 2.19 3.16 3.27 4.72 0.63 1.05 1.67 2.19 3.48 3.27 5.19
ME Broiler (MJ/kg) 11.60 3.15 0.27
3.15 0.27 11.80 3.15 0.27
3.15 0.27
Calcium 1.050 17.76 16.91
17.76 16.91 0.95 17.76 18.68
17.76 18.68
Available Phosphorus 0.480 11.61 24.19
11.61 24.19 0.43 11.61 27.0
11.61 27
Ca:P ratio 2.180 2.209
ME: Metabolisable energy
© University of Pretoria

CHAPTER 3 MATERIALS AND METHODS
Department of Animal and Wildlife Sciences
University of Pretoria
Page | 27
Table 3.4:7Raw material composition of experimental starter diets expressed on a fed basis (g/kg)
Vitamin and mineral broiler starter premix in a 3kg unit and contribution per kg of complete feed: vitamin A: 10,000 IU; vitamin D3: 10,000
IU; vitamin E: 50 IU; vitamin K3: 4 mg; vitamin B1: 5 mg; vitamin B2: 8 mg; vitamin B6: 4 mg; pantothenic acid: 20 mg; biotin: 0.25 mg;
folic acid: 2 mg; niacin: 50 mg; vitamin B12: 20 μg; I (calcium iodate): 2 mg; Se (sodium selenite): 0.3 mg; Cu: 20 mg; Mn : 120 mg; Zn: 110
mg; Fe: 40 mg ; Antioxidant: 125mg; Ronozyme® HiPhos: 100 mg/kg ; Ronozyme® ProAct: 200 mg/kg and Combination of ProAct (200
mg/kg) and HiPhos (100 mg/kg). Copper, Manganese and zinc sources are supplied in a form of Sulphates.
PC = Positive control (commercial diet); NC1 = Negative control 1 (reduced nutrients for phytase contribution); NC2 = Negative control 2
(reduced nutrients for protease contribution); NC3 = Negative control 3 (reduced nutrients for a combination of phytase and protease
contribution); Trt1 = NC1 + addition of 100 mg/kg Ronozyme® HiPhos; Trt2 = NC2 + addition of 200 mg/kg Ronozyme® ProAct; Trt3 =
NC3 + addition of Ronozyme® HiPhos at 100 mg/kg and ProAct at 200 mg/kg ; Trt4 = NC3 + addition of Ronozyme® HiPhos at 100mg/kg
and ProAct at 200 mg/kg and zinc bacitracin 15% at 50 mg/kg.
Raw ingredients PC NC1 NC2 NC3 Trt1 Trt2 Trt3 Trt4
Yellow maize 525.96 545.87 545.91 568.17 545.87 545.91 568.17 567.84
Fullfat soya oilcake meal 150.00 150.00 150.00 150.00 150.00 150.00 150.00 150.00
Soya Hi Pro oilcake meal (46%+) 263.22 256.08 246.77 237.61 256.08 246.77 237.61 237.61
Soya oil 10.92 4.43 7.36 0.42 4.43 7.36 0.42 0.42
Limestone 18.46 22.24 18.49 22.28 22.24 18.49 22.28 22.28
Monocalcium phosphate 18.59 8.53 18.76 8.72 8.53 18.76 8.72 8.72
Salt 4.38 4.38 4.39 4.39 4.38 4.39 4.39 4.39
Methionine (MHA) 3.32 3.27 3.05 3.03 3.27 3.05 3.03 3.03
Lysine HCL 0.78 0.84 0.90 1.01 0.84 0.90 1.01 1.01
Choline chloride 60% 0.86 0.86 0.86 0.86 0.86 0.86 0.86 0.86
Maxiban (Narasin/Nicarbazin) 0.50 0.50 0.50 0.50 0.50 0.50 0.50 0.50
Vit/Min broiler starter premix, no
enzyme 3.00 3.00 3.00 3.00
Vit/Min broiler starter premix+
HiPhos 3.00
Vit/Min broiler starter premix + Pro
Act 3.00
Vit/Min broiler starter premix
HiPhos+ProA 3.00 3.00
Zinc bacitracin (Albac) 0.335
© University of Pretoria
CHAPTER 3 MATERIALS AND METHODS
Department of Animal and Wildlife Sciences
University of Pretoria
Page | 28
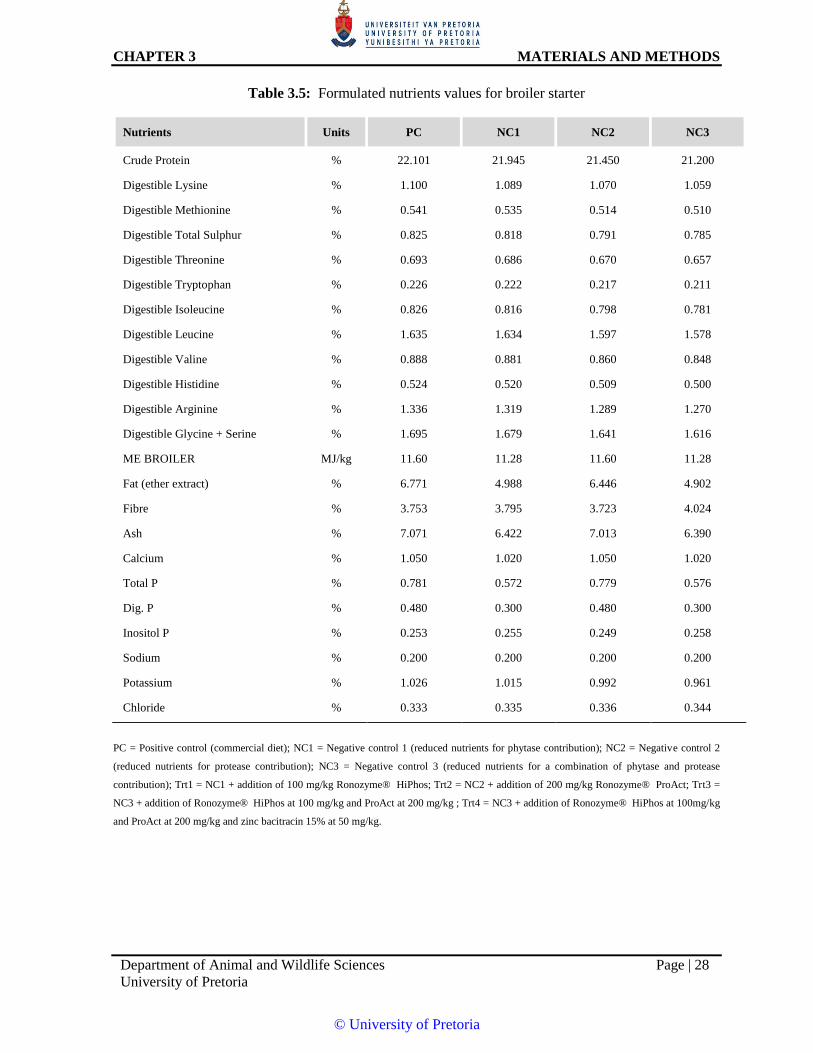
Table 3.5:8Formulated nutrients values for broiler starter
Nutrients Units PC NC1 NC2 NC3
Crude Protein % 22.101 21.945 21.450 21.200
Digestible Lysine % 1.100 1.089 1.070 1.059
Digestible Methionine % 0.541 0.535 0.514 0.510
Digestible Total Sulphur % 0.825 0.818 0.791 0.785
Digestible Threonine % 0.693 0.686 0.670 0.657
Digestible Tryptophan % 0.226 0.222 0.217 0.211
Digestible Isoleucine % 0.826 0.816 0.798 0.781
Digestible Leucine % 1.635 1.634 1.597 1.578
Digestible Valine % 0.888 0.881 0.860 0.848
Digestible Histidine % 0.524 0.520 0.509 0.500
Digestible Arginine % 1.336 1.319 1.289 1.270
Digestible Glycine + Serine % 1.695 1.679 1.641 1.616
ME BROILER MJ/kg 11.60 11.28 11.60 11.28
Fat (ether extract) % 6.771 4.988 6.446 4.902
Fibre % 3.753 3.795 3.723 4.024
Ash % 7.071 6.422 7.013 6.390
Calcium % 1.050 1.020 1.050 1.020
Total P % 0.781 0.572 0.779 0.576
Dig. P % 0.480 0.300 0.480 0.300
Inositol P % 0.253 0.255 0.249 0.258
Sodium % 0.200 0.200 0.200 0.200
Potassium % 1.026 1.015 0.992 0.961
Chloride % 0.333 0.335 0.336 0.344
PC = Positive control (commercial diet); NC1 = Negative control 1 (reduced nutrients for phytase contribution); NC2 = Negative control 2
(reduced nutrients for protease contribution); NC3 = Negative control 3 (reduced nutrients for a combination of phytase and protease
contribution); Trt1 = NC1 + addition of 100 mg/kg Ronozyme® HiPhos; Trt2 = NC2 + addition of 200 mg/kg Ronozyme® ProAct; Trt3 =
NC3 + addition of Ronozyme® HiPhos at 100 mg/kg and ProAct at 200 mg/kg ; Trt4 = NC3 + addition of Ronozyme® HiPhos at 100mg/kg
and ProAct at 200 mg/kg and zinc bacitracin 15% at 50 mg/kg.
© University of Pretoria

CHAPTER 3 MATERIALS AND METHODS
Department of Animal and Wildlife Sciences
University of Pretoria
Page | 29
Table 3.6:9Nutrient analysis of the experimental starter diets expressed on as is basis (g/kg)
Nutrients PC NC1 NC2 NC3 Trt1 Trt2 Trt3 Trt4
Gross Energy (MJ/kg) 16.55 15.89 16.39 16.47 16.37 16.27 16.45 16.33
Dry matter 914.43 879.11 902.57 901.59 899.42 905.47 906.25 902.14
Crude Protein 223.84 223.31 219.60 216.58 209.87 201.01 214.86 213.62
Crude Fat (ether extract) 59.50 51.97 58.69 52.44 59.74 56.54 51.84 58.04
Ash 56.43 55.57 54.34 49.26 58.89 59.58 57.62 58.24
Total Phosphorus 7.08 7.41 7.32 5.72 7.48 7.52 6.19 7.00
Total Calcium 10.58 10.42 10.23 11.06 11.13 11.85 10.30 11.07
Sodium 2.31 2.06 2.18 2.39 2.20 2.60 2.33 2.34
Potassium 7.70 6.90 6.80 6.30 7.60 6.90 7.30 7.19
Chloride 3.05 3.02 3.16 3.08 3.58 3.74 3.24 3.30
PC = Positive control (commercial diet); NC1 = Negative control 1 (reduced nutrients for phytase contribution); NC2 = Negative control 2
(reduced nutrients for protease contribution); NC3 = Negative control 3 (reduced nutrients for a combination of phytase and protease
contribution); Trt1 = NC1 + addition of 100 mg/kg Ronozyme® HiPhos; Trt2 = NC2 + addition of 200 mg/kg Ronozyme® ProAct; Trt3 =
NC3 + addition of Ronozyme® HiPhos at 100 mg/kg and ProAct at 200 mg/kg ; Trt4 = NC3 + addition of Ronozyme® HiPhos at 100mg/kg
and ProAct at 200 mg/kg and zinc bacitracin 15% at 50 mg/kg.
© University of Pretoria

CHAPTER 3 MATERIALS AND METHODS
Department of Animal and Wildlife Sciences
University of Pretoria
Page | 30
Table 3.7:10Raw material composition of experimental finisher diets expressed on a fed basis (g/kg)
Raw ingredients composition PC NC1 NC2 NC3 Trt1 Trt2 Trt3 Trt4
Yellow maize 619.65 654.11 621.12 655.23 654.11 621.12 655.23 654.89
Fullfat soya oilcake meal 150.00 82.94 150.00 83.57 82.94 150.00 83.57 83.57
Soya Hi Pro oilcake meal (46%+) 173.71 221.07 173.49 220.41 221.07 173.49 220.41 220.41
Soya oil 8.27 0.00 8.33 20.75 0.00 8.33 20.75 20.75
Limestone 17.03 20.78 17.03 6.80 20.78 17.03 6.80 6.80
Monocalcium phosphate 16.76 6.73 16.76 4.42 6.73 16.76 4.42 4.42
Salt 4.45 4.42 4.45 2.51 4.42 4.45 2.51 2.51
Methionine (MHA) 3.08 2.96 2.66 1.78 2.96 2.66 1.78 1.78
Lysine HCL 2.18 2.17 1.80 0.00 2.17 1.80 0.00 0.00
L-Threonine 0.50 0.45 0.00 0.18 0.45 0.00 0.18 0.18
Choline chloride 60% 0.86 0.86 0.86 0.86 0.86 0.86 0.86 0.86
Maxiban (Narasin/Nicarbazin) 0.50 0.50 0.50 0.50 0.50 0.50 0.50 0.50
Vit/Min broiler finisher premix No Enzyme 3.00 3.00 3.00 3.00
Vit/Min broiler finisher premix +HiPhos 3.00
Vit/Min broiler finisher premix +Pro Act 3.00
Vit/Min broiler finisher premix
+HiPhos+ProA 3.00 3.00
Zinc bacitracin (Albac) 0.335
Vitamin and mineral broiler finisher premix in a 3kg unit and contribution per kg of complete feed: vitamin A: 10,000 IU; vitamin D3: 10,000
IU; vitamin E: 50 IU; vitamin K3: 4 mg; vitamin B1: 5 mg; vitamin B2: 8 mg; vitamin B6: 4 mg; pantothenic acid: 20 mg; biotin: 0.25 mg;
folic acid: 2 mg; niacin: 50 mg; vitamin B12: 20 μg; I (calcium iodate): 2 mg; Se (sodium selenite): 0.3 mg; Cu: 20 mg; Mn : 120 mg; Zn: 110
mg; Fe: 40 mg ; Antioxidant : 125mg; Ronozyme® HiPhos: 100 mg/kg ; Ronozyme® ProAct: 200 mg/kg and Combination ProAct (200 mg/kg)
and HiPhos (100 mg/kg). Copper, Manganese and zinc sources are supplied in a form of Sulphates.
PC = Positive control (commercial diet); NC1 = Negative control 1 (reduced nutrients for phytase contribution); NC2 = Negative control 2
(reduced nutrients for protease contribution); NC3 = Negative control 3 (reduced nutrients for a combination of phytase and protease
contribution); Trt1 = NC1 + addition of 100 mg/kg Ronozyme® HiPhos; Trt2 = NC2 + addition of 200 mg/kg Ronozyme® ProAct; Trt3 =
NC3 + addition of Ronozyme® HiPhos at 100 mg/kg and ProAct at 200 mg/kg ; Trt4 = NC3 + addition of Ronozyme® HiPhos at 100mg/kg
and ProAct at 200 mg/kg and zinc bacitracin 15% at 50 mg/kg.
© University of Pretoria

CHAPTER 3 MATERIALS AND METHODS
Department of Animal and Wildlife Sciences
University of Pretoria
Page | 31
Table 3.8:11Formulated nutrient values for broiler finisher
Nutrients Units PC NC1 NC2 NC3
Crude Protein % 19.018 18.911 18.924 18.832
Digestible Lysine % 1.000 0.989 0.970 0.958
Digestible Methionine % 0.503 0.495 0.468 0.459
Digestible Total Sulphur % 0.750 0.743 0.716 0.707
Digestible Threonine % 0.630 0.623 0.581 0.596
Digestible Tryptophan % 0.184 0.182 0.184 0.182
Digestible Isoleucine % 0.685 0.683 0.685 0.683
Digestible Leucine % 1.446 1.457 1.447 1.457
Digestible Valine % 0.750 0.750 0.750 0.750
Digestible Histidine % 0.447 0.447 0.447 0.447
Digestible Arginine % 1.103 1.092 1.103 1.092
Digestible Glycine + Serine % 1.425 1.425 1.425 1.425
ME BROILER MJ/kg 11.800 11.480 11.800 11.480
Fat (ether extract) % 5.727 3.824 5.736 3.837
Fibre % 3.594 3.354 3.597 3.358
Ash % 6.353 5.668 6.353 5.672
Calcium % 0.950 0.920 0.950 0.920
Total P % 0.710 0.498 0.710 0.500
Dig. P % 0.430 0.250 0.430 0.251
Inositol P % 0.233 0.232 0.233 0.232
Sodium % 0.200 0.200 0.200 0.200
Potassium % 0.857 0.855 0.857 0.854
Chloride % 0.359 0.360 0.352 0.353
PC = Positive control (commercial diet); NC1 = Negative control 1 (reduced nutrients for phytase contribution); NC2 = Negative control 2
(reduced nutrients for protease contribution); NC3 = Negative control 3 (reduced nutrients for a combination of phytase and protease
contribution); Trt1 = NC1 + addition of 100 mg/kg Ronozyme® HiPhos; Trt2 = NC2 + addition of 200 mg/kg Ronozyme® ProAct; Trt3 =
NC3 + addition of Ronozyme® HiPhos at 100 mg/kg and ProAct at 200 mg/kg ; Trt4 = NC3 + addition of Ronozyme® HiPhos at 100mg/kg
and ProAct at 200 mg/kg and zinc bacitracin 15% at 50 mg/kg.
© University of Pretoria

CHAPTER 3 MATERIALS AND METHODS
Department of Animal and Wildlife Sciences
University of Pretoria
Page | 32
Table 3.9:12Nutrients analysis of the experimental finisher diets expressed on as is basis (g/kg)
Nutrients PC NC1 NC2 NC3 Trt1 Trt2 Trt3 Trt4
Gross Energy (MJ/kg) 15.44 16.13 16.03 16.02 16.19 15.54 15.46 15.48
Dry Matter 902.78 889.38 902.31 905.14 900.73 880.88 873.89 883.10
Crude Protein 193.45 189.16 184.33 192.02 199.70 186.50 189.77 184.02
Crude Fat (ether extract) 52.97 47.35 39.49 46.34 44.09 35.00 32.12 35.74
Ash 49.43 47.62 51.69 50.02 49.89 48.62 45.97 50.31
Total Phosphorus 6.46 6.44 6.58 5.50 6.57 6.51 5.46 6.54
Total Calcium 9.70 9.09 9.67 9.15 8.53 10.35 9.46 9.70
Sodium 2.15 2.00 2.23 1.93 1.88 2.21 2.16 2.27
Potassium 5.95 5.90 5.55 5.65 6.15 5.65 5.70 5.55
Chloride 3.61 3.50 3.69 3.43 3.27 3.50 3.44 3.53
PC = Positive control (commercial diet); NC1 = Negative control 1 (reduced nutrients for phytase contribution); NC2 = Negative control 2
(reduced nutrients for protease contribution); NC3 = Negative control 3 (reduced nutrients for a combination of phytase and protease
contribution); Trt1 = NC1 + addition of 100 mg/kg Ronozyme® HiPhos; Trt2 = NC2 + addition of 200 mg/kg Ronozyme® ProAct; Trt3 =
NC3 + addition of Ronozyme® HiPhos at 100 mg/kg and ProAct at 200 mg/kg ; Trt4 = NC3 + addition of Ronozyme® HiPhos at 100mg/kg
and ProAct at 200 mg/kg and zinc bacitracin 15% at 50 mg/kg.
© University of Pretoria

CHAPTER 3 MATERIALS AND METHODS
Department of Animal and Wildlife Sciences
University of Pretoria
Page | 33
3.2 Performance trial
3.2.1 Housing and management
Birds were reared in an environmentally controlled broiler house, on the experimental farm of the
University of Pretoria, Hatfield, Pretoria. Birds were randomly allocated to 32 pens demarcated by 3 x
1.15 m mesh (3.45 m2). Each pen was fitted with a bell drinker connected to municipality water supply
lines and two tube feeders per pen to allow ad libitum access to drinking water and feed. Each pen was
fitted with two infrared heaters. The brooding temperature was initially controlled at 32 oC for the first
4 days prior to placement and 4 days after placement and then gradually lowered to reach approximately
26 oC by slaughter age. Temperature was monitored on a daily basis and the lighting program was
gradually adjusted weekly according to the broiler management guide. Minimum ventilation was
regulated to allow removal of toxic gases and flow of fresh air in the house.
Each pen was allocated a 50 L labelled bin of known empty weight, filled with its corresponding
treatment feed. Feed was weighed into marked bins corresponding to each treatment pen. Feed was then
scooped and transferred from the bin to the pen when required. Chicks were fed on chick trays for the
first 3 days and changed to tube feeders for the remainder of the trial. Feed and water were offered ad
libitum during the period of the trial. Tube feeders were re-filled when necessary and shaken twice a day
to ensure consistent feed availability throughout the trial. Bell drinkers were cleaned at least once a day to
ensure the availability of clean water.
3.2.2 Feed sample collection
A probe was used to sample every second bag of feed. Samples were pooled per production batch,
labelled and stored in a zip lock bag for analysis. The feed samples were ground through a 1 mm sieve
and analysed.
3.2.3 Vaccination program
Birds were vaccinated against most commonly prevalent poultry diseases in South Africa following a
basic broiler vaccination program recommended by Onderstepoort Veterinary Faculty, University of
Pretoria (Table 3.10). The water system was switched off to deprive the chickens’ water for an hour prior
to vaccine administration. Vaccines were prepared by breaking vaccine vials in cool water in a 5 litre
plastic bucket and mixing to volume in a big plastic drum. Required dose was calculated for birds’ age
per number of birds in a pen and added to each pen in fountain drinkers.
© University of Pretoria

CHAPTER 3 MATERIALS AND METHODS
Department of Animal and Wildlife Sciences
University of Pretoria
Page | 34
Table 3.10:13Vaccination program used during the trial period
Age Disease Application route
Day Old Infectious Bronchitis (IB) Course Spray (Hatchery)
Day Old New Castle Diseases (NCD) Course Spray (Hatchery)
Day 14 Infectious Bursal Disease (IBD) (Gumboro) Drinking water (On farm)
Day 18 New Castle Disease (NCD) Drinking water (On farm)
Day 18 Infectious Bursal Disease (IBD) (Gumboro) Drinking water (On farm)
3.3 Gut health measurements
3.3.1 Intestinal sample collection
Birds were sacrificed by cervical dislocation, subjected to dissection and tissue sampling at an abattoir
situated at the Meat Science laboratory on the same experimental farm (University of Pretoria, Hatfield).
Approximately 1 cm cross sectional cuts of the duodenum and the jejunum were collected and stored.
The duodenum was defined as the section of the small intestines extending from the pylorus to the
entrance of the main biliary and pancreatic duct. The jejunum was defined as the portion of the small
intestine between the duodenum and Meckel’s diverticulum (Jaroni et al., 1999).
Samples were thoroughly rinsed with physiological saline solution and fixed in a 10% Millonig’s
buffered formalin solution to prevent shrinking of the tissues. The sections of the intestinal samples were
processed and stained at the Department of Histopathology, University of Pretoria, Onderstepoort. The
tissue samples were embedded in paraffin wax after which sections of 4 to 5 µm were cut by a microtome
blade and smeared onto a slide. The slides were dehydrated with Millonig’s buffer solution and washed
with distilled water. The dehydration process involved washing for 3 minutes in ethanol solutions of
graded concentration of 100, 96 and 70 %, one minute for each concentration. The dehydrating fluid and
the paraffin wax were removed with a clearing agent, xylene, for 5 minutes. The slides were stained in
haematoxylin for 10 minutes then rinsed with tap water. To be differentiated, the slides were dipped in
acid alcohol solution only once. The specimen turned blue after rinsing with tap water for 10 minutes.
The slides were then rinsed in 70% ethanol for 3 minutes followed by counter staining in Eosin for 2.5
minutes. The slides were differentiated and dehydrated in 96% ethanol for 3 minutes and dehydrated
again in 100% ethanol for 3 minutes. The slides were then cleared in xylol and mounted in Entallan
(Bancroft, 2003).
© University of Pretoria

CHAPTER 3 MATERIALS AND METHODS
Department of Animal and Wildlife Sciences
University of Pretoria
Page | 35
3.3.1.1 Preparation of 20 L physiological saline solution
180g of NaCl was weighed on an analytical balance and dissolved in 1000 mL of distilled water. The
solution was transferred to a 20 L bucket and filled to make up 20 L volume.
3.3.1.2 Preparation of 25 L of 10% Millonig’s buffer solution
An analytical balance was used to weigh each dry chemical (428.6g KH2PO4, 87.0 g NaOH, and 121.4
g C6H12O6). Three 2 L volumetric flasks were filled with 1800 mL tap water, labelled for each chemical
and placed on a magnetic stirrer. Each of the three weighed dry chemicals was carefully added to the
corresponding volumetric flasks to be dissolved. 2.5 L H2CO 40% formalin (Methanal) solution was
poured into a 25 L bucket and topped with 3 solutions of dissolved dry chemicals. Tap water was added
to the bucket to make up 25 L volume
3.3.1.3 Preparation of Haematoxylin and Eosin staining
a) Preparation of Haematoxylin (Lillie-Mayer)
1. 25 g haematoxylin
2. 3,500 mL Distilled water
3. 250 g Aluminium ammonium sulphate dodecahydrate
4. 100 mL glacial acetic acid
5. 2.5 g sodium iodate
Distilled water was heated to 40oC. Haematoxylin and aluminium ammonium sulphate
dodecahydrate were completely dissolved in distilled water to avoid the strains from breakage.
The metal sheen appearing on top of the stain was then discarded. Glycerol was added to a
solution followed by glacial acetic acid and then the stain was ripened by adding the Sodium
Iodate. The mix was then left to stand for at least 18 hours before it was used. The solution was
used within 18 to 24 hours of preparation.
b) Acid alcohol preparation
Concentrated hydrochloric acid (HCL) was added to 1980 mL of 70% ethanol.
© University of Pretoria
CHAPTER 3 MATERIALS AND METHODS
Department of Animal and Wildlife Sciences
University of Pretoria
Page | 36
c) Eosin preparation
25 g of Eosin (yellow) was dissolved in 1400 mL distilled water followed by addition of 3600
mL of 96% ethanol.
d) Expected results
The nuclei of the cells were expected to turn blue and the cytoplasm were expected to turn pink.
(Bancroft, 2003)
3.3.2 Measurement of the villi length and crypt depth
The slides were micro graphed at 1: 2, 5 x 40 magnification using a Zeiss light microscope HB0100
equipped with AXIOCAM MRC5 imaging software. Villus length was measured as the length between
the villus-crypt axis and the tip of the villus. Crypt depth was measured from the villus-crypt axis to the
base of the specific crypt. A scale of x 100 µm was used for the measurements.
3.4 Bone measurements
The right metatarsus of each slaughtered bird was removed and stored in a zip lock bag and frozen at -
20 °C for further processing. Seldin (1965) reported that when wet bones are stored at -20 °C there is no
effect or alteration to the bone matrix.
3.5 Chemical analysis of feed
Feed samples were analysed in duplicate to determine the accuracy of formulated diets. Samples were
milled to pass through 1 mm screen before being analysed for dry matter (DM), crude ash, crude protein
(CP), ether extracted crude fat (EE), gross energy (GE), calcium (Ca), phosphorus (P), sodium (Na),
chloride (Cl) and potassium (K).
3.5.1 Dry matter analysis
Dry matter was determined using the AOAC (2000), Official Method of Analysis 934.01. A 5 grams of
feed sample was weighed into oven dried porcelain crucibles. Each sample was weighed in duplicate.
The crucibles were placed into an oven overnight at 105ºC and cooled in a desiccator before weighing.
© University of Pretoria

CHAPTER 3 MATERIALS AND METHODS
Department of Animal and Wildlife Sciences
University of Pretoria
Page | 37
3.5.2 Ash analysis
Ash of the feed was determined using the AOAC (2000), Official Method of Analysis 942.05. After
drying the samples for DM determination, the samples were transferred to a furnace and incinerated at
200 ºC for 1 hour and then at 600 ºC for four hours. The samples were transferred to the desiccator to
cool overnight. The ceramic crucibles were weighed to determine the ash content.
% Ash = _____Ash Mass x100
Wet Mass Sample
3.5.3 Ether extracted crude fat (ether extract) analysis
Crude fat was determined using the Büchi Soxhlet (AOAC 2000), Official Method of Analysis 920.39.
A No. 1, 125mm Ǿ Whatman filter paper was tared on the mass balance. A 2 g sample was then weighed
into a filter paper, after which oven dried Büchi beakers were marked and weighed. The sample was then
folded into the filter paper to prevent spillage and placed into marked extraction thimbles. The extraction
thimbles were then placed in the soxhlet extraction tube. A volume of 80 mL petroleum-ether (60 – 80 °C
boiling points) was poured into the flat bottomed Büchi beaker. The beakers and extraction tube
(thimbles) were connected to the apparatus. Beakers were tightly fixed to the Büchi digestion block using
a lever. The water taps were then opened and the tap of the steam generator was turned to the horizontal.
The process involved: 1-hour digestion or fat extraction with petroleum ether, 2 hours of rinsing, 20 min
drying or ether recovery. After the process, the ether was evaporated and collected in the soxhlet tube
and filtered into a waste bottle. The Büchi beaker was then placed in an oven at 70 °C for 1 hour and
transferred to a desiccator to cool for 30 minutes. The mass of the Büchi beaker was then determined.
The difference between the mass of the flask before and after the extraction was the mass of crude fat of
the sample.
% Crude Fat = (Mass of beaker + residue – Mass of empty beaker) x100
Sample Mass
3.5.4 Crude protein (CP) analysis (Dumas/Leco)
The determination of crude protein was done following the A.O.A.C (2000), using the Dumas’ method,
with the Leco FP-428 version 2.4 of the Leco Corporation St. Joseph MI USA.
© University of Pretoria

CHAPTER 3 MATERIALS AND METHODS
Department of Animal and Wildlife Sciences
University of Pretoria
Page | 38
Sample preparation
1. Approximately 0.2 g of EDTA was weighed into cups. The cups were carefully folded to conceal
the sample.
2. Approximately 0.2 g of feed sample was weighed in duplicate into Leco cups and the cups were
folded.
The results were displayed as percent nitrogen. The conversions of nitrogen to crude protein of samples
were calculated using a conversion factor of 6.25 (AOAC, 2000).
3.5.5 Gross energy (GE) analysis
Gross energy of feed was determined by a complete oxidation using an adiabatic calorimeter with oxygen
ignition (MC 1000 Modular Calorimeter). Approximately 0.4 g sample was weighed into calorimeter
crucibles lined up with a thread (as a fuse). Benzoic acid tablet weighing approximately 0.5 g was used
as standard (calorific value of at least 26.453 ME/kg) and analysed before start of every batch. The
sample and crucible were inserted into the calorimeter chamber for processing.
3.5.6 Mineral analysis
Feed samples were analysed for Ca, P, Cl, Na and K and faecal samples were analysed for P using the
Official Method of Analysis 935.13 (AOAC, 2000).
The heating block was switched on and set to a temperature of 240 °C. Duplicate samples of
approximately 0, 5 g were weighed out and transferred into the digestion tube. A volume of 25 mL nitric
acid (HNO3) was then added to each sample. The samples were then placed on the pre-heated block and
boiled for 15 minutes and then removed from the block to cool for 5 minutes.10 mL perchloric acid
(HClO4) was added to each sample before the tubes were returned to the digestion block. The samples
were allowed to boil for 40 minutes until they showed orange yellow colouration. Samples were then
removed from the block and allowed to cool in a fume cupboard. Distilled water was added to the samples
to make up to 50 mL mark.
Phosphorous concentrations were analysed using a Technicon Auto Analyser and concentration was
obtained from a calibration curve determined according to Official Method of Analysis 965.17 (AOAC,
2000).
© University of Pretoria

CHAPTER 3 MATERIALS AND METHODS
Department of Animal and Wildlife Sciences
University of Pretoria
Page | 39
3.5.7 Bone ash and mineral analysis
Metatarsus samples were defatted according to Official Method of Analysis 932.16 (AOAC, 2005) and
the method described by Zhang and Coon (1997).
3.5.7.1 Metatarsal bone defatting
a) The metatarsus bones samples were placed in separate voile bags, each with a numbered
metal disk. The bags were closed with a ribbon to secure the bone and the disk
b) The bags were placed in Soxhlet fat extraction apparatus.
i. The Soxhlet fat extraction apparatus was filled to the marked line in bulb container
with 60 - 80 °C petroleum ether.
ii. The tap water cooling system was turned on and the Soxhlet heater was switched
on to 55 oC.
iii. The procedure was monitored after 30 minutes and 1 hour after turning on the
heater to ensure all orifices are closed and boiling and condensation is occurring.
iv. The Soxhlet was allowed to run for 16 hours.
c) The bags were removed from Soxhlet and the ether was allowed to evaporate in the fume
hood for 1 to 2 hours.
3.5.7.2 Metatarsal bone drying
a) The bones were removed from bags and weighed in water to record density after defatting.
b) The bones were cut to fit into crucibles and weighed into oven dried crucibles
c) The bones were dried in an oven at 70 °C for 12 hour
d) The crucibles were placed in a desiccator to cool then weighed.
Weight of dry defatted bone = (Dry crucible + Dry bone weight) – Dry crucible weight
© University of Pretoria

CHAPTER 3 MATERIALS AND METHODS
Department of Animal and Wildlife Sciences
University of Pretoria
Page | 40
3.5.7.3 Metatarsal bone ashing
a) Oven dried bones were ashed in a muffle furnace at 600 °C overnight for 12 hours
b) The furnace was turned off and allowed to cool to approximately 100 oC. The crucible
with bones were removed from the furnace and place directly into a desiccator and allowed
to completely cool down.
c) The ash weight was recorded.
d) The ash samples were transferred into labelled containers for further mineral analysis.
3.6 Measurements of broiler performance
Performance parameters were measured weekly at day 0, 7, 14, 21, 28 and 34. Birds were counted every
week during weighing days. Birds were weighed weekly in groups per pen. Body weight was calculated
as total weight of group divided by number of birds. Feed intake was calculated weekly or with each
change over to a next phase feed. Average daily gain (ADG) was calculated as group weight divided by
number of birds and number of days. Feed intake (FI) was measured as weight of feed offered less weight
of left overs and cumulative feed intake (CFI) calculated as feed consumed times number of days divided
by number of birds. Feed conversion ratio (FCR) was calculated as feed intake over the week divided by
body weight gain for the week. All FCR values were corrected for mortality including weight of dead
birds added to the weekly body weight gain (weekly feed intake divided by weekly body weight gain +
weight of dead birds including culls. Mortalities were collected twice daily, evaluated for probable cause
of death and weighed. Dead birds were stored in a freezer to be disposed of accordingly.
3.7 Measurements of bone density
Metatarsal bone samples were left to thaw at room temperature and soft tissues were mechanically
removed through dissection and clean bones were weighed in air. Bones were not boiled to avoid the
risk of Ca/P salt formation in water that could result in alteration of the mineral matrix of the bone. The
volume of wet bone was determined by the method described by Zhang and Coon (1997) where bones
were weighed in air and in water.
© University of Pretoria

CHAPTER 3 MATERIALS AND METHODS
Department of Animal and Wildlife Sciences
University of Pretoria
Page | 41
Graduated glass cylinder was filled to a set level with water at room temperature. The weight change
equals the weight of water replaced by the bone. The metatarsal bones were dipped into the water and
the level of water displaced by the weight of the bone was recorded. Khan et al. (1997) reported the
density of water at 0 °C to be 0.9998395 g/mL, while at 20 °C and 25 °C was 0.9982041 and 0.9970449
g/mL, respectively. The authors reported that at the temperature of 4°C the density of water in closest to
1.0 g/mL at 0.9999720 g/mL. In this case the density was rounded to 1.0 g/mL. The density was
calculated by dividing the mass by volume expressed in g/cm3 (p = m/v) where p is density, m is mass
and v is volume by displacement.
3.8 Statistical analysis
GenStat® statistical program (Payne, 2014) was used to analyse data.
3.8.1 Statistical analysis for performance parameters (BW, ADG, FI and FCR)
Linear mixed models (LMM) meta-analysis over the two trials was applied to test for differences
between 8 treatment effects of repeated measurements for BW, ADG, FI, CFI, FCR per week over 34
days. The fixed effects were specified as day, treatment and the day x treatment interaction. The random
effect was specified as pen number and the residual effects were not normally distributed and treatment
effects were homogenous. Means were separated using Tukey LSD at the 5% confidence level.
3.8.2 Statistical analysis for mortality
Mortality data was analysed using Generalised linear models (GLM). GLM extend the usual regression
framework to cater for non-Normal distributions. For example: binomial data recording r "successes"
out of n trials; in this study the numbers of mortalities per week out of the number of chicks per pen. The
logit link function, that defines the transformation required to make the model linear, was applied. The
standard errors were considered appropriate for interpretation of the predictions as summaries of the data
rather than as forecasts of new observations.
3.8.3 Statistical analysis of bone minerals and villi data
Linear mixed model analysis was applied testing for differences between treatment effects. Means were
separated with the alternative Fisher's protected LSD test where the Studentized Range statistic is used
instead of Student's t statistic at the 5% level of significance.
© University of Pretoria

Department of Animal and Wildlife Sciences
University of Pretoria
Page | 42
CHAPTER 4
RESULTS
4.1 Performance trail
4.1.1 Body weights (BW) from 0 to 34 days of age
Meta-analysis of body weights of broilers measured during Trial 1 and 2 are summarised in Table 4.1
and illustrated by Figure 4.1.
The body weights of broiler chicks at placements were not significantly different between any of the
treatments. At the end of day 7, body weights of broilers fed NC1 and NC3 were significantly lower
compared to the positive control (PC) while NC2 did not differ significantly from PC.
The addition of Ronozyme® HiPhos to NC1 (Trt1) or addition of Ronozyme® ProAct to NC 2 (Trt2) or
combination of Ronozyme® HiPhos and ProAct to NC3 (Trt3) diets significantly improved 7-day body
weight by 19%, 8.0% and 11.0%, respectively, when compared to deficient NC diets.
The supplementation of zinc bacitracin to the enzyme combination diets NC3 (Trt4), significantly
improved growth rate by 11% compared to NC3, but there was no significant difference when compared
to the broilers that received the combination of enzymes without zinc bacitracin (Trt3).
Addition of Ronozyme® HiPhos or combination of Ronozyme® HiPhos and ProAct to the restrictive
NC1 and NC3 diets improved body weight significantly from day 14 to 34 days. Addition of HiPhos
alone improved body weight at 14, 21, 28 and 34 day of age by 20%, 22%, 18% and 22%, respectively,
while addition of combination of Ronozyme® HiPhos and ProAct to the restrictive NC3 diets improved
weight at 14, 21, 28 and 34 days of age by 18%, 17%, 15.6% and 17%, respectively. Addition of
Ronozyme® ProAct alone (Trt2) did not show significant effect on body weight from day 14 to slaughter,
compared to both the PC and NC2 groups.
However, for Trt 1 and Trt 3, the addition of the exogenous enzymes to the respective negative control
diets improved growth rate of broilers to such an extent that it did not significantly differ from the
positive control diets.
© University of Pretoria

CHAPTER 4 RESULTS
Department of Animal and Wildlife Sciences
University of Pretoria
Page | 43
Table 4.1:14Least square means of weekly average body weights (BW) of broilers on day
0 to 34 days of age (g/bird)
Treatments Day 0 Day 7 Day 14 Day 21 Day 28 Day 34
PC 42.72 169.7ab 475.6a 954.0a 1576a 2154a
NC1 43.22 149.2d 378.2b 777.8b 1273b 1737b
NC2 42.45 161.3bc 463.4a 938.9a 1533a 2093a
NC3 43.22 157.0cd 396.6b 796.6b 1280b 1729b
Trt1 43.16 177.5a 471.3a 950.6a 1544a 2127a
Trt2 43.39 174.7a 478.2a 954.3a 1539a 2157a
Trt3 42.32 174.4a 467.7a 933.5a 1480a 2025a
Trt4 42.88 174.0a 469.9a 938.9a 1482a 2023a
Standard error of means 0.26 2.63 5.69 15.96 35.02 54.10
P value 0.045 <0.001 <0.001 <0.001 <0.001 <0.001
abcd Means with common superscripts within a column do not differ significantly (P > 0.05)
PC = Positive control (commercial diet); NC1 = Negative control 1 (reduced nutrients for phytase contribution); NC2 = Negative control 2
(reduced nutrients for protease contribution); NC3 = Negative control 3 (reduced nutrients for a combination of phytase and protease
contribution); Trt1 = NC1 + addition of 100 mg/kg Ronozyme® HiPhos; Trt2 = NC2 + addition of 200 mg/kg Ronozyme® ProAct; Trt3 =
NC3 + addition of Ronozyme® HiPhos at 100 mg/kg and ProAct at 200 mg/kg ; Trt4 = NC3 + addition of Ronozyme® HiPhos at 100mg/kg
and ProAct at 200 mg/kg and zinc bacitracin 15% at 50 mg/kg.
Figure 4.1:0Body weight of broilers from day 0 to 34 of age
0
200
400
600
800
1000
1200
1400
1600
1800
2000
2200
2400
Day 0 Day 7 Day 14 Day 21 Day 28 Day 34
Bo
dy
weg
hts
g/b
ird
Age (days)
PC
NC 1
NC 2
NC 3
TRT 1
TRT 2
TRT 3
TRT 4
© University of Pretoria

CHAPTER 4 RESULTS
Department of Animal and Wildlife Sciences
University of Pretoria
Page | 44
PC = Positive control (commercial diet); NC1 = Negative control 1 (reduced nutrients for phytase contribution); NC2 = Negative control 2
(reduced nutrients for protease contribution); NC3 = Negative control 3 (reduced nutrients for a combination of phytase and protease
contribution); Trt1 = NC1 + addition of 100 mg/kg Ronozyme® HiPhos; Trt2 = NC2 + addition of 200 mg/kg Ronozyme® ProAct; Trt3 =
NC3 + addition of Ronozyme® HiPhos at 100 mg/kg and ProAct at 200 mg/kg ; Trt4 = NC3 + addition of Ronozyme® HiPhos at 100mg/kg
and ProAct at 200 mg/kg and zinc bacitracin 15% at 50 mg/kg.
4.1.2 Daily weight gains of broilers (ADG) from 0 to 34 days of age
Meta-analysis of average daily weight gains of broilers measured during Trial 1 and 2 are summarised
in Table 4.2 and illustrated by Figure 4.2, respectively.
As indicated in Table 4.2, the average daily weight gain at 7 days was significantly lower for broilers fed
restrictive negative control diets compared to supplemented diets. The Ronozyme® HiPhos treatment
significantly improved weekly ADG at days 7 and 14 by 28% and 29%, respectively. Ronozyme®
ProAct treatment significantly improved weekly ADG of the deficient NC2 diet at day 7 by 11%.
The addition of exogenous enzymes Ronozyme® HiPhos to nutrient deficient NC1 diet significantly
improved weekly ADG at days 21 and 34 by 19% and 27 %, respectively, while there was no significant
improvement at day 28. Addition of combination of Ronozyme® HiPhos and ProAct to the nutrient
deficient NC3 diets significantly improved weekly ADG at days 21 by 17%. There were no significant
improvements when Ronozyme® ProAct or a combination of Ronozyme® HiPhos and ProAct were
added to nutrient deficient NC diets at ages 28 and 34 days.
There was no significant difference between the various treatment diets (Trt1, Trt2, Trt3 and Trt4).
Supplementation of exogenous enzymes Ronozyme® HiPhos alone or in combination with Ronozyme®
ProAct to the nutrient deficient negative control diets significantly improved weekly ADG from 0 to 34
days. The improvement was significantly positive to the extent that the performance did not significantly
differ from the PC.
© University of Pretoria

CHAPTER 4 RESULTS
Department of Animal and Wildlife Sciences
University of Pretoria
Page | 45
Table 4.2:15Least square means of average daily weight gain (ADG) for broilers from day 0 to
34 days of age (g/bird)
Treatment Day 0-7 Day 7-14 Day 14-21 Day 21-28 Day 28-34 Day 0-34
PC 15.85ab 43.49a 69.72a 89.35a 96.04a 62.11a
NC 1 13.40d 32.29b 57.74b 70.90bc 76.38b 49.83b
NC 2 15.03bc 42.44a 67.96a 83.90ab 91.84ab 60.33a
NC 3 14.10cd 34.09b 57.56b 67.83c 74.98b 49.59b
TRT 1 17.14a 41.68a 68.95a 84.06ab 97.03a 61.30a
TRT 2 16.72a 43.13a 69.22a 82.72ab 96.39a 62.17a
TRT 3 16.61a 41.79a 67.11a 77.71abc 90.78ab 58.34a
TRT 4 16.27ab 42.10a 67.30a 77.02abc 90.72ab 58.25a
Standard error of mean 0.3417 0.6646 1.857 3.338 4.043 1.587
P value <0.001 <0.001 <0.001 <0.001 <0.001 <0.001
abcd Means with common superscripts within a column do not differ significantly (P > 0.05)
PC = Positive control (commercial diet); NC1 = Negative control 1 (reduced nutrients for phytase contribution); NC2 = Negative control 2
(reduced nutrients for protease contribution); NC3 = Negative control 3 (reduced nutrients for a combination of phytase and protease
contribution); Trt1 = NC1 + addition of 100 mg/kg Ronozyme® HiPhos; Trt2 = NC2 + addition of 200 mg/kg Ronozyme® ProAct; Trt3 =
NC3 + addition of Ronozyme® HiPhos at 100 mg/kg and ProAct at 200 mg/kg ; Trt4 = NC3 + addition of Ronozyme® HiPhos at 100mg/kg
and ProAct at 200 mg/kg and zinc bacitracin 15% at 50 mg/kg.
© University of Pretoria
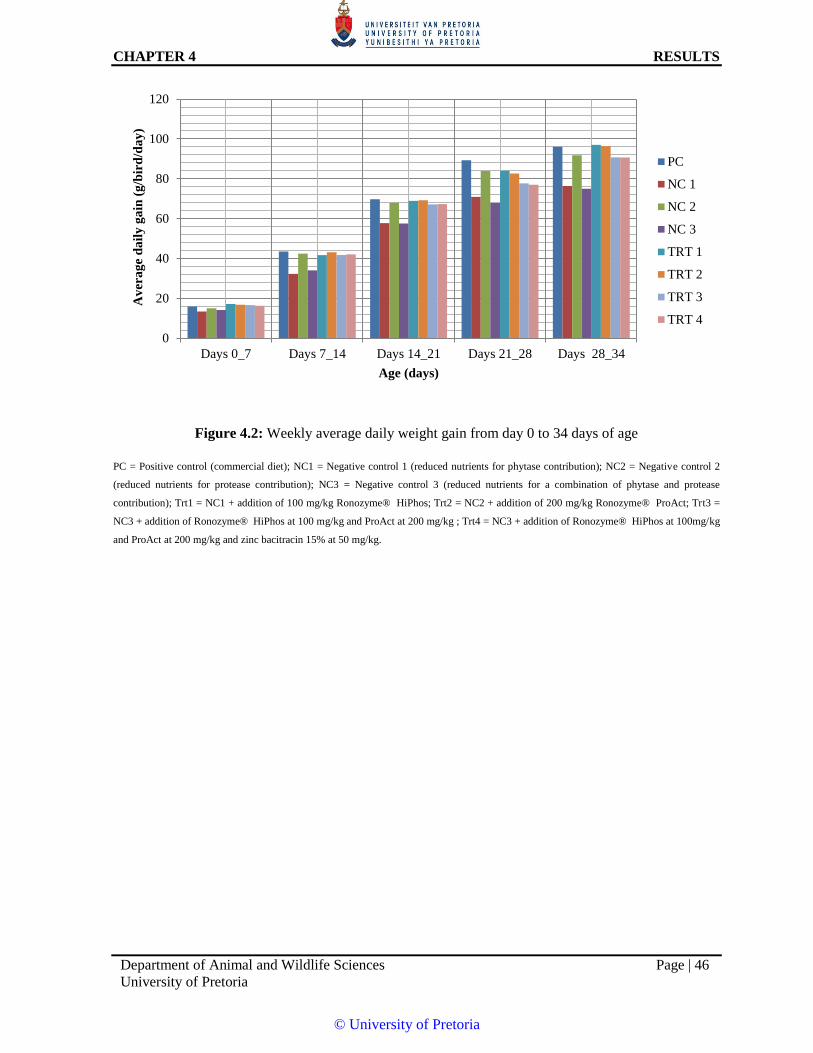
CHAPTER 4 RESULTS
Department of Animal and Wildlife Sciences
University of Pretoria
Page | 46
Figure 4.2: Weekly average daily weight gain from day 0 to 34 days of age
PC = Positive control (commercial diet); NC1 = Negative control 1 (reduced nutrients for phytase contribution); NC2 = Negative control 2
(reduced nutrients for protease contribution); NC3 = Negative control 3 (reduced nutrients for a combination of phytase and protease
contribution); Trt1 = NC1 + addition of 100 mg/kg Ronozyme® HiPhos; Trt2 = NC2 + addition of 200 mg/kg Ronozyme® ProAct; Trt3 =
NC3 + addition of Ronozyme® HiPhos at 100 mg/kg and ProAct at 200 mg/kg ; Trt4 = NC3 + addition of Ronozyme® HiPhos at 100mg/kg
and ProAct at 200 mg/kg and zinc bacitracin 15% at 50 mg/kg.
0
20
40
60
80
100
120
Days 0_7 Days 7_14 Days 14_21 Days 21_28 Days 28_34
Av
era
ge
da
ily
ga
in (
g/b
ird
/da
y)
Age (days)
PC
NC 1
NC 2
NC 3
TRT 1
TRT 2
TRT 3
TRT 4
© University of Pretoria

CHAPTER 4 RESULTS
Department of Animal and Wildlife Sciences
University of Pretoria
Page | 47
4.1.3 Feed intake (FI) for broilers from 0 to 34 days of age
The average weekly feed intake of broilers measured during Trial 1 and 2 are summarised in Table 4.3
and illustrated by Figure 4.3, respectively.
The average weekly feed intake of broilers fed nutrient deficient diets (NC1 and NC2) was lower in days
7, 21 and 34, respectively, as compared to PC. When nutrient deficient diets (NC) were fortified with
exogenous enzymes Ronozyme® HiPhos or ProAct, average feed intakes did not increase significantly.
The average feed intake of broilers fed PC diets improved during the first week (0-7 days) compared to
enzyme supplemented diets (Trt1, 2, 3, 4). In subsequent weeks, average feed intake of PC diets was not
higher than that of treatment diets.
Table 4.3:16Least square means of average daily feed intakes for broilers from day
0 to 34 days of age (g/bird)
Treatments Day 0-7 Day 7-14 Day 14-21 Day 21-28 Day 28-34
PC 32.46a 53.68ab 88.48 127.0 180.5a
NC 1 28.03cd 48.63b 84.56 106.9 145.1b
NC 2 30.42ab 51.08ab 90.40 118.9 161.6ab
NC 3 26.35d 48.54ab 77.31 115.1 137.7b
TRT 1 28.39bcd 54.23ab 93.67 130.9 166.2ab
TRT 2 29.34bc 55.72ab 87.16 134.3 171.1ab
TRT 3 28.55bcd 56.29a 89.86 130.2 171.6ab
TRT 4 28.62bcd 55.16ab 92.40 128.1 160.2ab
Standard error of means 0.5205 1.762 4.181 6.697 7.724
P value <0.001 0.011 0.142 0.085 0.006
abcd Means with common superscripts within a column do not differ significantly (P > 0.05)
PC = Positive control (commercial diet); NC1 = Negative control 1 (reduced nutrients for phytase contribution); NC2 = Negative control 2
(reduced nutrients for protease contribution); NC3 = Negative control 3 (reduced nutrients for a combination of phytase and protease
contribution); Trt1 = NC1 + addition of 100 mg/kg Ronozyme® HiPhos; Trt2 = NC2 + addition of 200 mg/kg Ronozyme® ProAct; Trt3 =
NC3 + addition of Ronozyme® HiPhos at 100 mg/kg and ProAct at 200 mg/kg ; Trt4 = NC3 + addition of Ronozyme® HiPhos at 100mg/kg
and ProAct at 200 mg/kg and zinc bacitracin 15% at 50 mg/kg.
© University of Pretoria

CHAPTER 4 RESULTS
Department of Animal and Wildlife Sciences
University of Pretoria
Page | 48
Figure 4.3: Weekly average feed intakes from day 0 to 34 days of age
PC = Positive control (commercial diet); NC1 = Negative control 1 (reduced nutrients for phytase contribution); NC2 = Negative control 2
(reduced nutrients for protease contribution); NC3 = Negative control 3 (reduced nutrients for a combination of phytase and protease
contribution); Trt1 = NC1 + addition of 100 mg/kg Ronozyme® HiPhos; Trt2 = NC2 + addition of 200 mg/kg Ronozyme® ProAct; Trt3 =
NC3 + addition of Ronozyme® HiPhos at 100 mg/kg and ProAct at 200 mg/kg ; Trt4 = NC3 + addition of Ronozyme® HiPhos at 100mg/kg
and ProAct at 200 mg/kg and zinc bacitracin 15% at 50 mg/kg.
4.1.4 Cumulative feed intakes (CFI) for broilers from 0 to 34 days of age
Meta-analysis of cumulative feed intakes of broilers measured during Trial 1 and 2 are summarised in
Table 4.4 and illustrated by Figure 4.4, respectively.
The cumulative feed intake of birds fed nutrient deficient diets differed significantly to the birds
supplemented with exogenous enzymes from 0 to 21 days of age. The addition of Ronozyme® HiPhos
to the nutrient deficient NC1, significantly increased cumulative feed intake at 28 days by 15%, while
addition of enzyme combination to nutrient deficient NC3 (Trt3) significantly increased cumulative feed
intake at day 34 by 15.8%.
20
40
60
80
100
120
140
160
180
200
Day 0-7 Day 7-14 Day 14-21 Day 21-28 Day 28-34
Fee
d i
nta
ke
g/b
ird
Age (days)
PC
NC 1
NC 2
NC 3
TRT 1
TRT 2
TRT 3
TRT 4
© University of Pretoria

CHAPTER 4 RESULTS
Department of Animal and Wildlife Sciences
University of Pretoria
Page | 49
Table 4.4:17Least square means of cumulative feed intakes (CFI) from day 0 to 34 days of age (g/bird)
Treatment Day 0 - 7 Day 0 - 14 Day 0 - 21 Day 0 - 28 Day 0 – 34
PC 226a 599b 1174ab 2138abc 3165a
NC1 196cd 525a 1095ab 1910c 2764ab
NC2 214ab 573ab 1206ab 2095abc 3080a
NC3 185d 524a 1076a 1920bc 2742b
TRT 1 198bcd 571ab 1237b 2192a 3191a
TRT 2 205bc 589b 1176ab 2166a 3165a
TRT 3 201bcd 584ab 1160ab 2150ab 3174a
TRT 4 200bcd 590b 1222ab 2173a 3130a
Standard error of means 3.81 13.98 35.45 55.56 83.4
P value <0.001 <0.001 0.025 <0.001 <0.001
abcd Means with common superscripts within a column do not differ significantly (P > 0.05)
PC = Positive control (commercial diet); NC1 = Negative control 1 (reduced nutrients for phytase contribution); NC2 = Negative control 2
(reduced nutrients for protease contribution); NC3 = Negative control 3 (reduced nutrients for a combination of phytase and protease
contribution); Trt1 = NC1 + addition of 100 mg/kg Ronozyme® HiPhos; Trt2 = NC2 + addition of 200 mg/kg Ronozyme® ProAct; Trt3 =
NC3 + addition of Ronozyme® HiPhos at 100 mg/kg and ProAct at 200 mg/kg ; Trt4 = NC3 + addition of Ronozyme® HiPhos at 100mg/kg
and ProAct at 200 mg/kg and zinc bacitracin 15% at 50 mg/kg.
Figure 4.4: Cumulative feed intakes from day 0 to 34 days of age
PC = Positive control (commercial diet); NC1 = Negative control 1 (reduced nutrients for phytase contribution); NC2 = Negative control 2
(reduced nutrients for protease contribution); NC3 = Negative control 3 (reduced nutrients for a combination of phytase and protease
contribution); Trt1 = NC1 + addition of 100 mg/kg Ronozyme® HiPhos; Trt2 = NC2 + addition of 200 mg/kg Ronozyme® ProAct; Trt3 =
NC3 + addition of Ronozyme® HiPhos at 100 mg/kg and ProAct at 200 mg/kg ; Trt4 = NC3 + addition of Ronozyme® HiPhos at 100mg/kg
and ProAct at 200 mg/kg and zinc bacitracin 15% at 50 mg/kg.
150350550750950
115013501550175019502150235025502750295031503350
Days 0 - 7 Days 0 - 14 Days 0 - 21 Days 0 - 28 Days 0 - 34
Cu
mu
lati
ve
feed
in
tak
e g
/bir
d
Age (days)
PC
NC1
NC2
NC3
TRT 1
TRT 2
TRT 3
TRT 4
© University of Pretoria

CHAPTER 4 RESULTS
Department of Animal and Wildlife Sciences
University of Pretoria
Page | 50
4.1.5 Weekly feed conversion ratio (FCR)
Meta-analysis of weekly conversion ratio of broilers measured during Trial 1 and 2 are summarised in
Table 4.5 and illustrated by Figure 4.5; respectively. Feed conversion ratio (FCR) was corrected for birds
that were weighed as mortalities and culls. The addition of Ronozyme® HiPhos alone to nutrient
deficient diet NC1 significantly improved FCR in first week of production by 17%, but there was no
significant improvement in days 7 to 14, 14 to 21, 21 to 28 and 28 to 34. The broilers supplemented with
Ronozyme® ProAct added to the nutrient deficient NC2 has shown a significant improvement in FCR
of 13% in the first week of production but no significant difference in subsequent weeks.
There was no significant improvement in weekly FCR when NC3 diets were supplemented with
combination of Ronozyme® HiPhos and ProAct from first week to last week of production. The addition
of zinc bacitracin to Trt3 did not show any additional benefits to the FCR.
Table 4.5:18Least square means of weekly feed conversion from day 0 to 34 days of age (g/bird)
Treatment Day 0-7 Day 7-14 Day 14-21 Day 21-28 Day 28-34
PC 1.322c 1.227a 1.177a 1.594 1.568
NC 1 1.295bc 1.430b 1.414b 1.598 1.640
NC 2 1.316c 1.220a 1.182a 1.665 1.519
NC 3 1.179ab 1.382ab 1.236ab 2.011 1.618
Trt 1 1.105a 1.254ab 1.256ab 1.675 1.555
Trt 2 1.159a 1.317ab 1.229ab 1.736 1.470
Trt 3 1.144a 1.317ab 1.29ab 1.732 1.670
Trt 4 1.156a 1.332ab 1.329ab 1.757 1.501
Standard error of means 0.03082 0.04197 0.04962 0.0856 0.08008
P value <0.001 0.013 0.025 0.05 0.613
abcd Means with common superscripts within a column do not differ significantly (P > 0.05)
PC = Positive control (commercial diet); NC1 = Negative control 1 (reduced nutrients for phytase contribution); NC2 = Negative control 2
(reduced nutrients for protease contribution); NC3 = Negative control 3 (reduced nutrients for a combination of phytase and protease
contribution); Trt1 = NC1 + addition of 100 mg/kg Ronozyme® HiPhos; Trt2 = NC2 + addition of 200 mg/kg Ronozyme® ProAct; Trt3 =
NC3 + addition of Ronozyme® HiPhos at 100 mg/kg and ProAct at 200 mg/kg ; Trt4 = NC3 + addition of Ronozyme® HiPhos at 100mg/kg
and ProAct at 200 mg/kg and zinc bacitracin 15% at 50 mg/kg.
© University of Pretoria

CHAPTER 4 RESULTS
Department of Animal and Wildlife Sciences
University of Pretoria
Page | 51
Figure 4.5: Graphical representation of weekly feed conversion ratios from 0 to 34 days of age
PC = Positive control (commercial diet); NC1 = Negative control 1 (reduced nutrients for phytase contribution); NC2 = Negative control 2
(reduced nutrients for protease contribution); NC3 = Negative control 3 (reduced nutrients for a combination of phytase and protease
contribution); Trt1 = NC1 + addition of 100 mg/kg Ronozyme® HiPhos; Trt2 = NC2 + addition of 200 mg/kg Ronozyme® ProAct; Trt3 =
NC3 + addition of Ronozyme® HiPhos at 100 mg/kg and ProAct at 200 mg/kg ; Trt4 = NC3 + addition of Ronozyme® HiPhos at 100mg/kg
and ProAct at 200 mg/kg and zinc bacitracin 15% at 50 mg/kg.
4.1.6 Feed conversion ratio from 0 to 34 days of age
Meta-analysis of feed conversion ratio corrected for mortality of broilers measured during Trial
1 and 2 are summarised in Table 4.6 and illustrated by Figure 4.6, respectively.
The feed conversion ratio (FCR) was corrected for birds that were weighed as mortalities and
culls. The addition of Ronozyme® HiPhos alone to NC1 diet significantly improved FCR
significantly in first week of production, 0 to 14 days and 0 to 21 days by 17%, 13% and 15%,
respectively. There was no significant improvement in FCR in periods 0 to 28 and 0 to 34 days
respectively. The broilers supplemented with Ronozyme® ProAct added to the nutrient deficient
NC2 has shown a significant improvement of 13% in weekly feed conversion ratio only in the
first week of production.
1
1.2
1.4
1.6
1.8
2
2.2
0-7 7-14 14-21 21-28 28-34
Wee
kly
fee
d c
on
ver
sio
n r
ati
o
Age (days)
PC
NC 1
NC 2
NC 3
Trt 1
Trt 2
Trt 3
Trt 4
© University of Pretoria

CHAPTER 4 RESULTS
Department of Animal and Wildlife Sciences
University of Pretoria
Page | 52
There was no significant improvement in feed conversion ratio when NC diets were
supplemented with combination of Ronozyme® HiPhos and ProAct from 0 to 34 days. The
broilers fed treatments diets (Trt1, 2, 3 and 4) significantly converted feed efficiently compared
to PC during the first week of production by 20%, 14%, 16% and 14% respectively. The addition
of zinc bacitracin to Trt3 did not show any additional benefits to the FCR.
Table 4.6:19Least square means for feed conversion ratio for different treatments from day 0 to day 34
Treatment Day 0 – 7 Day 0 - 14 Day 0 – 21 Day 0 - 28 Day 0 – 34
PC 1.322c 1.261ab 1.209a 1.429 1.606
NC1 1.295bc 1.368b 1.395b 1.577 1.687
NC2 1.316c 1.273ab 1.201a 1.444 1.603
NC3 1.179ab 1.255ab 1.233a 1.571 1.741
TRT 1 1.105a 1.208a 1.215a 1.452 1.644
TRT 2 1.159a 1.288ab 1.245a 1.494 1.598
TRT 3 1.144a 1.252ab 1.273ab 1.517 1.713
TRT 4 1.156a 1.253ab 1.285ab 1.528 1.680
Standard error of means 0.03082 0.02687 0.03107 0.0367 0.04246
P value <0.001 0.022 0.004 0.05 0.116
abcd Means with common superscripts within a column do not differ significantly (P > 0.05)
PC = Positive control (commercial diet); NC1 = Negative control 1 (reduced nutrients for phytase contribution); NC2 = Negative control 2
(reduced nutrients for protease contribution); NC3 = Negative control 3 (reduced nutrients for a combination of phytase and protease
contribution); Trt1 = NC1 + addition of 100 mg/kg Ronozyme® HiPhos; Trt2 = NC2 + addition of 200 mg/kg Ronozyme® ProAct; Trt3 =
NC3 + addition of Ronozyme® HiPhos at 100 mg/kg and ProAct at 200 mg/kg ; Trt4 = NC3 + addition of Ronozyme® HiPhos at 100mg/kg
and ProAct at 200 mg/kg and zinc bacitracin 15% at 50 mg/kg.
© University of Pretoria

CHAPTER 4 RESULTS
Department of Animal and Wildlife Sciences
University of Pretoria
Page | 53
Figure 4.6: Graphical representation of feed conversion ratio from 0 to 34 days of age
PC = Positive control (commercial diet); NC1 = Negative control 1 (reduced nutrients for phytase contribution); NC2 = Negative control 2
(reduced nutrients for protease contribution); NC3 = Negative control 3 (reduced nutrients for a combination of phytase and protease
contribution); Trt1 = NC1 + addition of 100 mg/kg Ronozyme® HiPhos; Trt2 = NC2 + addition of 200 mg/kg Ronozyme® ProAct; Trt3 =
NC3 + addition of Ronozyme® HiPhos at 100 mg/kg and ProAct at 200 mg/kg ; Trt4 = NC3 + addition of Ronozyme® HiPhos at 100mg/kg
and ProAct at 200 mg/kg and zinc bacitracin 15% at 50 mg/kg.
4.1.7 Mortality during the course of the experiment
Mortalities were variable for each week of the growing phase. There was no observation of specific
deaths associated with dietary treatments. High incidences of mortality were observed in treatment
groups where nutrient contribution of Ronozyme® HiPhos matrix alone and combination of Ronozyme®
HiPhos and ProAct matrix values were reduced with no enzyme supplementation (NC1 and NC3),
compared to the rest of other treatments. These number of deaths were observed during weeks 3 to 4
with high percentage of non-specific causes of deaths from lethargic birds.
Specific bone related incidences were very low in all groups. Birds that died of sudden death syndrome
(SDS) were observed at different ages in all the treatment groups. Although broiler house conditions
were managed to the best of ability, some of the deaths could have been related to ventilation and heat
stress as a result of sub-optimal housing conditions.
1.10
1.20
1.30
1.40
1.50
1.60
1.70
1.80
0-7 0-14 0-21 0-28 0-34
Fee
d c
on
ver
tio
n r
ati
o
Age (Days)
PC
NC1
NC2
NC3
Trt1
Trt2
Trt3
Trt4
© University of Pretoria

CHAPTER 4 RESULTS
Department of Animal and Wildlife Sciences
University of Pretoria
Page | 54
Table 4.7:20Least square means for average weekly mortality (%) for different treatments from day 0
to day 34 of age
Treatments Day 0-7 Day 7-14 Day 14-21 Day 21-28 Day 28-34
PC 1.10 0.67 0.74 1.89 0
NC 1 1.52 1.57 2.11 5.88 5.34
NC 2 1.68 0 0.71 1.97 0.52
NC 3 2.13 1.81 1.27 9.06 3.21
Trt 1 1.93 0.90 0.24 1.77 0.75
Trt 2 1.56 0.44 0.46 1.23 0.50
Trt 3 1.93 1.80 0.68 0.25 1.32
Trt 4 1.28 0.89 1.49 1.71 2.12
Standard error of means 0.223 0.201 0.178 0.244 0.174
P value 0.973 0.495 0.547 0.11 0.114
abcd Means with common superscripts within a column do not differ significantly (P > 0.05)
PC = Positive control (commercial diet); NC1 = Negative control 1 (reduced nutrients for phytase contribution); NC2 = Negative control 2
(reduced nutrients for protease contribution); NC3 = Negative control 3 (reduced nutrients for a combination of phytase and protease
contribution); Trt1 = NC1 + addition of 100 mg/kg Ronozyme® HiPhos; Trt2 = NC2 + addition of 200 mg/kg Ronozyme® ProAct; Trt3 =
NC3 + addition of Ronozyme® HiPhos at 100 mg/kg and ProAct at 200 mg/kg ; Trt4 = NC3 + addition of Ronozyme® HiPhos at 100mg/kg
and ProAct at 200 mg/kg and Zinc bacitracin 15% at 50 mg/kg.
© University of Pretoria
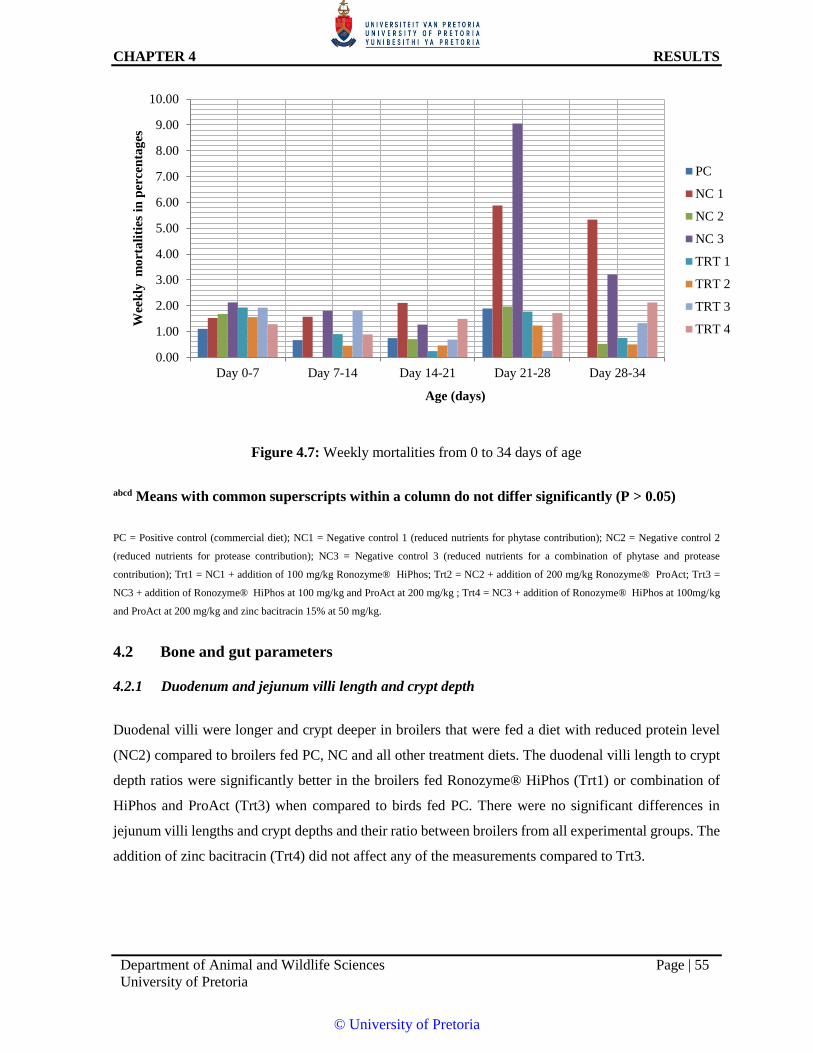
CHAPTER 4 RESULTS
Department of Animal and Wildlife Sciences
University of Pretoria
Page | 55
Figure 4.7: Weekly mortalities from 0 to 34 days of age
abcd Means with common superscripts within a column do not differ significantly (P > 0.05)
PC = Positive control (commercial diet); NC1 = Negative control 1 (reduced nutrients for phytase contribution); NC2 = Negative control 2
(reduced nutrients for protease contribution); NC3 = Negative control 3 (reduced nutrients for a combination of phytase and protease
contribution); Trt1 = NC1 + addition of 100 mg/kg Ronozyme® HiPhos; Trt2 = NC2 + addition of 200 mg/kg Ronozyme® ProAct; Trt3 =
NC3 + addition of Ronozyme® HiPhos at 100 mg/kg and ProAct at 200 mg/kg ; Trt4 = NC3 + addition of Ronozyme® HiPhos at 100mg/kg
and ProAct at 200 mg/kg and zinc bacitracin 15% at 50 mg/kg.
4.2 Bone and gut parameters
4.2.1 Duodenum and jejunum villi length and crypt depth
Duodenal villi were longer and crypt deeper in broilers that were fed a diet with reduced protein level
(NC2) compared to broilers fed PC, NC and all other treatment diets. The duodenal villi length to crypt
depth ratios were significantly better in the broilers fed Ronozyme® HiPhos (Trt1) or combination of
HiPhos and ProAct (Trt3) when compared to birds fed PC. There were no significant differences in
jejunum villi lengths and crypt depths and their ratio between broilers from all experimental groups. The
addition of zinc bacitracin (Trt4) did not affect any of the measurements compared to Trt3.
0.00
1.00
2.00
3.00
4.00
5.00
6.00
7.00
8.00
9.00
10.00
Day 0-7 Day 7-14 Day 14-21 Day 21-28 Day 28-34
Wee
kly
m
ort
ali
ties
in
per
cen
tag
es
Age (days)
PC
NC 1
NC 2
NC 3
TRT 1
TRT 2
TRT 3
TRT 4
© University of Pretoria

CHAPTER 4 RESULTS
Department of Animal and Wildlife Sciences
University of Pretoria
Page | 56
Table 4.8:21Least square means of the duodenal and jejunum villi length (VL) and crypt depth (CD)
and VL:CD
Duodenum Jejunum
Treatment Villi
length
Crypt
Depth
VL:CD
Ratio
Villi
length
Crypt
Depth
VL:CD
Ratio
PC 111.6b 13.62b 8.20b 99.59 10.12 9.68
NC 1 110.3b 11.83b 9.39ab 72.78 8.77 8.33
NC 2 220.2a 24.07a 9.06ab 83.66 8.82 9.63
NC 3 77.9b 8.59b 9.07ab 83.78 8.17 10.24
Trt 1 102.5b 9.68b 10.75a 75.82 8.77 8.63
Trt 2 117.9b 11.62b 10.46ab 74.99 8.29 9.07
Trt 3 116.1b 10.66b 10.79a 66.79 8.08 8.12
Trt 4 108.1b 10.47b 10.31ab 79.44 8.95 8.99
Standard error of means 13.43 1.29 0.55 9.047 0.715 0.66
P value <0.001 <0.001 0.021 0.315 0.505 0.325
abcd Means with common superscripts within a column do not differ significantly (P > 0.05)
VH:CD = Villi height and crypt depth ratio
PC = Positive control (commercial diet); NC1 = Negative control 1 (reduced nutrients for phytase contribution); NC2 = Negative control 2
(reduced nutrients for protease contribution); NC3 = Negative control 3 (reduced nutrients for a combination of phytase and protease
contribution); Trt1 = NC1 + addition of 100 mg/kg Ronozyme® HiPhos; Trt2 = NC2 + addition of 200 mg/kg Ronozyme® ProAct; Trt3 =
NC3 + addition of Ronozyme® HiPhos at 100 mg/kg and ProAct at 200 mg/kg ; Trt4 = NC3 + addition of Ronozyme® HiPhos at 100mg/kg
and ProAct at 200 mg/kg and zinc bacitracin 15% at 50 mg/kg.
© University of Pretoria

CHAPTER 4 RESULTS
Department of Animal and Wildlife Sciences
University of Pretoria
Page | 57
Figure 4.8: Graphical representation of villi length to crypt depth ratios of duodenum of a broiler at 28
days of age
VL:CD = the ratio between villi height and crypt depth ratio
PC = Positive control (commercial diet); NC1 = Negative control 1 (reduced nutrients for phytase contribution); NC2 = Negative control 2
(reduced nutrients for protease contribution); NC3 = Negative control 3 (reduced nutrients for a combination of phytase and protease
contribution); Trt1 = NC1 + addition of 100 mg/kg Ronozyme® HiPhos; Trt2 = NC2 + addition of 200 mg/kg Ronozyme® ProAct; Trt3 =
NC3 + addition of Ronozyme® HiPhos at 100 mg/kg and ProAct at 200 mg/kg ; Trt4 = NC3 + addition of Ronozyme® HiPhos at 100mg/kg
and ProAct at 200 mg/kg and zinc bacitracin 15% at 50 mg/kg.
8.20b
9.4ab
10.75b
9.06ab
10.46ab
9.07ab
10.79b
10.31ab
PC NC1 Trt1 NC2 Trt2 NC3 Trt3 Trt4
Duodenum villi length to crypt ratios
© University of Pretoria

CHAPTER 4 RESULTS
Department of Animal and Wildlife Sciences
University of Pretoria
Page | 58
Figure 4.9: Haematoxylin and eosin staining. Cross section of the duodenum tissue specimen of a broiler
chicken at 28 days of age.
Figure 4.10: Graphical representation of villi length to crypt depth ratios of the jejunum of a broiler at
28 days of age
VL:CD = the ratio between villi height and crypt depth ratio.
PC = Positive control (commercial diet); NC1 = Negative control 1 (reduced nutrients for phytase contribution); NC2 = Negative control 2
(reduced nutrients for protease contribution); NC3 = Negative control 3 (reduced nutrients for a combination of phytase and protease
contribution); Trt1 = NC1 + addition of 100 mg/kg Ronozyme® HiPhos; Trt2 = NC2 + addition of 200 mg/kg Ronozyme® ProAct; Trt3 =
NC3 + addition of Ronozyme® HiPhos at 100 mg/kg and ProAct at 200 mg/kg ; Trt4 = NC3 + addition of Ronozyme® HiPhos at 100mg/kg
and ProAct at 200 mg/kg and zinc bacitracin 15% at 50 mg/kg.
9.68
8.33
8.63
9.07
9.63
10.24
8.12
8.99
PC NC1 Trt1 NC2 Trt2 NC3 Trt3 Trt4
Jejunum villi length to crypt ratios
© University of Pretoria

CHAPTER 4 RESULTS
Department of Animal and Wildlife Sciences
University of Pretoria
Page | 59
Figure 4.11: Haematoxylin and eosin staining slides. Cross section of the jejunum tissue specimen of
a broiler at 28 days of age.
4.2.2 Metatarsus bone parameters
The metatarsus bone mineral volume, ash, Ca and P were measured in group of birds per treatment pen.
Fresh and dry bone density and fat free dry matter calculated. The addition of enzymes to negative control
diets did not have any significant effect on bone density, bone mass (fresh and dry), ash concentration,
percentage ash, Ca and P. Bone ash mass of broilers fed diets deficient in nutrient NC3 (reduced nutrients
matrix contribution of Ronozyme® HiPhos and ProAct) was significantly lower compared to the NC2
and Trt1.
© University of Pretoria

CHAPTER 4 RESULTS
Department of Animal and Wildlife Sciences
University of Pretoria
Page | 60
Table 4.9:22Least square means of metatarsal bone mineral measurements
Treatments FBD
(g/cm3)
DBD
(g/cm3)
FBM
(g)
FFDBM
(g)
Ash
Mass
(g)
Ash/FFD
BM (g/g)
Bone ash
conc.
(g/cm3)
Ash %
% Ca (as
% of
ash)
%P (as %
of ash)
Ca: P
Ratio
PC 0.499 0.897 1.079 0.745 0.419ab 0.402 0.191 40.21 41.84 18.11 2.31
NC 1 0.524 0.950 1.111 0.709 0.392ab 0.357 0.184 35.68 42.43 17.79 2.39
NC 2 0.516 0.976 1.226 0.881 0.513a 0.428 0.212 42.74 42.10 18.03 2.34
NC 3 0.411 0.783 0.995 0.632 0.329b 0.332 0.136 33.22 41.83 17.74 2.36
Trt 1 0.642 0.846 1.368 0.846 0.509a 0.441 0.235 38.12 42.00 17.90 2.35
Trt 2 0.578 0.849 1.156 0.772 0.432ab 0.382 0.216 38.19 42.61 18.09 2.36
Trt 3 0.704 0.865 1.408 0.865 0.502ab 0.362 0.251 36.18 41.51 17.77 2.34
Trt 4 0.544 0.818 1.243 0.818 0.472ab 0.379 0.205 37.91 41.52 17.81 2.33
Standard error of means 0.092 0.062 0.145 0.064 0.039 0.028 0.026 2.513 0.621 0.113 0.028
P value 0.488 0.398 0.643 0.136 0.030 0.398 0.125 0.281 0.749 0.049 0.564
abcd Means with common superscripts within a column do not differ significantly (P > 0.05)
FBD = fresh bone density (fresh bone mass/fresh bone volume; DBD = dry bone density (dried bone mass/dried bone volume); FBM = fresh bone mass; FFDBM = fat free dried bone mass; Bone ash conc. = ash
concentration; Ca: P ratio = ratio of percentage Ca to percentage PPC = Positive control (commercial diet); NC1 = Negative control 1 (reduced nutrients for phytase contribution); NC2 = Negative control 2 (reduced
nutrients for protease contribution); NC3 = Negative control 3 (reduced nutrients for a combination of phytase and protease contribution); Trt1 = NC1 + addition of 100 mg/kg Ronozyme® HiPhos; Trt2 = NC2 +
addition of 200 mg/kg Ronozyme® ProAct; Trt3 = NC3 + addition of Ronozyme® HiPhos at 100 mg/kg and ProAct at 200 mg/kg ; Trt4 = NC3 + addition of Ronozyme® HiPhos at 100mg/kg and ProAct at 200
mg/kg and zinc bacitracin 15% at 50 mg/kg.
© University of Pretoria

Department of Animal and Wildlife Sciences
University of Pretoria
Page | 61
CHAPTER 5
DISCUSSION
Exogenous enzymes have always been under continuous scrutiny and remain recognised as innovative
animal feed additives that are effective in improving digestibility of traditional feed raw ingredients. The
economic benefits of supplementing exogenous enzymes in poultry nutrition was described by Costa et
al. (2008) as being related to feed cost reduction, opportunity for flexibility in feed formulation, better
performance, improved litter quality and health status with subsequent saving on total cost of poultry
production. The use of combination of enzymes in this study offered an opportunity to lower feed cost
and total cost of production.
The supplementation of exogenous enzymes to the poultry feeds is only rational if the targeted substrate
is well understood and sufficient for the enzymes it is specified for. Therefore, it is also important to
acknowledge that the complementary hydrolysis produced by the exogenous enzymes on substrates
depends on the undigested fraction of the substrates passing through the gastrointestinal tract (Vieira et
al., 2014). In addition, the choice of which enzyme or enzyme combination to use in feed require that
nutritionists follow a strategic approach focusing on the substrate concentration and indigestible fraction
of ingredients.
Nutritionist are tasked to ensure that their strategic approaches to enzyme supplementation take into
account sensible nutrient contributions to give advantage to cost saving and efficacy of these enzymes.
The performance response of broilers to supplementation of exogenous enzymes and the magnitude of
which these enzymes can lower feed cost are dependent on these strategic approaches. Pack and Bedford
(1997) described two approaches in which exogenous enzymes can be applied to the diets. The first
approach was described as manipulating the formulation of the standard diet by reducing the nutritional
level and adding enzymes to restore nutritional value of the standard diet. The second method was
through addition of enzymes to standard rations without altering the nutrient level. This method was
referred to as “over the top”. In this second method, cost saving may not be realised and additional cost
have to be justified. The most commonly used approach is to change the diet formulation by reducing
nutrient concentration and supplementing exogenous enzymes to provide identical nutritional values to
the diet without adversely affecting bird performance. Matrix values are thus assigned to the enzyme
product.
© University of Pretoria

CHAPTER 5 DISCUSSION
Department of Animal and Wildlife Sciences
University of Pretoria
Page | 62
The latter strategy was followed in this study with standard commercial broiler starter and finisher diets
(PC) as the base and the nutrient levels were reduced to elicit a negative effect in the chicken that received
the negative control diets. The enzymes were added to these diets with reduced nutrients and it was
hypothesised that the performance of the broilers should improve to the same level or better than the
broilers from the PC group.
The results of this study indicated that supplementation of exogenous enzymes Ronozyme® HiPhos and
ProAct to reduced nutrients speciation of maize-soya based diets of broiler chickens has shown not to
negatively affect nutrient utilisation and performance parameters. Supplementation of Ronozyme®
HiPhos or combination of HiPhos and ProAct to NC diets significantly improved BW and ADG
throughout the production cycle. The benefit of adding Ronozyme® ProAct was only observed during
the first 7 days of production for BW, ADG and FCR. This can be explained by the inability of young
broilers chicks to secrete sufficient endogenous enzymes to digest complex plant substrates. Douglas et
al. (2000) reported that chicks cannot produce sufficient endogenous enzymes and the use of exogenous
enzymes will enhance catalytic and hydrolytic activities and increase the rate of digestion, absorption
and metabolism of complex organic feed ingredients. Olukosi et al. (2007) reported that supplementation
of exogenous enzymes to young chicks improved nutrient digestibility. Angel et al. (2011) also found
that the addition of protease at concentrations of 200 mg/kg to the low protein starter diets fed to birds
for 3 weeks of age completely compensated for performance losses, resulting in improvement of amino
acid digestibility and subsequently ADG and FCR similar to the birds fed the PC diets. These differences
could be a result of under development of the birds’ capacity to secrete endogenous enzymes.
Bao et al. (2013) conducted an extensive review of the pattern of different exogenous enzymes on feed
ingredients. In their review these authors indicated that although phytase is able to show positive
response in many enzyme trials, carbohydrases and proteases results were seldom consistent in their
responses. These authors stated a number of possible reasons causing such inconsistencies. These reasons
were said to vary from application of inappropriate matrix values, nutrient imbalances, variance in
underlying ingredient quality and changes in ingredients proportions with reformulation. In this study,
the addition of protease (Ronozyme® ProAct) significantly improved BW, ADG and FCR only in the
first week of the broilers’ life. This improvement in performance can be associated with complementary
effect of exogenous protease to the limited levels of endogenous proteases and other secretion in the GIT
of young broilers. It is possible then that part of the beneficial effect of exogenous protease is mediated
via a reduction in the loss of muco-protein from the intestine (Cowieson et al., 2014).
© University of Pretoria

CHAPTER 5 DISCUSSION
Department of Animal and Wildlife Sciences
University of Pretoria
Page | 63
This may be associated with a reduction in mucin secretion or an increase in the autolytic recovery of
mucin, or both. The mechanism by which exogenous protease may result in autolytic recovery of the
mucin was suggested to be a result of reduction of HCl and pepsin in the gastric phase of digestion
(Cowieson et al., 2009). It is possible that exogenous protease reduced the secretion of HCl and pepsin
in the gastric phase of digestion, reducing the need for mucin as a protective agent in the intestine.
Although part of the benefits protease enzymes offer can be related to the work by Cowieson et al. (2014),
one of the main reason to inconsistencies of protease enzymes was pointed out by Bao et al. (2013) and
it was ascribed to ‘responsiveness’ of the diet modification by enzymes. The authors further emphasised
that the ‘responsiveness’ of a diet or an ingredient to exogenous enzymes was difficult to accurately
determine. There are factors such as substrate concentration and accessibility, inherent digestibility,
nutrient interactions, anti-nutrients, and solubility in water that are at the core of responsiveness of
exogenous protease or carbohydrases. In relation to this study, it can be concluded that although
Ronozyme® ProAct did not affect performance negatively, the results were positively consistent from
starter to finisher although the birds performed significantly better in the early stages of the bird’s life.
Therefore, more extended knowledge of the responsiveness of Ronozyme® ProAct in different ages of
the birds, feeding phases and dietary protein concentration may assist in optimising the economic
benefits of proteases.
It is important to note that in the current experiment there were no significant differences found in any
of the parameters measured between PC and NC2 groups. This could mean that the broilers receiving
the NC2 diet were not deficient in any nutrient and that the addition of Ronozyme® ProAct to the NC2
diets could not improve the nutritional status of the birds and therefore performance. This experiment
was thus not successful in evaluating the efficacy of Ronozyme® ProAct.
The intestinal morphology was measured as an indication of gut health and nutrient utilisation. It was
hypothesised that addition of enzymes will improve gut health as measured by improvement in the villi
length and crypt depth in the duodenum and jejunum sections of the small intestine. Duarte et al. (2014)
reported that an increase in crypt depth was related to mucosal cell turnover. Sayrafi et al. (2011) studied
the responses of histo-morphometrical parameters to AGP and alternative additives and reported that an
increase in crypt depth indicates accelerated villi renewal which occurs as a result of damaged mucosal
cells. The process of cell renewal is a nutrient expenditure process. Wyatt et al. (2008) reported that if
digestion is improved in the upper intestine it may lower endogenous secretions by the gut villi as a result
reducing the maintenance requirement spent on digestion with subsequent improvement in nutrient
retention.
© University of Pretoria
CHAPTER 5 DISCUSSION
Department of Animal and Wildlife Sciences
University of Pretoria
Page | 64
In this study, the duodenal VH to CD ratio of Trt1 and Trt3 was significantly higher than PC and other
treatment groups. This is an indication that the addition of phytase alone or phytase with protease was
positively related to the increased duodenal VH to CD ratio. In the jejunum, VH to CD ratio did not
differ between any of the treatments. Improvement in VH, CD and VH to CD ratios of the duodenum
could have contributed to improvement in GIT health and production performance.
Wu et al. (2004) fed broilers microbial phytase or xylanase or combination of the two enzymes to wheat
based diets. Microbial phytase increased villi height in the duodenum as compared to the jejunum or
ileum. The authors concluded that performance improvement in the phytase supplemented group could
be due to the increase in absorptive surface area of the duodenum that improved nutrient absorption.
They also observed that the addition of microbial phytase reduced the number of goblet cells in villi of
the jejunum compared to un-supplemented group. These authors attributed the reduction in number of
goblet cells to a reduction in mucin production and endogenous protein losses. Findings of Wu et al.
(2004) were consistent with Cowieson et al. (2003) where they reported that addition of phytic acids
increased production of silicic acid which is an indicator of mucin production. The results of our study
was in agreement with both studies where the addition of phytase alone or in combination with protease
improved the villi length and crypt depth and its ratio in the duodenum as compared to the un-
supplemented PC control group.
Soybean meal contains relatively high levels of non-starch polysaccharides, which are potentially
antagonistic to nutrient utilisation and can negatively affect the intestinal morphology (Zanella et al.,
1999). The authors further explained that supplementing maize-soya based diets with NSP degrading
enzymes can potentially yield improved nutrient digestibility and reduce endogenous amino acid losses,
resulting in the conservation of endogenous utilisable energy that may be otherwise used for protein
accretion (Zanella et al., 1999). Most of the literature consider a combination of phytase with NSP
degrading carbohydrases as an effective approach to improve gut morphology in maize-soya diets. In
this study, significant improvement in the duodenum villi was observed even without carbohydrase
enzymes which indicates the efficacy of phytase or phytase and protease combination.
The incorporation of AGP, zinc bacitracin to Trt3, (Trt4) was evaluated to consider the effect when
protease and phytase were supplemented. There was no difference in performance in both enzymes
supplemented diets and NC diets. Studies reported enzymes to be an effective tool improve efficiency
when AGP free diets are fed to poultry. Attia et al. (2016) studied the effect of two different sources of
phytase with and without AGP, zinc bacitracin.
© University of Pretoria

CHAPTER 5 DISCUSSION
Department of Animal and Wildlife Sciences
University of Pretoria
Page | 65
These authors did not notice any improvement in performance parameters when zinc bacitracin was
added at a rate of 500mg/kg to the diets with or without exogenous phytase. It was clear from the study
that exogenous enzymes could act as a gut modulator reducing the substrate available for the pathogens
in the gut.
The bone mineral concentration and density did not respond to reduced specification treatments groups
(NC) or in enzyme supplemented treatment groups. Yan et al. (2005) conducted experiments to evaluate
the ability of broiler chickens to adapt to Ca and P deficiency. They fed diets low in P (49.5 vs. 56.0%)
and Ca (60.9 vs. 71.1%) and measured the absorptive ability on 18, 21 and 23 days. The birds fed
moderately deficient P and Ca were able to adapt to the deficiency. In another study, Blahos and
Sommerville (1987) established that chicks fed Ca deficient diets for 2 weeks exhibited an increase in
duodenal and ileal absorption of P labelled as 32P. When diets deficient in P were fed for two weeks, a
slightly significant increase in the duodenal P absorption was observed. These authors suggested that
this interchangeable adaptation process was due to a compensatory increase in 1, 25-dihydroxy-vitamin
D3. The level of vitamin D3 in this study was 10 000 IU/kg which was relatively higher than most
published recommended levels from literature. In part, these levels of vitamin D3 could have contributed
to supporting the compensatory increase in 1, 25-dihydroxy-vitamin D3.
However, Ravindran et al. (2000) further challenged the Ca and P adaptation process by investigating
the role of phytase enzymes in the adaptation process. The authors revealed that decreasing nPP from
0.45% to 0.23% did not improve ileal P absorption when phytase is absent in the diet. The lack of
negative response to bone mineralisation observed in our study when low specification diets (NC) were
fed can be due to the birds’ ability to adapt to moderate Ca and P deficiency during the period when
bones were harvested at 28 day of age. Several authors have reported different factors explaining some
of the adaptation process. The increase in the plasma level of calbindin reported by Morrisey and
Wasserman (1971), duodenal Ca pump mRNA observed in broiler chicks (Cai et al., 1993) and intestinal
phosphate co-transporter observed in humans (Xu et al., 2002) were reported to be correlated to
adaptation to Ca and P deficiency. Although it is widely reported in literature that 1, 25-dihydroxy-
vitamin D3 is involved in the initial signalling process, the actual initial process is still not well understood
in poultry. Hence, the lack of response in bone mineralisation to enzyme supplementation was not clearly
highlighted.
© University of Pretoria

CHAPTER 5 DISCUSSION
Department of Animal and Wildlife Sciences
University of Pretoria
Page | 66
FINANCIAL EVALUATION
Table 5.1:23Financial calculation of margin over feed cost for exogenous enzyme(s) supplementation in broiler starter feed compared to
Positive control diets
Raw material prices were based on market prices. The cost of broiler production of R9.90/bird was used for the financial calculation.
MoFC – Margin over feed cost
* Increase MoFC - negative value is an indication of decrease in MoFC.
** Total savings (cent per bird) – negative value indicate saving as a results of improvement in weight gain and enzyme(s) supplementation.
Treatments PC NC1 NC2 NC3 Trt1 Trt2 Trt3 Trt4
Live weight gain (kg) 0.954 0.778 0.939 0.797 0.951 0.954 0.934 0.939
Income R/bird (weight gain) R 9.44 R 7.70 R 9.30 R 7.89 R 9.41 R 9.45 R 9.24 R 9.30
Live weight gain cost saving cents/bird -R 0.03 R 0.00 -R 0.20 -R 0.15
Feed intake (kg) 1.174 1.095 1.206 1.076 1.237 1.176 1.16 1.222
Cost cents/kg 379.16 347.61 369.78 339.93 348.09 373.56 343.80 344.98
Feed cost cents/bird R 4.45 R 3.81 R 4.46 R 3.66 R 4.31 R 4.39 R 3.99 R 4.22
Enzyme inclusion cost saving c/bird -R 0.15 -R 0.06 -R 0.46 -R 0.24
MoFC (cents) 499.32 389.39 483.56 422.87 510.51 505.45 525.35 507.95
*Increased MoFC (cents) R 11.19 R 6.13 R 26.03 R 8.63
**Total savings (feed + live weight gain) -R 0.18 -R 0.06 -R 0.67 -R 0.39
© University of Pretoria

CHAPTER 5 DISCUSSION
Department of Animal and Wildlife Sciences
University of Pretoria
Page | 67
Table 5.2:24Financial calculation of margin over feed cost for exogenous enzyme(s) supplementation in broiler starter feed compared to
Positive control diets
Treatments PC NC1 NC2 NC3 Trt1 Trt2 Trt3 Trt4
Live weight gain (kg) 1.200 0.959 1.154 0.932 1.176 1.203 1.092 1.084
Income R/bird R 11.88 R 9.50 R 11.43 R 9.23 R 11.65 R 11.91 R 10.81 R 10.73
Live weight gain cost saving cents/bird -R 0.23 R 0.03 -R 1.07 -R 1.15
Feed intake (kg) 1.991 1.669 1.874 1.666 1.954 1.989 2.014 1.908
Cost cents/kg 342.33 319.84 339.96 335.46 320.29 343.59 339.54 340.71
Feed cost cents/bird R 6.82 R 5.34 R 6.37 R 5.59 R 6.26 R 6.83 R 6.84 R 6.50
Enzyme incl. cost saving cents/bird -R 0.56 R 0.02 R 0.02 -R 0.31
MoFC (cents) 506.43 415.80 505.48 364.20 538.80 507.28 396.75 423.18
*Increased MoFC (cents) R 32.37 R 0.85 -R 109.68 -R 83.25
**Total savings (feed and live weight gain) -R 0.79 R 0.04 -R 1.05 -R 1.46
Raw material prices was based on market prices. The cost of broiler production of R9.90/bird was used for the financial calculation.
MoFC – Margin over feed cost
* Increase MoFC - negative value is an indication of decrease in MoFC.
** Total savings (cent per bird) – negative value indicate saving as a results of improvement in weight gain and enzyme(s) supplementation.
© University of Pretoria

Department of Animal and Wildlife Sciences
University of Pretoria
Page | 68
CHAPTER 6
CONCLUSIONS
The interaction between the use of multi-enzymes, other feed additives such as AGPs, the animal, gut
microflora and the type of diet remains topics of interest. The focal point with enzymes still revolves
around understanding underlying factors such as how to allocate accurate nutrient matrix values to multi-
enzymes and justify broiler performance response. In this study it was evident that diets supplemented
with phytase, protease or combination of the two enzymes to nutrient deficient diets were effective in
improving performance and gut health of broiler chickens compared to nutrient deficient diets without
enzyme(s).
The effect of phytase alone showed a positive response on body weight, FCR, ADG and gut health as
observed when Ronozyme® HiPhos was added to negative control diets, indicating that supplementation
of Ronozyme® HiPhos improved nutrient utilisation.
It can be concluded that phytase Ronozyme® HiPhos offered an opportunity to reduce the inclusion of
inorganic phosphates. Ronozyme® HiPhos proved to be an efficient phytase that offers a feasible and
cost effective phytase to replace expensive and scarce raw ingredients such as mono di calcium phosphate
and improve the nutritive values of low quality ingredients without negatively affecting performance.
The replacement of mono di calcium phosphate by phytate P released by phytase without loss in
performance was a clear indication that Ronozyme® HiPhos is an efficient phytase to release phytate
phosphorus from the plant material. This subsequently shows that the total concentration of P excreted
to the environment could be reduced substantially by supplementing Ronozyme® HiPhos without
negatively affecting performance of broiler chickens.
In this trial, it was not clear whether performance improvement in Trt3 was attributed to supplementation
of Ronozyme® HiPhos or ProAct or combination of the two. It is eminent that the effect of the two
enzymes were not additive as their effect was not better than individual contribution of phytase alone or
protease alone. Addition of AGP (zinc bacitracin) Trt4 did not show any response to improvement in gut
morphology when compared to Trt 1, 2, 3. Since there were no significant differences when comparing
gut morphology with broilers in Trt4, it can be concluded that addition of enzymes phytase and protease
was able to maintain the gut health in a manner similar to what AGP could offer.
© University of Pretoria

CHAPTER 6 CONCLUSIONS
Department of Animal and Wildlife Sciences
University of Pretoria
Page | 69
Although not measured directly, it can be assumed that exogenous enzymes improve digestibility of feed,
minimising accumulation of undigested fractions and resulting in reduction in proliferation of facultative
microbes and proteolytic fermentation of undigested feed in the hindgut and subsequent improved gut
health. Exogenous enzymes can be considered as alternative nutritional additives to AGP.
In this study, there was no response in the ash concentration or any other bone mineralisation parameters
measured. Samples were collected from four birds and pooled for analysis. In part, it can be concluded
that the lack of response could be ascribed to variation in the mineral intakes, nutrient utilisation and
bone development of the different birds within and between treatments. Secondly, it can be concluded
that birds fed diets moderately deficient in Ca and P for the first 18 days may exhibit partial ability to
adapt to the deficiency. This study was focused on measuring the bone development parameters to prove
the efficacy of exogenous phytase on bone development. The underlying factors such as the ability of
the birds to partially adapt when subjected to moderate deficiency as in our negative control require
careful scrutiny and approach. It is therefore imperative to consider the degree of challenge when
designing negative control diets or lower nutrient specification diets when conducting exogenous enzyme
studies.
© University of Pretoria
CHAPTER 6 CONCLUSIONS
Department of Animal and Wildlife Sciences
University of Pretoria
Page | 70
GENERAL CONCLUSIONS
The use of exogenous enzymes in low nutrients density diets improved performance and gut health of
broilers. This offers an opportunity to lower dietary specification and subsequently lower feed cost,
improve nutrient digestibility and reduce environmental contamination from excess loss in nutrients such
as protein and phosphorus. Most of the multi-enzyme combination studies reported in literature were
conducted with a combination of phytase, carbohydrase and protease to target different types of
substrates. In this study, the focus was on phytase or protease or combination to better understand nutrient
contribution or additivity effect of the two enzymes. More work is still needed to understand additivity
of two or more enzymes. Most importantly, the extend at which the nutrient density can be lowered in
negative control treatments and subsequent contribution of enzymes added to the diets remains the key
component in better measuring the efficacy of enzymes to an inherently varying degree of feed ingredient.
© University of Pretoria

CHAPTER 6 CONCLUSIONS
Department of Animal and Wildlife Sciences
University of Pretoria
Page | 71
CRITICAL REVIEW
The following observations were made during the study that might have affected the outcome:
1. There was challenge in manufacturing reasonable pellet size and quality, especially in starter
diets. The use of large and harder pellets in the starter diets resulted in spillages and wastage
which could have slightly skewed some of the measurement of the feed consumption due to
unaccounted feed leftovers.
2. Enzyme analysis was not conducted to verify the mixing accuracy of the enzymes. It is always
an important parameter to execute when carrying out enzymes trial. The drawback with analysis
is the fact that routine analysis for most of the enzymes cannot be done on any standard
laboratory method, but through suppliers’ specific laboratories which mostly have a long
turnaround time as these are done at international laboratories.
3. We have attempted to measure nutrient digestibility with few drawbacks to the process. Firstly,
we have chosen acid insoluble ash as the marker of choice as it is reported in literature to be one
of the better indigestible markers. The major drawback was that we could not find an analytical
method locally to accurately extract and recover the marker from the feed and faecal samples.
The other complication was with the metabolic cages. The poor state of the metabolic cages
resulted in the mixing of feed and faeces. Therefore, we could not report any of the data. It is
important to consider the type of inert marker to be used which can be easily recovered, such as
the mineral based markers.
© University of Pretoria

Department of Animal and Wildlife Sciences
University of Pretoria
Page | 72
CHAPTER 7
REFERENCES
AOAC, 2000. Official methods of analysis, 17th ed., Association of Official Analytical Chemists,
AOAC International, Maryland, USA.
AOAC, 2005. Official methods of analysis, 18th ed., Association of Official Analytical Chemists,
Washington DC, USA.
Angel, R., Tamim, N.M., Applegate, T.J., Dhandu, A.S. & Ellestad, L.E., 2002. Phytic acid chemistry:
influence on phytin-phosphorus availability and phytase efficacy. J. Appl. Poult. Res. 11, 471-480
Angel, C. R., Saylor, W. W., Mitchell, A. D., Powers, W. & Applegate, T. J., 2006. Effect of dietary
phosphorus, phytase, and 25-hydroxycholecalciferol on broiler chicken bone mineralisation, litter
phosphorus, and processing yields. Poult. Sci. 85, 1200-1211
Angel, C. R., Saylor, W., Vieira, S. L. & Ward, N., 2011. Effects of a mono-component protease on
performance and protein utilisation in 7 to 22 day-old broiler chickens. Poult. Sci. 90, 2281-2286
Angkanaporn, K., Choct, M., Bryden, W. L., Annison, E. F. & Annison, G., 1994. Effects of wheat
pentosans on endogenous amino acid losses in chickens. J. Sci. Food Agric. 66, 399-404
Annison, G. & Choct, M., 1991. Anti-nutritive activities of cereal non-starch polysaccharides in broiler
diets and strategies minimising their effects. World Poult. Sci. J. 47, 232-242
Applegate, T. J., Joern, B. C., Nussbaum-Wagler, D .L. & Angel, R., 2003. Water-soluble phosphorus
in fresh broiler litter is dependent upon phosphorus concentration fed but not on fungal phytase
supplementation. Poult. Sci. 82, 1024-1029
Applegate, T.J., Powers, W.J., Angel, R. & Hoehler, D., 2008. Effect of amino acid formulation and acid
supplementation on performance and nitrogen excretion in turkey toms. Poult. Sci. 87, 514-520
Applegate, T. J. & Angel., R., 2008. Phosphorus requirements for poultry. Purdue Extension, Anim. Sci.
AS-583-W
© University of Pretoria
CHAPTER 7 REFERENCES
Department of Animal and Wildlife Sciences
University of Pretoria
Page | 73
Attia, Y. A., Bovera, F., Abd El-Hamid, A. E., Tag El-Din, A. E., Al-Harthi M. A. & El-Shafy, A. S.,
2016. Effect of zinc bacitracin and phytase on growth performance, nutrient digestibility, carcass and
meat traits of broilers. J. Anim. Physiol. and Anim. Nutri. 100, 485-491.
Baas, T.C. & Thacker, P.A., 1996. Impact of gastric pH on dietary enzyme activity and survivability in
swine fed β-glucanase supplemented diets. Can. J. Anim. Sci. 36, 245-252
Bach Knudsen, K. E., 1997. Carbohydrate and lignin contents of plant materials used in animal feeding.
Anim. Feed Sci. Technol. 67, 319-338.
Bao, Y.M., Romero, L.F. & Cowieson, A.J., 2013. Functional patterns of exogenous enzymes in different
feed ingredients. World’s Poult. Sci. J. 69, 759-774
Bancroft, J.D., 2003. Theory and practice of histological techniques. (5th ed). pp 130.
Bedford, M.R. & Classen, H.L., 1992. Reduction of intestinal viscosity through manipulation of dietary
rye and pentosanase concentration is effected through changes in the carbohydrate composition of the
intestinal aqueous phase and results in improved growth rate and food conversion efficiency of broiler
chicks. J. Nutr. 122, 560-569
Bedford, M. R., 2000. Exogenous enzymes in monogastric nutrition. Their current value and future
benefits. Livest. Prod. Sci. 86, 1-13
Bedford, M.R., 2002. The foundation of conducting feed enzyme research and the challenge of
explaining the results. J. Appl. Poult. Res. 11, 464-470.
Bertichini, A.G., Carvalho, J.C.C., Mesquita, F.R., Castro, S.F., Meneghetti, C. & Sorbara, J.O.B., 2009.
Use of a protease to enhance the utilisation of soybean meal amino acids by broilers. Poult. Sci. Abstr.
221, Raleigh NC
Blahos, J., Care, A. D., & Sommerville, B. S., 1987. Effect of low calcium and low phosphorus diets on
duodenal and ileal absorption of phosphate in chick. Endocrinol. Exp. 21, 59-64.
Bohak, Z., 1969. Purification and characterisation of chicken pepsinogen and chicken pepsin. J. Biol
Chem. 244, 4638-4648.
© University of Pretoria

CHAPTER 7 REFERENCES
Department of Animal and Wildlife Sciences
University of Pretoria
Page | 74
Bohak, Z., 1973. The kinetics of the conversion of chicken pepsinogen to chicken pepsin. European J.
Biochem. 32, 547-554.
Botsoglou, N.A., Christaki, E., Florou-Paneri, P., Gieannenas, I., Papageorgiou, G. & Spais, A.B., 2004.
The effect of a mixture of herbal essential oils or α–tocopheryl acetate on performance parameters and
oxidation of body lipid in broilers. S.A. J. Anim. Sci. 34, 52-61.
Bryden, W. L., 1996. Antinutritive factors in protein metabolism. In Protein Metabolism and Nutrition,
(editors Nunes, A.F., Portugal, A.V., Costa, J.P. & Ribeiro, J.R.) Estacao Zootecnica Nacional. Vale de
Santarem, Portugal, pp. 517-518.
Cai, Q., Schandler, J.S., Wasserman, R.H., Kumar, R. & Penniston, J.T., 1993. Vitamin D3 and
adaptation to dietary calcium and phosphate deficiencies increase intestinal plasma membrane calcium
pump gene expression. Proc. of the Nat. Academy of Sci. USA. 90, 1345-1349.
Caldwell, R. A., 1992. Effect of calcium and phytic acid on the activation of trypsinogen and the stability
of trypsin. J. Sci. Food Agric. 40, 43-46.
Camden, B. J., Morel, P.C.H., Thomas, D.V., Ravindran, V. & Bedford, M.R., 2001. Effectiveness of
exogenous microbial phytase in improving the bio-availabilities of phosphorus and other nutrients in
maize-soya-bean meal diets for broilers. Anim. Sci. 73, 289-297.
Choct, M., Hughes, R. J., Wang, J., Bedford, M. R., Morgan A. J. & Annison, G., 1996. Increased small
intestinal fermentation is partly responsible for the anti-nutritive activity of non-starch polysaccharides
in chickens. Br. Poult. Sci. 37, 609-621.
Choct, M., 2006. Enzymes for the feed industry: past, present and future. World’s Poult. Sci. J. 62, 5-15.
Costa, F.G.P., Goulart, C.C., Figueiredo, D.F., Oliveira, C.F.S. & Silva, J.H.V., 2008. Economic and
Environmental Impact of Using Exogenous Enzymes on Poultry Feeding. Int. J. Poult. Sci. 7, 311-314.
Cowieson, A.R., 2010. Strategic selection of exogenous enzymes for corn/soy-based poultry diets. J.
Poult. Sci. 17, 1-7.
Cowieson, A. J., Acamovic, T. & Bedford, M. R., 2003. The effect of phytase and phytic acid on
endogenous losses from broiler chickens. Br. Poult. Sci. 44, S23-S24.
© University of Pretoria
CHAPTER 7 REFERENCES
Department of Animal and Wildlife Sciences
University of Pretoria
Page | 75
Cowieson, A.J., Acamovic, T. & Bedford, M.R., 2004a.The effects of phytase and phytic acid on the
loss of endogenous amino acids and minerals from broiler chickens. Br. Poult. Sci. 45, 101-108.
Cowieson, A.J., Acamovic, T. & Bedford, M.R., 2004b. The effects of supplementing maize-based diets
with exogenous phytase on amino acid digestibility and nitrogen retention by young broiler chicks. Br.
Poult. Sci. 45, (S6).
Cowieson, A. J., Acamovic, T. & Bedford, M. R., 2006a. Phytic acid and phytase: Implication for protein
utilisation by poultry. Poult. Sci. 85, 878-885.
Cowieson, A.J., Acamovic, T. & Bedford, M.R., 2006b. Supplementation of corn–soy-based diets with
an Eschericia coli-derived phytase: Effects on broiler chick performance and the digestibility of amino
acids and metabolisability of minerals and energy. Poult. Sci. 85, 1389-1397
Cowieson, A. J. & Adeola, O., 2005. Carbohydrases, protease, and phytase have an additive beneficial
effect in nutritionally marginal diets for broiler chicks. Poult. Sci. 84, 1860-1867.
Cowieson, A.J. & Bedford, M.R., 2009. The effect of phytase and carbohydrase on ileal amino acid
digestibility in monogastric diets: complimentary mode of action? World Poult. Sci. J. 65, 609-623.
Cowieson, A.J., Bedford, M.R., Selle, P.H. & Ravindran, V., 2009. Phytate and microbial phytase:
implications for endogenous nitrogen losses and nutrient availability. Worlds. Poult. Sci. J. 65, 401-418.
Cowieson, A.J., Bedford, M.R. & Ravindran, V., 2010. Interaction between xylanase and glucanase in
maize-soy-based diets for broilers. Br. Poult. Sci. 51, 246-257
Cowieson, A.J. & Ravindran, V., 2007. Effect of phytic acid and microbial phytase on the flow and
amino acid composition of endogenous protein at the terminal ileum of growing broiler chickens. Br. J.
Nutr. 98, 745-752.
Cowieson, A. J. & Ravindran, V., 2008. Effect of exogenous enzymes in maize-based diets varying in
nutrient density for young broilers: Growth performance and digestibility of energy, minerals and amino
acids. Br. Poult. Sci. 49, 37-44.
Cowieson, A. J., Ravindran, V. & Selle, P. H., 2008. Influence of dietary phytic acid and source of
microbial phytase on ileal endogenous amino acid flows in broiler chickens. Poult. Sci. 87, 2287-2299
© University of Pretoria

CHAPTER 7 REFERENCES
Department of Animal and Wildlife Sciences
University of Pretoria
Page | 76
Cowieson, A. J., Wilcock, P. & Bedford, M. R., 2011. Super-dosing effects of phytase in poultry and
other monogastrics. Worlds Poult. Sci. J. 67, 225-236.
Cowieson, A. J. & Roos, F. F., 2014. Bio-efficacy of a mono-component protease in the diets of pigs and
poultry: a meta-analysis of effect on ileal amino acid digestibility. J. Appl. Anim. Nutr. 2, (e13), 1-8
Cromwell, G. L., Calvert, C. C., Cline, T. R., Crenshaw, J. D., Easter, R. A., Ewan, R. C., Hamilton, C.
R., Hill, G. M., Lewis, A. J., Mahan, D. C., Miller, E. R., Nelsson, J. L. Pettigrew, J. E., Tribble, L. F.,
Veum, T. L. & Yen, J. T., 1999. Variability among sources and laboratories in nutrient analyses of corn
and soybean meal. J. Anim. Sci. 77, 3262-3273.
D' Alfonso, T.H. & McCracken, K., 2002. Global corn quality variability. Proceedings of the Multi-state
poultry meeting. Indianapolis, Indiana May, 14-16.
D' Alfonso, T.H., 2005 Sources of variances of energy digestibility in corn-soy poultry diets and effect
on performance: starch, protein, oil and fibre. Krmiva. 2, 83-86.
Danicke, S., W. Vahjen, W., Simon, O. & Jorech, H., 1999. Effect of dietary fat type and xylanase
supplementation to rye-based broiler on selected bacterial groups adhering to the intestinal epithelium
on transit time of feed and on nutrient digestibility. Poult. Sci. 78, 1292-1299.
Deshpande, S. S. & Cheryan, M., 1984. Effects of Phytic Acid, Divalent Cations, and Their Interactions
on α-Amylase Activity. J. Food Sci. 49, 516-519
Dierick, N.A. & Decuypere, J.A., 1994. Enzymes and growth in pigs. In: Cole, D.J.A., Wiseman, J. &
Varley, M. Principles of Pig Science. Nottingham University Press, Nottingham. pp 169 -195.
Doyle, J.J., 1979. Toxic and essential elements in bone - a review. J. Anim. Sci. 49, 482-497.
Dosković, V., Bogosavljević-Bošković, S., Pavlovski, Z., Milošević, B., Škrbić, Z., Radonjac, S. &
Petričević, V., 2013. Enzymes in broiler diets with special reference to protease. W. Poult. Assoc. 69,
343-360.
Douglas, M. W., Peter, C. M., Boling, S. D., Parsons, C. M. & Baker, D. H., 2000. Nutritional evaluation
of low phytate and high protein corns. Poult. Sci. 79, 1586-1591.
© University of Pretoria

CHAPTER 7 REFERENCES
Department of Animal and Wildlife Sciences
University of Pretoria
Page | 77
Duarte, C.R.A., Eyng, C., Murakami, A.E. & Santos, T.C., 2014. Intestinal morphology and activity of
digestive enzymes in broilers fed crude propolis. Can. J. Anim. Sci. 94, 105-114.
Engberg, R.M., Hedemann, M.S., Leser, T.D. & Jensen, B.B., 2000. Effect of zinc bacitracin and
salinomycin on intestinal microflora and performance of broilers. Poult. Sci. 79, 1311-1319.
Esteve-Garcia, E., Brufau, J., Perez-Vendrell, A., Miquel, A. & Duven, K., 1997. Bioefficacy of enzyme
preparations containing β-glucanase and xylanase activities in broiler diets based on barley or wheat, in
combination with flavomycin. Poult. Sci. 76, 1728-1737.
Friedman, M., 1996. Food Browning and Its Prevention: An Overview. J. Agricul. & Food Chem. 44,
631-653.
Freitas, D.M., Vieira, S.L., Angel, C.R., Favero, A. & Maiorka, A., 2011. Performance and nutrient
utilisation of broilers fed diets supplemented with a novel mono-component protease. J. Appl. Poult. Res.
20, 322-334
Fru-Nji, F., Kluenter, A.M., Fischer, M. & Pontoppidan, K., 2011. A feed serine Protease improves
broiler performance and increase protein and energy digestibility. J. Poult. Sci. 48, 239-246.
Ghazi, S., Rooke, J. A. & Galbraith, H., 2003. Improvement of the nutritive value of soybean meal by
protease and α-galactosidase treatment in broiler cockerels and broiler chicks. Br. Poult. Sci. 44, 410-
418.
Gitzelmann, R. & Auricchio, S., 1965. The handling of soy β-galactosidase by a normal and galactosemic
child. Paediatrics 36, 231-232.
Gomide, M. H. J., Sterzo, E. V., Macari, M., & Boleli, I. C., 2004. Use of scanning electron microscopy
for the evaluation of intestinal epithelium integrity. Revista Brasileira de Zootecnia. 33, 1500-1505.
Hock, E., Halle, I., Matthes, S. & Jeroch, H., 1997. Investigations on the composition of the ileal and
caecal microflora of broiler chicks in consideration to dietary enzyme preparation and zinc bacitracin in
wheat-based diets. Agribiological Research-Zeitschrift fur Agrarbiologie Agrikulturchemie Okologie.
50, 85–95
© University of Pretoria

CHAPTER 7 REFERENCES
Department of Animal and Wildlife Sciences
University of Pretoria
Page | 78
Hughes, R. J. & Choct, M., 1999. Chemical and physical characteristics of grains related to variability
in energy and amino acid availability in poultry. Aust. J. Agric. Res. 50, 689-701.
Humphrey, B.D., Huang, N. & Klasing, K.C., 2002. Rice expressing lactoferrin and lysozyme has
antibiotic-like properties when fed to chick. J. Nutr. 132, 1214-1218.
Huyghebaert, G. & De Groote, G. 1995. The effect of specific enzymes on the MEn value and nutrient
utilisation of target feedstuffs in broiler and layer diets. ln: Proc. 10th Eur. Symp. on Poult. Nutr., 15-19
Oct. 1995, Antalya, Turkey. pp. 176-19
Juanpere, J., Perez-Vendrell, A.M., Agulo, E. & Brufau, J., 2005. Assessment of potential interaction
between phytase and glycosidase enzyme supplementation on nutrient digestibility in broilers. Poult. Sci.
84, 571-580.
Jaroni, D., Scheideler, S.E., Beck, M.M. & Wyatt. C., 1999. The effect of dietary wheat middlings and
enzyme supplementation II: Apparent nutrient digestibility, digestive tract size, gut viscosity and gut
morphology in two strains of Leghorn hens. Poult. Sci. 78, 1664-1674.
Khan, A., Khan, R., Khan, M.F. & Khanam, F., 1997. A cluster model explaining quantitatively the
anomalous variation of density of water with temperature. Chemical Physics Letters 266, 473-480
Khattak, F.M., Pasha, T. N., Hayat, Z. & Mahmud, A., 2006. Enzymes in poultry Nutrition. J. Anim.
Poult. Sci. 16, 1-2.
Kies, A. K., Van Hemert K. H. F. & Sauer, W. C., 2001. Effect of phytase on protein and amino acid
digestibility and energy utilisation. World’s Poult. Sci. J. 57, 110-124.
Kling, L. J., 1985. The effect of calcium and phosphorus on the incidence of tibial dyschondroplasia in
young chicks. Nutrition Reports International 32, 1473-1480.
Langhout, D. J. & Schutte, J.B., 1995. Effects of avilamycin and a xylanase enzyme preparation alone
or in combination on broiler performance and ileal viscosity. Proc. 10th Eur. Symp. on Poult. Nutr., 15-
19 Oct. 1995, Antalya, Turkey. pp. 379-380.
© University of Pretoria
CHAPTER 7 REFERENCES
Department of Animal and Wildlife Sciences
University of Pretoria
Page | 79
Le Heurou-Luron, I., Lhoste, E., Wicker-Planquarl, C., Dakka, N., Toullec, R., Corring, T., Guilloteau,
P. & Puigserver, A., 1993. Molecular aspects of enzyme synthesis in the exocrine pancreas with emphasis
on development and nutritional regulation. Proceeding in Nutrition Society 52, 301-313.
Lemme A., Ravindran V. & Bryden, W.L., 2004. Ileal digestibility of amino acids in feed ingredients for
broilers. Worlds’ Poult. Sci. J. 60, 423-438.
Létourneau-Montminy, M. P., Narcy, A., Lescoat, P., Bernier, J. F., Magnin, M., Pomar, C., Nys, Y.,
Sauvant, D. & Jondreville, C., 2010. Meta-analysis of phosphorus utilisation by chicks: Influence of
dietary calcium and microbial phytase content. Anim. 4, 1844-1853.
Leytem, A.B., Willing, B.P. & Thacker, P.A., 2008. Phytate utilisation and phosphorus excretion by
broiler chickens fed diets containing cereal grains varying in phytate and phytase content. Anim. Feed
Sci. Technol. 146, 160-168.
Li, D. F., Nelssen, J. L., Reddy, P. G., Blecha, F., Klemm, R. & Goodband, R. D. 1991. Interrelationship
between hypersensitivity to soybean proteins and growth performance in early-weaned pigs. J. Anim.
Sci. 69, 4062.
Lichtenberg, J., Pedersen, P. B., Elvig-Joergensen, S. G., Skov, L. K., Olsen, C. L. & Glitsoe, L. V.,
2011. Toxicological studies on a novel phytase expressed from synthetic genes in Aspergillus oryzae.
Regul. Toxicol. Pharmacol. 60, 401-410.
Maenz, D. D. & Claasen, H. L., 1998. Phytase activity in the small intestinal brush border membrane of
the chicken. Poult. Sci. 77, 557-563.
Maguire, R. O., Dou, Z., Sims, J. T., Brake, J. & Joern, B. C., 2005. Dietary strategies for reduced
phosphorus excretion and improved water quality. J. Environ. Qual. 34, 2093-2103.
Masey O’Neill, H.V., Liu, N., Wang, J. P., Diallo, A. & Hill, S., 2012. Effect of Xylanase on performance
and apparent metabolisable energy in starter broilers fed diets containing one maize variety harvested in
different regions of China. Asian Austral. J. Anim. Sci. 25, 515 - 523.
Masey O’Neill, H. V., Smith, J.A. & Bedford, M.R., 2014. Multi-carbohydrase enzymes for non-
ruminants. Asian Austral. J. Anim. Sci. 27, 290-301.
© University of Pretoria

CHAPTER 7 REFERENCES
Department of Animal and Wildlife Sciences
University of Pretoria
Page | 80
Moran, E.T., 1985. Digestion and absorption of carbohydrates in fowl and events through perinatal
development. J. Nutr. 115, 665-674.
Morrisey, R. L. & Wasserman, R. H., 1971. Calcium absorption and calcium-binding protein in chicks
on differing calcium and phosphorus intakes. Am. J. Physiol. 220, 1509-1515.
Munir, K. & Maqsood, S., 2013. A review on role of exogenous enzyme supplementation in poultry
production. J. Food Agric. 25, 66-80.
Nelson, T.S., 1967. The utilisation of phytate phosphorus by poultry. Poult. Sci. 46, 862-871.
Nir, I., Nitsan, Z., & Mahagna, M., 1993. Comparative growth and development of the digestive organs
and of some enzymes in broiler and egg type chicks after hatching. Br. Poult. Sci. 34, 523-532.
Nitsan, Z., Dunnington, E. & Siegel, P., 1991. Organ growth and digestive enzyme levels to 15 days of
age in lines of chickens differing in body weight. Poult. Sci. 70, 204 & 2048.
Ohh, S. J., 2011. Meta-analysis to draw the appropriate regimen of enzyme and probiotic
supplementation to pigs and chicken diets. Asian Austral. J. Anim. Sci. 24, 573-586.
Oliveira, A. C., Vidal, B. C. & Sgarbieri, V. C., 1989. Lesions of intestinal epithelium by ingestion of
bean lectins in rats. J. Nutr. Sci. Vitaminol. 35, 315-322
Olukosi, O. A., Bedford, M. R. & Adeola, O., 2007. Xylanase in diets for growing pigs and broiler chicks.
Can. J. Anim. Sci. 87, 227-235.
Pack, M. & Bedford, M., 1997. Feed enzymes for corn and soybean broiler diets. World Poult. 13, 87-
93.
Partridge, G.G. 1993. In feed enzymes and antibodies. Pig Vet. J. 31, 34-50.
Parsons, C. M., Castanon, F. & Han, Y., 1997. Protein and amino acid quality of meat and bone meal.
Poult. Sci. 76, 361-368.
Payne, R.W. (Ed.) 2014. Introduction to GenStat® for Windows™ (17th Edition), VSN International,
Hemel Hempstead, Hertfordshire, United Kingdom ©, VSN International. Website:
http://www.genstat.co.uk/
© University of Pretoria

CHAPTER 7 REFERENCES
Department of Animal and Wildlife Sciences
University of Pretoria
Page | 81
Penn, C. J., Mullins, G. L., Zelazny, L. W., Warren, J. G. & McGrath, J. M., 2004. Surface run-off losses
of phosphorus from Virginia soils amended with turkey manure using phytase and high available
phosphorus corn diets. J. Environ. Quality 33, 1431-1439
Piper, D.W. and Fenton, B.H. 1965. pH stability and activity curves of pepsin with special reference to
their clinical importance. Gut 6, 506
Powell, S., Bidner, T. D. & Southern, L. L., 2011. Phytase supplementation improved growth
performance and bone characteristics in broilers fed varying levels of dietary calcium. Poult. Sci. 90,
604-608.
Pustzai, A., Ewen, S.W.B., Grant, G., Peumans, W. J., van Damme, E.J.M., Rubio, L. & Bardocz, S.,
1990. Relationship between survival and binding of plant lectins during small intestinal passage and their
effectiveness as growth factors. Digest. 46, 308-316
Rackis, J. J. & Gumbman, M. R., 1981. Protease inhibitors: physio-logical properties and nutritional
significance. In: ORY, R. L. (Ed.), Anti-nutrients and Natural Toxicants in Foods. Westport, CT. Food
and Nutrition Press, pp. 203-237
Ravindran, V., Cabahug S., Ravindran G. & Bryden, W.L., 1999. Influence of microbial phytase on
apparent amino acid digestibility of feedstuffs for broilers. Poult. Sci. 78, 699-706. 681
Ravindran, V., Cabahug, S., Ravindran, G., Selle, P.H. & Bryden, W.L., 2000. Response of broiler
chickens to microbial phytase supplementation as influenced by dietary phytic acid and non-phytate
phosphorus levels. II. Effects on apparent metabolisable energy, nutrient digestibility and nutrient
retention. Br. Poult. Sci. 41, 193-200.
Ravindran, V., Morel, P., Partridge, G., Hruby, M. & Sands, J., 2006. Influence of an Escherichia coli
derived phytase on nutrient utilisation in broiler starters fed diets containing varying concentrations of
phytic acid. Poult. Sci. 85, 82-89.
Ravindran, V., 2013. Feed enzymes: The science, practice, and metabolic realities. J. Appl. Poult. Res.
22, 628-636
© University of Pretoria

CHAPTER 7 REFERENCES
Department of Animal and Wildlife Sciences
University of Pretoria
Page | 82
Rutherfurd, S. M., Chung, T.K, Morel, P.C. & Moughan, P. J., 2004. Effects of microbial phytase on the
ileal digestibility of phytate phosphorus, total phosphorus, and amino acids in a low phosphorus diet for
broilers. Poult. Sci. 83, 61-68
Sarica, S., Ciftci, A., Demir, E., Kilinc, K. & Yildirim, Y., 2005. Use of an antibiotic growth promoter
and two herbal natural feed additives with and without exogenous enzymes in wheat based broiler diets.
S. Afr. J. Anim. Sci. 35, 61-72.
Seldin, E. D., 1965. A rheologic model for cortical bone. Acta Orthopaedica Scandinavica 36, 1-77.
Simbaya, J., Slominski, B. A., Guenter, W., Morgan, A. & Campell, L. D., 1996. The effects of protease
and carbohydrase supplementation on the nutritive value of canola meal for poultry: In vitro and in vivo
studies. Anim. Feed Sci. Technol. 61, 219-234.
Singh, P. K., & Krikorian, A. D., 1982. Inhibition of trypsin activity in vitro by phytate. J. Agricul Food
Chem. 30:799-800.
Slominski, B. A., 2011. Review: Recent advances in research on enzymes for poultry diets. 2011 Poult.
Sci. 90, 2013-2023
Skurray, G.R., 1974. The nutritional evaluation of meat meals for poultry. World Poult. Sci. J. 30, 129-
136.
Somerville, C., Bauer S., Brininstool G., Facette, M. Hamann, T., Milne, J., Osborne, E., Paredez, A.,
Persson, S., Raab, T., Vorwerk, S. & Youngs, H., 2004. Toward a systems approach to understanding
plant cell walls. Sci. 306, 2206-2211.
Smits, H.M., & Annison, G., 1996. Non-starch plant polysaccharide in broiler nutrition towards a
physiologically valid approach to their determination. Worlds’ Poult. Sci. J. 52, 203-221.
Sorbara, J.O.B., 2009. Use of a protease to enhance the utilisation of soybean meal amino acids by
broilers. Poultr. Sci. Assoc. 98th Annual Meeting, Raleigh, North Carolina. Poult. Sci. 88, Abstr. 221,
68.
© University of Pretoria

CHAPTER 7 REFERENCES
Department of Animal and Wildlife Sciences
University of Pretoria
Page | 83
Sayrafi, R., Soltanalinejad, F., Shahrooz, R. & Rahimi, S., 2011. Comparative study of the effect of
alternative and antibiotic feed additives on the performance and intestinal histo-morphometrical
parameters of broiler chickens. Afr. J. Agric. Res. 6, 2794-2799.
Thacker, P.A. & Baas, T.C., 1996. Effects of gastric pH on the activity of exogenous pentosanase and
the effect of pentosanase supplementation of the diet on the performance of growing–finishing pigs.
Anim. Feed Sci. Technol. 63, 187- 200.
Tamim, N. M., Angel, R. & Christman, M., 2004. Influence of dietary calcium and phytase on phytate
phosphorus hydrolysis in broiler chickens. Poult. Sci. 83, 1358-1367
Theander, O., Westerlund, E., Aman, P. & Graham, H., 1989. Plant cell walls and monogastric diets.
Anim. Feed Sci. Technol. 23, 205-225.
Thorpe, J. and Beal, J.D. 2001. Vegetable protein meals and the effects of enzymes, In: Bedford, M. R.
and Patridge, G.G. (Eds) Enzymes in Farm Animal Nutrition, pp. 125 -143
Vieira, S.L., Stefanello, C. & Sorbara, J.O.B., 2014. Possible substrates for exogenous enzymes
formulating poultry diets based on their indigestible components. Poult. Sci. 93, 1-6.
Vukic-Vranjes, M. & Wenk, C., 1993. Influence of dietary enzyme complex on broiler performance in
diets with and without antibiotic supplementation. Enzymes in Animal Nutrition. Proc. 1st Symp. 13-
16th October, Kartause, Ittingen, Switzerland. pp. 152-155
Walk, C. L., Cowieson, A. J., Remus, J. C., Novak, C. L. & McElroy, A. P., 2011. Effects of dietary
enzymes on performance and intestinal goblet cell number of broilers exposed to a live coccidian oocyst
vaccine. Poult. Sci. 90, 91-98.
Wang, X. & Parsons, C.M., 1998. Effect of raw material source, processing systems, and processing
temperatures on amino acid digestibility of meat and bone meals. Poult. Sci. 77, 834 -841.
Warenham, C. N., Wiseman, J. & Cole, D. J. A., 1994. Processing and anti-nutritive factors in feedstuff.
In: Cole, D.J.A, Wiseman, J, Varley M. A. Eds. Principles of Pig Science. Nottingham University Press,
Nottingham, UK. pp. 141 - 167
© University of Pretoria

CHAPTER 7 REFERENCES
Department of Animal and Wildlife Sciences
University of Pretoria
Page | 84
Wiggins, H. S. 1984. Nutritional value of sugars and related compounds undigested in the small gut.
Proc. Nutr. Soc. 43, 69-85.
Whitehead, C.C., McCormack, H.A., McTier, L. & Fleming, R.H., 2004. High Vitamin D3 requirements
in broilers for bone quality and prevention of tibial dyschondroplasia and interactions with dietary
calcium, available phosphorus and Vitamin A. Br. Poult. Sci. 45, 425-436.
Woyengo, T. A., Adeola, O., Udenigwe, C. C. & Nyachoti, C. M., 2010. Gastro-intestinal digesta pH,
pepsin activity and soluble mineral concentration responses to dietary phytic acid and phytase in piglets.
Livest. Sci. 134, 91-93
Woyengo, T. A., & Nyachoti, C. M., 2011. Review: Supplementation of phytase and carbohydrases to
diets for poultry. Can. J. Anim. Sci. 91, 177-192
Wu, Y.B., Ravindran, V., Thomas, D.G., Birtles, M.J. & Hendriks, W.H., 2004. Influence of phytase and
xylanase, individually or in combination, on performance, apparent metabolisable energy, digestive tract
measurements and gut morphology in broilers fed wheat-based diets containing adequate level of
phosphorus. Br. Poult. Sci. 45, 76-84
Wyatt, C. L., Parr, T, and Bedford, M.R. 2008. Mechanisms of action for supplemental NSP and phytase
enzymes in poultry diets. Proc. 35th Annual Carolina Poult. Nutr. Conference. pp 12-22.
Xu, H., Bai, L., Collins, J. F. & Chishan, F.K., 2002. Age-dependent regulation of rat intestinal type IIb
sodium-phosphate co-transporter by 1,25-(OH)2 vitamin D3. Am. J. Physiol. Cell. Physiol. 282 , 487-
493.
Xu, Z.R., Hu, C.H., Xia, M.S., Zhan, X.A. & Wang, M.Q., 2003. Effects of dietary fructo-
oligosaccharides on digestive enzyme activities, intestinal microflora and morphology of male broilers.
Poult. Sci. 82, 1030-1036.
Yan, F., Angel, R., Ashwell, C., Mitchell, A. & Christman, M., 2005. Evaluation of the broiler’s ability
to adapt to an early moderate deficiency of phosphorus and calcium. Poult. Sci. 84, 1232-1241.
Zakaria, H.A.H., Jalal, M.A.R. & Abu Ishmais, M.A., 2010. The Influence of Supplemental Multi-
enzyme Feed Additive on the Performance, Carcass Characteristics and Meat Quality Traits of Broiler
Chickens. Int. J. Poult. Sci. 9, 126 -133
© University of Pretoria

CHAPTER 7 REFERENCES
Department of Animal and Wildlife Sciences
University of Pretoria
Page | 85
Zanella, I., Sakamuro, N. K., Silversides, F. G., Fiqueirdo, A. & Pack, M., 1999. Effect of enzyme
supplementation of broiler diets based on corn and soybeans. Poult. Sci. 78, 561-568.
Zhang, B. & Coon, C.N., 1997. The relationship of various tibia bone measurements in hens. Poult. Sci.
76, 1698-1701.
© University of Pretoria