Effects on product quality for probiotic yoghurts caused ... · Effects on product quality for...
47
Department of Physics, Chemistry and Biology Master´s Thesis Effects on product quality for probiotic yoghurts caused by long storage times during production Catrine Larsson Master´s Thesis executed at Arla Foods 2009-01-13 LITH-IFM-A-EX--09/2042—SE Department of Physics, Chemistry and Biology, Linköping University, 581 83 Linköping, Sweden
Transcript of Effects on product quality for probiotic yoghurts caused ... · Effects on product quality for...

Department of Physics, Chemistry and Biology
Master´s Thesis
Effects on product quality for probiotic yoghurts caused by long storage times during production
Catrine Larsson
Master´s Thesis executed at Arla Foods 2009-01-13
LITH-IFM-A-EX--09/2042—SE
Department of Physics, Chemistry and Biology, Linköping University, 581 83 Linköping, Sweden

Department of Physics, Chemistry and Biology
Effects on product quality for probiotic yoghurts caused by long storage times during production
Catrine Larsson
Master´s Thesis executed at Arla Foods
2009-01-13
Supervisor
Petra Lindström
Examiner Carl-Fredrik Mandenius

Datum 2009-03-02
Avdelning, institution Division, Department
Chemistry Department of Physics, Chemistry and Biology Linköping University
URL för elektronisk version
ISBN ISRN: LITH-IFM-A-EX--09/2042--SE _________________________________________________________________ Serietitel och serienummer ISSN Title of series, numbering ______________________________
Språk Language
Svenska/Swedish Engelska/English
________________
Rapporttyp Report category
Licentiatavhandling Examensarbete C-uppsats D-uppsats Övrig rapport
_____________
Titel Effects on product quality for probiotic yoghurts caused by long storage times during production Författare Catrine Larsson
Nyckelord Product quality, yoghurt, probiotics, cultured products, storage time
Sammanfattning Recent years there has been a large increase in the worldwide sales of cultured products containing probiotics. The obstacle in the production of fermented products incubated with probiotic strains is its effect on sensory, chemical and physical properties. This Master´s Thesis investigates how extended storage times in fermentation tank as well as buffer tank during production of probiotic yoghurts effect final product quality. Through experimental studies, maximum storage times for probiotic yoghurts were to be recommended. The study includes analyses of pH, viscosity, stability, acetic acid concentration, microbial viability and sensory evaluations. Design of experiments (DOE) was used to construct a 32-factorial design for the experiment where different storage times were tested. The analyses showed that: -pH decreases with both storage time in fermentation tank and buffer tank. -Viscosity increases with long storage times in fermentation tank, while it decreases with long storage times in buffer tanks. -Many samples had a sandy/grainy and slimy texture which could be related to high levels of Bifidobacteria or high fermentation temperatures. -High levels of acetic acid was found in all samples. -All measurements data where within the specification limits, whereas no recommendation for maximum storage times during production could be given.

Preface
Preface
This thesis is the final element of a Master of Science in Engineering Biology at Linköping University.
The work was executed at Arla Foods Nordic Innovation in Stockholm during September – February
2008/2009. I would like to thank my supervisor Petra Lindström, NPD Scientist at Arla Foods for
giving me the opportunity to be involved in this project and continuous guidance of the work. Special
thanks to Kim Vang Nielsen at Linköping dairy plant for helping me with the pilot plant production.
Finally, I would like to thank the all employees at the department for excellent support, making me
feel as a part of the team both during work hours and spare time.
Catrine Larsson
Stockholm, February 2009

Abstract
Abstract
Recent years there has been a large increase in the worldwide sales of cultured products containing
probiotics. The obstacle in the production of fermented products incubated with probiotic strains is
its effect on sensory, chemical and physical properties. This Master´s Thesis investigates how
extended storage times in fermentation tank as well as buffer tank during production of probiotic
yoghurts affect final product quality. Through experimental studies, maximum storage times for
probiotic yoghurts were to be recommended. The study includes analyses of pH, viscosity, stability,
acetic acid concentration, microbial viability and sensory evaluations.
Design of experiments (DOE) was used to construct a 32-factorial design for the experiment where
different storage times were tested. The analyses showed that:
• pH decreases with both storage time in fermentation tank and buffer tank.
• Viscosity increases with long storage times in fermentation tank, while it decreases with
long storage times in buffer tanks.
• Many samples had a sandy/grainy and slimy texture which could be related to high levels
of Bifidobacteria or high fermentation temperatures.
• High levels of acetic acid was found in all samples.
• All measurements data where within the specification limits, whereas no
recommendation for maximum storage times during production could be given.

Table of contents
Table of contents
1. INTRODUCTION ....................................................................................................................................... 1
1.1 BACKGROUND............................................................................................................................................. 1
1.2 ARLA FOODS .............................................................................................................................................. 1
1.3 PROBLEM SPECIFICATION ........................................................................................................................... 2
1.4 OBJECTIVE ................................................................................................................................................. 2
1.5 LIMITATIONS .............................................................................................................................................. 2
1.6 THESIS OUTLINE ......................................................................................................................................... 2
2. THEORETICAL BACKGROUND ............................................................................................................ 3
2.1 PRODUCT DESCRIPTION .............................................................................................................................. 3
2.2 LACTIC ACID BACTERIA-LAB ..................................................................................................................... 3
2.2.1 SUGAR METABOLISM ................................................................................................................................. 4
2.2.2 EFFECT OF LAB-METABOLISM ON FERMENTED PRODUCTS .......................................................................... 5
2.3 MILK PROTEINS AND THEIR IMPACT ON VISCOSITY IN FERMENTED PRODUCTS ........................................... 5
2.4 PROBIOTICS ................................................................................................................................................ 6
2.4.1 LACTOBACILLUS ACIDOPHILUS LA-5® ...................................................................................................... 7
2.4.2 BIFIDOBACTERIUM LACTIS BB-12® ........................................................................................................... 7
2.4.3 LACTOBACILLUS CASEI F19® .................................................................................................................... 7
2.5 THE PRODUCTION PROCESS ........................................................................................................................ 7
2.5.1 STANDARDIZATION AND DS-ENFORCEMENT ............................................................................................... 7
2.5.2 DEAERATION ............................................................................................................................................ 8
2.5.3 HOMOGENIZATION .................................................................................................................................... 8
2.5.4 HIGH PASTEURIZATION .............................................................................................................................. 8
2.5.5 COOLING AND INOCULATION ..................................................................................................................... 8
2.5.6 INCUBATION AND BREAKING...................................................................................................................... 9
2.5.7 BUFFER TANKS.......................................................................................................................................... 9
2.5.8 PACKING................................................................................................................................................... 9
2.6 QUALITY ASPECTS FOR PROBIOTIC YOGHURTS ........................................................................................... 9
2.6.1 CHEMICAL AND PHYSICAL CHARACTERISTICS ............................................................................................. 9
2.6.2 SENSORY EVALUATIONS .......................................................................................................................... 10
2.6.3 MICROBIAL VIABILITY ............................................................................................................................. 11
2.6.4 FERMENTATION TIME AND TEMPERATURE ................................................................................................ 11
3. METHODS ................................................................................................................................................. 13
3.1 EXPERIMENTAL METHOD ......................................................................................................................... 13
3.1.1 DESIGN OF EXPERIMENT .......................................................................................................................... 13
3.1.2 MODEL ................................................................................................................................................... 13
3.1.3 STATISTICAL ANALYSES .......................................................................................................................... 14
3.1.4 PRODUCTION OF YOGHURT ...................................................................................................................... 15
3.2 EVALUATION METHODS ............................................................................................................................ 15

3.2.1 MEASUREMENT OF PH ............................................................................................................................. 15
3.2.2 MEASUREMENT OF VISCOSITY ................................................................................................................. 15
3.2.3 STABILITY MEASUREMENTS ..................................................................................................................... 15
3.2.4 MICROBIAL VIABILITY ............................................................................................................................. 15
3.2.5 DETERMINATION OF ACETIC ACID ............................................................................................................ 16
3.2.6 SENSORY EVALUATION ............................................................................................................................ 16
4. RESULTS .................................................................................................................................................. 17
4.1 PRODUCTION ............................................................................................................................................ 17
4.2 MEASUREMENTS ....................................................................................................................................... 17
4.2.1 PH .......................................................................................................................................................... 17
4.2.2 VISCOSITY .............................................................................................................................................. 18
4.2.3 STABILITY .............................................................................................................................................. 19
4.2.4 MICROBIAL VIABILITY ............................................................................................................................. 19
4.2.5 ACETIC ACID ........................................................................................................................................... 20
4.2.6 SENSORY ................................................................................................................................................ 20
4.3 STATISTICAL ANALYSIS ............................................................................................................................ 20
4.3.1 ANALYSIS ON FRESH PRODUCT ................................................................................................................. 20
4.3.2 ANALYSIS ON PRODUCT AT EXPIRATION DAY ............................................................................................ 23
4.3.3 ANALYSIS ON PRODUCT 28 DAYS AFTER PRODUCTION ............................................................................... 25
5. DISCUSSION ............................................................................................................................................ 28
6. CONCLUSIONS ....................................................................................................................................... 31
7. PROPOSAL FOR FUTURE WORK ....................................................................................................... 32
8 REFERENCES .......................................................................................................................................... 33
APPENDICES
A Flow chart for the production of probiotic yoghurt ................................................................................. 35
B Measurement data ..................................................................................................................................... 36

Figures
Figures
Figure 1 The breakdown of lactose into galactose and glucose by enzymatic action of lactic acid bacteria ...... 4 Figure 2 Main components in the metabolism of lactose in lactic acid bacteria showing both
homofermentative pathway and heterofermentative pathway ................................................................... 5
Figure 3 Production line for stirred yoghurt .................................................................................................... 8 Figure 4 Surface whey on yoghurt ................................................................................................................. 10
Figure 5 Treatment combinations for 32-factorial design resulting in 9 combinations ................................... 14
Figure 6 Probe/spindle for Brookfield viscometer. ......................................................................................... 15
Figure 7 pH change during storage for all samples ....................................................................................... 18 Figure 8 Viscosity measurements at a) day 3, b) day 16 and c) day 28.. .......................................................... 18
Figure 9 The microbial viability 3 days after production ................................................................................ 19 Figure 10 The microbial viability 16 days after production ............................................................................ 19
Figure 11 The microbial viability 28 days after production ............................................................................ 19 Figure 12 The total microbial viability for all three strains at day 3, 16 and 28. ............................................. 19
Figure 13 Summary plot for analysis made on product 3 days after production. ............................................ 21 Figure 14 Example of an unsatisfactory replicate plot where the values of sample ........................................ 21
Figure 15 Coefficients plots showing which factors significantly affect the responses at confidence level 0.95
when analyzed at fresh product 3 days after production......................................................................... 22 Figure 16 Contour plot showing the impact of storage times on the response pH .......................................... 23
Figure 17 Contour plot showing the impact of storage times on the response viability of B. lactis ................. 23 Figure 18 Summary of fit plot for analysis made on product 16 days after production. .................................. 23
Figure 19 Coefficients plots showing which factors significantly affect the responses at confidence level 0.95
when analyzed at expiration day ............................................................................................................ 24 Figure 20 Contour plot showing the impact of storage times on the response Viscosity ................................. 25
Figure 21 Contour plot showing the impact of storage times on the response pH .......................................... 25 Figure 22 Contour plot showing the impact of storage times on the response viability of L.casei ................... 25
Figure 23 Summary of fit plot for analysis made 28 days after production. ................................................... 26 Figure 24 Coefficients plots showing which factors significantly affect the responses at confidence level 0.95
when analyzed 28 days after production ................................................................................................ 27
Figure 25 Contour plot showing the impact of storage times on the response Stability .................................. 27 Figure 26 Contour plot showing the impact of storage times on the response pH .......................................... 27

Tables
Tables
Table 1 The two factors Storage time in fermentation tank (STFT) and Storage time in buffer tank (STBT)
each at three levels. ................................................................................................................................ 14 Table 2 pH at the time of packing in Linköping. ............................................................................................ 17

Abbreviations
Abbreviations
CFU Colony forming units
DOE Design of experiments
DS Dry substance
LAB Lactic acid bacteria
LSL Lower specification limit
USL Upper specification limit
RPM Revolutions per minute
STBT Storage time in buffer tank
STFT Storage time in fermentation tank

Chapter 1 - Introduction
1
Chapter 1
Introduction
1.1 Background
During the past twenty years there has been a tremendous increase in the worldwide sales of
cultured products containing probiotic bacteria. Probiotics are food containing live bacterial cultures
that has shown to have a positive health effect when consumed. Most probiotic strains are
integrated into yoghurts, fermented milks, ice creams and pharmaceutical products. The Swedish
Dairy producer Arla Foods has a number of probiotic products on the market today.
The obstacle in the production of fermented products incubated with probiotic strains is its effect on
sensory, chemical and physical properties. To successfully commercialize a probiotic product, good
sensory properties are as important as the documented positive health effect. No negative effects on
texture, taste or aroma are acceptable in order to fully satisfy the costumer. Many parameters affect
these properties in yoghurt such as the choice of starter culture, incubation temperature and time,
processing conditions (e.g., heat treatment, homogenization) and compositional properties of the
milk base (Soukoulis, et al. 2007).
1.2 Arla Foods
This master thesis has been executed at Arla Foods Nordic Innovation in Stockholm. The department
is a unit within Arla Foods that work with, as the name implies, innovation and product development.
Arla Foods amba is a cooperative association owned by Swedish and Danish milk producers. The
company is the result of the fusion between Swedish Arla and Danish MD Foods in the year 2000.
The cooperation is one of the strongest actors on the international dairy market and was in the
beginning of 2008 owned by 8522 Swedish and Danish milk farmers. Arla Foods is world wide spread;
products are being sold on all continents and in more than 100 countries. Sales offices are placed in
27 countries and production in 12 countries (Arla Foods 2008). The product portfolio includes for
example fluid milk, yoghurt, cheese, butter, cream, milk powder and cooking products (Hoovers Inc.
2008).

Chapter 1 - Introduction
2
1.3 Problem specification
It is known that long storage times in fermentation tank and buffer tank for probiotic cultured
products can result in a decrease in quality. The product can as a result of the extended storage
times get an acidic taste with off-flavors reminding of vinegar. The product viscosity is also affected
as well as an increase in whey separation. These undesired characteristics could result in decreased
customer satisfaction and an increase in customer complaints.
1.4 Objective
The objective of the study was to investigate theoretical causes for decrease in product quality as a
result of long storage times in fermentation tank and buffer tank for a chosen cultured probiotic
model product. Through experimental studies, maximum storage times for the product were to be
recommended. Furthermore, these recommended storage times were to be evaluated in terms of
affect on production planning and production economics.
1.5 Limitations
For this study, a probiotic model yoghurt is investigated to study the effect on product quality due to
long storage times in fermentation tank and buffer tank. This type of product was chosen for the
study because of its known sensitivity (Soukoulis, et al. 2007). Because of the limited time period for
this study, the experimental tests were conducted in pilot scale, not in large scale production. The
product was analyzed by the following characteristics: viscosity, stability, pH, amount of acetic acid,
microbial viability and sensory properties.
1.6 Thesis outline
The thesis is divided into chapters as described below:
Chapter 2 is an introduction and explains the theoretical background for production of yoghurts,
previous studies in the subject and description of the quality problem.
Chapter 3 describes the experimental methods used and description of sensory, chemical, microbial
and physiological evaluation methods.
Chapter 4 presents the results gained from this study.
Chapter 5 summarizes and discusses the result.
Chapter 6 presents the conclusion of the thesis.
Chapter 7 gives suggestions for future work in the area.

Chapter 2 – Theoretical background
3
Chapter 2
Theoretical background
2.1 Product description
The model product chosen for this study is a probiotic yoghurt. The base of the product is milk with
the addition of milk proteins. Yoghurt culture containing the bacterial strains Streptococcus
thermophilus and Lactobacillus bulgaricus are added to the milk as well as an ABC-culture which
contains the three bacterial strains Lactobacillus acidophilus LA-5®, Bifidobacterium lactis BB-12® and
Lactobacillus casei F19®. The addition of these three bacteria places the yoghurt in the category of
probiotics with a mixed culture. These types of cultures produce volatile aromatic compounds more
actively than pure cultures (Beshkova, et al. 1998). The product is being produced according to
section 2.5.
2.2 Lactic acid bacteria-LAB
Yoghurts, also called fermented or cultured products are milk products that are prepared by lactic
acid fermentation. Lactic acid bacteria (LAB) are a group of bacteria that ferment lactose into lactic
acid and are the prime agent in the production of yoghurts and other fermented products. Most of
the organisms applied in starters belong to the genera Strepococcus, Lactococcus, Leuconostoc and
Lactobacillus. All these bacteria are gram-positive which mean that they have a thick cell wall.
Depending on their optimum growth temperature, LAB can be divided into mesophilic with optimum
growth temperatures around 20-30°C and thermophilic with optimum growth temperatures at 35-
45°C. The genus can be further divided into two major groups based on their metabolic pathways;
homofermentative and heterofermentative (Geurts, et al. 1999).
A starter culture is one or more types or strains of LAB that is added to milk with the intention of
fermenting it. Starters can be classified as:
1. Single-strain: Every starter consists of a pure culture of one strain.
2. Multiple-strain: A defined mixture of pure cultures of a few strains with different types of
bacteria.
3. Mixed-strain: These are natural starters, consisting of an undefined mixture of strains of
different types of bacteria.

Chapter 2 – Theoretical background
4
Other bacterial
enzymes
2.2.1 Sugar metabolism
Yoghurt is the result of the transformation of lactose into mainly lactic acid which is responsible for
the typical taste of fermented milks. Simplified, the breakdown of lactose can be explained by the
enzymatic action of the enzyme lactase produced by lactic acid bacteria. Lactase belongs to the
group β-galactosidases which are enzymes that split β-galactosides such as lactose. Lactose is broken
down to galactose and glucose by the enzymatic action of lactase. Other enzymes from the lactic acid
bacteria then attack glucose and galactose which are mainly converted into lactic acid (Figure 1)
(ICMSF 1998).
However, the sugar metabolism is more complex and involves both transport of sugar into the cell
and its further breakdown. The further breakdown can be divided into homofermentative and
heterofermentative lactic acid fermentation. Both pathways involve a number of reaction steps
(Figure 2), catalyzed by enzymes. The distinct difference between the two is the metabolites formed.
Homofermentative LAB form solely lactate as the product from sugar metabolism while
heterofermentative LAB also produce CO2, ethanol and acetate (Geurts, et al. 1999). The specific
identity of a yoghurt product is a result of the metabolism of the fermenting microorganisms and the
flavor compounds formed. Other typical products from the bacterial metabolism are acetaldehyde,
fatty acids, peptides and diacetyl (ICMSF 1998).
Lactic acid
Figure 1 The breakdown of lactose into galactose and glucose by enzymatic action of lactic acid bacteria. Other enzymes
from the lactic acid bacteria then attack glucose and galactose which are mainly converted into lactic acid.

Chapter 2 – Theoretical background
5
Lactose
Lactose-P
Galactose + Glucose
Dihydroxyacetone + Glyceraldehyde-3-P
Pyruvate
Lactate
Homofermentative Heterofermentative
2.2.2 Effect of LAB-metabolism on fermented products
As organic acids are being produced by LAB, pH of the product decreases which result in a
preservative effect on the milk. The low pH inhibits the growth of putrefactive bacteria, thereby
prolonging the shelf life of the product. However, yeasts and moulds find this environment favorable
and can be the cause of off-flavors if they infect the product. As acidity increases during fermentation
the milk proteins, in particular the whey proteins, denature and interact with casein proteins to form
a more viscous mass (Bylund 1995).
The ability to metabolize milk proteins and lactose differs considerably between different LAB
resulting in a variety in their ability to produce organic acids and volatile compounds. Production of
these components directly influences the product flavor and texture, and thereby also the
organoleptic quality of the product (Østlie, Helland and Narvhus 2003).
2.3 Milk proteins and their impact on viscosity in fermented products
Milk contains hundreds of proteins where the vast majority is caseins and whey proteins. Caseins
consist of three subgroups, αs-casein, κ-casein and β-casein, which together contribute to 80% of the
total amount of milk proteins. Whey proteins (also referred to as milk serum proteins) are α-
lactalbumin and β-lactoglobulin and stand for 19% of the milk proteins. Both of these groups
contribute to the characteristic texture of yoghurts. As pH drops, the isoelectric point for casein (≈pH
4.7) will be passed and casein will precipitate. Whey proteins on the other hand, do not precipitate as
the isoelectric point is passed. However, whey proteins denature under heat treatment. Almost all of
the proteins are denatured when milk is heated to 90°C for 5 minutes. The denaturation of whey
proteins is an irreversible reaction as the coiled β-lactoglubolin is unfolded and binds via sulphur
bridges to K-casein. The interaction of whey proteins with caseins forms a viscous mass which is
typical for yoghurts (Bylund 1995).
Lactose
Galactose + Glucose
Glyceraldehyde-3-P + Acetyl-P
Lactate
CO2
Ethanol
Acetate
Figure 2 Main components in the metabolism of lactose in lactic acid bacteria showing both
homofermentative pathway and heterofermentative pathway. The metabolites are marked red.
Cell wall
Chapter 2 – Theoretical background
6
2.4 Probiotics
Probiotics are microbial food supplement that result in healthy benefits for the host by improving its
intestinal microbial balance. Probiotic bacteria help keep the digestive system and immune system in
balance, and have shown to have positive effects on different types of diarrhea as well as
constipation. To be able to affect the microbial balance the bacteria needs to be transported to the
intestine. This puts high demands on the properties of the bacteria since it has to handle the harsh
environment in the gastro intestine, such as gastric acid, bile and anaerobic conditions. Furthermore
the bacteria cannot be toxic for the host. These criteria limit the number of possible candidates to a
few species, where Lactobacillus, Streptococcus and Bifidobacterium are the most abundant. All
three bacteria belong to the group lactic acid bacteria (Wageningen University 2008).
The positive health effect from probiotics is achieved in different ways. When the bacteria reach the
intestine it obstructs other harmful bacteria life and reproduction by feeding on the same nutrients,
thereby starving them. Harmful bacteria are also repressed by the good bacteria by taking the best
adhesion sites on the gut wall. Furthermore it helps balance pH, enhances digestion and ensures a
good micro flora balance for the immune system (Christian Hansen A/S 2008). Probiotic lactic-acid-
producing bacteria have shown to result in several health benefits for the host. Studies have shown
that a regular intake of probiotic LAB reduces the risk of diarrhea in association with antibiotics
treatment. L. casei has shown to protect against infections by unwanted bacteria in the gastro
intestine and also reduce gas (Svensson 2008). L. acidophilus has shown a positive effect on people
suffering from IBS, Irritable Bowel Syndrome (Dong, et al. 2008). B. lactis has been reported to
stimulate the immune system and thereby offer the possibility of improving host immune defense
against pathogens (Amrouche, et al. 2006).
To reach a positive probiotic effect, a regular intake is needed which should contain a certain
bacteria cell count per ml. There is no legislation in Sweden today deciding the minimum bacteria cell
count in probiotic food (Larsson 2008). A minimum of 106 cfu/g is suggested (Østlie, Treimo and
Narvhus 2005), however it is not unusual for commercial probiotic products to have cell numbers
around 108 cfu/g (Sullivan, Barkholt and Nord 2003). Therefore, the bacterial viability throughout the
production and during shelf-life until consumption is vital for the functionality of the product. The
choice of probiotic bacteria strains is therefore often based on survival capability and ability to grow
in the media, i.e. milk (Ohlson, et al. 2002).
The world market for probiotics is valued to 100 billion Swedish crowns in 2008. Recent years, the
annual market growth is above 10 percentages, compared to 3-4 percentages for the entire food
market (Avanza Bank 2008).
The model yoghurt studied is categorized as a probiotic yoghurt with a multiple-strain culture
containing the three bacterial strains L. acidophilus, B. lactis and L. casei. One bacterium may help
control the negative effects from another bacteria, B. lactis for example is a slow acid producer which
would cause prolonged fermentation times if not in mix with other LAB (Samona, Robinson and
Marakis 1996).
Chapter 2 – Theoretical background
7
2.4.1 Lactobacillus acidophilus LA-5®
Lactobacillus acidophilus is the most studied species of Lactobacillus and is naturally occurring in the
human intestinal flora. L. acidophilus belongs to the lactic acid bacteria group and produces lactic
acid through homofermentative degradation of lactose. The bacteria survive both aerobe and
anaerobe environments and can also handle acetated environments with pH 4-5 or lower (European
Bioinformatics Institute 2008). The bacteria are a thermophile with an optimal growth rate at 35-
38°C (Gilmour and Rowe 1981).
2.4.2 Bifidobacterium lactis BB-12®
Bifidobacterium lactis is a lactic acid bacteria found in the large intestine. The genus is often
considered as LAB, but is in fact phylogenatically unrelated and has a unique mode of sugar
metabolism (Lund, Baird-Parker and Gould 1999). The breakdown of lactose by B. lactis goes through
the bifidus pathway resulting in approximately equal amounts of lactate and acetate (Bylund 1995),
and is referred to as heterofermentative (M. Øhrstrøm Runge 2008). B. lactis is a thermophile starter
with optimal growth temperature of 37°C. It is strictly anaerobic and thus sensitive for oxygen
(Salminen and von Wright 1998). Studies have shown that fermentation with only B. lactis may result
in defects such as whey separation, slimy or sandy texture, too mild taste, yeasty or vinagry taste or
too little aroma. Therefor, the bacteria is often used in a mixed culture (Samona, Robinson and
Marakis 1996).
2.4.3 Lactobacillus casei F19®
Lactobacillus casei F19® was isolated in the end of 1980 and is today patented by Arla Foods.
Scientifically, the bacteria are classified as Lactobacillus paracasei ssp paracasei, but the name L.
casei F19® is often used. The homofermentative lactic acid bacteria are naturally occurring in the
human intestine and here bind to the mucus (Juntunen, et al. 2001). Optimal growth rate is at 30°C,
thus the bacteria is classified as mesophilic (Bylund 1995).
2.5 The production process
Figure 3 shows a typical production line for stirred yoghurt. A schematic flow chart can be seen in
Appendix A.
2.5.1 Standardization and DS-enforcement
Milk is first standardized in order to ensure that the fat content of the final product meets the
product specification, normally 0.5-3.5% for cultured products. A whey protein concentrate is added
to improve the textural properties of the product (Bylund 1995).

Chapter 2 – Theoretical background
8
Figure 3 Production line for stirred yoghurt (Reproduced from Dairy Processing Handbook. Published by Tetra Pak Processing
Systems AB, S-221 86 Lind, Sweden pg. 249)
2.5.2 Deaeration
The milk is pre-heated prior to deaeration in a plate heat exchanger (No 2 and 3 in Figure 3). The air
content of the milk used to make cultured milk products should be as low as possible, whereas
deaeration takes place. There are several benefits from this process, i.e. it improves the working
condition for the homogenizer, the risk of fouling during treatment is decreasing, it improves the
stability and viscosity of the yoghurt and it removes volatile off-flavors.
2.5.3 Homogenization
Homogenization (No 4 in Figure 3) of milk intended for cultured milk production has two main
motives; prevent creaming during the incubation period and to assure uniform distribution of the
milk fat. The process of homogenization primarily involves disruption of fat globules into smaller
ones by forcing the milk through a small passage at high velocity. As a general recommendation, the
milk should be homogenized at 65-70°C under a pressure of 20-25 MPa in order to get a high degree
of homogenization (Bylund 1995).
2.5.4 High pasteurization
After homogenization the milk is heat treated in order to improve the properties of the milk as a
substrate for the bacteria culture. The treatment also ensures that the coagulum of the finished
product will be firm as well as reducing the risk of whey separation in the final product. The optimum
result is achieved by heating of the milk to 90-95°C and holding that temperature for about 5
minutes in a holding tube (No 5 in Figure 3). This temperature/time combination denatures about 70-
80% of the whey proteins, thereby giving the product a stable “body” (Bylund 1995).
2.5.5 Cooling and inoculation
The milk is then cooled to the inoculation temperature of the product according to the culture
distributor. A determined quantity of freeze dried bacteria culture is added to the milk through the
top hatch of the fermentation tank. After the tank has been filled, agitation commences and
continues for a short time to ensure uniform distribution of the starter culture (Bylund 1995).
2 1
4 3
5
Milk/Yoghurt Cooling media Heating media Vapor Culture Fruit/flavor
1 Balance tank
2 Plate heat
exchanger
3 Evaporator
4 Homogenizer
5 Holding tube
6 Bulk starter tanks
7 Incubation tanks
8 Plate cooler
9 Buffer tanks
10 Fruit/flavor
11 Mixer
12 Packaging

Chapter 2 – Theoretical background
9
2.5.6 Incubation and breaking
When the starter has been mixed into the medium, the bacteria begin to multiply in the
fermentation tanks (No 7 in Figure 3). The fermentation temperature for stirred yoghurts are
normally 42-43°C and it is important to maintain a constant temperature throughout the entire
fermentation process and that no contaminations are allowed to come into contact with the culture.
As bacteria multiply rapidly, lactose is being fermented into lactic acid, thus lowering the pH of the
medium. The fermentation proceeds until a specific pH-value is reached, normally at pH 4.2-4.5. At
this acidity, cooling should begin instantaneously to stop further bacterial growth and to preserve the
activity of the culture at a high level. Breaking is done with a stirrer at the same time as cooling is
started. To ensure a smooth uniform product, the coagulum is broken by a filter/fix. The yoghurt is
cooled to a temperature of 15-22°C in a plate heat exchanger (No 8 in Figure 3). To ensure a good
quality, cooling should take place within 20-30 minutes after desired pH is reached to stop further
production of bacteria. The pH decrease then halts (Bylund 1995).
2.5.7 Buffer tanks
The cooled yoghurt is transported to buffer tanks (No 9 in Figure 3) before being routed to the filling
machine (No 12 in Figure 3). The storage time in the tank should be as short as possible (Bylund
1995). If flavor is to be added to the yoghurt (No 10 in Figure 3), it is done after the buffer tanks and
mixed (No 11 in Figure 3) before transported to the filling machine.
2.5.8 Packing
Ideally, the total packaging capacity should match the capacity of the pasteurization plant, to obtain
optimal running conditions. No visible air bubbles are to be found in a filled package. When packed,
the product is stored at a temperature of ≤8°C, which is the statutory distribution temperature for
most yoghurts (Bylund 1995).
2.6 Quality aspects for probiotic yoghurts
There are many factors that need to be controlled during the production in order to produce high
quality yoghurt with the right taste, aroma, texture, viscosity, appearance, stability and long shelf-
time. To satisfy the costumer, no negative effects on texture are acceptable. Furthermore, to
successfully commercialize a probiotic product, good sensory properties are as important as the
documented health effect (Ohlson, et al. 2002).
2.6.1 Chemical and physical characteristics
As bacteria grow during fermentation, lactic acid and other organic acids such as acetic acid are
produced, thereby lowering the pH of the product. The optimum pH-value for yoghurts varies
depending on type and brand. Optimum aroma and flavor of yoghurts are usually obtained with a pH
value between 4.4 and 4.0 (Bylund 1995). Mild yoghurts may have a pH at 4.3-4.4 while “normal”
acidity is around pH 4.2. Fermentation is to be halted when pH 4.2-4.5 is reached, because of the
post-acidification that will occur. Post-acidification means that the acidity of the product may
increase during storage due to LAB metabolism uncoupled with growth. This post-acidification is due
to β-galactosidase that is still active at 0-5˚C. Consequently pH may decrease to less than 4.2
resulting in whey separation, loss in bacterial viability etc. (Kailasapathy 2006). Normally, post-
acidification reduces the acidity with pH 0.1-0.3 at day 21 at 8°C, depending on the bacterial strain
used (M. Øhrstrøm Runge 2008).The presence of bifidobacteria in yoghurts is thought to prevent this

Chapter 2 – Theoretical background
10
effect by its antagonistic properties towards the yoghurt culture (Samona, Robinson and Marakis
1996).
Production of organic acids such as lactic acid, acetic acid and citric acid directly influences the flavor
and texture of the product. The microbial metabolism of lactose is responsible for the dominant
flavors of fermented milks. Other acids such as acetic acid have a less desirable characteristic and
milk products with high acetic acid contents have a harshness, described as vinegary (Torre, Tamime
and Muir 2003). B. lactis is the main producer of acetic acid and the organic compound is being
produced via the bifidum pathway. L. acidophilus can also produce acetic acid from degradation of
citrate (Østlie, Treimo and Narvhus 2005). The concentration of lactic acid has shown to increase
during storage due to post-acidification. Acetic acid concentration on the other hand has shown to
remain more or less consistent throughout shelf-life (Donkor, et al. 2006).
Other components that influence the flavor of yoghurts are acetaldehyde and diacetyl. Acetaldehyde
is considered an undesired product in milk manufacturing, but in yoghurt a relatively large amount of
the compound is desired to give the characteristic flavor of the product. Diacetyl is also an important
compound for determining the specific characteristic of fermented milk. A low concentration is
responsible for the “buttery” aroma (Østlie, Helland and Narvhus 2003).
Most cultured products should have a smooth, uniform,
spoonable body and texture which is free from lumps or
graininess. The most common textural defects include
weak body, wheying-off and lumpiness. These undesired
variations in texture has shown to be impacted by changes
in incubation time, incubation temperature which
influences growth of starter cultures, gel aggregation and
bond strength, pH at breaking/cutting, postacidification
profile and postmanufacture, i.e. physical and
temperature abuse (Lucey 2004). Whey separation is
considered a major defect in yoghurts and can lead to an
extensive rearrangement of the gel network. It can be defined as the apperance of whey (serum) on
the gel surface (Figure 4). It has been suggested that conditions such as high milk heat treatment,
fast rates of acidification and high incubation temperature result in high levels of whey separation in
yoghurts (Lucey 2001). Higher fermentation temperature has a negative effect on the product
lumpiness/graininess. For yoghurt products, an incubation temperature of 40˚C instead of 45˚C will
lead to slightly longer fermentation times but firmer more viscous gels are formed that are less prone
to whey separation (Lucey 2004).
2.6.2 Sensory evaluations
To determine customer acceptance, to improve products and to conduct shelf-life studies, sensory
testing can be conducted. Sensory evaluations of food are concerned with much more than flavor.
Texture, color, density, aroma and many other factors have sensory values that are often vital to the
quality acceptance of foods. In order to get a reliable evaluation from a sensory panel, members
should be selected and trained with care (Hubbard 1996). Sensory testing of yoghurts is conducted
by a panel specially trained for cultured products and the evaluations are done on the appearance of
the product, texture and flavor. The panelists are equipped with a sensory product specification with
Figure 4 Surface whey on yoghurt. The whey has
been dyed to improve image contrast.

Chapter 2 – Theoretical background
11
description of the attributes appearance, texture and flavor. The product is evaluated at a nine
graded scale where 9 represent the highest quality and 1 the lowest.
A previous study from Arla Foods Nordic Innovation indicates that the pH-value of the product has an
effect on the thickness/hand feel, acid taste, cream aroma and off-flavor. The study was conducted
by a trained sensory panel. Most evident is the connection between a low pH-value and an acidic
taste. There is also a tendency that a low pH-value can result in a thicker hand feel and more off-
flavors. Furthermore, there is also a tendency that high pH-values can result in a stronger cream
aroma (Wahl 2008).
2.6.3 Microbial viability
The model product used in this study is a probiotic product containing an active culture with high
bacterial concentration. It is vital that the viability of the bacteria can be ensured throughout the
entire shelf-life. Several variables are known to have an effect on the bacterial viability; pH,
fermentation temperature, storage temperature, duration of shelf life, dissolved oxygen, additives
such as flavors and preservatives, properties of strain and inoculation rate (M. Øhrstrøm Runge
2008). A number of market surveys have reported a steady decline in the count of L. acidophilus and
B. lactis during shelf-life of yoghurts. Cell numbers are much lower than the recommended 106 cfu/g
at expiration day. The viability of these bacteria in yoghurts is considered sensitive for oxygen
toxicity, especially B. lactis since it is a strictly anaerobic organism (Talwalkar, et al. 2004). The
primary substrate for metabolism in milk is lactose. However, the fermentation and growth is not
limited by the amount of lactose available in the media. The starter organisms are being limited by
the production of lactic acid which decreases pH and creates a more hostile environment for the
bacteria (Østlie, Helland and Narvhus 2003). Studies show that L. acidophilus tolerates the acidic
environment better and in general show higher cell concentration at expiration day. For B. lactis the
pH decline seems to be the most crucial factor affecting its viability whereas its stability in yoghurts
during cold storage has been found to be lower than other probiotic bacteria (Donkor, et al. 2006).
2.6.4 Fermentation time and temperature
It has been demonstrated that fermentation time and temperature affect body, texture and taste of
yoghurts. Østlie et al. (2003) studied the metabolism and growth of different probiotic strains with
well-documented health effects during a fermentation period of 0-72 hours. The study showed the
importance of controlling the fermentation time since the probiotic strains produce different
amounts of metabolic products after a defined fermentation time (Østlie, Helland and Narvhus
2003).
A different study by Østlie et al. (2005) demonstrated the ability of probiotic strains to produce
different amounts of metabolic products according to fermentation temperature. This shift in
metabolic pathways in response to environmental conditions is well documented in the literature in
the case of homofermentative and heterofermentative lactobacilli. From a technological point of
view, metabolic changes are of great importance since the amount of organic compounds and
volatile compounds is important in the development of flavor and texture of the fermented product.
The study showed that a higher fermentation temperature resulted in a faster reduction of pH for L.
acidophilus. Also, the bacteria produced more acetic acid at high temperatures, whereas B. lactis
acetic acid production decreased (Østlie, Treimo and Narvhus 2005).

Chapter 2 – Theoretical background
12
The yoghurt culture used in the production of the product contains two bacterial strains;
Streptococcus thermophilus and Lactobacillus bulgaricus. The ratio between these two classes of
bacteria, cocci and bacillus, should be 1:1 or 2:1. If bacillus is allowed to get the upper hand, it will
cause a too acidic product. One factor affecting this ratio is fermentation temperature. At 40°C the
ratio is approximately 4:1 while an increase to 45°C gives a ratio of 2:1. An optimum temperature at
43°C is suggested for a ratio of 1:1 (Bylund 1995). Fermentation with St. thermophilus normally leads
to mild/acidic taste without yoghurt aroma, while fermentation with L. bulgaricus leads to an acidic
taste with yoghurt aroma. L. bulgaricus has a higher optimum growth rate compared to St.
thermophilus and thus more yoghurt flavor is produced at higher fermentation temperatures. More
yoghurt flavor could be a desired characteristic but increasing the fermentation temperature also
results in a more acidic product (Jørgensen 2008).

Chapter 3 - Methods
13
Chapter 3
Methods
3.1 Experimental method
In order to analyze the decrease in quality for the probiotic yoghurts resulting from long storage
times in fermentation tank and buffer tank, a pilot scale test study was executed at Arla production
site in Linköping. Design of Experiments (DOE) was used as a model for constructing the experiment.
Storage times were defined as:
• Storage time in fermentation tank (STFT) – The time from which the product reaches the
desired pH until the fermentation tank is emptied.
• Storage time in buffer tank (STBT) – The time from when the product is starting to enter the
buffer tank until the tank is emptied.
3.1.1 Design of experiment
Design of experiments is an efficient approach for organizing experimental work (Montgomery 2005).
The Design of Experiments software package, MODDE, was used in this study to investigate the
importance of the two varied parameters, storage time in fermentation tank and storage time in
buffer tank.
3.1.2 Model
The experiment was designed as a 32 factorial design – that is, a factorial arrangement with 2 factors
each at three levels. The two factors are storage time in fermentation tank and storage time in buffer
tank. The three levels of the two factors will be referred to as low (1), intermediate (2) and high (3).
The values of these levels were chosen by studying logged process data from the production of a
probiotic yoghurt. Table 1 shows the experimental design with levels for samples as well as sample
names. F stands for fermentation tank and B stands for buffer tank, i.e. F1:B3 represents the sample
that has spent the shortest time in fermentation tank and the longest time in buffer tank.

Chapter 3 - Methods
14
Table 1 The two factors Storage time in fermentation tank (STFT) and Storage time in buffer tank (STBT) each at three levels.
The experimental name for each combination is shown. F for storage time in fermentation tank and B for storage time in
buffer tank. The samples followed by the letter R is replicates.
Experiment
Order
Experiment name Level for STFT Level for STBT Level
1 F1:B1 Low Low 11
2 F1:B1 R Low Low 11
3 F1:B2 Low Medium 12
4 F1:B3 Low High 13
5 F2:B1 Medium Low 21
6 F2:B2 Medium Medium 22
7 F2:B2 R Medium Medium 22
8 F2:B3 Medium High 23
9 F3:B1 High Low 31
10 F3:B2 High Medium 32
11 F3:B3 High High 33
12 F3:B3 R High High 33
The treatment combinations for the design are shown in Figure 5. Normally a 32 -model would result
in 9 treatment combinations. Since all measurements vary, there is a need for replicates to
determine the amount of variation in our particular measurements. Replicates are included in
treatment 11, 22 and 33, thus resulting in 12 treatments with 9 combinations.
Figure 5 Treatment combinations for 32-factorial design resulting in 9 combinations. The two factors Storage time in
fermentation tank and Storage time in buffer tank each has three levels; Low (1), Intermediate (2) and High (3). The red
mark in treatment 11, 22 and 33 indicates replicates resulting in 12 treatments.
3.1.3 Statistical Analyses
Data from measurements were analyzed using the statistical software Modde version 7.0.0.1
(Umetrics, Umeå, Sweden). MLR (Multiple linear regression) models were constructed and responses
significantly affected by the two factors, storage time in fermentation tank and buffer tank, were
defined at P < 0.05. The accuracy of the models constructed is determined by R2 and Q2. R2 describes
how well the data fits the model, while Q2 describes how well the model predicts new data. These
were critically inspected as well as the accuracy of the replicates. Contour plots were constructed to
find optimal settings for the significant factors.

Chapter 3 - Methods
15
Figure 6 Probe/spindle
for Brookfield
viscometer.
3.1.4 Production of yoghurt
The yoghurt was produced in the pilot plant at Arla production site in Linköping according to the
production process described in section 2.5. All variables, such as temperature, holding times etc.
where set according to section 2.5. Three 1000 liter batches of yoghurt were made by inoculation of
milk with yoghurt culture and frozen ABC-culture containing the three probiotic bacterial strains LA-
5®, BB-12® and F19®. The inoculated milk was incubated at 43.0˚C until pH 4.50 was reached. The
product was kept in the fermentation tank during a defined time period, before broken, cooled to
20.0˚C and transported to buffer tank. In order to ensure a homogenous product, the buffer tank was
stirred for 3 minutes prior to packaging for intermediate and high level on storage time in buffer
tank. The product was packed in 250 ml packages, marked and put in a refrigerated room at 8°C. The
packages were then transported to Arla Foods in Stockholm for evaluation and analyses.
3.2 Evaluation methods
Samples from every fermentation time and buffer time were analyzed in terms of sensory
characteristics, chemical and physical evaluations and microbiological evaluation. Analyses were
made 3 days, 9 days, 16 days and 28 days after production.
3.2.1 Measurement of pH
pH was measured using a pH meter (Orion 307, Scandinovata AB, Bromma, Sweden). The pH meter
was calibrated using standard buffer solutions at pH 4.01, 5.00 and 7.00. Upper specification limit
was set to pH 4.40 and lower to pH 4.00 according to literature (Bylund 1995).
3.2.2 Measurement of viscosity
Apparent viscosity (expressed in Pa·s) was measured using a Brookfield viscometer
model DV-II+ (CiAB, Lidingö, Sweden). The test technique consists of driving a
cylindrical probe or spindle (Figure 6) of defined geometry into a sample held within a
specific container. Yoghurt samples were poured into 500 ml containers one day prior
to measurements and stored refrigerated at 7˚C and tested next day in the centre of
the container at room temperature. Spindle size 4 was used and rotated at 10 rpm for 1
min. Specification limits were set to reassemble similar yoghurt products and coded
into percentage. 100% represents the upper specification limit and 0% represents the
lower limit.
3.2.3 Stability measurements
Stability measurements quantify the amount of whey separation expressed in percentage. The
method consists of removing surface whey with a pipette. The weight of the removed whey is
divided by the total weight. The method is not precise and an average of measurements from five
samples is noted.
3.2.4 Microbial viability
The bacterial lead in the yoghurts was evaluated at day 3, 16 and 28. Three replicates of each sample
were analyzed at MRS agar with pH 5.4. The plates are incubated under anaerobic conditions at 37°C
for 72±6 hours. Bacterial viability is expressed in colony forming units per g (cfu/g). The lower
specification limit is the recommended 106 cfu/g.

Chapter 3 - Methods
16
3.2.5 Determination of Acetic acid
The amount of acetic acid was analyzed using an acetic acid kit (Enzyplus® EZA 811+, Raisio
Diagnostics, Rome, Italy). Results were expressed in grams of acetic acid per liter yoghurt. No
reference value of the amount of acetic acid in cultured product is available today. Therefore, the
acetic acid concentration was measured on two samples of probiotic yoghurt retrieved from the
supermarket. An average of these two concentrations was used as a reference value.
3.2.6 Sensory evaluation
A panel specially trained for cultured products conducted sensory tastings for this study and the
evaluations were being done on the appearance, texture and flavor. The panelists were equipped
with a sensory product description for a similar product, describing the required sensory quality at
the time for expected consumption date. The sensory evaluations for the 12 samples were
conducted at Arla Foods Nordic Innovation in Stockholm at five occasions. The evaluation was
conducted 9 days, 16 days and 28 days after production. The product was evaluated on a nine-
graded scale where the highest grade on the scale defines the highest quality. Grade 8 represents the
product quality according to sensory product specification which is the target value for Arla. For the
product to be satisfactory, no value below 6 is acceptable. If the product is graded 5 or lower, there is
a possible risk for customer complaints.
Chapter 4 –Results
17
Chapter 4
Results
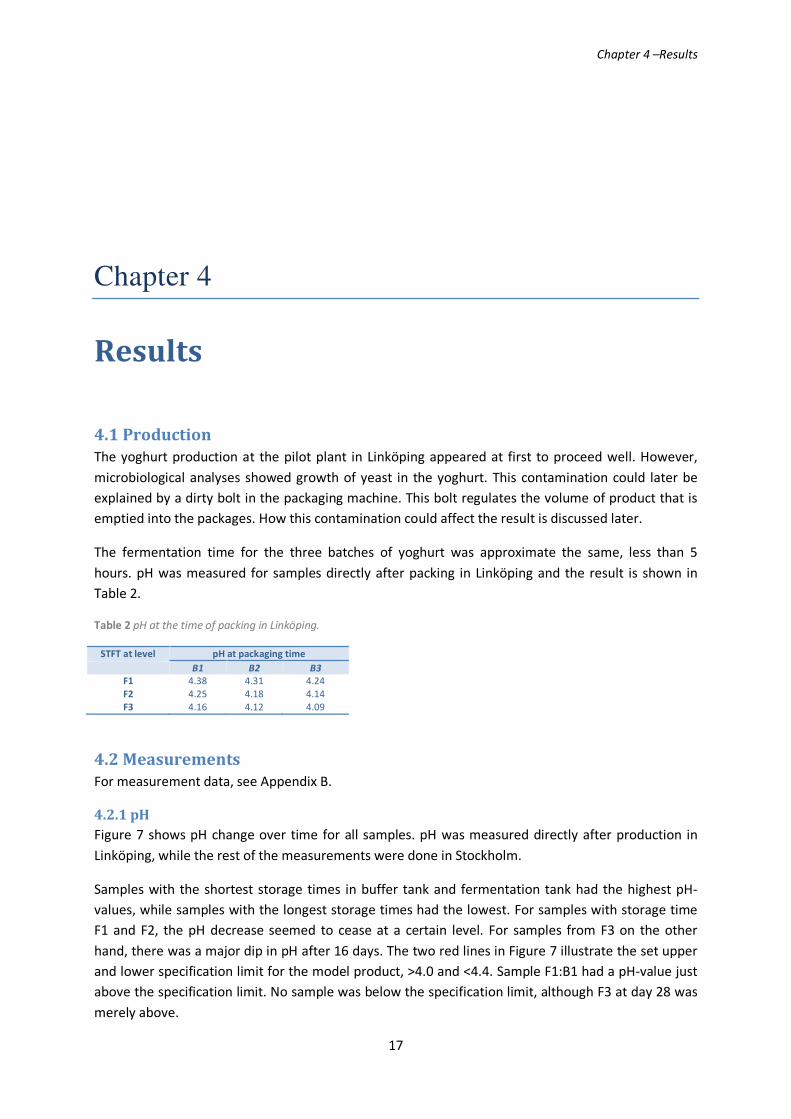
4.1 Production
The yoghurt production at the pilot plant in Linköping appeared at first to proceed well. However,
microbiological analyses showed growth of yeast in the yoghurt. This contamination could later be
explained by a dirty bolt in the packaging machine. This bolt regulates the volume of product that is
emptied into the packages. How this contamination could affect the result is discussed later.
The fermentation time for the three batches of yoghurt was approximate the same, less than 5
hours. pH was measured for samples directly after packing in Linköping and the result is shown in
Table 2.
Table 2 pH at the time of packing in Linköping.
STFT at level pH at packaging time
B1 B2 B3
F1 4.38 4.31 4.24 F2 4.25 4.18 4.14 F3 4.16 4.12 4.09
4.2 Measurements
For measurement data, see Appendix B.
4.2.1 pH
Figure 7 shows pH change over time for all samples. pH was measured directly after production in
Linköping, while the rest of the measurements were done in Stockholm.
Samples with the shortest storage times in buffer tank and fermentation tank had the highest pH-
values, while samples with the longest storage times had the lowest. For samples with storage time
F1 and F2, the pH decrease seemed to cease at a certain level. For samples from F3 on the other
hand, there was a major dip in pH after 16 days. The two red lines in Figure 7 illustrate the set upper
and lower specification limit for the model product, >4.0 and <4.4. Sample F1:B1 had a pH-value just
above the specification limit. No sample was below the specification limit, although F3 at day 28 was
merely above.

Chapter 4 –Results
18
Figure 7 pH change during storage for all samples. F-fermentation level, B-buffer level.
4.2.2 Viscosity
The result from the viscosity measurements shows that the product viscosity changed considerably
during shelf life. For fresh product, the viscosity was in the lower region of the specification interval,
whereas it at day 16 had a viscosity values in the higher region. All samples had a viscosity within the
specification limits. When studying the data, it appears that long storage times in fermentation tank
increases viscosity while a longer storage time in buffer tank decreases viscosity (Figure 8).
Figure 8 Viscosity measurements at a) day 3, b) day 16 and c) day 28. F-fermentation level, B-buffer level.
3,9
4
4,1
4,2
4,3
4,4
4,5
Directly after production
3 days 9 days 16 days 28 days
pH
Time
pH change during storage time
F1:B1
F1:B2
F1:B3
F2:B1
F2:B2
F2:B3
F3:B1
F3:B2
F3:B3
0
5
10
15
20
25
30
B1 B2 B3
%
Viscosity at day 3
F1
F2
F3
40
50
60
70
80
90
100
B1 B2 B3
Viscosity at day 16
F1
F2
F3
40
50
60
70
80
90
100
B1 B2 B3
%
Viscosity at day 28
F1
F2
F3
a)
c)
b)
USL
LSL

Chapter 4 –Results
19
4.2.3 Stability
All samples showed whey separation to some extent, although not in large amounts.
4.2.4 Microbial viability
The microbial viability was measured 3, 16 and 28 days after production. The highest viability was
measured for B. lactis 3 days after production regardless of STFT and STBT (Figure 9). However, there
was a small decrease in viability for B. lactis samples with the longest storage time in fermentation
tank, F3. This decrease was not shown for L. casei and L. acidophilus, which both showed a relatively
stable viability regardless of STFT and STBT. At day 16, there had been a small decline in cell count for
most samples (Figure 10). The most apparent decrease was for B. lactis for samples from F3. All three
samples in data point F3:B2 had statistically uncertain results as too few colonies could be counted,
whereas no column is shown in Figure 10. The same applies for F1:B2 for L. acidophilus at day 28
(Figure 11). Other samples that had statistically uncertain results were excluded from the result
because it would give misleading graphs. Data points that are not an average of three measurements
are market with a star. Between day 16 and 28 there is a larger decrease is cell count for L.
acidophilus, from approximate 7.8 to 7.1 log cfu/g. The total viability for all strains is represented in
Figure 12 and is far above the recommended limit at 106 cfu/g. There was growth of yeasts at day 16
and 28 for all samples.
Figure 9 The microbial viability 3 days after production. If
not marked with a star, samples are an average of three
measurements.
Figure 10 The microbial viability 16 days after
production. If not marked with a star, samples are an
average of three measurements.
Figure 11 The microbial viability 28 days after
production. If not marked with a star, samples are an
average of three measurements.
Figure 12 The total microbial viability for all three strains
at day 3, 16 and 28.
6,40
6,70
7,00
7,30
7,60
7,90
8,20
8,50
8,80
F1:B
1
F1:B
2
F1:B
3
F2:B
1*
F2:B
2*
F2:B
3
F3:B
1
F3:B
2
F3:B
3
log
cfu
/g
Sample
Viability at day 3
L. acidophilus
B. lactis
L. casei
6,406,707,007,307,607,908,208,508,80
F1:B
1
F1:B
2
F1:B
3
F2:B
1
F2:B
2
F2:B
3
F3:B
1
F3:B
2
F3:B
3*
log
cfu
/g
Sample
Viability at day 16
L. acidophilus
B. lactis
L. casei
6,40
6,70
7,00
7,30
7,60
7,90
8,20
8,50
8,80
F1:B
1*
F1:B
2
F1:B
3*
F2:B
1
F2:B
2
F2:B
3
F3:B
1*
F3:B
2
F3:B
3
log
cfu
/g
Sample
Viability at day 28
L. acidophilus
B. lactis
L. casei
21,50
22,00
22,50
23,00
23,50
24,00
24,50
25,00
25,50
F1:B
1
F1:B
2
F1:B
3
F2:B
1
F2:B
2
F2:B
3
F3:B
1
F3:B
2
F3:B
3
log
cfu
/g
Sample
Total viability
Dag 3
Dag 16
Dag 28

Chapter 4 - Results
20
4.2.5 Acetic acid
The results from the acetic acid analyses indicated that no significant difference was to be found
between samples from different treatments, values varied between 0.91 g/L and 1.56 g/L. The
highest concentration was found in samples from F2 at day 16, 1.42-1.56 g/L. Two samples had a
concentration around 0.5 g/L, but this deviation probably depended on lack of one of the reagents in
the kit. The acetic acid level remained rather stable throughout shelf-life. The reference value was
0.47 g/L.
4.2.6 Sensory
12 samples of the product from 9 different treatments regarding storage times where analyzed at
day 9, 16 and 28 after production. However, no sensory analysis was made at samples from F1 and
F2 at day 28 since the sensory panel found the product to have unpleasant off-flavors described as
bitter, unfresh, oxidized, rancid and yeasty.
The result indicated that F1, F2 and F3 in general had the same appearance and texture, with some
variation in graininess, thin hand and mouth feel. Samples from F3 had fewer comments on
graininess and more comments on thin hand and mouth feel at day 9. Comments about thin hand
and mouth feel are most abundant for the evaluation made at day 9.
All samples except F2:B2 and F2:B3 were approved according to product description, i.e. the average
value of the samples was between 6-8 points. Samples from F3 had only minor defects with the
lowest average value at 7 points, even at day 28. In general, all samples tended to have somewhat
too week yoghurt and cream aroma. All samples except F1:B1 was described to have “somewhat too
strong acidity”. The acidity of the samples was of varying type and described as acidic, citric, acetic or
vinegary. Based on the number of comments regarding strength on acidity, it seems as samples from
F1 and F2 tends to become more acid when spending long times in buffer tanks. The result also
shows that F3 has more comments about strong acidity than F1 and F2 at day 16. Comments about
bitter taste appeared frequently and tended to be stronger for F2 and F3 and increased during shelf-
life.
4.3 Statistical analysis
4.3.1 Analysis on fresh product
The summary of fit plot (Figure 13) shows the MLR models constructed, using measurements on
fresh product (3 days after production). The models are only acceptable for pH and B. lactis. pH has
R2=0.86 and Q2=0.68. B. lactis has R2=0.76 and Q2=0.56. These high values on R2 and Q2 indicate high
accuracy of the models. pH has a negative model validity which indicates significant “lack of fit”, i.e.
model imperfection. The models for viscosity, acetic acid, L. casei and L. acidophilus have low or even
negative R2 and Q2 and are thus poor models.

Chapter 4 - Results
21
Figure 13 Summary plot for analysis made on product 3 days after production.
The poor model for these responses will be discussed further in Chapter 5, but could be explained by
its replicates. Figure 14 shows a replicate plot for the response Viscosity. The value of the replicate
for F1:B1 R, differs greatly from the value for F1:B1.
Figure 14 Example of an unsatisfactory replicate plot where the values of sample F1:B1 and its replicate F1:B1 R differs
considerably.
The responses were further analyzed in coefficient plots. This type of plot displays the coefficients, when changing from 0 to high, for the selected response with the confidence interval as error bars. Figure 15a shows the coefficients plot of pH where both STFT and STBT seem to significantly affect the response. The acidity of the product is increasing with storage time in fermentation tank as well as buffer tank, although STFT is a stronger affecting factor. The viability of B. lactis is significantly affected by STFT as seen in Figure 15b. Longer storage time in fermentation tank appears to reduce the cell count, while STBT does not seem to have such an effect. The model for viscosity is poor and therefore no definite conclusions can be drawn. However, the coefficients plot indicates that STFT could increase product viscosity (Figure 15c). The model for L. casei is also poor, but the coefficients
-0 ,2 0
0,0 0
0,2 0
0,4 0
0,6 0
0,8 0
1,0 0
V is c os it y pH A c et ic a c id L . ac id oph ilus B . lac t is L . c as e i~
S u m m a ry o f F it (M L R ) - D a y 3
N = 12 C o n d . n o . = 1 ,5 2 8 6
D F =8 Y - m i ss = 0
R 2
Q 2
M ode l V a lid it y
R epro duc ib il ity
M O D D E 7 - 2 0 0 9 -0 1 -1 9 0 9 :1 3 :1 0
4 , 2 0
4 , 4 0
4 , 6 0
4 , 8 0
5 , 0 0
5 , 2 0
5 , 4 0
5 , 6 0
1 2 3 4 5 6 7 8 9 1 0 1 1
Vis
cosity
R e p l i c a t e In d e x
P lo t o f R e p l ic a t io n s f o r V is c o s it y - D a y 3
F 1 : B 1
F 1 : B 1 R
F 1 : B 2
F 1 : B 3
F 2 : B 1
F 2 : B 2
F 2 : B 2 R
F 2 : B 3
F 3 : B 1
F 3 : B 2
F 3 : B 3
F 3 : B 3 R
M O D D E 7 - 2 0 0 9 - 0 1 - 1 9 0 9 : 1 5 : 1 6

Chapter 4 - Results
22
plot indicates that longer storage times in fermentation tank could reduce cell counts of L. casei
(Figure 15d).
Figure 15 Coefficients plots showing which factors significantly affect the responses at confidence level 0.95 when analyzed
at fresh product 3 days after production. STFT=Storage time in fermentation tank, STBT=storage time in buffer tank.
In the contour plots, the changes in pH (Figure 16) and cell count of B. lactis (Figure 17) due to
different levels on STFT and STBT is represented. The figure shows the change in pH due to changes
in STBT and STFT. The diagram shows that the acidity increases with storage times, both in
fermentation tank and buffer tank. The figure also indicates that the decrease in pH is more sensitive
to long storage times in fermentation tank. The contour plot for B. lactis illustrates a steady decline in
cell count as the storage time in fermentation tank increases. Storage time in buffer tank does not
seem to affect the viability significantly.
-0,060
-0,040
-0,020
0,000
0,020
ST
FT
ST
BT
ST
FT
*ST
BT
Scaled & Centered Coefficients for pH - Day 3
N=12 R2=0,864 R2 Adj.=0,814
DF=8 Q2=0,678 RSD=0,0245 Conf. lev.=0,95
MODDE 7 - 2009-01-19 09:21:06
-1,0008
-5,0007
0,0000
5,0007
ST
FT
ST
BT
ST
FT
*ST
BT
cfu
/g
Scaled & Centered Coefficients for B. lactis - Day 3
N=12 R2=0,763 R2 Adj.=0,674
DF=8 0 RSD=51334396,0000Conf. lev.=0,95
MODDE 7 - 2009-01-19 09:21:59
-0,40
-0,20
0,00
0,20
0,40
0,60
ST
FT
ST
BT
ST
FT
*ST
BT
Pa
*s
Scaled & Centered Coefficients for Viscosity - Day 3
N=12 R2=0,590 R2 Adj.=0,436
DF=8 Q2=-0,101 RSD=0,2987 Conf. lev.=0,95
MODDE 7 - 2009-01-19 09:20:41
-0,150
-0,100
-0,050
0,000
0,050
0,100S
TF
T
ST
BT
ST
FT
*ST
BT
cfu
/g
Scaled & Centered Coefficients for L. casei - Day 3
N=12 R2=0,503 R2 Adj.=0,317
DF=8 Q2=-0,541 RSD=0,0871 Conf. lev.=0,95
MODDE 7 - 2009-01-19 09:22:29
a) b)
c) d)

Chapter 4 - Results
23
Figure 16 Contour plot showing the impact of storage
times on the response pH. STFT=Storage time in
fermentation tank, STBT=storage time in buffer tank.
Figure 17 Contour plot showing the impact of storage
times on the response viability of B. lactis. STFT=Storage
time in fermentation tank, STBT=storage time in buffer
tank.
4.3.2 Analysis on product at expiration day
16 days after production, all measurements were done resulting in ten responses to evaluate.
According to the summary of fit plot (Figure 18), three of the models constructed are adequate;
Viscosity (R2=0.73 and Q2=0,55), pH (R2=0.96 and Q2 =0.90) and L. casei (R2=0.94 and Q2 =0.84) which
all have high R2 and Q2 values. Appearance, Texture and Taste/Aroma all showed bad replicates for
F2:B2. Appearance also has one detected outlier when studying a normal probability plot.
Figure 18 Summary of fit plot for analysis made on product 16 days after production.
The responses were further analyzed in coefficient plots (Figure 19). The viscosity of the product is
significantly affected by both STFT and STBT, but in diverse directions. Viscosity increases with
increasing storage time in fermentation tank, while it decreases with storage time in buffer tank. For
pH, both STFT and STBT are significantly affecting the response, but the strongest affecting factor is
-0 ,2 0
0 ,0 0
0 ,2 0
0 ,4 0
0 ,6 0
0 ,8 0
1 ,0 0
Vis co s ity~ S ta b il ity~ p H Ace tic a cid L . a c id o . B . la ctis L . ca s e i Ap p e a ra n ce Te xtu re Ta s te /Aro m a
S u m m a ry o f F it (M L R ) - D a y 1 6
N=12 Cond. no.=1,5286
DF=8 Y-miss=0
R2
Q 2
M odel V a lid ity
Reproduc ib ilit y
M O D D E 7 - 2009 -01 -19 09 :33 :27

Chapter 4 - Results
24
STFT. L. casei is negatively affected by STFT, i.e. long storage times reduce cell counts. The model for
B. lactis is poor, but indicates that long storage times in fermentation tank reduce the viability.
Figure 19 Coefficients plots showing which factors significantly affect the responses at confidence level 0.95 when analyzed
at expiration day. STFT=Storage time in fermentation tank, STBT=storage time in buffer tank.
The contour plot for viscosity (Figure 20) shows a steady increase in viscosity as the storage time in
fermentation tank increases. The reversed connection seems to apply for long storage times in buffer
tank as viscosity then decreases. Figure 21 shows how the acidity of the product increases with STFT
and STBT. Once again, the steep slope indicates that STFT is a stronger affecting factor.
-0,030
-0,020
-0,010
0,000
0,010
0,020
0,030
ST
FT
ST
BT
ST
FT
*ST
BT
Pa*s
Scaled & Centered Coefficients for Viscosity - Day 16
N=12 R2=0,732 R2 Adj.=0,632
DF=8 Q2=0,555 RSD=0,0143 Conf. lev.=0,95
MODDE 7 - 2009-01-19 09:35:18
-0,070
-0,060
-0,050
-0,040
-0,030
-0,020
-0,010
0,000
0,010
ST
FT
ST
BT
ST
FT
*ST
BT
Scaled & Centered Coefficients for pH - Day 16
N=12 R2=0,956 R2 Adj.=0,940
DF=8 Q2=0,900 RSD=0,0140 Conf. lev.=0,95
MODDE 7 - 2009-01-19 09:35:58
-4,0007
-3,0007
-2,0007
-1,0007
0,0000
1,0007
2,0007
ST
FT
ST
BT
ST
FT
*ST
BT
cfu
/g
Scaled & Centered Coefficients for L. casei - Day 16
N=12 R2=0,937 R2 Adj.=0,913
DF=8 0 RSD=10731694,0000Conf. lev.=0,95
MODDE 7 - 2009-01-19 09:36:37
-8,0007
-6,0007
-4,0007
-2,0007
0,0000
2,0007
4,0007
6,0007S
TF
T
ST
BT
ST
FT
*ST
BT
cfu
/g
Scaled & Centered Coefficients for B. lactis - Day 16
N=12 R2=0,452 R2 Adj.=0,246
DF=8 0 RSD=51721808,0000Conf. lev.=0,95
MODDE 7 - 2009-01-19 09:36:17
c) d)
a) b)

Chapter 4 - Results
25
Figure 20 Contour plot showing the impact of storage
times on the response Viscosity. STFT=Storage time in
fermentation tank, STBT=storage time in buffer tank.
Figure 21 Contour plot showing the impact of storage
times on the response pH. STFT=Storage time in
fermentation tank, STBT=storage time in buffer tank.
The cell count for L. casei is decreasing due to prolonged STFT (Figure 22). There also seems to be
some affect from STBT since the highest viability is at low STFT and STBT.
Figure 22 Contour plot showing the impact of storage times on the response viability of L.casei. STFT=Storage time in
fermentation tank, STBT=storage time in buffer tank.
4.3.3 Analysis on product 28 days after production
All analysis where to be made on samples 28 days after production, but due to an unpleasant off-
flavor and sourness, sensory evaluations where not conducted at samples from F1 and F2. F3
samples were analyzed but not included in the statistical evaluation. Therefore only seven responses
were evaluated at this time. According to the summary of fit plot (Figure 23) only two of the models
constructed are acceptable; the model for stability (R2=0.70 and Q2=0.32) and for pH (R2=0.86 and Q2
=0.63) which both have high values on R2 and Q2. The difference between R2 and Q2 for stability is
somewhat large which should be taken into account. Furthermore, the model validity for pH is low.
Acetic acid, L. acidophilus, L. casei and B. lactis all have one or several bad replicates. L. acidophilus
also has one detected outlier when studying a normal probability plot.

Chapter 4 - Results
26
Figure 23 Summary of fit plot for analysis made 28 days after production.
The responses were further analyzed in coefficient plots (Figure 24). The stability of the product
seems to be significantly affected by both STFT and STBT, but in diverse directions. The appearance
of whey separation seems to increase with storage time in buffer tank, while it decreases with
storage time in fermentation tank (Figure 24a). For pH, only STFT significantly affect the response
(Figure 24b). The model for viscosity is poor, but studying the coefficient plot in Figure 24c, storage
time in buffer tank could have a negative effect on the response. Also, long storage times in
fermentation tank seems to result in a more viscous product, although not significantly.
-0 ,20
0 ,00
0 ,20
0 ,40
0 ,60
0 ,80
1 ,00
V is c os ity S tab il ity ~ pH A c et ic ac id L . ac idoph ilus B . lac t is L . c as e i~
S u m m a ry o f F it (M L R ) - D a y 2 8
N=12 Cond. no.=1,5286
DF=8 Y-miss=0
R 2
Q 2
Mo d e l Va l id i ty
R e p ro d u c ib i li ty
M O D D E 7 - 2 00 9 -0 1 -1 9 0 9 :4 1 : 4 8
-0,0020
-0,0010
0,0000
0,0010
0,0020
ST
FT
ST
BT
ST
FT
*ST
BT
%
Scaled & Centered Coefficients for Stability - Day 28
N=12 R2=0,702 R2 Adj.=0,590
DF=8 Q2=0,317 RSD=0,0010 Conf. lev.=0,95
MODDE 7 - 2009-01-19 09:44:03
-0,150
-0,100
-0,050
0,000
ST
FT
ST
BT
ST
FT
*ST
BT
Scaled & Centered Coefficients for pH - Day 28
N=12 R2=0,860 R2 Adj.=0,808
DF=8 Q2=0,632 RSD=0,0475 Conf. lev.=0,95
MODDE 7 - 2009-01-19 09:44:18
a) b)

Chapter 4 - Results
27
Figure 24 Coefficients plots showing which factors significantly affect the responses at confidence level 0.95 when analyzed
28 days after production. STFT=Storage time in fermentation tank, STBT=storage time in buffer tank.
Figure 25 indicates that the stability of the product increases for long storage times in buffer tank but
decrease for long storage times in fermentation tank. The contour plot for pH reassembles the
previous plots for this response, except for a slightly steeper curvature (Figure 26).
Figure 25 Contour plot showing the impact of storage
times on the response Stability. STFT=Storage time in
fermentation tank, STBT=storage time in buffer tank.
Figure 26 Contour plot showing the impact of storage
times on the response pH. STFT=Storage time in
fermentation tank, STBT=storage time in buffer tank.
-0,80
-0,60
-0,40
-0,20
0,00
0,20
0,40
0,60
ST
FT
ST
BT
ST
FT
*ST
BT
Pa*s
Scaled & Centered Coefficients for Viscosity - Day 28
N=12 R2=0,621 R2 Adj.=0,478
DF=8 Q2=-0,104 RSD=0,3731 Conf. lev.=0,95
MODDE 7 - 2009-01-19 09:43:38
c)

Chapter 5 - Discussion
28
Chapter 5
Discussion
The pH values measured in Linköping deviates from the pH values measured in Stockholm. The pH
value in Stockholm at day 3 is between 0.04 and 0.18 higher than the value measured in Linköping at
fresh product. It is known that acidity increases with time and therefore this sudden decrease in
acidity is strange. By studying analyses done on the two pH-meters, this large difference is possible
and had been seen approximate three weeks prior to the production dates for this study. Another
theory for the high pH values is the growth of yeast, which might affect the acid balance. If the
measurements from Linköping are excluded, then pH shows a steady decline throughout the storage
time. pH of the yoghurt decreases with longer storage times in fermentation tank as well as buffer
tank. Storage time in fermentation tank is the strongest factor affecting the final acidity of the
product. In order to avoid a too acidic product at expiration day, storage time in buffer tank must
consider the time the product has spent in fermentation tank. Normal acidity for yoghurts is pH 4.2
and measurements at day 3 showed that all samples are above this limit. In fact, no sample is below
the set lower specification limit at pH 4.0 even at day 28. Yeast could be the explanation for this too.
If there is no significant difference between the pH meters in Stockholm and Linköping and there
would have been no growth of yeast, then pH values would probably have been remarkably lower.
No definite recommendation can be given for storage times at this point.
Viscosity seems to be affected by storage times, both in fermentation tank and buffer tank. Viscosity
at day 3 and day 28 showed poor models when analyzed with Modde and is probably caused by bad
replicates. Nevertheless, the coefficients plots from all analyses show a similar pattern. As storage
time in fermentation tank increases, the yoghurt viscosity increases and as storage time in buffer
tank increases, the yoghurt viscosity decreases. To find an optimal setting to reach the desired value
on viscosity, both factors have to be taken into account.
The result from the stability measurements indicate that longer storage times in fermentation tank
result in less surface whey. The result also indicates that a longer storage time in buffer tank causes
more whey to appear. In general the method for measuring stability by removing surface whey is a
non accriditated method and can lead to uncertain results. In this study, the stability measurements
were being done by the author herself, who lacks experience for this type of measurements, which
could have affected the result. Samples with long storage times in fermentation tank resulted in a

Chapter 5 - Discussion
29
thicker body, which could have facilitated the removal of whey. Removing whey from a thinner
product may be more difficult as some of the product may accidentally be removed also.
Acetic acid concentrations remained more or less consistent during shelf-life which has been
reported earlier (Donkor et al. 2006). No pattern in the variations in acetic acid concentration
between samples could be found. The reference value showed an acetic acid concentration of 0.471
g/L. The lowest concentration of acetic acid, which one can expect most people to taste, is at 0.16-
0.43 g/L. The samples from this study is far above the threshold and it is most likely that off-flavors
will be detected (Brandt Marie Ditte. 2009). Øhrstrøm found that an acetic acid concentration of 3
g/L gave a yoghurt an “acid burning taste” (M. Øhrstrøm Runge 2008). The method used for
measuring acetic acid was by using an Acetic acid kit. It is possible that analysis with HPLC would give
more correct results.
The microbial viability for all three probiotic strains was above the recommended during the entire
shelf-life for samples that were statistically verified. Samples that were not statistically verified had a
large growth of bacteria on the plate, making the cell count difficult. This was the case for F3:B2 for
B. lactis at day 16 and F1:B2 for L. acidophilus at day 28. The viability of B. lactis in yoghurts has been
reported to be lower than the other probiotic bacteria during cold storage (Donkor et al. 2006). In
this study the decline for B. lactis was from ~8.6 to ~7.6 log cfu/g from day 3 to day 28. This
decrease in cell count is not remarkably greater than the decrease of L. acidophilus which is
decreasing from 7.8 to 7.1 log cfu/g. L. acidophilus has a rather constant cell count up to day 16.
Between day 16 and 28 there is a sudden decrease in cell count for L. acidophilus. This trend has
been reported in other studies (Donkor et al. 2006). Donkor et al. 2006 also reported that the
viability for L. casei remained more or less consistent throughout shelf-life which could be confirmed
in this study.
There is no clear trend between samples with different storage times in fermentation tank and buffer
tank. The changes in cell count are quite small between samples, but worth noticing is a decline in
cell count for B. lactis for F3 samples at day 3 as well as day 16. B. lactis is known for its sensitivity
towards acidic environments and the low pH values for F3 samples could be an explanation to this
loss in viability. However, the sudden increase in viability for B. lactis at day 28 is unexplained.
Although small changes, the viability for B. lactis seems to decrease as storage time in fermentation
tank increases. No effect could be detected for storage time in buffer tank. When studying the
viability of L. casei at day 16 it appears to decrease significantly with storage time both in
fermentation tank and buffer tank. This result could be misleading; there is a trend but the changes
in cell count are very small.
The result from the sensory evaluations causes trouble. Samples from the longest storage time in
buffer tank, F3, were the samples that got the highest average scores from the sensory panel. These
samples had the lowest pH values and had the most comments about “somewhat too strong acidity”.
F3 samples also had most comments about bitter taste. It is therefore strange that these samples
were the ones with the highest scores from the sensory evaluations.
All samples except F2:B2 and F2:B3 are approved according to product description, i.e. the average
value of the samples is between 6-8 points. F2:B2 had 5 points on appearance with comments on
graininess and sandiness. F2:B3 had 5 points on texture with comments about “too thin hand and
mouth feel” as well as “grainy”. Overall, many samples had comments on graininess and sandy

Chapter 5 - Discussion
30
appearance. One explanation to this could be the quite high fermentation temperature used, 43.0°C,
as described in section 2.6.1. F3 had fewer comments on graininess, which could explain the higher
scores for appearance and texture. Most samples also had comments about slimy/long texture, in
particular samples from F1 and F2 at day 9. They also had comments about week yoghurt aroma.
Slimy and sandy textures as well as weak yoghurt aroma are defects coupled with the presence of
Bifidobacteria. The cell count for BB-12® is highest at day 9 for F1 and F2 which could be causing
these defects.
One can, based on the comments on the strength of the acid taste, see a small tendency that
samples from F1 and F2 becomes more acid the longer time they spend in buffer tank. This trend is
not as apparent for F3 samples. It seems as small taste details and differences have been rather
difficult to identify during these sensory evaluations. It should be noted that the panelists expressed
that they felt unsure about how the product should taste. Another factor that could affect the
sensory ability of the panelists is that several acidic samples in a row could temporarily “wear out”
their tasting ability and cause a less sharp sensory detecting ability. Furthermore, microbiological
analysis at day 16 and 28 showed growth of yeast. This could explain the slight “unfresh” taste that
many panelists experienced and could mask other flavors, thereby making small taste differences
hard to identify.
At day 9 all samples had comments regarding thin mouth and hand feel. Even though samples
evaluated at day 16 had high viscosity values, a few panelists gave comments regarding thin mouth
and hand feel. For samples from F3 at day 28, comments about both too thick hand-feel and too thin
hand-feel appeared which confirms the expressed uncertainty of how the product should be.

Chapter 6 -Conclusions
31
Chapter 6
Conclusions
• Because of the production of organic acids such as lactic acid and acetic acid during
production, pH of a fermented product decreases with both storage time in fermentation
tank and storage time in buffer tank. Storage time in fermentation tank is the strongest
affecting factor.
• Viscosity seems to increase with long storage times in fermentation tank and decrease with
long storage times in buffer tank.
• Levels of acetic acid were found to be quite high in most samples which could be causing off-
flavors. However, no differences could be found between samples with different storage
times.
• The microbial viability of all three bacteria could be ensured throughout the entire shelf-life
for all samples. A decrease in cell numbers of BB-12® for samples with the longest storage
time in fermentation tank (F3) could be detected at day 3 and 16. This could be due to the
higher acidity in these samples and BB-12® known sensitivity for acidic environment. Long
storage times in fermentation tank affect the viability for BB-12 ® negatively.
• Sensory analysis showed that the product was considered grainy/sandy and slimy. These
characteristics can often be related to high levels of BB-12®. The graininess could also be
caused by the high fermentation temperature used.
• The experiment done in this study could not be used as a base for recommendations of
maximum storage times in fermentation tank and buffer tank. All measurement data was
within the set specification limits, even at day 28. This could be due to a contamination
problem which caused growth of yeast. Consequently, no evaluation on effects on
production planning and production economics could be done. Suggestions from the
literature state that to ensure good product quality, storage time in fermentation tank
should not exceed 30 minutes.
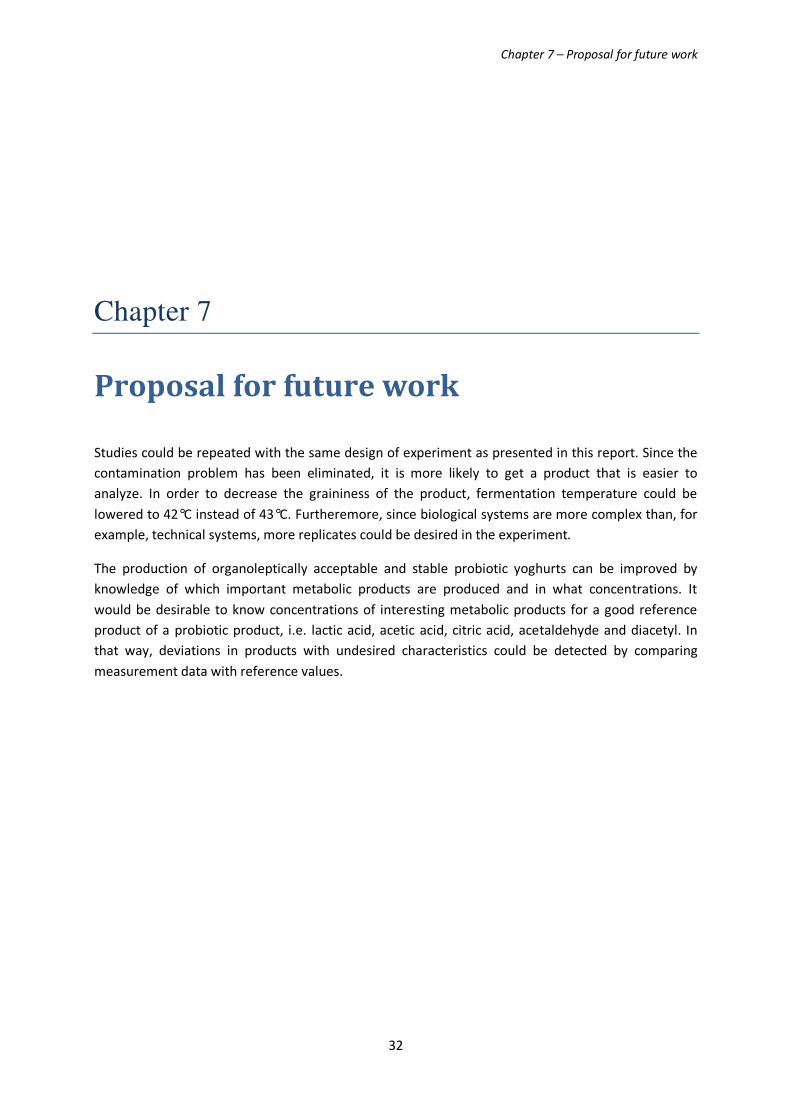
Chapter 7 – Proposal for future work
32
Chapter 7
Proposal for future work
Studies could be repeated with the same design of experiment as presented in this report. Since the
contamination problem has been eliminated, it is more likely to get a product that is easier to
analyze. In order to decrease the graininess of the product, fermentation temperature could be
lowered to 42°C instead of 43°C. Furtheremore, since biological systems are more complex than, for
example, technical systems, more replicates could be desired in the experiment.
The production of organoleptically acceptable and stable probiotic yoghurts can be improved by
knowledge of which important metabolic products are produced and in what concentrations. It
would be desirable to know concentrations of interesting metabolic products for a good reference
product of a probiotic product, i.e. lactic acid, acetic acid, citric acid, acetaldehyde and diacetyl. In
that way, deviations in products with undesired characteristics could be detected by comparing
measurement data with reference values.

References
33
8 References
Amrouche, T, Y Boutin, G Prioult, and I Fliss. "Effects of bifidobacterial cytoplasm, cell wall and exopolysaccharide on mouse
lymphocyte proliferation and cytokine production." International Dairy Journal 16 (2006): 70-80.
Arla Foods. Arla Foods. 2008. http://www.arlafoods.se/om-foretaget/vad-ar-arla/ (accessed December 7, 2008).
Avanza Bank. "Avanza." 2008. http://www.avanza.se/aza/press/press_article.jsp?article=43712 (accessed November 7,
2008).
Beshkova, B, E Simova, G Frengova, and Z Simov. "Production of flavour compounds by yogurt starter cultures." Journal of
Industrial Microbiology and Biotechnology, 1998: 180-186.
Brandt Marie Ditte., Sensory technologist, Chr. Hansen A/S. Hørsholm, Denmark, Personal communication, January 2009.
Bylund, Gösta. Dairy processing handbook. Lund: Tetra Pak Processing Systems AB, 1995.
Christian Hansen A/S. Christian Hansen. 2008. www.chr-hansen.com (accessed October 29, 2008).
Dong, Hyun Sinn, et al. "Therapeuthic Effect of Lactubacillus acidophilus - SDC 2012, 2013 in Patients with Irretable Bowel
Syndrome." Digestive Diseases and Science, 2008: 2714-2718.
Donkor, O N, A Henriksson, T Vasiljevic, and N P Shah. "Effect of acidification on the activity of probiotics in yoghurt during
cold storage." International Dairy Journal, 2006: 1181-1189.
European Bioinformatics Institute. EBI. 2008. http://srs.ebi.ac.uk/srsbin/cgi-bin/wgetz?-e+[TAXONOMY:1579]+-newId
(accessed September 17, 2008).
Geurts, T J, P Walstra, A Noomen, A Jellema, and M.A.J.S van Boekel. Dairy Technology - Principles of Milk Properties and
Processing. New York: Marcel Dekker, Inc., 1999.
Gilmour, A, and M T Rowe. "Mico-Organisms Associated with Milk." In Dairy Microbiology, by R K Robinson, 35-75. Great
Yarmouth: Applied Science Publisher, 1981.
Hoovers Inc. Hoover. 2008. http://www.hoovers.com/arla-foods/--ID__105475--/free-co-factsheet.xhtml (accessed
November 11, 2008).
Hubbard, Merton R. Statistical Quality Control for the Food Industry. New York: Chapman & Hall, 1996.
ICMSF. "Milk and dairy products." In Microorganisms in Foods 6, 521-576. London: Blackie Academic & Professional, 1998.
Juntunen, M, P V Kirjavainen, A C Ouwehand, S J Salminen, and E Isolauri. “Adherence of Probiotic Bacteria to Human
Intestinal Mucus in Healthy Infants and during Rotavirus Infection.” Clinical and Diagnostic Laboratory Immunology, 2001:
293-296.
Jørgensen, P., Danisco A/S. Copenhagen, Denmark, Personal communication, November 2008.
Kailasapathy, K. "Survival of free and encapsulated probiotic bacteria and their effect on the sensory properties of yoghurt."
Elsevier Ltd, 2006: 1221-1227.
Larsson, A., Livsmedelsverket, Personal communication, October 2008.
Lucey, John A. "Cultured dairy products: an owerview of their gelation and texture properties." International Journal of
Dairy Technology, 2004: 77-84.

References
34
Lucey, John A. "The relationship between rheological parameters and whey separation in milk gels." Food Hydrocolloids,
2001: 603-608.
Lund, Barbara M, A C Baird-Parker, and Grahame W Gould. The Microbiological Safety and Quality of Food. Gaithersburg:
Aspen Publishers, Inc., 1999.
Montgomery, Douglas C. Design and Analysis of Experiments. John Wiley & Sons, Inc, 2005.
Ohlson, Kajsa, Stina Björneholm, Rangne Fondén, and Ulla Svensson. "Lactubacillus F19 - A Probiotic Strain Suitable for
Consumer Products." Microbial Ecology in Health and Disease, 2002: 27-32.
Salminen, Seppo, and Atte von Wright. Lactic Acid Bacteria. New York: Marcel Dekker, Inc, 1998.
Samona, A, R K Robinson, and S Marakis. "Acid production by bifidobacteria and yoghurt bacteria during fermentation and
storage of milk." Food Microbiology, 1996: 275-280.
Soukoulis, C, P Panagiotidis, R Koureli, and C Tzia. "Industrial Yoghurt Manufacture: Monotoring of Fermentation Process
and Improvement of Final Product Quality." J. Dairy Science, 2007: 2641-2654.
Sullivan, Åsa, Lisbeth Barkholt, and Carl Erik Nord. "Lactobacillus acidophilus, Bifidobacterium lactis and Lactobacillus F19
prevent antibiotic-associated ecological disturbance of Bacteroides fragilis in the intestine." Journal of Antimicrobial
Chemotherapy, 2003: 308-311.
Svensson, U., Docent in microbiology, interview by Svensk mässinformation (2008).
Talwalkar, Akshat, Craig W Miller, Kaila Kailasapathy, and Minh H Nguyen. "Effect of packaging materials and dissolved
oxygen on the survival of probiotic bacteria in yoghurt." International Journal of Food Science and Technology, 2004: 605-
611.
Torre, La L, A Y Tamime, and D D Muir. "Rheology and sensory profiling of set-type fermented milks made with dirrerent
commercial probiotic and yoghurt starter cultures." International Journal of Dairy Technology, 2003: 163-170.
Wageningen University. Food-Info. 2008. www.food-info.net/uk/ff/probiotics (accessed September 16, 2008).
Wahl, Pia. "Analysrapport Sensorik." Stockholm: Arla Foods Innovation, January 6, 2008.
Xu, Sa, Terri D Boylston, and Bonita A Glatz. "Effect of Inoculation Level of Lactobacillus rhamnosus and Yoghurt Culture on
Conjugated Linoleic Acid Content and Quality Attributes of Fermented Milk Products." Journal of Food Science, 2006: 275-
280.
Øhrstrøm Runge, M., Specialist Application Manager, Chr. Hansen A/S." Hørsholm, Denmark, Personal communication,
September 2008.
Østlie, Hilde M, Janneke Treimo, and Judith A Narvhus. "Effect of temperature on growth and metabolism of probiotic
bacteria in milk." International Dairy Journal, 2005: 989-997.
Østlie, Hilde M, Merete H Helland, and Judith A Narvhus. "Growth and metabolism of selected strains of probiotic bacteria
in milk." International Journal of Food Microbiology, 2003: 17-27.
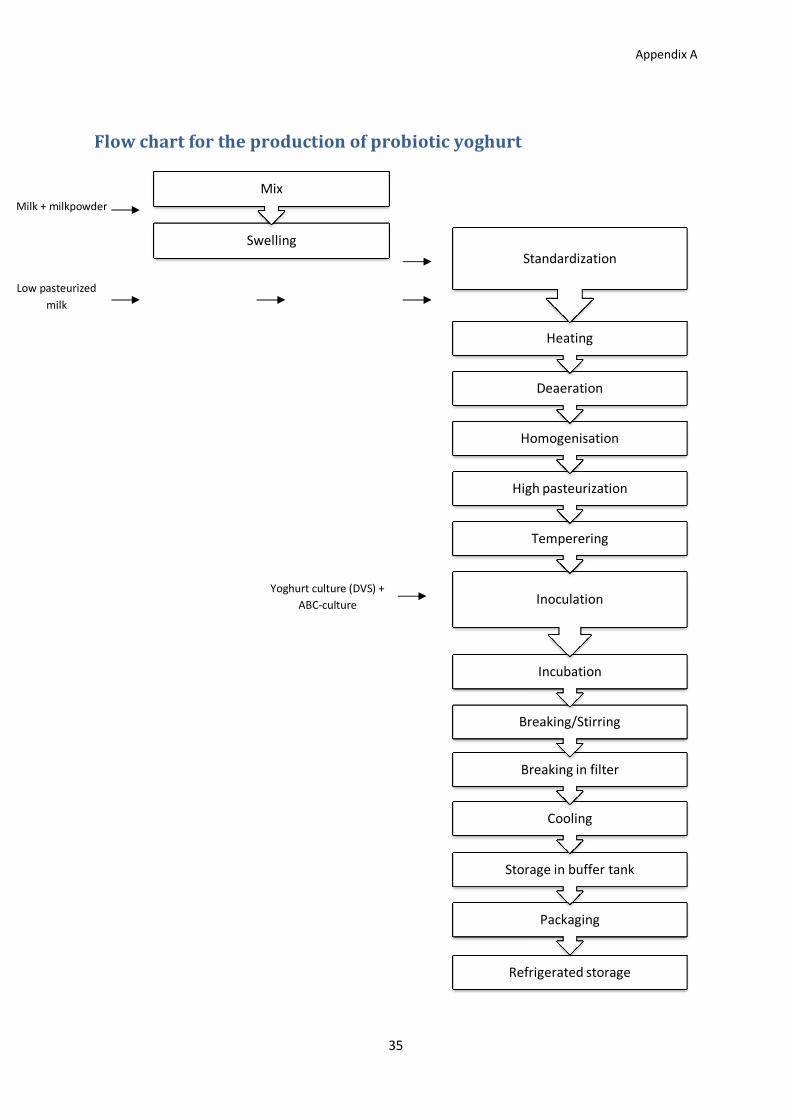
Appendix A
35
Flow chart for the production of probiotic yoghurt
Refrigerated storage
Packaging
Storage in buffer tank
Cooling
Breaking in filter
Breaking/Stirring
Incubation
Inoculation
Temperering
High pasteurization
Homogenisation
Deaeration
Heating
StandardizationSwelling
MixMilk + milkpowder
Low pasteurized
milk
Yoghurt culture (DVS) +
ABC-culture

Appendix B
36
Measurement data
Measurement at fresh product, 3 days after production Exp
Name
Viscosity
(Pa·s)
pH Acetic
acid (g/L)
Viability (cfu/g)1
LA-5 BB-12 F19
F1:B1 5,21 4,42 0,911 1,17E+08 3,77E+08 2,20E+08
F1:B1 R 4,13 4,41 0,973 1,05E+08 3,07E+08 2,03E+08
F1:B2 4,57 4,40 0,933 9,40E+07 3,53E+08 1,60E+08
F1:B3 4,28 4,35 0,944 1,06E+08 4,13E+08 2,03E+08
F2:B1 5,02 4,33 1,027 8,40E+07 3,67E+08 1,07E+08
F2:B2 5,16 4,30 1,087 1,17E+08 3,57E+08 1,07E+08
F2:B2 R 4,87 4,30 1,065 1,21E+08 2,35E+08 1,30E+08
F2:B3 4,66 4,26 1,095 1,15E+08 3,40E+08 1,37E+08
F3:B1 5,53 4,31 1,019 1,09E+08 1,93E+08 1,30E+08
F3:B2 5,07 4,29 1,078 1,13E+08 1,70E+08 1,33E+08
F3:B3 4,98 4,27 0,522 1,16E+08 1,77E+08 1,27E+08
F3:B3 R 4,84 4,27 0,585 1,27E+08 1,93E+08 1,40E+08 1
Average of three samples
Measurements 9 days after production Exp
Name
Stability
(%)3
Appearance2 Texture
2 Taste &
Aroma2
F1:B1 0,85 6,0 5,9 6,2
F1:B1 R 1,72 6,1 6,0 5,9
F1:B2 1,50 6,6 5,8 6,4
F1:B3 2,02 6,2 5,9 6,2
F2:B1 1,39 6,3 6,9 6,2
F2:B2 1,58 6,2 6,3 6,3
F2:B2 R 1,11 6,8 6,4 6,4
F2:B3 2,29 7,2 6,6 6,4
F3:B1 0,69 7,6 7,2 7,2
F3:B2 0,80 7,4 7,0 6,6
F3:B3 0,96 7,0 6,8 7,0
F3:B3 R 1,31 6,8 6,8 7,0 2 Average of the score from 9 panelists
3 Average of five samples
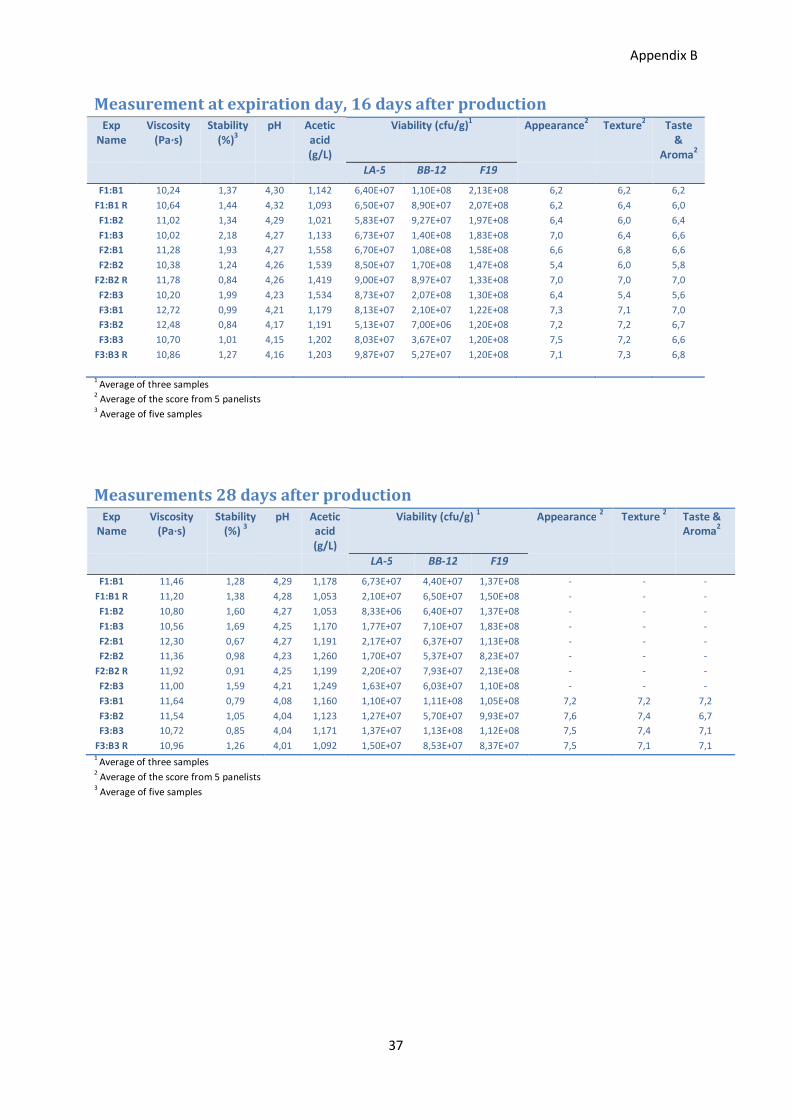
Appendix B
37
Measurement at expiration day, 16 days after production Exp
Name
Viscosity
(Pa·s)
Stability
(%)3
pH Acetic
acid
(g/L)
Viability (cfu/g)1
Appearance2
Texture2
Taste
&
Aroma2
LA-5 BB-12 F19 F1:B1 10,24 1,37 4,30 1,142 6,40E+07 1,10E+08 2,13E+08 6,2 6,2 6,2
F1:B1 R 10,64 1,44 4,32 1,093 6,50E+07 8,90E+07 2,07E+08 6,2 6,4 6,0
F1:B2 11,02 1,34 4,29 1,021 5,83E+07 9,27E+07 1,97E+08 6,4 6,0 6,4
F1:B3 10,02 2,18 4,27 1,133 6,73E+07 1,40E+08 1,83E+08 7,0 6,4 6,6
F2:B1 11,28 1,93 4,27 1,558 6,70E+07 1,08E+08 1,58E+08 6,6 6,8 6,6
F2:B2 10,38 1,24 4,26 1,539 8,50E+07 1,70E+08 1,47E+08 5,4 6,0 5,8
F2:B2 R 11,78 0,84 4,26 1,419 9,00E+07 8,97E+07 1,33E+08 7,0 7,0 7,0
F2:B3 10,20 1,99 4,23 1,534 8,73E+07 2,07E+08 1,30E+08 6,4 5,4 5,6
F3:B1 12,72 0,99 4,21 1,179 8,13E+07 2,10E+07 1,22E+08 7,3 7,1 7,0
F3:B2 12,48 0,84 4,17 1,191 5,13E+07 7,00E+06 1,20E+08 7,2 7,2 6,7
F3:B3 10,70 1,01 4,15 1,202 8,03E+07 3,67E+07 1,20E+08 7,5 7,2 6,6
F3:B3 R 10,86 1,27 4,16 1,203 9,87E+07 5,27E+07 1,20E+08 7,1 7,3 6,8
1 Average of three samples
2 Average of the score from 5 panelists
3 Average of five samples
Measurements 28 days after production Exp
Name
Viscosity
(Pa·s)
Stability
(%) 3
pH Acetic
acid
(g/L)
Viability (cfu/g) 1
Appearance 2
Texture 2
Taste &
Aroma2
LA-5 BB-12 F19 F1:B1 11,46 1,28 4,29 1,178 6,73E+07 4,40E+07 1,37E+08 - - -
F1:B1 R 11,20 1,38 4,28 1,053 2,10E+07 6,50E+07 1,50E+08 - - -
F1:B2 10,80 1,60 4,27 1,053 8,33E+06 6,40E+07 1,37E+08 - - -
F1:B3 10,56 1,69 4,25 1,170 1,77E+07 7,10E+07 1,83E+08 - - -
F2:B1 12,30 0,67 4,27 1,191 2,17E+07 6,37E+07 1,13E+08 - - -
F2:B2 11,36 0,98 4,23 1,260 1,70E+07 5,37E+07 8,23E+07 - - -
F2:B2 R 11,92 0,91 4,25 1,199 2,20E+07 7,93E+07 2,13E+08 - - -
F2:B3 11,00 1,59 4,21 1,249 1,63E+07 6,03E+07 1,10E+08 - - -
F3:B1 11,64 0,79 4,08 1,160 1,10E+07 1,11E+08 1,05E+08 7,2 7,2 7,2
F3:B2 11,54 1,05 4,04 1,123 1,27E+07 5,70E+07 9,93E+07 7,6 7,4 6,7
F3:B3 10,72 0,85 4,04 1,171 1,37E+07 1,13E+08 1,12E+08 7,5 7,4 7,1
F3:B3 R 10,96 1,26 4,01 1,092 1,50E+07 8,53E+07 8,37E+07 7,5 7,1 7,1 1
Average of three samples 2 Average of the score from 5 panelists
3 Average of five samples