Effects on anthocyanin concentration in...
42
Effects of heat treatment and additives on the anthocyanin content in blackcurrants and its relation to colour and texture Master of Science Thesis in the Master Degree Programme, Biotechnology DANIEL SVENSSON Department of Chemical and Biological Engineering Division of Food Science Chalmers University of Technology Göteborg, Sweden 2010
Transcript of Effects on anthocyanin concentration in...

Effects of heat treatment and additives on the anthocyanin content in
blackcurrants and its relation to colour and texture Master of Science Thesis in the Master Degree Programme, Biotechnology
DANIEL SVENSSON
Department of Chemical and Biological Engineering Division of Food Science Chalmers University of Technology Göteborg, Sweden 2010

2
Effects of heat treatment and additives on the anthocyanin content in
blackcurrants and its relation to colour and texture © DANIEL SVENSSON, 2010 This Master of Science thesis was performed within the master degree programme of Biotechnology, in the track Food & Health, Chalmers University of Technology, in cooperation with SIK – the Swedish Institute for Food and Biotechnology. Supervisors: Camilla Öhgren and Maud Langton SIK Examiner: Marie Alminger, Chalmers University of Technology SIK – the Swedish Institute for Food and Biotechnology Department of Structure and Material Design Box 5401 SE-402 29 Göteborg Sweden Telephone: +46 (0) 10 – 516 66 00 Chalmers University of Technology Department of Chemical and Biological Engineering / Food Science SE-412 96 Göteborg Sweden Telephone: +46 (0) 31 – 772 10 00 Printed by: Department of Chemical and Biological Engineering / Food Science, Chalmers University of Technology Göteborg, Sweden 2010

3
Abstract
Over the last decade there has been a growing interest in the potential health benefits from
eating a diet rich in fruit and berries containing large amounts flavonoids. Among these the
anthocyanins have been given a lot of attention and studies indicate that they might help
prevent tumour growth and urinary tract infections to mention a few of the potential benefits.
In studies on model systems, anthocyanins have been proven to be degraded by heat, oxygen
access, pH increases and addition of sugar.
In this study the focus has been shifted to the effects of heat and other common processing
parameters on anthocyanins in a blackcurrant mash, which is more resembling to real
products. Anthocyanins were extracted from blackcurrants by using acidified methanol
solution. UV-spectrophotometry was used to measure the anthocyanin concentrations. The
effect on colour and texture was also investigated by colourimetry with a hand held
coulormeter and shear rate ramp tests with a rheometer respectively.
The results indicate that it is possible to predict anthocyanin degradation in blackcurrant mash
induced by heating with a simple exponential decay model. Additionally it was concluded that
the pH level is a major factor influencing the degradation speed. Furthermore, an increase in
the glucose and ascorbic acid content decrease and increase the anthocyanin degradation
respectively. It was also concluded that the colour is affected by the anthocyanin degradation
but no clear correlation was found. Eventually no correlation between anthocyanin content
and texture was found.

4
Sammanfattning
Mat och hälsa är ständigt aktuella ämnen i människors vardagsliv. En snabb koll på några av
de stora dags- och kvällstidningarnas hemsidor eller ett besök vid tidningsstället i en
närliggande mataffär bekräftar detta. Den nuvarande trenden går också mot mer gammaldags
produkter som uppfattas som ett hälsosamt alternativ till de processade och bearbetade
livsmedlen från industrin. Bär och frukt tillhör de livsmedel som på senare tid har blivit mer
och mer uppmärksammade för dess påstådda hälsofördelar och association till vad som
uppfattas som en sund livsstil.
Studier under de senaste decennierna har därför försökt verifiera dessa påståenden och
undersöka vilka ämnen i bär och frukter som ger den positiva hälsoeffekten. Man har funnit
att ämnesgruppen antocyaniner, som ger de flesta bär och frukter dess blåa och röda färger,
kan ligga bakom denna effekt. Studier har visat att antocyaniner kan hjälpa mot bland annat
urinvägsinfektioner, hjärt- kärlsjukdomar och hämma tumörtillväxt. Andra studier på
modellsystem har dock visat att anthocyaninerna bryts ner av behandlingar som är vanliga
inom livsmedelstillverkning såsom uppvärmning, tillgång till syre och tillsättning av
askorbinsyra. Den här studien har därför ägnats åt att studera huruvida detta sker även i mer
matlika produkter såsom svartvinbärsmos och puré och undersökt hur fort detta sker. Då
antocyaninerna är det som ger upphov till de blå, lila och röda färgerna i svarta vinbär och
blåbär har även påverkan på färgen undersökt och om den går att korrelera till
antocyaninhalten. Slutligen har påverkan av värme och ett antal ingredienser på konsistensen
undersökts då svarta vinbär innehåller höga halter av pektin.
Värmebehandling av svartvinbärsmos visade att antocyaninerna sönderfaller exponentiellt och
att temperaturen var den viktigaste faktorn. Jämförelser mellan svarta vinbär och blåbär visade
att vid likvärdiga förhållanden minskar halten antocyanin i blåbär fortare än i svarta vinbär.
Detta förmodligen beroende på att de olika antocyaninerna är olika värmetåliga. När
bärsorterna blandades så bröts antocyaninerna ner lika fort som de gjorde när de undersöktes
var för sig.
Ytterligare experiment visade att nedbrytningshastigheten ökar med ökande pH i bärmoset
och att högre halt av askorbinsyra leder till ökad nedbrytning. Citronsyra hade ingen effekt åt
något håll på antocyaninhalten. Vidare visade sig glukos ha viss nedbrytande effekt vid låga
halter (4% w/w) men en skyddande effekt vid 50% w/w.
I färgförsöken så minskade mycket riktigt färgintensiteten med minskad antocyaninhalt i
samma batch. När två olika batcher av svarta vinbär jämfördes visade det sig dock att ingen
allmän korrelation kunde fastställas.
I de reologiska studierna konstaterades att det fanns skillnader i konsistens mellan de olika
batcherna men att ingen korrelation fanns till antocyaninhalten.

5
Table of Contents Introduction ............................................................................................................................ 6
Aim and purpose ................................................................................................................ 6
Theoretical Background ......................................................................................................... 7
Blackcurrant ....................................................................................................................... 7
Bilberry ............................................................................................................................... 7
Anthocyanins ...................................................................................................................... 8
Spectrophotometry ........................................................................................................... 11
Colourmetry ...................................................................................................................... 12
Rheology .......................................................................................................................... 12
Materials and Methods ......................................................................................................... 13
Berries .............................................................................................................................. 13
Preparation of berry mash ................................................................................................ 13
Thermal treatments ........................................................................................................... 14
Extraction of anthocyanins ............................................................................................... 15
Measurement of anthocyanin content in extracts ............................................................. 15
Calculation of anthocyanin content in the berries ............................................................ 15
Effects of pH-alterations, glucose and organic acid addition ........................................... 16
Effects of variations in oxygen supply ............................................................................. 16
Colour Measurements ....................................................................................................... 16
Rheology .......................................................................................................................... 17
Data analysis ..................................................................................................................... 17
Results and Discussion ......................................................................................................... 18
Effects of heat treatments on anthocyanin content in blackcurrant mash ........................ 18
Effects of glucose and organic acid addition .................................................................... 24
Effects of variations in oxygen supply and separation of skin and pulp .......................... 26
Effects of pH alterations ................................................................................................... 27
Bilberries and Blackcurrant/Bilberry mixes ..................................................................... 28
Colour measurements ....................................................................................................... 29
Rheological measurements ............................................................................................... 34
Conclusions and future work ................................................................................................ 37
Acknowledgements .............................................................................................................. 37
References ............................................................................................................................ 38
Appendix .............................................................................................................................. 41
Appendix 1 ....................................................................................................................... 41
Appendix 2 ....................................................................................................................... 42

6
Introduction
Food and health are currently hot topics in peoples’ everyday life. A quick glance at the
websites of some of the major newspapers or a visit to the magazine rack of a nearby food
store quickly confirms this. The current trend also calls for more old-fashioned products
which are perceived as a healthy alternative to the processed food from the industry. Berries
and fruits are among those food stuffs which are getting more and more attention for their
claimed health benefits and associations to a healthy life style in general.
Simultaneously there has been a lot of research performed over the last decade to verify these
claims, beyond already proven health benefits such as the prevention of scurvy, to identify
compounds responsible for the observed benefits and their physiological effects on the human
body. Prevention of Alzheimer’s disease, lower prevalence of cardiovascular diseases and
reduction of tumour growth are some of the suggested health benefits that have been
described (Bell & Gochenaur 2006, Grace et al. 2009, Ping-Hsiao et al. 2009).
Among the flavonoids the subgroup anthocyanins have received increasing attention in some
of the reported studies. They are found in fruits and berries already regularly consumed by
humans such as strawberries, bilberries and red and blue grapes, where they are responsible
for most of the (non-green) colour present. From a dietary point of view this means that it is
possible to increase the intake of anthocyanins without interfering with peoples’ everyday
eating habits. But while there have been numerous studies made on model systems on how
anthocyanins is affected by different factors such as pH and heating, few studies have been
made on the berries or processed products which presents a much more complex system
(Rubinskiene et al. 2005, Castañeda-Ovando et al. 2009, Patras et al. 2009).
Aim and purpose
The aim of this master thesis was to investigate how the anthocyanin content in blackcurrants
is affected by different chemical and physical factors as well as common ingredients in
blackcurrant products. Investigations of how some of these factors influence the colour and
texture of the berries have also been made and the results have been compared to the
anthocyanin contents of the berries in search for correlations.

7
Theoretical Background
Blackcurrant
Blackcurrant (Ribes nigrum) is a bush that can grow up to 1.5 meters tall. It has 5-10cm long
green leaves and the fruit is a very dark blue and purple berry, hence the name blackcurrant. It
is native to northern Europe and northern and central Asia and is at present commonly
cultivated in cold climates without difficulties. In the wild it prefers to grow along beaches
and in moist forests or groves. It is believed to first have been cultivated in the region around
the Baltic Sea in the late 16th
century and have since became one of the most widespread
berries in the region. 450-600ha (15-20%) of the area used for cultivation of berries in
Sweden each year is used for blackcurrants, while strawberries as a comparison are grown on
up to 75% of the area (GRO 2009). The leaves can be used to make herbal tea or used in
pickled cucumber but it is the berries that are the main reason for growing the bushes. The
berries are rich in pro-vitamin A and especially vitamin C. Blackcurrant also has high levels
of other bioactive compounds like anthocyanins which are discussed in detail in a separate
section. (Encyclopaedia Britannica 2009, Nationalencyklopedin 2009)
Figure 1 A blackcurrant twig with leaves and berries
Blackcurrants grown in Sweden are mainly used for jelly, juice and jam. The high natural
pectin content together with a low pH in the berries helps explain why it readily gelatinise
when high amounts of sugar is added in the jelly production. The rather stringent taste is
stated to be the main reason for its near total absence in traditional fruit and berry flavoured
products like yoghurt and ice cream. In other countries, like e.g. United Kingdom, it is also
used as a pie ingredient, canned fruit or in alcoholic drinks (Hollands et al. 2008).
Bilberry
The bilberry bush (Vaccinium myrtillus) is a small bush that grows in Europe and Asia. It
grows on acidic soil and thrives in the shades in the vast forests of northern Europe. The bush
is usually not higher than 40cm and the berries are about 1cm in diameter. The plant is not
grown commercially since the berries are fragile and need to be handled with care. In Sweden
the plant is estimated to cover 15-20% of the land which helps explaining why the blue berries
are nevertheless common in jams, pie fillings and drinks. (Nationalencyklopedin 2010)

8
Anthocyanins
Chemistry Anthocyanins are a group of compounds that belongs to the flavonoids which means that they
are based on the flavan nucleus. Anthocyanins consist of an anthocyanidin group (fig 2)
linked to one or more glycosides through an oxygen atom. More than 20 different
anthocyanidins exist but the most common ones are pelargonidin, cyanidin, peonidin,
delphinidin, petunidin and malvidinin (Castañeda-Ovando et al. 2009). All of them share the
same basic 6C-3C-6C structure shown in figure 2 and the difference is in the substituents on
the carbons R3’
-R5’
, R3 and R
5’-R
7’. These are normally either hydrogen or hydroxyl groups
but can also be methyl groups linked through an oxygen atom.
Figure 2Basic structure of anthocyanidin
The anthocyanidins bind to different glycosides through the oxygen atom normally on the R3
or the R5 but the R
7 carbon are also utilised in some cases. Di-glycosides usually bind on the
R3 and R
5 carbons. A large number of sugars can be attached to the anthocyanidins.
Commonly occurring are glucose and rutinose but galactose, arabinose and sophorose are also
often found. Since a number of modifications on the sugars can occur such as esterification of
the sugars with coumaric or caffeic acid but also acetylations of the sugars, the number of
anthocyanins that so far are known are in the region of 600. (Coultate, 2002, Yue & Xu,
2008)
Formation Anthocyanins are formed from phenylalanine, produced through the shikimate pathway, and
malonyl-CoA formed from acetyl-CoA. These two are coupled together ezymatically to form
a chalcone which continues to be transformed and isomerised enzymatically in 7 steps to form
the resulting anthocyanin with the last step being the addition of the sugar substituent on the
anthocyanidin molecule. This pathway includes the formation of the flavanone molecule as
the precursor for the different anthocyanidins and most of the intermediates are used for
production of other metabolites as well, all of this enzymatically regulated. (Winefield 2009)
Occurrence and function in nature
The anthocyanins are produced in nature by a large number of different plants. These range
from trees and flowers to carnivorous plants, vegetables and berry carrying bushes. The
anthocyanins have a number of specific functions in the plants. One important purpose is to
give blue, violet and red colours to the plant as it does in bilberries, strawberries and grapes
for instance. The colours are used to attract pollinators to flowers, to signal that the fruits have

9
ripened and are ready to eat to spread the seeds or as a defence mechanism against insects to
name a few depending on intensity and pattern of the colours (Hamilton & Brown 2001,
Winefield 2009).
Anthocyanins have been shown to protect green leaves that are exposed to bright light and
low temperatures, such as northern Swedish berries, by preventing photoinhibition of the
chlorophyll without interfering with the growth (Pietrini et al. 2002). They have also been
suggested to transport monosaccharides and act as osmotic regulators during drought and low
temperatures which could help explain their presence in roots and other tissues not directly
exposed to light (Chalker-Scott 1999).
Another important function of the anthocyanins is to act as free radical scavengers. Free
radicals, or Reactive Oxidative Species (ROS) as they nowadays are called to include nitrogen
containing forms, are produced naturally in chloroplasts in plants during photosynthesis and
mitochondria during respiration and may cause damage to cell membranes or the DNA if left
uncontrolled. The anthocyanins are able to take care of these in a wide number of ways thanks
to their ability to both donate and accept electrons, to stabilise and delocalise unpaired
electrons and by chelating metal ions (Winefield 2009)
The colour of the anthocyanins in nature depends on a number of different factors.
Differences in pH, co-pigmentation and interactions with metal ions are the factors that
mainly determine the colour of the plants. At pH levels around 1 the free flavylium cation
(figure 1) is red while at higher pH levels the colour will change to purple and blue colours
during transition to the quinoidal base and the subsequent ionised form of it. Higher pH will
also lead to the formation of the colourless carbinol pseudo-base and the subsequent chalcone
molecule which have a pale yellow colour. All forms except the blue ionised quinoidal base
exist in equilibrium, with the flavylium cation as an intermediate, between pH 3-6. This is the
normal pH in berry vacuoles so this alone cannot explain the colour of for instance dark blue
berries (Coultate 2002). At this pH the co-pigmentation becomes important. The co-
pigmentation occurs when compounds interact with the anthocyanin molecule and stabilise
the flavylium cation and quinoidal base forms and thereby preventing the colourless carbinols
from forming and thus increasing both the red and violet/blue colours of a given concentration
of anthocyanins (Cooper-Driver 2001). Examples of such compounds can be other
anthocyanins, other flavonols, organic acids, glycosides and nucleotides (Castañeda-Ovando
et al. 2009). A special case of co-pigmentation is the metal ion complexation which many of
the blue or bright blue colours in nature occur from. In these cases a high pH is not needed but
it can be in the range of 4-6 (Yoshida et al.2006).
Degradation Anthocyanins have been shown to be degraded primarily by processing or storage at elevated
temperatures (Rubienskene et al.2005, Patras et al. 2009) but also at room temperature during
storage though at a slower rate (Hager et al. 2008). Harbourne et al. (2008) showed that the
degradation of anthocyanin in blackcurrant juice can be calculated according to the formula:
(Equation 1)
Nt,T is the amount of anthocyanin after the time t at temperature T,
N0 is the intial amount anthocyanin k is the degradation constant dependent at the temperature
T and t is the time the anthocyanin was held at the temperature T.
This allows the degradation constant to be expressed as:
k= (Equation 2).

10
The mechanism for this degradation is not fully comprehended but it has been suggested that
it is caused by hydrolysis of the sugar-aglycon bond, opening of the purylium ring or
formation of a chalcone. At lower pH other bonds become vulnerable to hydrolysis as well
e.g. the bond in disaccharides in the sugar moiety (Patras et al. 2009). Kader et al. (2001)
have shown in a series of experiments that polyphenol oxidase degrades anthocyanins as well
by oxidising chlorogenic acid to chlorogenoquinone which reacts with the anthocyanins and
form brown condensation products. They also showed that other o-quinones can have the
same effect but on different anthocyanins so the combination of organic acid and anthocyanin
is important. Another important finding was that polyphenol oxidase could not oxidise the
anthocyanins without the presence of an organic acid nor in oxygen free environments so all
these conditions must be met for the reaction to take place Kader et al. (2001). Ascorbic acid
have also been shown to degrade anthocyanins at room temperature by a condensation
reaction which lowers the content of ascorbic acid and anthocyanin at a 1:1 ratio (De Rosso &
Mercadante 2007)
Anthocyanins in blackcurrant and bilberries Each plant consists of several different anthocyanins but the composition is to some extent
specific for each species. In blackcurrants Cyanidin-3-glucoside, cyanidin-3-rutinoside,
delphinidin-3-glucoside and delphinidin-3-rutinoside constitute the main part of the
anthocyanin content whereas in strawberries and raspberries pelargonidins are more common
(Coultate 2002, Rubienskene et al. 2005). In bilberries 15 different anthocyanins have been
found and only cyanidin-3-glucoside and deplhinidin-3-glucoside are found in both
blackcurrants and bilberries (Lätti et al. 2008).
The anthocyanins are situated in the seeds, vacuoles in the pulp and the skin but it almost
absent in the pulp itself. Their function in blackcurrant and bilberries does not differentiate
from the function described above in plants in general (Lu & Foo, 2003, Coultate 2002).
Benefits of anthocyanins for humans Anthocyanins have been shown to have a number of potential health benefits for humans.
Studies have shown that they can help to prevent tumor growth when induced by chemicals,
reduce growth and spreading of tumor that have been injected in mice (Ding et al. 2006).
Further studies have shown that they can help preventing cardiovascular diseases like
atherosclerosis (Bell & Gochenaur 2006). They have also been proven to have anti-diabetic
properties (Grace et al. 2009) and protect against Alzheimer’s disease (Ping-Hsiao et al.
2009). A problem with this type of studies is that they normally include only one or a few
compounds that are being tested simultaneously while berries contain several bioactive
compounds. This has the consequence that, even if the results from a single compound study
indicates that the compound of interest causes a certain effect, the effect might not be visible
if the whole berry or product would be studied. The opposite effect, where several bioactive
compounds contribute to a synergistic health beneficial effect, might erroneously be attributed
to a single compound (Winefield 2009).
Another issue with anthocyanins is that they have been shown to have low bioavailability.
Studies of the bioavailability of anthocyanins have indicated that the uptake in the small
intestine may be as low as 1% (Manach et al. 2005). However, further studies are needed to
investigate if the bioavailability can increase during processing and also during subsequent
digestion. Coupled with the degradation during the processing and the storage it might cause a
virtually non-existent anthocyanin uptake from a product in which the raw materials has high
anthocyanin content. The product would hence wrongfully be marketed as healthy. Further

11
studies how this affect the potential health benefits from the anthocyanins would thus be of
great interest.
Spectrophotometry
Spectrophotometry is the name of techniques used to measure concentrations of different
compounds in a solution by using light. Visible light, or what people normally refers to as
light, is only a small part of the electromagnetic spectrum. The electromagnetic spectrum
ranges from high frequency/short wavelength γ-rays to low frequency/long wavelength radio
waves. Molecules can absorb the different wavelengths of radiation and are affected in
different ways depending on the energy of the molecule which is related to the frequency
according to the equation:
E=hν (Equation 3)
E is the energy of the radiation
h is Planck’s constant
ν is the frequency
If the energy is high enough the molecular bonds will break and ions might form, like in the
case with γ-rays. In the other end of the spectrum are the effects of microwave and infrared
radiation which causes movement in the form of rotation and vibration. Since the movement
of the molecules is what we call heat, this explains briefly how microwave ovens and infrared
heater can be used for heating. When the radiation is in the middle of the scale the molecules
will absorb it by exciting electrons and reemit the light by returning to the ground state. Both
the absorption and the emission of energy can be measured with relative simple and small
equipment and that is what is used in spectrophotometry. (Harris 2007)
UV-Visible absorption spectrometer The normally used unit to describe the absorption is absorbance. It is calculated by measuring
the irradiance (P), energy per second and unit area, sent out by the light source and the
compare it to the amount detected by the detector. By comparing these two numbers and using
the formula:
0
logP
PA
(Equation 4)
A is the absorbance,
P is the irradiance at the detector
P0 is the irradiance at the source
the amount absorbed by the sample can be calculated. This value is of no use by itself though
since the value only is relative to itself. To use it a standard curve with known concentrations
of the compound of interest need to be established. A dilution series is made and the
absorbance is measured and plotted against the concentrations. The value of the inclination of
the line can be used as a correlation factor in subsequent calculations. Before measuring the
absorbance of the samples of interest the spectrophotometer is set to zero with a sample
containing only dilution media, a so called blank. This allows the machine to only measure
the contribution from the compound of interest without interference from the dilution media
(Harris 2007).

12
Colourmetry
Colour is one of the main quality indicators when a consumer is assessing a food product.
Normally other aspects of the quality are not even considered if the colour is perceived as
wrong, e.g. a banana or a pear that is purple would most likely never leave the store (Francis
1995).
To be able to scientifically measure colours and be able to compare different food stuffs or
treatment effects on the colour a number of systems have been developed. The first was
developed by Commision International de l’Eclairage (CIE) in the early 1930s and consisted
of three theoretical colours which together can compose every colour the human eye can see
(and some more). This has later been replaced with the Hunter and Munsell systems which
use 3D projections to describe the colours on a 2dimensional slab and add lightness on the
third axis. In this project the Hunter system will be used. It is using values of a and b to
describe the colour in a 2 dimensional plane where a is red, -a is green, b is yellow and –b is
blue. By combining these values with an L (light) value ranging from 0 (black) to 100 (white)
all different colours can be described (Coultate 2002). This scale is illustrated in figure 3
Figure 3 Illustration of Hunter Lab scale
Rheology
Texture is another important aspect of how the customer perceives the foodstuff. Even though
the customer may not always be able to tell before purchasing the product if the texture is
what he or she expects, it will most certainly help to determine if the product is bought again.
It will also affect how the product can be stored and served, e.g. standing by itself on a plate
or if it needs to be poured into a glass. In berry products this difference can be seen quite
easily by comparing the two common products blackcurrant squash and blackcurrant jelly.
Both contains roughly the same amount of blackcurrant juice and while the jelly contains up
to 50% more sugar than the squash it is the boiling after the addition of sugar in conjugation
with the cooling that causes the pectin in the blackcurrants to gelatinise.

13
To measure these properties several methods and types of equipment exist. A simple way to
compare the relative viscosity of two samples is to use a Bostwick consistometer. It consists
of a chamber where the sample of interest is placed, a hatch that allows the sample to be
released with high temporal precision when required and a graduated inclined plane on which
the sample flows after release. The further the sample flows on the inclined plane in a
predetermined amount of time the less viscous it is. This distance is compared to the distance
of a reference samples. The value itself is normally not considered scientific enough for usage
in research and scientific publications but it is as previously stated useful for comparing
different samples to detect differences useful in quality control in the industry.
A more accurate way to measure rheological properties is to use a rheometer. Modern
rheometers allow accurate and precise measurements of most rheological properties such as
viscosity or shear modulus. The main types of measuring systems used are the rotational
cylinder and the cone and plate. There are of course different modifications of both these type
of measuring systems and the type used is decided upon depending on the nature of the
sample and what information that is expected (Mezger 2006)
Materials and Methods
Berries
Blackcurrants harvested in Västerbotten during September 2009 were provided by Kamrose &
Sons HB, Nordmaling. They will be referred to as Batch 1 throughout the thesis. The second
batch of blackcurrants were harvested in the Jönköping area in 2009 and purchased from Olle
Svensson AB. They will be referred to as Batch 2 throughout the thesis. Both batches were
delivered and stored frozen in a cold chamber at -20°C during the project. The bilberries used
during the project were picked in northern Sweden in 2008 and provided by Polarica AB,
Haparanda. The bilberries were stored in the same cold chamber as the blackcurrants.
Preparation of berry mash
The berries were brought up from the freezer on the morning the same day they were going to
be used. They were thawed by filling the beaker they were stored in with lukewarm water and
immediately pour it out again 3 times in quick succession and eventually filled with lukewarm
water and left standing in room temperature for 5 minutes1. The beaker was emptied with
water and the berries were crushed and shredded with a Bosch hand blender (280W) until a
homogenous mash was obtained which held a temperature of 2-5°C. The mash was stored in a
beaker at 8°C with the opening covered with parafilm during the course of the day and
samples were taken directly from the beaker when needed. Samples from one batch at
irregular intervals during 31 hours indicated that the time of samples retrieval did not affect
the anthocyanin content since the first and last samples had the highest values and all values
were within the standard deviation. This method of thawing and handling was chosen to avoid
degradation by heating the berries before treatment, to avoid potential changes during slow
unfreezing in a refrigerator overnight or during the weekend and thereby improve the
reproducibility and speed up the experimental speed by providing fresh samples when needed.
The berries were only used for proper experiments the same day as they were thawed and
mashed.
1 This method of thawing might not be optimal but daily measurements during the first 2 weeks of work showed that the
difference between 2 different thawings were of the same magnitude as 2 samples from the same thawing. Hence the decision
to continue to use the procedure and focus on more pressing issues.

14
Throughout these thesis the terms mash, purée and pomace will be used frequently to describe
the treated berries. Mash will be used to describe whole berries that have been thawed and
destroyed by a hand blender. Purée will be used to describe mash that have been sieved
through a 0.5mm or 1mm metal sieve and thus had most of the seeds and larger skin particles
removed which will be described as the pomace. Mixture will be used to describe berry mash
combined with either another kind of berry mash such as bilberry/blackcurrant combinations
or a mash with glucose or any other chemical added to it.
Thermal treatments
Figure 4Picture of the equipment used for heating. The headspace vials were placed in the 4 small holes while
the big hole allowed the stirrer to rotate freely while staying in the centre. The white rod is the thermometer of
the bath. The glycerol has a brownish colour due to berry residue.
For the heating experiments, 12ml or 20ml headspace vials (Chromacol, United Kingdom)
were filled with blackcurrant mash. A small magnetic stirrer was placed at the bottom of the
vials before the mash was added in all samples to improve the heat transfer (figure 16). The
vials were sealed with caps using a hand crimper.
When the samples had been prepared and sealed the vials were put into a glycerol bath of the
desired temperature (Figure 4). Glycerol was chosen as heating medium due to its high
boiling point, low toxicity and availability in the lab and allowed all temperatures of interest
to be tested in the same setup. Glycerol level in the pot was maintained at a level covering all
of the vials except the caps. When switching from large to small vials excessive glycerol was
removed. The vials were kept in place by a plastic frame and a magnetic stirrer was used to

15
stir the glycerol and consequently ensure proper heat transfer and a uniform temperature in the
bath (figure 4).
During initial trials, the time to reach the same temperature in the vials as in the surrounding
glycerol was concluded to be close to 5 minutes (see appendix 1) regardless of temperature.
This data was obtained by placing a thermometer in one of the four samples used during the
first weeks of the project. The time used in the graphs and calculations is the holding time at
the set temperature
After the samples had been heated at the desired temperature/holding time settings, the vials
were transferred into an ice bath for cooling. The temperature of the ice bath was 1-3°C which
ensured a high temperature gradient throughout the cooling and thereby a rapid cooling. The
chilling to room temperature never lasted longer than 2 minutes and melted ice was
replenished continuously.
Following the subsequent removal of the caps, samples of the treated berry mash could be
retrieved and used for anthocyanin analysis or further experiments.
Extraction of anthocyanins
5g of each treated sample were put into an E-flask together with 45ml methanol for extraction
and 0.5ml of 37% hydrochloric acid to obtain a pH of 1-2 and keep the anthocyanins stable.
The flasks were heavily shaken to obtain proper mixing. The openings of the E-flasks were
covered with parafilm and the whole flasks were wrapped in aluminium foil. The sample was
stored in a refrigerator at 8°C over night for extraction and to prevent further degradation.
Duplicate samples were taken in all cases.
Measurement of anthocyanin content in extracts
The extracts was retrieved from fridge the next day and filtered through a filter paper grade
00R (Munktell Filter AB Sweden) using a funnel and collected in another E-flask. Mechanical
pressure was applied on the berry residue to prevent it from keeping too much of the methanol
and juice in the filter cake. 5ml of 60% methanol in water (v/v) containing 1% HCl (v/v) was
poured into beakers and a set amount of filtrate was added. The amount of filtrate used in each
dilution was decided upon by trial and error since the subsequent measurement of absorbance
was supposed to be around 0.5-0.6. 2.5-3 ml of the dilution was poured into a plastic cuvette
and the absorbance at 530nm was measured in a spectrophotometer (Ultrospec 100,
Pharmacia Biotech, Sweden). The methanol solution used for dilution of the filtrate was used
as reference blank. All measurements were made in triplicate which totalled 6 measurements
for each treatment.
Calculation of anthocyanin content in the berries
A correlation factor between the amount of anthocyanin in a sample and absorbance was
obtained by preparation of a standard curve using a solution containing cyanidine-3-glucoside
bought from Polyphenols, Norway and methanol. The correlation factor was found to be
0.0416 (see appendix 2)
The anthocyanin content left in the berry mash before and after treatments was calculated
using equation 5:

16
mg anthocyanin/g berry (wet weight) = )(*1000*)(*
))()((*)(*
gmmlVc
mlVmlVmlVABS
berryextract
extractdiltutionsample (Eq. 5)
ABS is the measured absorbance
c is the correlation factor from the standard curve
Vsample is the amount of methanol used for extraction
Vdilution is the amount of 60% methanol mixture used to dilute the extract
Vextract is the amount of filtered berry mash/methanol pipetted into the 60% methanol for the
measurements,
the factor 1000 transforms the result to mg/g instead of µg/g which is obtained from the
standard curve
mberry is the amount of berry in the extraction beaker.
Effects of pH-alterations, glucose and organic acid addition
Samples with different pH levels were prepared by addition of solid sodium hydroxide to 50g
of berry mash. The mixture was stirred until the sodium hydroxide was completely dissolved
and pH of the samples was measured in the vials before and after heating. pH was readjusted
to between 1-2 for the anthocyanin extraction and measurement.
Ascorbic acid, citric acid and glucose were added in solid form to the berry mash as described
above and the mixtures were stirred until the samples were deemed to be homogenous.
A time-temperature setting of 60minutes holding time at 100°C were chosen for these tests
and the results was compared to those obtained from heating the otherwise untreated berry
mash and the raw reference samples.
Effects of variations in oxygen supply
The effects of air supply were tested by filling 20ml vials with 12g of berry mash with took
half of the volume of the vials, i.e. 10ml. By leaving the vials open the effect of free access to
oxygen could be investigated. Effects of limited air supply and completely oxygen free
environment were tested by sealing of the vials with regular air inside and in the latter case by
flushing the vial with nitrogen immediately before sealing.
Similar to the tests described above a time-temperature setting of 60minutes holding time at
100°C were chosen and the results was compared to those obtained from heating the
otherwise untreated berry mash and the raw reference samples.
Colour Measurements
A method for evaluating colour changes was developed in the beginning of the experimental
work. The residue left in the vials when the 5g needed for anthocyanin extraction had been
removed was used for the colour measurements. The residue was placed on a 0.500mm sieve
and mechanical pressure was applied by a microspatula to squeeze out purée and juice from
the berry mash. This removed the seeds and other large particles, such as pieces of skin, which
affected the measurements initially. The purée was collected on a watch glass and 0.5g of the
purée was placed in a small container and diluted and mixed with 5ml of distilled water until a

17
homogenous solution was obtained. The water raised the pH from 2.9-3.0 to 3.3 but no colour
difference could be detected due to this increase.
These solutions were pipetted onto a white porcelain spot dish in two separate wells. The
wells were covered with standard sized objective slides which sealed the wells by capillary
forces and thus creating a confined space of the same volume each time as long as no air was
left in the well. The colourmeter (Konica Minolta Colour Reader CR-10, Konica Minolta,
Japan) was placed on top of the objective slide and the colour was measured 3 times for each
well (the colourmeter was moved and reset between each measurement). The measurements
were performed in the same room and place each time to assure that the same amount of
background light always was present. The colourmeter was calibrated using the white plate
included in the colourmetric equipment.
Rheology
For rheological measurements the berry mash obtained from heating treatments was filtered
through a 1mm sieve. The berries were pressed with a spoon until further pressure stopped
yielding more juice and purée. The sieved purée was continuously scraped off into a small
glass bowl. The purée was placed in a 30mm cup in the Stresstech HR Rheometer (ReoLogica
Instruments AB Lund, Sweden). Viscosity measurements were performed with a “bob in cup“
CC30 and settings were adapted to the individual samples. The tests performed were of the
shear rate ramp (CSR) type. The stress was measured at shear rates between 1-500s-1
. The
interval was chosen since chewing and swallowing has a shear rate of 10-100s-1
(Mezger
2006) and the extensions of the interval were made to include any effects right outside or in
the vicinity of this region. Between 5 and 12 measurements on each sample was performed
depending on how good the readings were, with a ratio of 0s to 1s of at least 6:4 and no more
than 20% of the 1s could be outside 1.0±0.1 for the results to be considered accurate. Each
treatment was repeated twice and the treatments that were evaluated were selected to give a
broad but still quick picture of how the consistency could be related to the anthocyanin
content.
Data analysis
The data analysis and degradation modelling was performed with Microsoft Excel. The
standard deviations presented with the data were calculated by using the standard deviation
tool in Excel. Linear regression on the logarithmic values was used to calculate the
degradation coefficient, k, at the different temperatures. The Solver tool in Excel was used to
calculate the degradation coefficient by minimising the Sum of Squares (SoS) when
applicable.

18
Results and Discussion
Effects of heat treatments on anthocyanin content in blackcurrant mash
The effects of heat treatment at 80°C, 100°C and 120°C on the anthocyanin content was
measured during 90 minutes for samples heated at 80°C and 120°C and up to 360 minutes for
the 100°C (figure 7). The anthocyanin content was found to decrease in all samples during
heat treatment and the most rapid degradation was observed at the higher temperatures (figure
5).
Figure 5The time-temperature dependence of anthocyanin degradation in blackcurrants
Anthocyanin degradation by heating
0
20
40
60
80
100
120
0 20 40 60 80 100
Time (min)
% a
nth
ocyan
in l
eft
80°C
100°C
120°C

19
Effects of heating at 80°C At 80°C the degradation of anthocyanin was slow and less than 15% of the content had
disappeared after 90 minutes. No apparent difference in smell or appearance could be detected
when the vials were opened after treatment. The experimental degradation curve does not
totally correspond with the calculated degradation curve and has a k value of 0.0020
(degradation constant, see Eq 1) and R2-value of 0.77. All the data points for the calculated
degradation curve were within the standard deviation of the measured data. Compared to the
literature value for k, 0.0013, (Harbourne et al. 2008) the degradation was faster at all
measured or calculated points.
Figure 6 Comparison of the experimental degradation data, the calculated degradation curves, both by linear
regression and sum of squares, and the degradation curve predicted by literature data at 80°C. Both the calculated
curves are exponential but the scale is too small for it to be noticeable.
Anthocyanin degradation at 80°C
80
85
90
95
100
0 20 40 60 80 100
Time (min)
% a
nth
ocyan
in
rem
ain
ing
Experimental
Calculated
Litterature
20
Effects of heating at 100°C At 100°C the anthocyanin was degraded faster than at 80°C but the degradation speed
decreased after 2 hours and was lower during the last 4 of the 6 hours investigated. The
calculated degradation constant, 0.0063, results in a degradation curve between the one
predicted in the literature and the experimental data and has a R2 of 0.87. If only the first two
hours is measured a degradation constant of k=0.0097 is obtained which results in a curve
which have a fit of 0.97 which is a really good prediction. The half life at 100°C was
calculated to be 110 minutes when using the constant obtained at the 6 hour interval but only
71 minutes when using the degradation constant obtained from the first 2 hours. When
comparing these results with the degradation constant reported by Harbourne et al. (2008) it is
obvious that the degradation is much faster in the experimental data and both predicted
models compared to the literature value (Harbourne et al. 2008).
Figure 7 Comparison showing the experimental data compared to 3 different predicted degradation curves at
100°C. The k obtained both by linear regression on the data from the first 2 hours and the Sum of Squares
method makes an excellent prediction for the first 2 hours but overestimates the degradation in the end.
Anthocyanin Degradation at 100°C
0
10
20
30
40
50
60
70
80
90
100
0 100 200 300 400
Time (min)
% a
nth
ocyan
in r
em
ain
ing
Experimental
Linear regression
Litterature
First 2 hours

21
Effects of heating at 120°C At 120°C the degradation starts early and at a high speed. After 5minutes up to 30% of the
anthocyanin content has been degraded and after 10minutes almost half of the anthocyanin
content has disappeared. The samples shifted from a purple/red colour to a brighter red and
brown shade and the samples had an unpleasant scent when opened including those with as
low holding times as 5 minutes. The measured degradation was much faster during the first
hour than the calculated degradation on the whole interval which had a degradation constant
of 0.0276 with a R2 value of 0.83. No literature value to compare with could be found due to
differences in heating and cooling techniques. Linear regression on the interval 0-30 minutes
led to approximately the same degradation constant as obtained by minimising the sum of
squares, k=0.0427 R2=0.90 and k=0.044 respectively. These predicted that the anthocyanin
concentration should be almost 0 after 90 minutes but this could not be observed. There were
still detectable amounts of anthocyanins after 6 hours at 120°C, however it was as low as
2.7% of the original content (data not shown). The measured half life was approximately 10
minutes while the predicted by linear regression on the whole interval was as long as 25
minutes.
Figure 8 Comparison between the experimental data and the data calculated from linear regression on the whole
interval and the first 30 minutes/sum of squares. The calculated degradation underestimates the initial
degradation but reaches the same level in the end while the sum of squares model offer a better initial fit.
Anthocyanin degradation at 120°C
0102030405060708090
100110
0 10 20 30 40 50 60 70 80 90
Time (min)
% a
nth
ocyan
in r
em
ain
ing
Experimental
Sum of Squares
Linear Regression

22
Comparison of Batch 1 and Batch 2 Two batches of blackcurrants were used for the experimental work since the amount of berries
in the first batch was not adequate. Hence it became of great importance to compare the
degradation in the two batches to see if the results obtained from the first batch could be
compared with the results from the second batch. The degradation of the anthocyanin content
in both these batches of blackcurrants was compared at 100°C and 120°C. The first batch had
an initial content of 4.8mg anthocyanin/g blackcurrant (wet) and the second batch had a
concentration of 3.6mg anthocyanin/g blackcurrant (wet). Although the concentration
differences decreased towards the end, especially at 120°C (Figure 9), it was obvious that a
different calculation method was needed.
Figure 9 Comparison of anthocyanin concentration and degradation in the two different blackcurrant batches at
100°C and 120°C
The problem was solved by setting the initial amount of anthocyanin in both batches to 100%
and compare the amounts remaining in the treated samples to the initial amount in respective
blackcurrant batch. When comparing the degradation curves of the two batches with the
values recalculated to relative amounts instead of actual amounts, the difference between the
batches were virtually nonexistent (Figure 10) and this allowed the data obtained from the
first batch to be compared to the second batch. Since all blackcurrants mainly contain four
anthocyanins and in the same ratios (Rubinskiene et al. (2006)), the shared degradation curves
were expected but still needed to be confirmed. Henceforth all the anthocyanin data, unless
specifically stated, will be presented as the final amount relative to the initial amount.
Comparison Batch 1 and 2
0
1
2
3
4
5
6
0 20 40 60 80 100
Time (min)
mg
an
tho
cy
an
in/
g b
lac
kc
urr
an
t
100°C Batch 1
100°C Batch 2
120°C Batch 1
120°C Batch 2
23
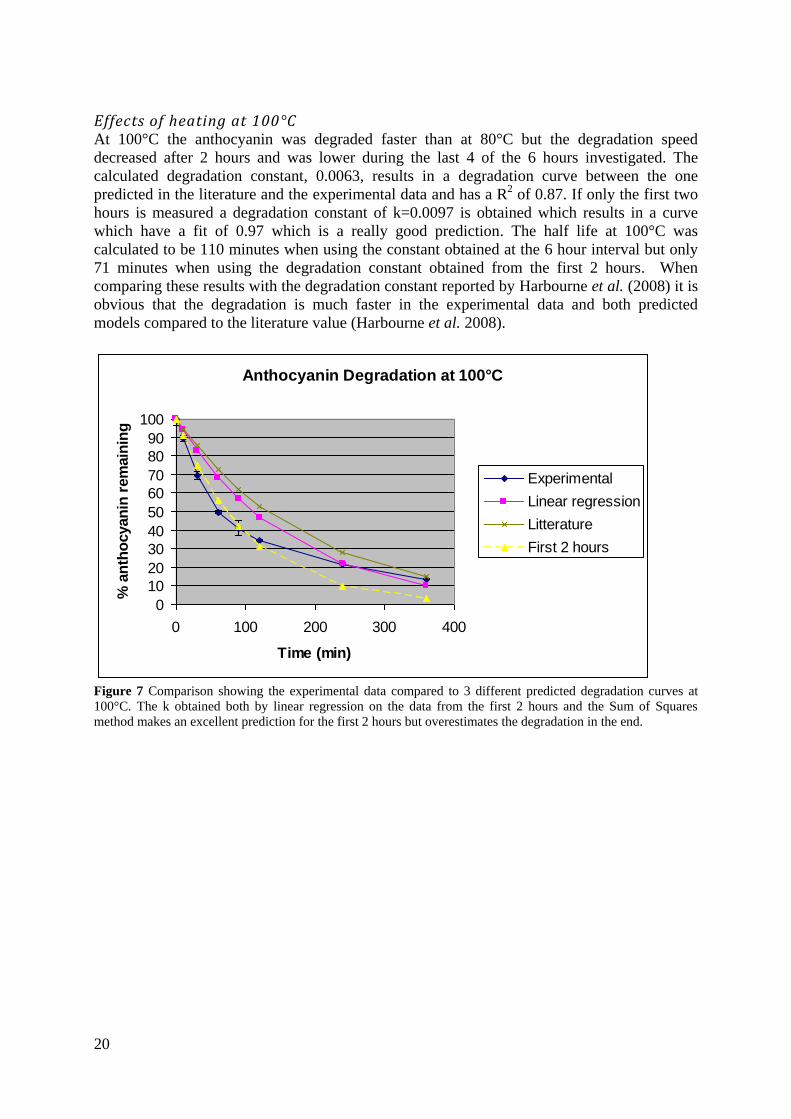
Figure 10 Comparison showing that for each time and temperature, C/C0 has more or less identical values for
both batches of blackcurrant.
Final discussion regarding heat treatment At the temperatures investigated more thoroughly, 100°C and 120°C, the degradation speed
could be calculated with the formula outlined by Harbourne (2008) during the initial 30-
60minutes. The degradation started to diverge at an increasing rate from the model as holding
times increased. The degradation became slower and slower and the amount of anthocyanin
never reached below 2.5% even at a holding time of 6hours at 120°C (data not shown). A
possible explanation is that the method used to measure the anthocyanin concentration, in
which it is assumed that everything that absorbs at 530nm is anthocyanin, might be a
simplification of the situation. The amount present in raw blackcurrants are within the range
presented in literature (Hollands et al. 2008) which infers that the method is accurate enough
but it is not established whether some of the degradation products also absorbs at 530nm.
HPLC experiments on the samples could be performed to investigate whether there is any
anthocyanin left, if it is degradation products that absorb the UV-light or if it is a combination
of both. Another explanation could be that the blackcurrant matrix slows down the
degradation by protecting the anthocyanins in the seeds. Since the extraction took up to
24hours, and thus allowing more time for the anthocyanins to dissolve into the methanol
solution, this could help explaining why they could be detected anyway.
Comparison Batch 1 and 2
0
20
40
60
80
100
120
0 20 40 60 80 100
Time (min)
% a
nth
oc
ya
nin
s r
em
ain
ing
100°C Batch 1
100°C Batch 2
120°C Batch 1
120°C Batch 2
24
Effects of glucose and organic acid addition
The reason for testing citric acid, ascorbic acid and glucose was that they are natural
components of fruits and berries and common ingredients in fruit and berry products. Citric
acid is added as an acidifier in industry to most fruit and berry products and ascorbic acid is
added to e.g. blackcurrant squash. A quick scan on the internet of homemade recipes verifies
that at least one of these acids normally is included in jams and other homemade preserves.
The glucose was chosen as a sugar representative due to already being present in the samples
in the form of sugar moieties on two of the four anthocyanins and its presence in sucrose in
the berries. Since the preparation of berry preserves requires heating or boiling, and in the
case of jelly preparation cooling due to the pectin, the berries were heated at 100°C for 60
minutes.
The addition of citric acid (CA), ascorbic acid (AA) and glucose yielded different results. The
citric acid addition yielded no noticeable difference, neither at 0.4% (w/w) nor at 4% (w/w),
compared to the reference sample (49.7% left compared to 49.8% and 49.4% respectively).
The pH in the 0.4% sample showed a minor increase from 2.9 to 3.0 while it decreased to 2.5-
2.6 in the 4% (w/w) sample.
The sample with 0.4% (w/w) ascorbic acid did not affect the anthocyanin degradation (50.2%
left) but the sample containing 4% (w/w) showed a faster degradation than the other samples
and only had 42.1% of the initial content left. The pH varied only slightly between the
samples and all was in the range between pH 2.95 -3.05.
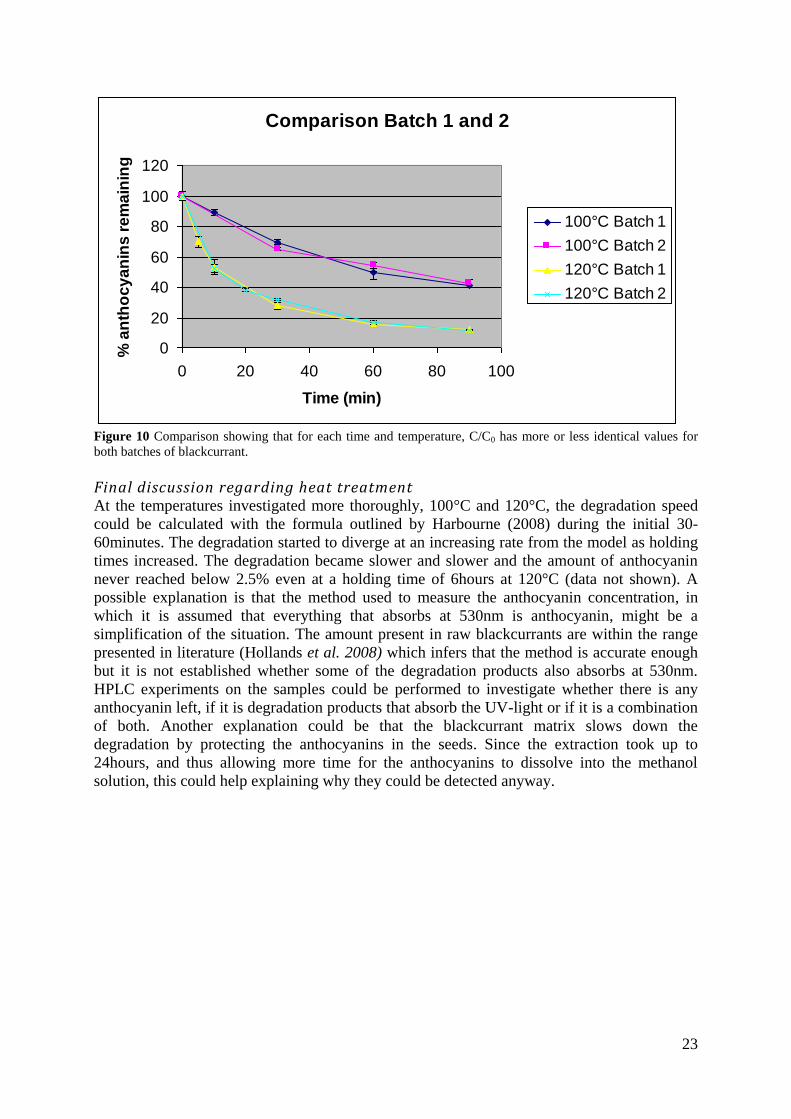
The effects of glucose addition varied depending on the amount of glucose added. When 4%
(w/w) of the samples consisted of added glucose the amount of anthocyanin decreased to
46.7% of the original content. The samples with 50% (w/w) of glucose added showed an
increase in the anthocyanin retention and had 56.1% of the initial content left after one hour at
100°C.
Figure 11 The addition of 3 different common food additives in two different concentrations and their effect on
the anthocyanin content compared to samples with berry mash only.
Heated 60 minutes at 100°C
0102030405060708090
100
Unt
reat
ed
No
additive
0.4%
CA
4%CA
0.4%
AA
4%AA
4% G
luco
se
50%
Gluco
se
Added Chemical (w/w)
% a
nth
ocyan
in left

25
The citric acid caused as stated above no effect neither at amounts present in recipes (0.4%
w/w) nor with the tenfold increase. Citric acid is not known to interact with anthocyanins and
the decrease of pH as in the case with 4% (w/w) should only act to stabilise the anthocyanins.
The fact that no such effect could be seen indicates that at a pH below 3 the anthocyanins
were not stabilised to any further extent than what already were the case. Citric acid addition
does not affect the nutritional value of the product and can be added early in the processing if
required.
The addition of low concentrations (0.4% w/w) of ascorbic acid did not cause any difference.
This is the amount used in the homemade recipes and the results indicates that this amount
causes no further degradation and it is the temperature and holding time that should be
minimised to retain maximal values of anthocyanin. When the added amount was increased
tenfold, the degradation speed increased greatly from 50% to almost 60% in one hour at
100°C. According to a study done by De Rosso & Mercadante (2007) a higher concentration
of ascorbic acid increases the degradation of anthocyanins in berry extracts in room
temperature. The reason that this was not noticeable at the lower concentrations could be
explained by the fact that blackcurrants already contains 0.2% w/w ascorbic acid and an
increase to 0.6% w/w does not seem to be enough to cause a noticeable difference. The
addition of 4g ascorbic acid /100g blackcurrants caused the ascorbic acid concentration to rise
to 4.2% w/w and this is evidently enough for a detectable difference. Poei-Langston &
Wrolstad (1981) showed that the ascorbic acid and anthocyanin react through a condensation
reaction and thereby reduce the content of both at a 1:1 ratio. In this experiment 5.68*10-3
moles of ascorbic acid increased the degradation by 3.36*10-6
moles of anthocyanin
(calculated from average molecular weight of 565g/mole according to data from Rubinskiene
et al. (2006)), i.e. 0.06% of the ascorbic acid might have reacted with anthocyanins. This
might seem low but it can be attributed to the fact that it was only allowed to react for a little
more than one hour, the berry mixture is a less than ideal system for chemical reactions and
that ascorbic acid itself is degraded by heat.
The increased amount of anthocyanin left when 50% w/w glucose was added can most likely
be attributed to the lower water activity that the high amount of glucose cause. Lowering the
water activity has been shown to decrease the degradation of dried anthocyanins solved in
water and this seems to be the case even in the berry mixture (Rubinskiene et al. (2006)). The
same study also showed that concentrations of sugars below 20% w/w decreased the
anthocyanin content which is consistent with the results obtained from the 4% sample.

26
Effects of variations in oxygen supply and separation of skin and pulp
The effect of different amounts of oxygen and mechanical treatments yielded varying results.
The sealed samples with regular air and nitrogen showed minor increases in the anthocyanin
content left compared to the reference sample (52.6% and 51.1% respectively compared to
49.6%).
The samples which had its opening unsealed and thereby allowing heat and mass transfer into
the surrounding room showed a larger retention of the anthocyanins with 55.2% left. These
samples lost up to 8% of their weight which have been included in the calculations. The lack
of sealing increased the heat transfer to the surroundings and caused a heat gradient and lower
temperature on average in the samples which might have slowed the degradation.
The results from the measurements in which mashed berries were pressed through a 1mm
sieve were in agreement with earlier studies describing that most of the anthocyanin is
situated in the skin of the berries (Coultate 2002). The filtered purée only had 36.8% of the
anthocyanin content of the untreated mash left after treatment while the pomace had 61.2% of
the original content left. If these two concentrations are added the resulting anthocyanin
content becomes 48.9% of original content which is only a minor decrease compared to the
reference sample (49.6%).
Figure 12
Comparison of external factors affecting the anthocyanin content. The rightmost bar shows that the anthocyanin
content in the purée and pomace samples totals to more or less the same amount as in the complete berry
mixtures.
0
10
20
30
40
50
60
70
80
90
100
% a
nth
ocy
anin
re
mai
nin
g
External Factor
Heated 60 minutes at 100°C
PomacePuréeSerie1

27
Effects of pH alterations
Addition of sodium hydroxide and hydrochloric acid during initial screenings showed that
both these compounds lowered the amount of remaining anthocyanins after heat treatment
compared to unaltered but heated berry mash. Since most products are heated to some extent
during preparation it was investigated if an altered pH during the heating would affect the
anthocyanin content irreversibly. The pH was lowered to pH 1-2 at extraction and analysis.
The addition of 1ml 37% HCl lowered the pH to 0.5 and decreased the anthocyanin content
left after treatment to 47.2% of the original content. The addition of 4% (w/w) of NaOH
increased the pH to 9.7 and decreased the remaining anthocyanin content to 12.2% of the
original content. The subsequent studies that these findings led to showed that the anthocyanin
content decreased linearly with the rising pH level between pH 3 and pH 8 whereas no further
degradation could be seen with the increase to pH 9.7. The colour of the sample changed from
red/purple to dark purple, green and brown/black in the sample with the highest pH. Linear
regression on the anthocyanin content in the pH 3-8 interval resulted in a function which
yielded 8.2% less anthocyanin remaining compared to the initial amount when pH increased
by 1. The R2-value for this line was 0.988 which is a good prediction. The fact that there were
no further decrease of anthocyanins at pH 9.7 might be attributed to coloured degradation
products as described in the heating section. That suspicion is reinforced by the earlier results
that only showed lower anthocyanin content on two occasions which were the 4 hours and 6
hours treatment at 120°C.
Figure 13 The increased degradation of anthocyanins with increased pH.
It has been established how the anthocyanins form different compounds and lose their colour
when the pH increases but this is normally reversible when the pH decreases again (Coultate
2002). Early experiments in the laboratory on the blackcurrant mash, where sodium hydroxide
and hydrochloric acid were added in arbitrary amounts, changed the colour from the regular
red/purple to almost completely green/black and later back to the red and purple. This
phenomenon was not observed in the case of the pH elevated and heat treated samples. When
the pH was adjusted to 1-2 for extraction the samples still had different colours and hues
compared to the control samples but also compared with each other. The colour differences
persisted through the night and were still present at the anthocyanin measurements the next
day but the pH remained unchanged at 1-2. These observations support the theory that the
Heated 60 minutes at 100°C
0
10
20
30
40
50
60
3 4 5 6 7 8 9 10
pH
% a
nth
oc
ya
nin
re
ma
inin
g

28
combined pH increase and heating caused irreversible degradation of the anthocyanins in the
berry mash. The slightly lower amount of anthocyanin in the sample with only hydrochloric
acid can probably be explained by the fact that the pH was not adjusted properly and it
remained below the absorption maximum of pH1-2.
Bilberries and Blackcurrant/Bilberry mixes
The heating experiments performed on bilberries yielded similar results as the blackcurrant
experiments. Both for 100°C and 120°C an exponential degradation curve was obtained
though with different degradation coefficients than for the blackcurrants. They were
concluded to be 0.0142 and 0.0396 with R2 values of 0.87 and 0.85 for the 100°C and 120°C
treatments respectively. As in the case with blackcurrants the exponential model on the entire
interval underestimates the initial degradation but reaches more or less the same endpoints. As
can be seen in figure 17 anthocyanins in bilberries are degraded faster than in blackcurrants.
Figure 14 Comparison between the degradation curves for blackcurrant (BC) and bilberries (BB) at 100°C and
120°C.
The reason for the different degradation rates is most likely due to the different anthocyanin
composition of bilberries and blackcurrants. As shown by Rubinskiene et al. (2005) the four
different anthocyanins present in blackcurrants are not equally heat resistant. In bilberries
there are 15 different anthocyanins and only cyanidin-3-glucoside and delphinidin-3-glucoside
are found in both blackcurrants and bilberries (Lätti et al. 2008).
A mixture with 50% bilberries and 50% blackcurrants (w/w) were subject to the same heat
treatment at 100°C as the pure blackcurrant and bilberry samples and the anthocyanin content
was compared to the values predicted by combining the results from the single berry samples.
The results showed that there is most likely no interaction between them and that the total
amount of anthocyanin in the mixture is close to identical to the amount predicted from the
values obtained by combining the values from the single berry samples. This implies that if
the aim is to maximise the anthocyanin content in a mixture there is no difference if the
berries are mixed before or after the heat treatment (figure 14)
Bilberries vs Blackcurrants
0
10
20
30
40
50
60
70
80
90
100
0 20 40 60 80 100
Time (min)
% a
nth
ocyan
in r
em
ain
ing
BB 100°C
BC 100°C
BB 120°C
BC 120°C

29
Figure 15
The almost identical graphs indicate that there is no apparent difference in mixing two the berries at a 50/50
(w/w) ratio before or after the heat treatment.
Colour measurements
The colour was concluded to be affected by heating and other treatments, most notably pH
changes, quite early during the experiments. The challenge was to perform reliable
measurements, not only visual inspections of 2 different samples. This is illustrated in figure
16 which compares raw untreated blackcurrant mash with blackcurrant mash heated 90
minutes at 120°C, i.e. the two extremes in the project regarding anthocyanin content. Even
though they are quite easily distinguished all other samples are between these two and are
difficult to distinguish from one another, especially if the differences are small. These
difficulties were illustrated even better when comparing the extracts used for measuring the
anthocyanin content as described earlier. When these extracts were stored in beakers
personnel in the lab was asked to tell if they could see any differences in colour between
undiluted raw extracts and undiluted extracts with 50% less anthocyanins and most of them
failed to spot any (controls were made by asking them to compare the colour of two beakers
with the same content which yielded the same results). However, the differences in intensity
was quickly noticed though when the extracts were diluted in the 60% methanol solutions for
anthocyanin measurements.
The results from the first batch show no apparent loss of colour in the samples heated at 80°C.
At 100°C the a-values remained virtually unchanged while a gradual decrease of the b-values
can be seen with the decrease in anthocyanin content. At 120°C the loss of colour is
noticeable early on and becomes obvious at the longer treatment times when it is clearly
noticeable, even for the human eye (fig 16). The L-values remained unchanged for all samples
and will henceforward not be included in the discussion since it seemed to be affected more
by the amount of particles than the colour of them.
BB/BC mixture at 100°C
0
1
2
3
4
5
6
0 20 40 60 80 100
Time (min)
mg
an
tho
cyan
in /
g b
err
y m
ixtu
re
Experimental
Calculated

30
Figure 16 Comparison of raw blackcurrant mash with 3.58mg anthocyanin/g mash to the left with blackcurrant
mash containing 0.42mg anthocyanin/g mash to the right. The white colour at the bottom of the second sample
from the left is a magnetic stirrer.
When the anthocyanin content for the first batch was plotted against the colour values some
correlations could be seen. For the a-values, regression according to y=kxn gave the
coefficients k=13.2 and n=0.32 with a R2 value of 0.88. With the b-values the decrease is
started earlier and is more consistent which yields a straight line (y=kx+m) with a slope of
k=0.39 and m-value of 2.69 with a R2 value of 0.91. In both cases other models were tried as
well but these led to the best fit in each of the cases.
Figure 17 Graph of how the colour values changes with decreasing anthocyanin content in batch 1
Similar measurements were performed on the second batch to investigate if a general model
or trend for blackcurrant colour could be obtained. The results looked somewhat similar but
the numerical values differed (see fig 17). When using regression on the different values the
a-values can be modelled with a similar y=kxn formula with k=20.12 and n=0.33 with a R
2
value of 0.94. The b-values does not fit particularly good to any regression model though with
the closest being the linear formula y=1.48x+3.6 with a R2 value of 0.76. The next step was to
Value of a and b vs anthocyanin content
0
5
10
15
20
25
012345
mg anthocyanin/g blackcurrant
a-
an
d b
-valu
es
a
b

31
try to produce a standard curve by choosing treatments that would produce samples with
predetermined anthocyanin content and thereby be able to test if the method could be
reproduced. These colour values was in the range of the first experiments but failed to give
any regression models with a R2 value of more than 0.81.
Figure 18 a and b values from two separate trials on the second batch showing similar behaviour. The blue and
purple dots are the first trial while the yellow and brown markings are from the second.
When the same procedure was tried with bilberries it was soon concluded that the method
used for blackcurrants was not suitable for the bilberries. The bilberries had too many small
dark particles, such as seeds and skin residue, which were big enough to sediment during the
measurements but easily passed through the filter used to remove the skin and seeds of
blackcurrant. Diluted samples became inhomogeneous, even after 20-fold dilution and it was
therefore not possible to obtain reproducible measurements.
The first aim of the colour experiments was to investigate if it was possible at all to measure
colour differences due to loss of anthocyanin. The method established managed to detect the
colour loss in blackcurrant, which was the main focus of the tests, but not in the bilberries.
The second objective was to investigate if there was any correlation between the loss of colour
and the loss of anthocyanin. In this case some correlation could be seen as the a-value, i.e.
redness, decreased somewhat accurate according to the formula y=kxn where x is the
anthocyanin content. The yellowness also decreased and got more and more grey over time
but no real mathematical correlation could be found that suited both batches.
When the values of a and b from the 2 different batches were compared it became clear that
these values could be used for measuring the total anthocyanin content due to the higher
redness and yellowness in batch 2 but with lower anthocyanin content, thus effectively a
mathematical correlation impossible. This is illustrated in figure 18 and 19. Another problem,
inherited from the first part of the thesis, is that there is no data available on the degradation
products of the anthocyanins and hence not their contribution to the colour either.
a- and b-values vs anthocyanin content
0
5
10
15
20
25
30
35
01234
mg anthocyanin/g blackcurrant
a-
an
d b
-valu
es
a
b
a
b
32
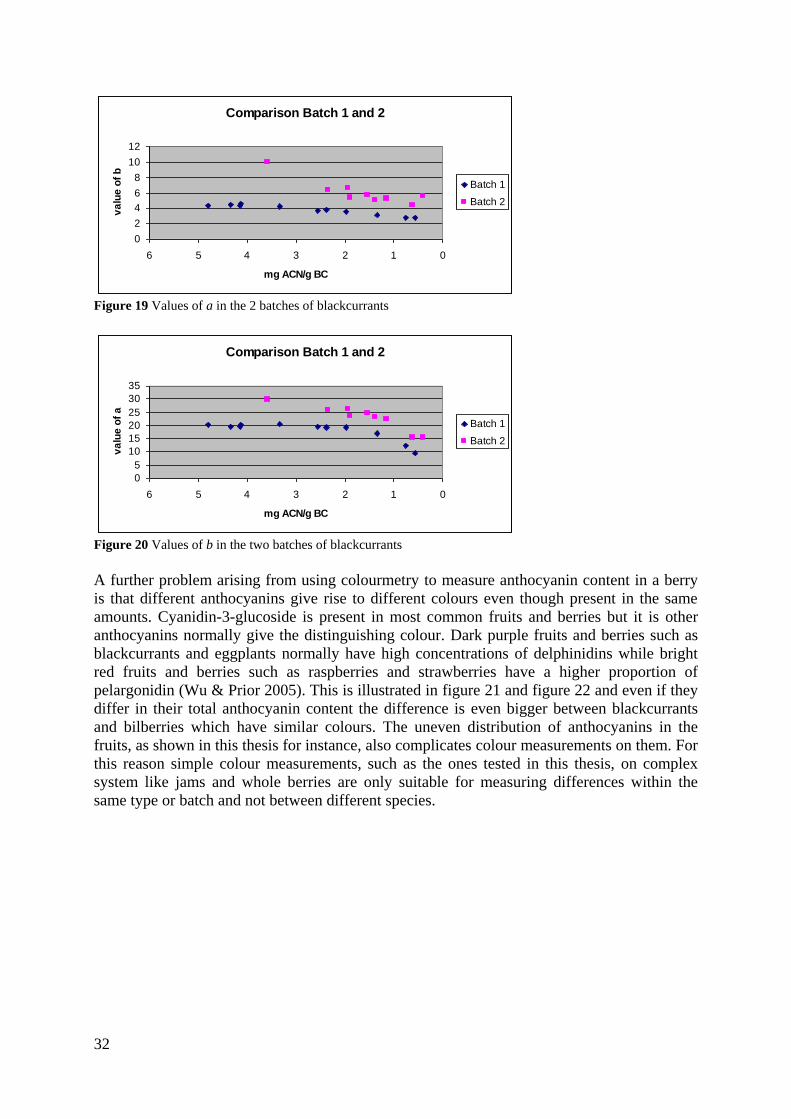
Figure 19 Values of a in the 2 batches of blackcurrants
Figure 20 Values of b in the two batches of blackcurrants
A further problem arising from using colourmetry to measure anthocyanin content in a berry
is that different anthocyanins give rise to different colours even though present in the same
amounts. Cyanidin-3-glucoside is present in most common fruits and berries but it is other
anthocyanins normally give the distinguishing colour. Dark purple fruits and berries such as
blackcurrants and eggplants normally have high concentrations of delphinidins while bright
red fruits and berries such as raspberries and strawberries have a higher proportion of
pelargonidin (Wu & Prior 2005). This is illustrated in figure 21 and figure 22 and even if they
differ in their total anthocyanin content the difference is even bigger between blackcurrants
and bilberries which have similar colours. The uneven distribution of anthocyanins in the
fruits, as shown in this thesis for instance, also complicates colour measurements on them. For
this reason simple colour measurements, such as the ones tested in this thesis, on complex
system like jams and whole berries are only suitable for measuring differences within the
same type or batch and not between different species.
Comparison Batch 1 and 2
0
2
4
6
8
10
12
0123456
mg ACN/g BC
va
lue
of
b
Batch 1
Batch 2
Comparison Batch 1 and 2
0
5
10
15
20
25
30
35
0123456
mg ACN/g BC
va
lue
of
a
Batch 1
Batch 2

33
Figure 21 Rapsberries (Rubus idaeus) Figure 22 Blackcurrants (Ribes nigrum)

34
Rheological measurements
In the rheological tests all samples showed a clear shear thinning behaviour in conformity
with most other foodstuffs. The raw blackcurrant samples was both thicker than the bilberry
sample as suspected and the first batch was a clearly thicker than the second batch even after
the removal of the pomace which might once again indicate a higher concentration of water in
the second batch than the first one. The high content of pectin in blackcurrants compared to
bilberries might also influence this behaviour even though no sugar was added. The fact that
the n value is closer to 1 for the second batch might also indicate this even though they both
are far away from being Newtonian fluids like water.
The heating experiments of the first batch shows an increase of the consistency index in all
cases. According to Vu et al. (2004) heating of fruit and vegetables leads to texture
degradation due to pectin degradation. This cannot be seen at all but rather the opposite
happens in the first batch. After 10 and 60minutes at 100°C the consistency index has
increased from 11.04 to 12.42 and 15.76 respectively while the 90 minutes treatment at 120°C
causes a minor increase to 11.38. (Table 1)
The testing on the second batch was supposed to investigate whether the perceived difference
during the anthocyanin degradation experiments regarding consistency and the increased
amount of juice in the samples with ascorbic acid added to it had any foundation or was just a
coincidence. The sample with citric acid could to some extent be used as reference though
since it does not affect the anthocyanin content as shown earlier. When comparing these two
samples the one with ascorbic acid added is having a lower consistency index and the highest
flow behaviour index of any of the samples, 5.66 and 0.412 compared to 7.87 and 0.382. Both
of these samples had a lower consistency index than the raw sample but higher than the
sample treated at 80°C for 10minutes which has the biggest decrease of any samples, from
8.80 to 4.48. (Table 1) The results from batch 2 are consistent with the proposed theory.
Sample K n R2
Blackcurrants raw Batch 1 11.04 0.258 0.98
Blackcurrants raw Batch 2 8.80 0.344 0.98
Bilberries raw 6.27 0.289 0.96
Blackcurrants Batch 2 80°C 10min 4.48 0.382 0.97
Blackcurrants Batch 2 80°C 60min 4% CA (w/w) 7.87 0.382 0.98
Blackcurrants Batch 2 80°C 60min 4% AA (w/w) 5.66 0.412 0.99
Blackcurrants Batch 1 100 °C 10min 12.42 0.316 0.97
Blackcurrants Batch 1 100 °C 60min 15.76 0.299 0.97
Blackcurrants Batch 1 120 °C 90min 11.38 0.303 0.96 Table 1
A possible explanation for the increases at higher temperatures is the fact that they yielded
more purée and less pomace, i.e. there were less seeds and skin left on the filter from the same
amount of berry, possibly due to increased degradation. If more of the pectin is degraded into
smaller molecules it might cause the smaller parts to be included in the purée instead of
staying in the pomace part and thereby increase the consistency of the purée. This could still

35
be the case for the longer treatment at 120°C but it might has degraded the cell walls even
more and hence a lower consistency index again.
The main problem with these experiments is the fact that it is not rheology of the berries
themselves that are being measured but rather the purée that have been extracted. The
measuring system used, Bob and Cup, required the removal of seeds and skin from the sample
since their inclusion would have made any accurate measurements impossible.
The measuring system using a vane is often used in industry for measurements on fruit and
berries but this was not possible during this project. This is because of the large sample
volume required by the vane measurement system which was not possible to produce with the
experimental equipment used during the project since the equipment was already at maximum
capacity when producing samples for the Bob and Cup system. Oscillatory tests could not be
used either since it was not possible to keep the purée in place between the cone and plate.
Figure 23 The correlation (or rather lack of) between the consistency and anthocyanin content
It was during the viscosity tests the first batch of berries ran out and it became clear that the
berries behaved quite differently from each other. Initial trials with a Bostwick consistometer
did not yield any real results since the raw blackcurrant mash at the volumes suitable for
treatment simply did not flow after an initial release and 2-5 second movement that is best
described as a collapse. Leaving the sample with the hatch opened did not cause any
additional movement even if left standing for up to half an hour. A microspatula used for
taking samples could also be left standing upright in the beaker with raw blackcurrant mash.
This was also true for the second batch of blackcurrants but to a lesser extent in the case of the
standing microspatula which could not withstand being tilted slightly as in the first batch.
Further experiments with the Bostwick consistometer included using purée and dilution with
water but neither was deemed to be useful since the volume of obtained purée was too small
for it to flow when the hatch opened and the water dilution required was so big so it had little
or no resemblance of the blackcurrant mash of interest.
Earlier studies at SIK had not shown these difficulties in obtaining good purée samples from
bilberries for testing in the Stresstech so the behaviour of the bilberry mash in the Bostwick
consistometer and ability to keep a microspatula standing was tested as well. The bilberry
mash behaved more like a fluid and flowed to the end of the consistometer and could not keep
the microspatula upright. The reasons for these differences between the blackcurrants and the
K vs anthocyanin concentration
0
5
10
15
20
0 1 2 3 4 5 6
mg anthocyanin/g blackcurrant
K

36
bilberries are not fully known but are believed to be attributed to the higher pectin content and
at to some extent the bigger seeds and harder skin of the blackcurrants which was left as
pomace after purée extraction. In contrast there was hardly any pomace left from the bilberries
after the sieving.

37
Conclusions and future work
In this master thesis it has been shown that the anthocyanin content in complex food systems,
like berries, are degraded exponentially when heated and that the degradation is dependent on
the temperature. The degradation was not affected by the initial amount of anthocyanin
present in the blackcurrants which indicates that a generalised model for anthocyanin
degradation by heating can be used to predict degradation of anthocyanins during processing
or storage at elevated temperatures in the future. It was also concluded that the degradation
differs between blackcurrants and bilberries but that the results from separate measurements
can be used to calculate anthocyanin content in combined products.
Furthermore it was shown that a low pH (below 3) during cooking is important to prevent
anthocyanin degradation and that even a small increase in pH to pH 4 before cooking causes
irreversible degradation of anthocyanin and a further increase will only exacerbate the
process.
Other notable results include the increased degradation of anthocyanin by ascorbic acid in
complex systems and protection of anthocyanin by addition of 50% glucose to the mash.
Regarding the colour experiments it has been shown that the colour is affected by the
anthocyanin degradation but no clear correlation could be found. More advanced equipment
might improve the results but since simplicity and mobility was desired it was not investigated
in this project.
The rheological studies showed no correlation between textural properties and anthocyanin
content.
For future work it might be interesting to investigate if the antioxidant effect is affected when
the anthocyanins are degraded. Other processing methods than heating such as microwave or
high pressure treatments could also be investigated for their effects on the anthocyanin
content. Furthermore it might be interesting to study individual anthocyanins with HPLC to
see if there are any differences in their degradation pattern and stability during processing
with different methods.
Acknowledgements
I would like to thank Camilla Öhgren and Maud Langton at SIK, Göteborg, for being my
supervisors and assisting me throughout the thesis. I would also like to thank the staff at
Structure and Material Design at SIK for their help and support during my time there. Last by
not least I would like to thank Marie Alminger at Chalmers for being my examinator.

38
References
Bell, D. R. & Gochenaur K. (2006). Direct Vasoactive and Vasoprotective Properties of
Anthocyanin-rich Extracts Journal of Applied Physiology 100 1164-1170.
Castañeda-Ovando, A, de Lourdes Pacheco-Hernández, M, Elena Páez-Hernández, M,
Rodríguez, J. A. & Galán-Vidal A. (2009). Chemical Studies of Anthocyanins: A review
Food Chemistry 113 859-871.
Chalker-Scott, L. (1999). Environmental Significance of Anthocyanins in Plant Stress
Responses Photochemistry and Photobiology, 70, 1-9.
Cooper-Driver, G. A. (2001). Contributions of Jeffrey Harborne and Co-workers to the Study
of Anthocyanins Phytochemistry 56 229-236.
Coultate, T.P. (2002). Food, the Chemistry of its Components, Cambridge: The Royal Society
of Chemistry
Ding, M. Feng, R. Wang, S.Y. Bowman, L. Lu, Y. Qian, Y. Castranova, V. Jiang, B-H. and
Shi, X. (2006). Cyanidin-3-glucoside, a Natural Product Derived from Blackberry, Exhibits
Chemopreventive and Chemotherapeutic Activity The Journal of Biological Chemistry Vol
281 17359-17368.
De Rosso, V. V. and Mercadente, A. Z. (2007). The high ascorbic acid content is the main
cause of the low stability of anthocyanin extracts from acerola Food Chemistry Vol 103 935-
943.
Encyclopaedia Britannica Online (2009). ”currant” [retrieved 2009-09-17] available at
www.britannica.com
Francis, F.L. (1995). Quality as influenced by colour Food Quality and Preference 149-155.
Grace, M. H. Ribnicky, D. M. Kuhn, P. Poulev, A. Logendra, S. Yousef, G. G. Raskin, I. and
Lila, M. A. (2009). Hypoglycemic Activity of a Novel Anthocyanin-rich Formulation from
Lowbush Blueberry, Vaccinium angustifolium Aiton Phytomedicine 16 406-415.
GRO, Gröna Näringens Riksorganisation, GROs Bärsektion, Svensk Odling, [retreived 2009-
09-17] available at www.gro.se
Hager, A. Howard, L. R. Prior, R. L. and Brownmiller, C. (2008). Processing and Storage
Effects on Monomeric Anthocyanins, Percent Polymeric Colour, and Antioxidant Capacity of
Processed Black Raspberry Products, Journal of Food Science, 73 H134-H140.
Hamilton, W. D. and Brown, S. P. (2001). Autumn Tree Colours as a Handicap Signal
Proceedings: Royal Society. Biological Sciences Vol. 268, No. 1475 pp. 1489-1493.
Harbourne, N. Jacquier, J.C. Morgan, D.J. and Lyng, J.G. (2008). Determination of the
degradation kinetics of anthocyanins in a model juice system using isothermal and non-
isothermal methods Food Chemistry Vol. 111 204-208.
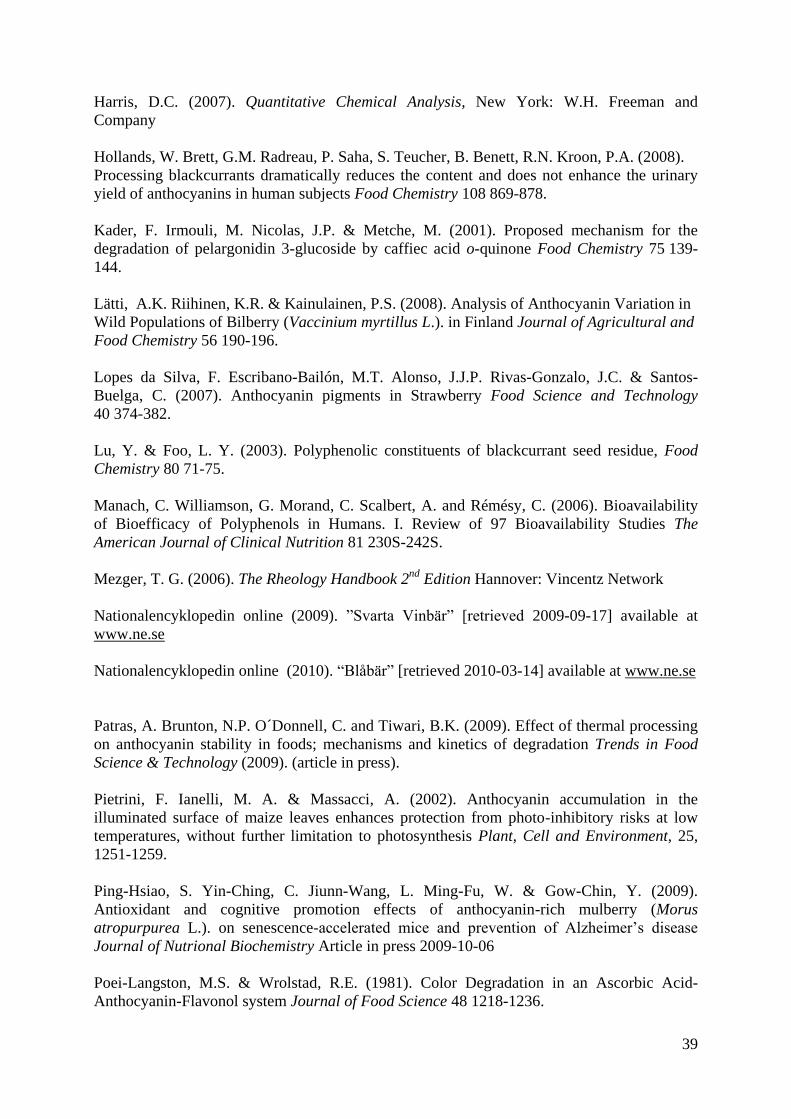
39
Harris, D.C. (2007). Quantitative Chemical Analysis, New York: W.H. Freeman and
Company
Hollands, W. Brett, G.M. Radreau, P. Saha, S. Teucher, B. Benett, R.N. Kroon, P.A. (2008).
Processing blackcurrants dramatically reduces the content and does not enhance the urinary
yield of anthocyanins in human subjects Food Chemistry 108 869-878.
Kader, F. Irmouli, M. Nicolas, J.P. & Metche, M. (2001). Proposed mechanism for the
degradation of pelargonidin 3-glucoside by caffiec acid o-quinone Food Chemistry 75 139-
144.
Lätti, A.K. Riihinen, K.R. & Kainulainen, P.S. (2008). Analysis of Anthocyanin Variation in
Wild Populations of Bilberry (Vaccinium myrtillus L.). in Finland Journal of Agricultural and
Food Chemistry 56 190-196.
Lopes da Silva, F. Escribano-Bailón, M.T. Alonso, J.J.P. Rivas-Gonzalo, J.C. & Santos-
Buelga, C. (2007). Anthocyanin pigments in Strawberry Food Science and Technology
40 374-382.
Lu, Y. & Foo, L. Y. (2003). Polyphenolic constituents of blackcurrant seed residue, Food
Chemistry 80 71-75.
Manach, C. Williamson, G. Morand, C. Scalbert, A. and Rémésy, C. (2006). Bioavailability
of Bioefficacy of Polyphenols in Humans. I. Review of 97 Bioavailability Studies The
American Journal of Clinical Nutrition 81 230S-242S.
Mezger, T. G. (2006). The Rheology Handbook 2nd
Edition Hannover: Vincentz Network
Nationalencyklopedin online (2009). ”Svarta Vinbär” [retrieved 2009-09-17] available at
www.ne.se
Nationalencyklopedin online (2010). “Blåbär” [retrieved 2010-03-14] available at www.ne.se
Patras, A. Brunton, N.P. O´Donnell, C. and Tiwari, B.K. (2009). Effect of thermal processing
on anthocyanin stability in foods; mechanisms and kinetics of degradation Trends in Food
Science & Technology (2009). (article in press).
Pietrini, F. Ianelli, M. A. & Massacci, A. (2002). Anthocyanin accumulation in the
illuminated surface of maize leaves enhances protection from photo-inhibitory risks at low
temperatures, without further limitation to photosynthesis Plant, Cell and Environment, 25,
1251-1259.
Ping-Hsiao, S. Yin-Ching, C. Jiunn-Wang, L. Ming-Fu, W. & Gow-Chin, Y. (2009).
Antioxidant and cognitive promotion effects of anthocyanin-rich mulberry (Morus
atropurpurea L.). on senescence-accelerated mice and prevention of Alzheimer’s disease
Journal of Nutrional Biochemistry Article in press 2009-10-06
Poei-Langston, M.S. & Wrolstad, R.E. (1981). Color Degradation in an Ascorbic Acid-
Anthocyanin-Flavonol system Journal of Food Science 48 1218-1236.

40
Rubinskiene, M. Viskelis, P. Jasutiene, I. Viskeliene, R. and Bobinas, C. (2005). Impact of
various factors on the composition and stability of black currant anthocyanins Food Research
International 38 867-871.
Toki, K. Saito, N. Irie, Y. Tatsuzawa, F. Shigihara, A. and Honda, T. (2007). 7-O-Methylated
anthocyanidins glycosides from Catharanthus roseus, Phytochemistry 69 1215-1219
Vu T.S, Smout C, Sila D.N, LyNguyen B, Van Loye A.M.L. & Hendrickx M.E.G. (2003).
Effect of preheating on thermal degradation kinetics of carrot texture Innovative Food Science
& Emerging Technologies vol 5 37-44.
Winefield, C. (2009)., Anthocyanins: Biosynthesis, Functions and Applications, New York:
Springer-Verlag New York
Yoshida, K. Kitahara, S. Ito, D. and Kondo, T. (2006). Ferric Ions Involved in the Flower
Color Development of the Himalayan Blue Poppy, Meconopsis grandis Phytochemistry
67 992-998.
Wu, X. & Prior, R.L. (2005). Identification and Characterization of Anthocyanins by High-
Performance Liquid Chromatography−Electrospray Ionization−Tandem Mass Spectrometry in
Common Foods in the United States: Vegetables, Nuts, and Grains Journal of Agricultural
and Food Chemistry 53 3101-3113.
Yue, X. .& Xu, Z. (2008). Changes of Anthocyanins, Anthocyanidins and Antioxidant
Activity in Bilberry Extract during Dry Heating Journal of Food Science 73 494-499.

41
Appendix
Appendix 1
Figure 24
A few experiments were made to determine the time needed to reach the desired temperature
in the vials in the glycerol bath. By inserting a thermometer into the vial through the cap the
temperature could be measured continuously. For 100 degrees and blackcurrants the profile
can be seen in figure 23. The standard deviation during the 4 tests was less than one degree at
each 60second interval and can hardly be seen at this scale. In figure 24 the same tests on
bilberries is shown and the difference was only 60seconds.
Figure 25 Temperature changes over time in 2 different bilberry mash samples in 100°C glycerol. At t=360s the
samples was transferred into ice baths for passive cooling.
0
20
40
60
80
100
120
0 60 120 180 240 300 360
Te
mp
(°C
)
Time (s)
0102030405060708090
100
0 100 200 300 400 500
Te
mp
(°C
)
Time s)
Heating and cooling of bilberry mash
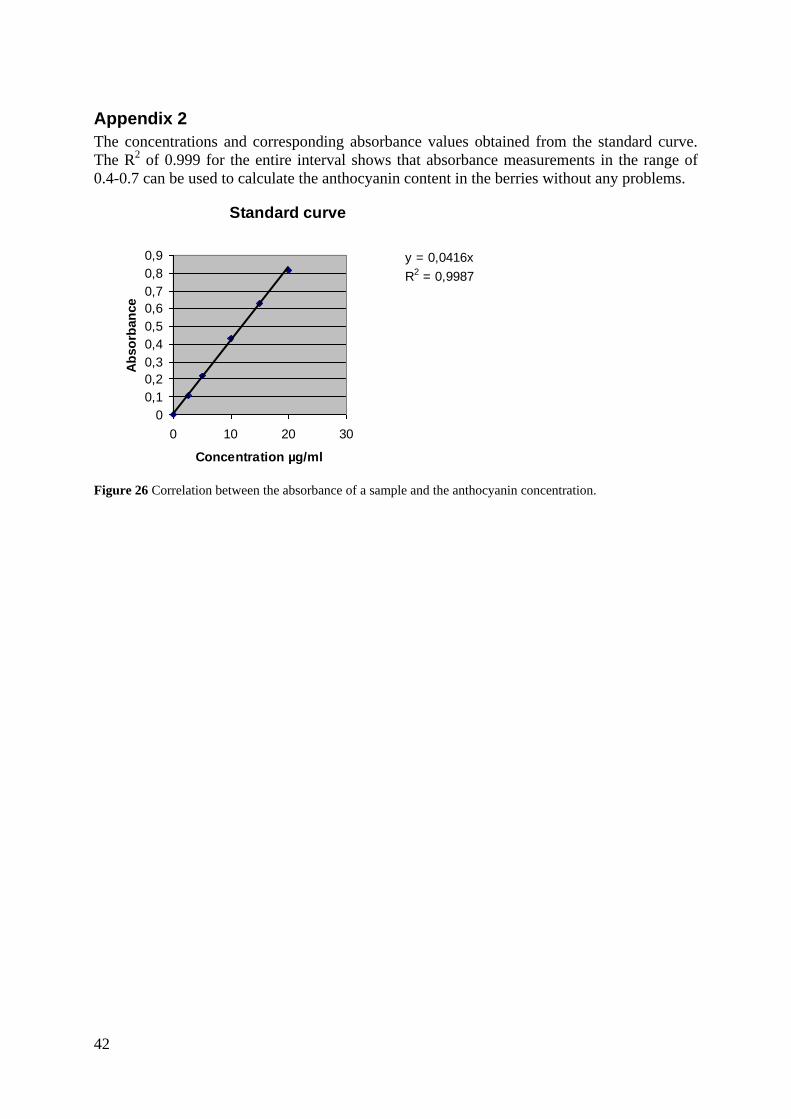
42
Appendix 2
The concentrations and corresponding absorbance values obtained from the standard curve.
The R2 of 0.999 for the entire interval shows that absorbance measurements in the range of
0.4-0.7 can be used to calculate the anthocyanin content in the berries without any problems.
Figure 26 Correlation between the absorbance of a sample and the anthocyanin concentration.
Standard curve
y = 0,0416x
R2 = 0,9987
0
0,1
0,2
0,3
0,4
0,5
0,6
0,7
0,8
0,9
0 10 20 30
Concentration µg/ml
Ab
so
rban
ce


![Genetic Dissection of a Major Anthocyanin QTL Contributing ... · anthocyanin (pink) pigment was estimated as [(R + B)/2] 2 G. QTL affecting anthocyanin concentration in the backcross](https://static.fdocuments.net/doc/165x107/5e6421962a91715ff42dfa60/genetic-dissection-of-a-major-anthocyanin-qtl-contributing-anthocyanin-pink.jpg)