Capital structure: profitability, earnings volatility and ...

EFFECTS OF WORKING CAPITAL MANAGEMENT ON PROFITABILITY OF
SUGAR MANUFACTURING FIRMS IN KENYA
BY
CHEMIS KIPTOO PHILIP
A RESEARCH PROJECT SUBMITTED IN PARTIAL FULFILMENT OF THE
REQUIREMENTS FOR THE AWARD OF THE DEGREE IN MASTER OF
BUSINESS ADMINISTRATION DEGREE (FINANCE OPTION), SCHOOL OF
BUSINESS, UNIVERSITY OF NAIROBI
NOVEMBER, 2015

ii
DECLARATION
This research project is my original work and has not been submitted for a degree award
in any other University.
Sign___________________________ Date________________________
CHEMIS KIPTOO PHILIP
D61/69565/2013
This is to certify that this research project has been submitted with my approval as the
university supervisors,
Sign___________________________ Date________________________
Dr. Duncan Elly Ochieng, PhD, CIFA
Department of Finance and Accounting,
School of Business, University of Nairobi

iii
DEDICATION
I dedicate this study to my family and friends for their unending love, support and
prayers.

iv
ACKNOWLEDGEMENTS
I wish to thank the Almighty God for his favour, mercy, provision and protection
throughout this journey. Indeed, you appoint time for each and every success. Thank you
for seeing me through
I wish to profoundly thank my Supervisor, Dr. Duncan Elly and my Moderator Dr. Iraya
for their steadfast support, guidance and encouragement during the entire period. My
gratitude goes to all my lecturers who successfully took me through the course units and
in the same breadth provided advice that proved invaluable in achieving my goals
Special thanks are extended to my parents, family and friends for their endurance,
unfailing support, continued encouragement, and understanding.

v
TABLE OF CONTENTS
DECLARATION............................................................................................................... ii
DEDICATION.................................................................................................................. iii
ACKNOWLEDGEMENTS ............................................................................................ iv
LIST OF TABLES ......................................................................................................... viii
LIST OF ABBREVIATIONS ......................................................................................... ix
ABSTRACT ....................................................................................................................... x
CHAPTER ONE: INTRODUCTION ............................................................................. 1
1.1 Background of the Study .............................................................................................. 1
1.1.1 Firm Profitability ................................................................................................. 2
1.1.2 Working Capital Management ............................................................................. 3
1.1.3 Working Capital Management and Firm Profitability ......................................... 4
1.1.4 Sugar Manufacturing Firms in Kenya .................................................................. 5
1.2 Research Problem ......................................................................................................... 7
1.3 Objectives of the Study ................................................................................................. 9
1.3.1 General Objective ................................................................................................ 9
1.3.2 Specific Objectives .............................................................................................. 9
1.4 Significance of the Study ............................................................................................ 10
CHAPTER TWO: LITERATURE REVIEW .............................................................. 11
2.1 Introduction ................................................................................................................. 11
2.2 Theoretical Literature .................................................................................................. 11
2.2.1 Agency Theory................................................................................................... 11
2.2.2 Risk Return Trade off Theory ............................................................................ 12
vi
2.3 Determinants of Firm Performance ............................................................................ 13
2.3.1 Competition........................................................................................................ 13
2.3.2 Customers .......................................................................................................... 14
2.3.3 Innovation and Development ............................................................................. 14
2.3.4 Corporate Governance ....................................................................................... 15
2.4 Empirical Review ........................................................................................................ 15
2.5 Summary and Research Gaps ..................................................................................... 23
CHAPTER THREE: RESEARCH METHODOLOGY ............................................. 25
3.1 Introduction ................................................................................................................. 25
3.2 Research Design.......................................................................................................... 25
3.3 Population of the Study ............................................................................................... 25
3.4 Data Collection ........................................................................................................... 26
3.5 Data Analysis and Presentation .................................................................................. 26
CHAPTER FOUR: DATA ANALYSIS, RESULTS AND DISCUSSION ................ 29
4.1 Introduction ................................................................................................................. 29
4.2 Descriptive Statistics ................................................................................................... 29
4.3 Diagnostic Statistics – Test for Normality and Colinearity ........................................ 31
4.4 Correlation Analysis ................................................................................................... 31
4.5 Working Capital Management and Profitability ......................................................... 34

vii
CHAPTER FIVE: CONCLUSIONS AND RECOMMENDATIONS ....................... 37
5.1 Introduction ................................................................................................................. 37
5.2 Summary of Findings .................................................................................................. 37
5.3 Recommendations ....................................................................................................... 38
5.4 Limitations of the Study.............................................................................................. 39
5.5 Suggestions for Further Research ............................................................................... 39
REFERENCES ................................................................................................................ 41
APPENDICES ................................................................................................................ 46
Appendix I: Letter of Introduction .................................................................................... 46
Appendix II: Data Collection Sheet .................................................................................. 47
Appendix III: Average Data .............................................................................................. 48

viii
LIST OF TABLES
Table 4.1: Descriptive Statistics ....................................................................................... 30
Table 4.2 Correlations ....................................................................................................... 33
Table 3: Multiple Regression Analysis Results ................................................................ 35
Table 4: Regression Model Summary Statistics ............................................................... 36

ix
LIST OF ABBREVIATIONS
2SLS - Two Stage Least Squares
ACP - Average Collection Period
APP - Average Payment Period
CCC - Cash Conversion Cycle
CR - Current Ratio
CS - Company Size
DR - Debt Ratio
DSL - Sugar Development Levy
EOQ - Economic Order Quantity
GOK - Government of Kenya
ITID - Inventory Turnover in Days
JIT - Just in Time
KESGA - Kenya Sugar Cane Growers Association
KESREF - Kenya Sugar Research Foundation
KSB - Kenya Sugar Board
MOA - Ministry of Agriculture
NWC - Net Working Capital
OLS - Ordinary Least Squares
ROA - Return on Assets
ROI - Return on Investment
SMEs - Small and Medium Size Enterprises
SUCAM - Sugar Campaign for Change
WC - Working Capital
WCM - Working Capital Management

x
ABSTRACT
Working capital management plays a vital role in the success of businesses because of its
effect on profitability and liquidity. The purpose of this study is to examine the effect of
working capital management variables including the Average collection period, Inventory
turnover in days, Average payment period, Cash conversion cycle and Current ratio on
the Net operating profitability of Sugar Manufacturing firms in Kenya. Debt ratio, size of
the firm (measured in terms of natural logarithm of sales) and financial assets to total
assets ratio have been used as control variables. The study used secondary data collected
from 8 Sugar Manufacturing firms in Kenya covering the period from 2008-2013. Using
Pearson’s correlation and regression analysis, the study finds a significantly negative
relationship between variables of the working capital management and profitability of
Sugar Manufacturing firms in Kenya. It means that as the cash conversion cycle increases
it will lead to decreasing profitability of the firm, and managers can create a positive
value for the shareholders by reducing the cash conversion cycle to a possible minimum
level. The study suggests that managers can create value for their shareholders by
increasing their inventories to reasonable levels and also reducing accounts receivable
period. It is further recommended that, scope for further research may be extended to the
individual working capital components including cash, marketable securities and
receivables.

1
CHAPTER ONE
INTRODUCTION
1.1 Background of the Study
Business entities exist for purposes of enhancing owners’ investment value. Realization
of this objective requires soberness in financial strategy and entrenchment of responsive
adoption systems. As a result, a firm is required to maintain a balance between liquidity
and profitability while conducting its day to day operations. Liquidity is a precondition to
ensure that a firm is able to meet its short-term obligations and its continued flow can be
guaranteed from a profitable venture (Gitman, 2005).
Working capital in accounting and financial statement analysis is defined as the firm’s
short-term or current assets and current liabilities. Net working capital represents the
excess of current assets over current liabilities and is an indicator of the firm’s ability to
meet its short term financial obligations (Brealey & Myers, 2002). Effective working
capital management consists of applying the methods which remove the risk and lack of
ability in paying short term commitments in one side and prevent over investment in
these assets in the other side by planning and controlling current assets and liabilities
(Lazaridis & Tryfonidis, 2006).
The Working Capital Management of a firm in part affects its profitability. The ultimate
objective of any firm is to maximize the profit. But, preserving liquidity of the firm is an
important objective too. The problem is that increasing profits at the cost of liquidity can
bring serious problems to the firm (Shin & Soenen, 1998). Therefore, there must be a
trade- off between these two objectives of the firms. One objective should not be at cost

2
of the other because both have their importance. If we do not care about profit, we cannot
survive for a longer period. On the other hand, if we do not care about liquidity, we may
face the problem of insolvency or bankruptcy. For these reasons working capital
management should be given proper consideration and will ultimately affect the
profitability of the firm. Firms may have an optimal level of working capital that
maximizes their value (Afza & Nazir, 2009). Working Capital Management has its effect
on liquidity as well as on profitability of the firm. The study intends to analyze the
relationship between different variables of working capital management including the
Average collection period, Inventory turnover in days, Average payment period, Cash
conversion cycle and the gross operating profit. Debt ratio, size of the firm (measured in
terms of natural logarithm of sales) and sales growth will be used as control variables.
1.1.1 Firm Profitability
Profitability is the primary goal of all business ventures. Without profitability the
business will not survive in the long run. So measuring current and past profitability and
projecting future profitability is very important (Hofstrand, 2013). A company’s
profitability is the ability of a business to earn a profit. A profit is what is left of the
revenue a business generates after it pays all expenses directly related to the generation of
the revenue, such as producing a product, and other expenses related to the conduct of the
business' activities. (Hofstrand, 2013)
Efficient utilization of the firm’s resources and better management of receivables means
that firms’ management should find effective and efficient ways to deal with the cash
available for the day-to-day operations in order to achieve the optimum impact. Good

3
working capital management leads to increased cash flows, and thus leads to lesser need
on external financing therefore; the probability of default for the firm is reduced
(Deloof, 2003)
A company’s profitability is an essential measure to management as it is an outcome
which has been achieved by an individual or a group of individuals in an organization
related to its authority and responsibility, not against the law, and conforming to the
morale and ethic. Such profitability is the function of the ability of an organization to
gain and manage the economic resources in several different ways to develop competitive
advantage (Hansen & Mowen, 2005).
1.1.2 Working Capital Management
WCM ensures that organizations have the ability to meet their short-term liabilities
adequately and on time. This further makes it possible to curb the situation where firms
have accumulated idle resources which may not generate any income or prevent
unavailability of sufficient financial resources needed for meeting short-term financial
obligations (Akoto, Awunyo & Angwor, 2103). Thus, this therefore explains why it is
often argued that efficient WCM is very crucial in achieving the over-arching goal of the
firm, which is shareholders value maximization. The importance of efficient WCM by
Sugar manufacturing firms in Kenya cannot be over emphasized as this is extremely
needed to boost profitability and increase expansion, which are pre-requisites in solving
the country’s unemployment issues and ensuring economic stability.

4
Working capital is regarded as the result of the time lag between the expenditure for the
purchase of raw material and the collection for the sale of the finished goods. The way of
managing working capital can have a significant impact on both the liquidity and
profitability of the company (Shin & Soenen, 1998). The main purpose of any firm is to
maximize profit. But, maintaining liquidity of the firm also is an important objective. The
problem is that increasing profits at the cost of liquidity can bring serious problems to the
firm. Thus, strategy of firm must maintain a balance between these two objectives of the
firms. Dilemma in working capital management is to achieve desired tradeoff between
liquidity and profitability (Smith, 1980; Raheman & Nasr, 2007).
1.1.3 Working Capital Management and Firm Profitability
Working capital management plays a significant role in improved profitability of firms.
Firms can achieve optimal management of working capital by making the trade-off
between profitability and liquidity. Working capital management is the ability to control
effectively and efficiently the current assets and current liabilities in a manner that
provides the firm with maximum return on its assets and minimizes payments for its
liabilities (Raheman & Nasr, 2007).
Working capital management efficiency is vital especially for manufacturing firms,
where a major part of assets is composed of current assets (Horne & Wachowitz, 2000).
It directly affects the profitability and liquidity of firms (Raheman & Nasr, 2007). The
profitability liquidity tradeoff is important because if working capital management is not
given due considerations then the firms are likely to fail and face bankruptcy (Kargar &
Bluementhal, 1994). The significance of working capital management efficiency is

5
irrefutable (Filbeck & Krueger, 2005). Working capital is known as life giving force for
any economic unit and its management is considered among the most important function
of corporate management. Every organization whether, profit oriented or not, irrespective
of size and nature of business, requires necessary amount of working capital. Working
capital is the most crucial factor for maintaining liquidity, survival, solvency and
profitability of business (Mukhopadhyay, 2004).
Working capital management is one of the most important factors while making the
liquidity and profitability comparisons among firms (Eljelly, 2004), involving the
decision of the amount and composition of current assets and the financing of these
assets. The greater the relative proportion of liquid assets, the lesser the risk of running
out of cash, all other things being equal. All individual components of working capital
including cash, marketable securities, account receivables and inventory management
play a vital role in the performance of any firm.
1.1.4 Sugar Manufacturing Firms in Kenya
The sugar sub-sector is mainly concentrated in the western part of Kenya. These include
the populous provinces of Nyanza, Western and parts of Rift valley. Potential also exists
in the Eastern and Coastal belts (Sucam, 2003). Shortly after independence in 1963 the
government set up Muhoroni (1966), previously East African Sugar Company Ltd in
1961; Chemelil (1968); Mumias (1973); Nzoia (1978); South Nyanza (1979). Miwani
Sugar, started in 1922 as private investment, was taken over in 1970 by the regulator.
Private investment include: West Kenya Sugar, Soin Sugar Company, Kibos Sugar and
Allied Industries Ltd, Butali Sugar Company and Busia Sugar Company. Of the private
investments only Butali and West Kenya are presently in operation, the rest are proposed
6
or at varying stages of construction. At present, both Miwani and Muhoroni are under
receivership; only the latter is operational. According to Kenya Sugar Board (2005), the
state stake holding in the industry is: Miwani Sugar (49%); Muhoroni (82.78%);
Chemelil (97.64%); Nzoia (98.87%); South Nyanza (99.79%). The government has
divested in Mumias and Miwani, currently retaining 20 percent in the former, also the
sole firm presently listed at the Nairobi Stock Exchange. The large government
ownership makes the industry prone to state and political interference (Sucam, 2003).
The government oversees the sub-sector principally through the Ministry of Agriculture
(MoA) and the Kenya Sugar Board (KSB), the latter being made of representatives from
the state, sugar companies, farmers’ organization and general industry. The industry has
over 150 smaller, artisanal competing for cane with the regular factories (Harding, 2005).
Other related industries are: Agro-chemical and Food Company Limited started in the
early 1980s with some government stake holding. This scenario has stimulated growth of
rural infrastructure in feeder roads, transport services, spurring economic, educational,
medical and other social services and the expansion of other rural facilities, all vital to
western Kenya’s economic well-being. Despite these investments, self-sufficiency in
sugar has remained elusive over the years as consumption continues to outstrip supply.
Total sugar production grew from 368,970 tonnes in 1981 to 520,404 tonnes in 2007.
Domestic sugar consumption increased even faster, rising from 324,054 tonnes in 1981 to
741,190 tonnes in 2007(KSB Report, 2010).

7
The performance of the sugar industry has continued to be quite dismal. Kenya therefore
continues to live off its legacy of being self-sufficient in terms of sugar production.
According to sources from the Mumias Sugar Company, current production stands at
520,000 metric tonnes and consumption which has increased steadily over the last years
at 740,000 leaving the country with a deficit of 220,000 metric tonnes. From the list of
registered millers and jaggeries provided by the KSB, Muhoroni and Miwani Sugar
Company are currently under receivership. Muhoroni Sugar has been under receivership
for the last four years Ramisi Sugar Factory collapsed in 1988 was reviewed as KISCOL
(Kwale International Sugar Company Limited). The sugar manufacturing companies also
maintain nucleus estates to ensure there is enough supply of cane. Out growers scheme
on the other hand covers individuals or private sugar–cane farmers. Despite the existence
of nucleus estates, sugar companies still complain of sugar cane shortage a problem
which has also contributed to the production gaps in the industry (KSB Report, 2010).
1.2 Research Problem
The efficient management of working capital is very vital for a business survival. This is
premised on the fact that having too much capital signifies inefficiency where as too little
cash in hand signifies that the survival of the business is shaky. Most business
organizations do not hold the right amount of stocks, debtors and cash. Due to this reason
the firm is unable to meet its maturing short term obligations and its upcoming
operational needs. Lack of adequate working capital also means that a firm is unable to
undertake expansion projects and increase its sales, therefore limiting the growth and
profitability of the business (Oladipupo & Okafor, 2013).

8
Working capital management and management of sugar manufacturing firms in Kenya
have been encountering cash constraints and WCM challenges such as failure to meet
their operational needs i.e. failure to pay their workers salaries in time and other
operational requirements and thus reduced productivity through strikes and go slows
which generally affects firms performance and profitability (KSB Report, 2010). It is on
these facts that the study intends to find possible road maps to addressing the effect of
WCM challenges on profitability of sugar manufacturing firms in Kenya. Majority of
sugar manufacturing firms in Kenya have exhibited dwindling returns as well as poor
performance in the last several years. However, the extent to which working capital
management affects profitability of these firms is not well known. It is on this premise
that this study analysis the relationship between working capital management and the
firm’s operating profit (KSB Report, 2010).In this context, the objective of the current
study is to provide empirical evidences about the effect of working capital management
on profitability of Sugar manufacturing firms in Kenya for the 12 licensed sugar
manufacturing companies in Kenya during the period 2009–2013.
Working capital management (WCM) is very important for a firm to continue to exist,
because of its effects on a firm’s profitability and risk, and consequently its value (Smith,
1980). Working capital Management directly affects the liquidity and profitability of a
company (Rahman & Nasr, 2007). WCM is the day-to-day function of management of a
firm. Efficient WCM is very vital for the long-term endurance of a business. Due to
increase in cost of operations globally in current circumstances, management of working
capital has become more important for a firm survival. WCM is the indispensable
concern of all firms and it is very essential for all the firms to manage their working
capital effectively.

9
Efficient management of working capital plays an important role of overall firm
performance of Sugar manufacturing firms in Kenya in order to create shareholder value.
Working capital is regarded as the result of the time lag between the expenditure for the
purchase of raw material and the collection for the sale of the finished goods. The way of
managing working capital can have a significant impact on both the liquidity and
profitability of the company (Shin & Soenen, 1998). The main purpose of any firm is to
maximize profit. But, maintaining liquidity of the firm also is an important objective. The
problem is that increasing profits at the cost of liquidity can bring serious problems to the
firm. Thus, a firm must maintain a balance between these two objectives of the firms.
Dilemma in working capital management is to achieve desired tradeoff between liquidity
and profitability (Smith, 1980; Raheman & Nasr, 2007). It is on this dilemma that the
study intends to achieve the desired tradeoff between liquidity and profitability.
1.3 Objectives of the Study
1.3.1 General Objective
The general objective of the study was to examine the effect of working capital
management on the profitability of sugar manufacturing firms in Kenya.
1.3.2 Specific Objectives
Specifically, the study sought to examine the relationship between:
1. Average collection period and profitability of Sugar manufacturing firms in Kenya
2. Inventories turnover in days and profitability of Sugar manufacturing firms in Kenya.
3. Average payment period and profitability of Sugar manufacturing firms in Kenya.
4. Cash conversion cycle and profitability of Sugar manufacturing firms in Kenya.

10
1.4 Significance of the Study
The study’s findings will help the Sugar manufacturing firms in Kenya and other
companies in general improve on their financial decision making so as to optimize the
value of the shareholders and maintain a favorable trade- off between liquidity and
profitability. The findings will also be of great benefit to future researchers in the field of
working capital management in providing relevant literature in building up the course of
study. It will also benefit other scholars and students of finance who may use the findings
for academic purposes.
With working capital management playing a major role in financial stability of different
firms, its efficient utilization is necessary in achieving the goals of financial stability. The
study recommends ways through which working capital can be effectively utilized in
financial decision making. This effective utilization in the long run will increase wealth
of the shareholders.
The study findings will assist in policy formulation for the Sugar sector for operational
efficiency; it is also a key pillar to achieving vision 2030 and generally helps managers to
improve performance of the firm.

11
CHAPTER TWO
LITERATURE REVIEW
2.1 Introduction
This chapter discusses both the theoretical and empirical literature on the study’s
thematic areas. It presents a review of the literature on working capital management
which eventually enhances the firms’ profitability. Working capital management involves
the management of the most liquid resources of the firm which includes cash and cash
equivalents, inventories and Trade and other receivables with a view to enhance firms
profitability
2.2 Theoretical Literature
Working capital management involves the relationship between a firms short term assets
and its short term liabilities (Pandey, 2005).The goal of working capital management is to
ensure that a firm is able to continue its operations and that it has sufficient ability to
satisfy both maturing short term debt and upcoming operational expenses (Padachi,
2007). The management of working capital involves the management of inventories,
accounts receivable and payable and cash. Working capital refers to current assets and in
particular Cash, Debtors and Stocks (Manasseh, 2001).
2.2.1 Agency Theory
This is a relationship between principals and agents in business. It is concerned with
solving problems that can exist in agency relationship such as shareholders and company
executives. These problems arise when desires and goals of the principal and agent are in
conflict and the principal is unable to verify what the agent is actually doing (Bruce et al.,
2005).

12
According to Akoto, Awunyo-Vitor and Angmor (2013) analyzed the relationship
between working capital management practices and profitability of listed manufacturing
firms in Ghana. The study used data collected from annual reports of all the 13 listed
manufacturing firms in Ghana covering the period from 2005-2009. Using panel data
methodology and regression analysis, the study found significant negative relationship
between Profitability and Accounts Receivable Days. However, the firms’ Cash
Conversion Cycle, Current Asset Ratio, Size, and Current Asset Turnover significantly
positively influence profitability. The study suggests that managers can create value for
their shareholders by creating incentives to reduce their accounts receivable to 30 days. It
is further recommended that, enactments of local laws that protect indigenous firms and
restrict the activities of importers are eminent to promote increase demand for locally
manufactured goods both in the short and long runs in Ghana.
2.2.2 Risk Return Trade Off Theory
The theory assumes that every investor is rational and at a given level of risk they will
accept only the largest expected return. That is, given two investments at the exact same
level of risk, all other things being equal, every rational investor will invest in the one
that offers the higher return. The risk-return tradeoff is pervasive throughout finance
(Markowitz, 1990).
According to Almazari (2013) investigated the relationship between the working capital
management (WCM) and the firms’ profitability for the Saudi cement manufacturing
companies. The sample included 8 (eight) Saudi cement manufacturing companies listed
in the Saudi Stock Exchange for the period of 5 years from 2008-2012. Pearson Bivariate

13
correlation and regression analysis were used. The study results showed that Saudi
cement industry’s current ratio was the most important liquidity measure which effected
profitability, therefore, the cement firms must set a trade-off between these two
objectives so that, neither the liquidity nor profitability suffers. It was also found, as the
size of a firm increases, profitability increased. Besides, when the debt financing
increased, profitability declined. Linear regression tests confirmed a high degree of
association between the working capital management and profitability.
2.3 Determinants of Firm Performance
Firm Performance is a set of financial and nonfinancial indicators which offer
information on the degree of achievement of objectives and results Lebans & Euske
(2006) after Kaplan & Norton, (1992). To define the concept of firm performance is
necessary to know its elements characteristic to each area of responsibility. To report an
organization's performance level, it is necessary to be able to quantify the results. There
are a number of studies that have investigated various factors that have a critical role in
the success of an organization. The key elements of the model are:
2.3.1 Competition
Competition is rivalry in which everyone tries to get what other sellers are seeking at the
same time: sales, profit and market share by offering the best practicable combination of
price quality and service. Where the market information flows freely, competition plays a
regulatory function in balancing demand and supply (Porter, 1979). The main driver of
competition is the number and capability of competitors in the market. Many competitors,
offering undifferentiated products and services, will reduce market attractiveness.

14
Numerous studies have shown that financial indicators are most appropriate when the
competitive environment is characterized by a low level of uncertainty, the foundations
of the competition being less complex (Brownell, 1982; Govindarajan, 1984).
2.3.2 Customers
Customer (sometimes known as a client, buyer, or purchaser) is the recipient of a good,
service, product, or idea, obtained from a seller, vendor, or supplier for a monetary or
other valuable consideration (Juan, 1988)
The importance of customer orientation and its impact on firm performance has been
highlighted in numerous studies. Brady et al. (2002) demonstrated that customer
orientation is linked indirectly with organizational quality, customer satisfaction and
performance of the organization. Another study that had the same objective belongs to
Pinar et al. (2003). In this study, oriented toward Turkish companies, there were
significant differences between firms characterized by a greater orientation towards
customers and firms characterized by lower customer orientation. The first category of
firms, showed noticeably higher performance than the latter.
2.3.3 Innovation and Development
Innovation is a new idea, more effective device or process. Innovation can be viewed as
the application of better solutions that meet new requirements, in articulated needs, or
existing market needs. This is accomplished through more effective products, processes,
services, technologies, or ideas that are readily available to markets, governments and
society. The term innovation can be defined as something original and more effective
and, as a consequence, new, that "breaks into" the market or society (Drucker, 2005)

15
Kotler (2003) studied the relationship between innovation and performance, offering the
example of Sony, a leader in innovation that has significantly increased market share by
means of numerous new products to clients.
2.3.4 Corporate Governance
Gompers, Ishi and Metrick, (2003) demonstrated the existence of a positive relationship
between the quality of corporate governance and firm performance. Brown and Caylor,
(2009) have obtained similar results in their research which is an extension of the
research carried out by Gompers et al. Drobetz et al. (2004) also identified a positive
impact of corporate governance on the performance of German firms. In Japan, (Bauer et
al. 2008) using the database provided by GMI, showed that companies with better
governance are more efficient than companies with weaker governance by up to 15%
annually.
2.4 Empirical Review
Padachi, (2006) examined the trends in working capital management and its impact on
firms’ profitability. The results proved that a high investment in inventories and
receivables is associated with lower profitability. Further, he showed that inventory days
and cash conversion cycle had positive relation with profitability. On the other hand,
account receivables days and account payables days correlated negatively with
profitability. In another study, Dong and tyh-tay-su (2010) documented a study to find
out the relationship between working capital management and profitability. They
considered gross operating profitability as a dependent variable and account receivable
ratio in number of days, account payable ratio in number of days, inventory turnover ratio

16
in number of days, and cash conversion cycle as independent variables. Size of the firms,
debt ratio and fixed assets to total assets are control variables. They found that there is a
negative relationship between account receivable in number of days and inventory in
number of days and profitability. But there is positive relationship between account
payable in number of days and profitability.
The significance of working capital management efficiency is irrefutable. Business
success heavily depends on the ability of the financial managers to effectively manage
receivables, inventory, and payables (Filbeck and Krueger, 2005). Firms can decrease
their financing costs and raise the funds available for expansion projects by minimizing
the amount of investment tied up in current assets.
Mathuva (2010) in his study on the influence of working capital management on
corporate profitability found that there exists a highly significant negative relationship
between the time it takes for firms to collect cash from their customers and profitability.
He explained that the more profitable firms take the shortest time to collect cash from the
customers. The study further revealed that there exist a highly significant positive
relationship between the inventory conversion period and profitability. It was explained
that firms, which maintain sufficiently high inventory levels, reduce costs of possible
interruptions in the production process and loss of business due to scarcity and products.
Finally, the study established that there exists a highly significant positive significant
positive relationship between the average payment period and profitability. He held that
the longer a firm takes to pay its creditors, the more profitable it is. In this study, a
sample of 30 firms listed on Nairobi Stock Exchange for the periods 1993 to 2008 was
used. Both the ported OLS and the fixed effects regression models were used.

17
Garcia-Teruel and Martinez-Solano (2007) collected a panel of 8,872 small to medium-
sized enterprises (SMEs) from Spain and tested the effects of working capital
management on SME profitability using the panel data methodology. The results
demonstrated that managers could create value by reducing their inventories and the
number of days for which their accounts are outstanding.
Large inventory and a generous trade credit policy may lead to high sales. Larger
inventory reduces the risk of a stock-out. Trade credit may stimulate sales because it
allows customers to assess product quality before paying (Deloof & Jegers, 1996).
Another component of working capital is accounts payable. Delaying payments to
suppliers allows a firm to assess the quality of bought products, and can be an
inexpensive and flexible source of financing for the firm. On the other hand, late payment
of invoices can be very costly if the firm is offered a discount for early payment. Deloof
(2003) established that most firms had a large amount of cash invested in working
capital. It can therefore be expected that the way in which working capital is managed
will have a significant impact on profitability of those firms. Using correlation and
regression tests he found a significant negative relationship between gross operating
income and the number of days accounts receivable, inventories and accounts payable of
Belgian firms. On the basis of these results he suggested that managers could create value
for their shareholders by reducing the number of days' accounts receivable and
inventories to a reasonable minimum. The negative relationship between accounts
payable and profitability is consistent with the view that less profitable firms wait longer
to pay their bills.

18
Rahman and Mohamed (2007) studied the effect of different variables of working capital
management including average collection period, inventory turnover in days, average
payment period, cash conversion cycle, and current ratio on the net operating profitability
of Pakistani firms. They found that as the cash conversion cycle increases, it leads to
decreasing profitability of the firm and managers can create a positive value for the
shareholders by reducing the cash conversion cycle to a possible minimum level.
Falope and Ajilore (2009) utilized panel data econometrics in a pooled regression, where
time-series and cross-sectional observations were combined and estimated. They found a
significant negative relationship between net operating profitability and the average
collection period, inventory turnover in days, average payment period and cash
conversion cycle for a sample of fifty Nigerian firms listed on the Nigerian Stock
Exchange.
Christopher and Kamalevalli’s (2011) study, the independent variables used were current
ratio, quick ratio, inventory turnover ratio, working capital turnover ratio, debtor’s
turnover ratio, ratio of current asset to total asset, ratio of current asset to operating
income, comprehensive liquidity index, net liquid balance size and leverage and growth
while dependent variable (profitability) was measured in terms of return on investment
(ROI). From multiple regression analysis, negative association with ROI was established
in current ratio, cash turnover ratio, current asset to operating income and leverage. On
the other hand, positive association with ROI is in quick ratio, debtor’s turnover ratio,
current asset to total asset and growth rate. In another study, Gameson (2007) analyzed
impact of working capital management upon the performance of firms in Telecom

19
industry. The variables used were, days sales outstanding, number of days for payment to
vendors, average days inventory held, cash conversion efficiency, revenue to total assets,
revenue to total sales, etc. Findings revealed negative & insignificant
Raheman, Afza, Qayyum and Bodla (2010) analyzed the impact of working capital
management on firm’s performance in Pakistan for the period 1998 to 2007. For this
purpose, balanced panel data of 204 manufacturing firms was used which are listed on
Karachi Stock Exchange. The results indicate that the cash conversion cycle, net trade
cycle and inventory turnover in days are significantly affecting the performance of the
firms. They concluded that manufacturing firms were in general facing problems with
their collection and payment policies. Moreover, financial leverage, sales growth and
firm size also had significant effect on the firm’s profitability. They study recommended
that effective policies must be formulated for the individual components of working
capital.
Eljelly (2004) elucidated that efficient liquidity management involves planning and
controlling current assets and current liabilities in such a manner that eliminates the risk
of inability to meet due short-term obligations and avoids excessive investment in these
assets. The relation between profitability and liquidity was examined, as measured by
current ratio and cash gap (cash conversion cycle) on a sample of joint stock companies
in Saudi Arabia using correlation and regression analysis. The study found that the cash
conversion cycle was of more importance as a measure of liquidity than the current ratio
that affects profitability. The size variable was found to have significant effect on
profitability at the industry level. Garcia-Teruel and Martinez-Solano (2007) also
established that shortening the cash conversion cycle improves the firm's profitability.

20
Ghosh and Maji (2003) in their paper made an attempt to examine the efficiency of
working capital management of the Indian cement companies during 1992 - 1993 to 2001
- 2002. For measuring the efficiency of working capital management, performance,
utilization, and overall efficiency indices were calculated instead of using some common
working capital management ratios. Setting industry norms as target efficiency levels of
the individual firms, this paper also tested the speed of achieving that target level of
efficiency by an individual firm during the period of study. Findings of the study
indicated that the Indian Cement Industry as a whole did not perform remarkably well
during this period.
In another study by Lyroudi and Lazaridis (2000), food industry in Greece was used to
examine the cash conversion cycle as liquidity indicator of the firms and characteristics
with its components variable and investigate the implication of C.C.C in terms of
profitability. Indebtedness and firm’s size indicate that there is a significant positive
relationship between C.C.C and net profit margin but had no linear relationship with
leverage ratios conversely the debt to equity ratio and a positive one with time interest
earned ratio, and finally there is no difference between liquidity ratios of large and small
firms.
A popular measure of Working Capital Management (WCM) is the cash conversion
cycle, i.e. the time lag between the expenditure for the purchases of raw materials and the
collection of sales of finished goods. The longer this time lag, the larger the investment in
working capital (Deloof, 2003). A longer cash conversion cycle might increase
profitability because it leads to higher sales. However, corporate profitability might also

21
decrease with the cash conversion cycle, if the costs of higher investment in working
capital rise faster than the benefits of holding more inventories and/or granting more
trade credit to customers. This discussion of the importance of working capital
management, its different components and its effects on profitability leads us to the
problem statement which the researcher will be analyzing.
Singh and Pandey (2008) had an attempt to study the working capital components and the
impact of working capital management on profitability of Hindalco Industries Limited for
period from 1990 to 2007. Results of the study showed that current ratio, liquid ratio,
receivables turnover ratio and working capital to total assets ratio had statistically
significant impact on the profitability of Hindalco Industries Limited.
Hayajneh (2011), did a study on the impact of working capital efficiency on profitability
of Jordanian Manufacturing firms analyzed the panel data through descriptive statistics,
Pearson correlation coefficients, ordinary least squares (OLS) and two stage least squares
(2SLS) regressions model. The results of study found a negative significance relationship
between profitability and the average receivable collection period, average conversion
inventory period and average payment period, and also the cash conversion cycle which
expresses the efficiency of working capital. This study revealed a positive significance
between the size of the firm, growth of sales and current ratio from this side and
profitability from other side. Finally, financial leverage correlated negatively with
profitability.

22
Lazaridis and Tryfonidis (2006) have investigated relationship between working capital
management and corporate profitability of listed companies in the Athens Stock
Exchange. A sample of 131 listed companies for period of 2001-2004 was used to
examine this relationship. The result from regression analysis indicated that there was a
statistical significance between profitability, measured through gross operating profit, and
the cash conversion cycle. From those results, they claimed that the managers could
create value for shareholders by handling correctly the cash conversion cycle and keeping
each different component to an optimum level.
Finally, Amarjit, Nahum and Neil (2010) studied the relationship between working
capital management and profitability in the United States with 88 American firms listed
on the New York Stock Exchange for a period of 3 years (2005 - 2007). Their study
applied co-relational and non-experimental research design and measured the variables
as; (independent) number of days account receivable, number of days account payables,
cash conversion cycle; (dependent) gross operating profit; (control variables) firm size,
financial debt ratio and fixed financial asset ratio. Their study indicated a negative
relationship between profitability and average days of account receivable and a positive
relationship between cash conversion cycle and profitability. Based on these findings,
they suggest that managers can create value for their shareholders by reducing the
debtor’s collection period. Furthermore, less profitable firms will pursue a decrease of
their debtors in an attempt to reduce their cash conversion cycle. Hence, they concluded
that profitability can be enhanced if firms can efficiently manage their working capital.
23
In spite of the touted impact efficient working capital management may have on business
profitability, not much has been done in the area of the provision of empirical evidence in
support of the claims of working capital management on profitability performance of
Kenyan companies. Given this paucity of empirical studies, it is hoped that this study will
fill a gap and provide useful support for understanding the determinants of corporate
performance in Kenya.
2.5 Summary and Research Gaps
Working capital management entails the management of the most liquid resources of a
firm with a view to maintain the firm’s liquidity, enhance profitability and promote
business growth. Working capital management concentrates on the management of
inventories, cash and cash equivalents and accounts receivable. The proper management
of these items is critical to the success of an organization. The management of inventories
is aimed at determining the optimal level of stocks an organization should hold. It ensures
that the organization is holding the right quantity of inventories at the right time and in
the right location. Proper management of inventories is meant to check on costs
associated with holding incorrect quantity of stocks which includes damages to stocks,
high capital tied up in stocks, stock holding costs and lost goodwill and profitability
associated with being out of stocks.
The management of cash on the other hand is aimed at determining the optimal level of
cash an organization should hold. This is to enable it to meet its day to day operating
expenses, its short term financial obligations and ensure that funds are available for
investments in expansion projects. The excess cash balances not immediately required for
use are invested in income generating activities.

24
Accounts receivable management refers to the determination of the optimal level of
debtors an organization should hold. It involves a cost benefit analysis of selling on
credit. It involves evaluating the credit policies of an organization with a view to
selecting and implementing a policy that yields the maximum benefit to a firm. A firm
selling on credit terms increases it turnover therefore increases it profits, however there
are costs associated with the credit sales. Debtor’s management policy impacts on the
firm’s profitability, liquidity, growth and the level of operating and financial risk of an
organization. A problem therefore arises as to what should be the optimal level of debtors
and the credit policy that an organization should adopt in order to reap maximum
benefits. Several studies do not provide clear-cut direction of the relationship between
working capital and firm’s profitability.
Further examination of these studies reveals that there is no empirical evidence on the
working capital management and its impact on the firm profitability in the case of Sugar
Manufacturing firms of Kenya. Therefore, the present study is an attempt to fill this gap
and estimates the relationship between working capital management variables (Average
Collection Period, Inventory Conversion Period, Average Payment Period and Cash
Conversion Cycle) and firm profitability of Sugar manufacturing firms in Kenya

25
CHAPTER THREE
RESEARCH METHODOLOGY
3.1 Introduction
This chapter presents the study methodology that was followed towards attainment of the
objectives. Specifically, it outlined the research design, target population, data collection,
research validity and reliability, and data analysis.
3.2 Research Design
The study adopted the descriptive research design. The study was concerned with the
effects of working capital components on profitability. It aimed at identifying the impact
of working capital components, that is, the Average collection period (ACP); Inventory
turnover in days (ITID); Average payment period (APP) and Cash conversion cycle
(CCC) on profitability. Descriptive research tries to determine the association of the
subject matter with something else (Kothari, 2004).
The design enables the researcher to identify the relationship that exists between the
independent variables and the dependent variable. Examining data for the study requires
panel data analysis to find out the relationships that exists among the variables under
study over a given period (Huang et. al, 2008).
3.3 Population of the Study
Population refers to all the members of a real or hypothetical set of people, events or
objects to which we wish to generalize the results of our research. The population of this
study comprised of 8 Sugar manufacturing firms in Kenya since they are entities
operating under the Kenya Sugar Board directorate license, strict corporate governance
regulations, making their financial and accounting disclosures largely reliable.
26
The data was obtained from document analysis of consolidated financial reports of years
ending December: 2008, 2009, 2010, 2011, 2012 and 2013 of the companies. The use of
the secondary data enabled the researcher to collect reliable information from the target
population. These reports enabled the researcher to save time in data collection; they
were cost effective and contained the required information.
3.4 Data Collection
To ensure comprehensive examination and inter-firm comparison, use of secondary data
was adopted. The secondary data was ascertained from financial statements and inventory
records with the aid of predesigned desk review checklist. Using secondary data was
helpful in enhancing reliability of findings due to minimal inconsistencies.
3.5 Data Analysis and Presentation
The data collected was analyzed using multiple regression and correlation analysis to
establish the relationship between the independent variables of working capital: ACP,
APP, ITID and CCC and the dependent variable (Gross Operating Profit). According to
Kothari (2004), regression analysis is concerned with the study of how one or more
variables affect changes in another variable. To test the hypotheses of the study, the
following model was used to analyze the relationship between the variables:
Y = a + β1(X1) + β2(CS) + β3(CR) + β4(DR) + e
Where:
a = Constant term for the independent variables
Y= Gross Operating Profit (Profitability)
X1= Variables (Average Collection Period, Inventory Turnover in Days, Average
Payment Period, Cash Conversion Cycle)
27
CR = Current Ratio
CS = the size of the company
DR =Debt Ratio
e = the error term
β = Regression model coefficient
Control variables:
Liquidity (CR): The companies with more Liquidity have more profitability, so
Liquidity variable will be used as control variable in order to make its effect on
profitability neutral. Current ratio will be used as Liquidity criterion.
The Company Size (CS): The companies which have more sales naturally have more
profitability too. So the company size variable will be used to control the effect of this.
The company size is: natural logarithm (sale).
Debt Ratio (DR): used as proxy for Leverage and is calculated by dividing Total Debt
by Total Assets:
Data consisted of 8 Sugar manufacturing firms in Kenya that had financial data available
for the period 2009-2013. All data was hand collected from the annual reports of each
firm.
The cash conversion cycle is the measure of working capital management, where it is
measured as follows:
Cash Conversion Cycle = Stockholding Period + Debtors Collection Period – Creditors
Payment Period
The components of cash conversion cycle are measured as follows:

28
Stockholding Period = Stock/Cost of Sales*365
Debtors Collection Period = Stock/Sales*365
Creditors Payment Period = Creditors/Cost of Sales*365
To analyze the effect of working capital management on profitability, we operationalized
profitability as Return on Assets (ROA). ROA is defined as:
Return on Assets = Operating Profit/Total Asset
The control independent variables are the natural logarithm of sales, sales growth and
debt ratio which are calculated as follows:
Natural Logarithm of Sales = Ln (Sales)
Sales Growth = (Salest – Salest-1)/Salest-1
Debt Ratio = Total Liabilities/Total Asset

29
CHAPTER FOUR
DATA ANALYSIS, RESULTS AND DISCUSSION
4.1 Introduction
This chapter shows findings of the study and discusses these findings in length. The study
targeted eight Kenyan Sugar Manufacturing firms in Kenya for a period of six years from
2008 to 2013. Section 4.2 gives the descriptive statistics, section 4.3 provides the
diagnostic statistics while section 4.4 is the chapter summary.
4.2 Descriptive Statistics
Descriptive analysis shows the average, and standard deviation of the different variables
of interest in the study. It also presents the minimum and maximum values of the
variables which help in getting a picture about the maximum and minimum values a
variable can achieve.
Table 1 gives descriptive statistics for 8 Kenyan sugar companies for a period of six years
from 2008 to 2013 and for a total 48 firms- year observations. . The table shows that the
average value of net operating profitability (ROA) is 4.74% of total assets, and standard
deviation is 13.05%. This figure means that the value of profitability can deviate from
mean to both sides by 13.05%. The maximum and minimum values of net operating
profitability are 25% and -24% respectively.
To check the liquidity of the companies, a traditional measure of liquidity (current ratio)
was used. The average current ratio for Kenyan Sugar companies is 1.05 with a standard
deviation of 0.68. The highest current ratio for a company in a particular year is 2.2 times
and in the same way the minimum ratio for a company in a year is 0.04.

30
To check the debt financing and its relationship with the profitability the debt ratio
(obtained by dividing the total debt of the company by the total assets) was used as a
control variable. The results of descriptive statistics show that the average debt ratio for
the Kenyan Sugar companies is 84% with a standard deviation of 109%. The maximum
debt financing used by a company is 501% which is unusual but may be possible if the
equity of the company is in negative. The minimum level of the debt ratio is 13%. The
average collection period in days is 43 days with standard deviation 16 days. Minimum
time taken by a company to collect cash from customers is 22 days while the maximum
time for this goal is 81 days.
Table 4.1: Descriptive Statistics
Source: Research Data (2015)
To check the size of the firm and its relationship with profitability, natural logarithm of
sales is used as a control variable. The mean value of log of sales is 14.75 while the
standard deviation is 0.96. The maximum value of log of sales for a company in a year is
16.58 and the minimum is 13.06.

31
The cash conversion cycle used as a proxy to check the efficiency in managing working
capital is on average -432 days and standard deviation is 927 days. Firms receive
payment against sales after an average of 44 days and standard deviation is 16 days.
Minimum time taken by a company to collect cash from receivables is 22 days while the
maximum time for this purpose is 81 days. It takes an average 56 days to sell inventory
with standard deviation of 17 days. Here, maximum time taken by a company is 99 days
and minimum is 32 days. The companies wait an average 497 days to pay their purchases
with standard deviation of 471 days. Here, minimum time taken by a company is 89 days
and maximum time taken for this purpose is 1743 days, which is unusual.
4.3 Diagnostic Statistics – Test for normality and Colinearity
For diagnostic statistics two methods were used. At first, correlation was used to measure
the degree of association between different variables under consideration. Pearson and
Spearman correlations were calculated for all variables used in the study starting with the
Pearson’s correlation results.
4.4 Correlation Analysis
Pearson’s Correlation analysis was used for data to see the relationship between variables
such as those between working capital management and profitability. If efficient working
capital management increases profitability, one should expect a negative relationship
between the measures of working capital management and profitability variable. There is
a negative relationship between gross profitability on the one hand and the measures of
working capital management on the other hand.

32
The results of correlation analysis show a strong negative coefficient -0.586 between
average collection period and return on assets, with a p value of 0.00, which is significant
at p=0.05. It means that if average collection period decreases it will have a positive
impact on profitability and it will increase. This finding implies that managers can
improve profitability by reducing the credit period granted to their customers.
Correlation results among the payable turnover in days or average payment period also
indicate the same trend. Here again, the coefficient is negative and highly significant. The
coefficient is -0.669 and the p value is (0.000). It means that the less profitable firms wait
longer to pay their bills.
The cash conversion cycle which is a comprehensive measure of working capital
management also has a negative coefficient 0.644 and the p value is (0.00). It is
significant at ά. = 1%. It means that if the firm is able to increase this time period known
as cash conversion cycle, it can increase its profitability.
Current ratio is a traditional measure of checking liquidity of the firm. In this analysis the
current ratio has a significant negative relationship with profitability (Return on Assets).
The coefficient is 0.817 and p-value of (.000). The result is significant at ά. = 1%. It
indicates that the two objectives of liquidity and profitability have positive relationships.
So, the sugar companies need to increase liquidity to increase profitability.
A negative significant association exists between company size and profitability. The
coefficient is -0.532; with p-value of (.000). The result is highly significant at ά. = 1%. It
shows that as size of the firm increases, it will decrease its profitability.

33
Table 4.2: Correlations
Company
Size
Return on
Assets
Current
Ratio
Debt
Ratio
Cash
Conversion
Cycle
Inventory
Turnover
Average
Payment
Period
Average
collection
period
Correlation
Coefficient
1.000 -.532** -.202 .318
* -.210 .147 .412** .114
Sig. (2-
tailed)
.000 .168 .028 .152 .320 .004 .438
Correlation
Coefficient-.532
** 1.000 .817**
-.870**
.644**
-.491**
-.669**
-.586**
Sig. (2-
tailed)
.000 .000 .000 .000 .000 .000 .000
Correlation
Coefficient
-.202 .817** 1.000 -.914
**.636
**-.576
**-.561
**-.714
**
Sig. (2-
tailed)
.168 .000 .000 .000 .000 .000 .000
Correlation
Coefficient.318
*-.870
**-.914
** 1.000 -.724**
.536**
.722**
.631**
Sig. (2-
tailed)
.028 .000 .000 .000 .000 .000 .000
Correlation
Coefficient
-.210 .644**
.636**
-.724** 1.000 -.023 -.233 -.154
Sig. (2-
tailed)
.152 .000 .000 .000 .877 .111 .295
Correlation
Coefficient
.147 -.491**
-.576**
.536** -.023 1.000 .710
**.961
**
Sig. (2-
tailed)
.320 .000 .000 .000 .877 .000 .000
Correlation
Coefficient.412
**-.669
**-.561
**.722
** -.233 .710** 1.000 .682
**
Sig. (2-
tailed)
.004 .000 .000 .000 .111 .000 .000
Correlation
Coefficient
.114 -.586**
-.714**
.631** -.154 .961
**.682
** 1.000
Sig. (2-
tailed)
.438 .000 .000 .000 .295 .000 .000
Inventory Turnover
Average Payment
Period
Average collection
period
**. Correlation is significant at the 0.01 level (2-tailed).
*. Correlation is significant at the 0.05 level (2-tailed).
Spearman's
rho
Company Size
Return on Assets
Current Ratio
Debt Ratio
Cash Conversion
Cycle
Source: Research Data (2015)
A negative relationship between average payment period and profitability is consistent
with the view that less profitable firms wait longer to pay their bills. In that case,
profitability affects the account payables policy and vice versa. An alternative
explanation for a negative relationship between the average payment period and
profitability could be that the sugar companies wait too long to pay their accounts
payable. Speeding up payments to suppliers might increase profitability because firms
often receive a substantial discount for prompt payment.

34
The results of correlation analysis indicate that as far as Sugar manufacturing firms in
Kenya are concerned, the working capital management very significantly and strongly
affects their profitability.
4.5 Working Capital Management and Profitability
A shortcoming of Pearson correlations is that they do not allow identifying causes from
consequences. Hence, regression analysis was used to investigate the impact of working
capital management on corporate profitability. The determinants of corporate profitability
are estimated with a fixed effects model. Fixed effects estimated assumes firm specific
intercepts, which capture the effects of those variables that particular to each firm and
that are constant over time.
The model used is:
Y = a + β1(X1) + β2(CS) + β3(CR) + β4(DR) +
Where:
Y: Return on assets (ROA)
a : a constant, the value of ROA when the independent variable are at zero
b1-n: is the regression coefficient or change induced in ROA by each of the variables
X1: Variables (Average Collection Period, Inventory Turnover in Days, Average
Payment Period, Cash Conversion Cycle)
CS: the size of the company
CR = Current Ratio
DR =Debt Ratio
= the error term

35
All regression models were tested for multicollinearity. The variance inflation factor
(VIF) or the tolerances of the explanatory variables is used to detect whether one
predictor has a strong linear association with the remaining predictors. VIF measures how
much the variance the regression coefficient is inflated by multicollinerity thus
misleading inflates the standard errors. The largest VIF among all predictors is often used
as an indicator of severe multicollinearity. Predictor with the highest variance inflation
factor had 3.682, which totally indicates that there is absence of multicollinearity between
the predictors in the regression models.
The b0 is a constant, where the regression line intercepts the y axis; representing the
amount of dependent ROA will be when all the independent variables are zero. In the
equation b0 is 0.576
From the data in table (3), our model is as follows:
ROA = 0.576 - 0.040CS + 0.084CR + 0.019DR+ 0.003IT – 0.004ACP
Table 4.3: Multiple Regression Analysis Results
Standardi
zed
Coefficie
nts
B Std. Error Beta Zero-order Partial Part Tolerance VIF
(Constant) .576 .146 3.955 .000
Company Size -.040 .009 -.292 -4.310 .000 -.466 -.563 -.270 .860 1.162
Current Ratio .084 .025 .440 3.330 .002 .806 .466 .209 .225 1.441
Debt Ratio .019 .025 .161 .791 .434 -.719 .124 .050 .095 1.581
Cash Conversion
Cycle
6.287E-05 .000 .447 2.350 .024 .681 .348 .147 .109 2.185
Inventory Turnover .003 .003 .429 1.252 .218 -.376 .194 .079 .034 2.724
Average Payment
Period
-6.580E-05 .000 -.238 -3.032 .004 -.418 -.432 -.190 .641 1.559
Average collection
period
-.004 .003 -.492 -1.350 .185 -.459 -.209 -.085 .030 3.682
Correlations Collinearity Statistics
1
a. Dependent Variable: Return on Assets
Coefficientsa
Model
Unstandardized
Coefficients
t Sig.
Source: Research Data (2015)

36
The adjusted R2, also called the coefficient of multiple determinations, is the percent of
the variance in the dependent explained uniquely or jointly by the independent variables
and is -81.5%. This means that 81.5% of the variance in return on assets is explained
uniquely or jointly by the predictors. The F statistic is used to test significant of R. From
result of SPSS, we see that the model is fit with F statistics 30.55 and p-value is 0.000. It
is significant at p= 0.05. This concludes that the independent variables positively explain
the variation in ROA. The Durbin-Watson statistics is a statistic that indicates the
likelihood that the deviation values for the regression have a first order auto regression
component. The value is 1.295 meaning there is no serial correlation.
Table 4.4: Regression Model Summary Statistics
R Square
Change
F
Change df1 df2
Sig. F
Change
1 .918a .842 .815 .05615 .842 30.555 7 40 .000 1.295
Change Statistics
Durbin-
Watson
a. Predictors: (Constant), Average collection period, Company Size, Cash Conversion Cycle, Average Payment Period, Current
Ratio, Debt Ratio, Inventory Turnover
b. Dependent Variable: Return on Assets
Model Summaryb
Model R
R
Square
Adjusted
R Square
Std. Error of
the Estimate
Source: Research Data (2015)
The findings of this study show that there is a positive relationship between working
capital management and profitability in the sugar industry in Kenya.
WCM explained 84.2% (R2 = .842, F=30.555) Variation in change on the relational
predictors and return on Assets

37
CHAPTER FIVE
CONCLUSIONS AND RECOMMENDATIONS
5.1 Introduction
This chapter presents a summary of the study and its findings, the conclusion and
recommendations for future study. Its lays emphasis on the summary of the key findings,
the relationship of WCM and profitability, and the conclusions are then drawn based on
these findings and discussion.
5.2 Summary of Findings
Working capital management is highly important in firms as it is used to generate further
returns for the stakeholders; however, it has attracted less attention of researchers and
practitioners. When working capital is managed improperly, allocating more than enough
of it will render management non-efficient and reduce the benefits of short term
investments. On the other hand, if working capital is too low, the company may miss a lot
of profitable investment opportunities or suffer short term liquidity crisis, leading to
degradation of company credit, as it cannot respond effectively to temporary capital
requirements. There may be various external and internal factors that may induce the
firms to strike a balance between meeting unforeseen capital requirements and avoiding
non-efficient management of working capital.
Most of the Kenyan sugar firms have large amounts of cash invested in working capital.
It can therefore be expected that the way in which working capital is managed will have a
significant impact on profitability of those firms. The study has found a positive
relationship between net operating profitability and the predictors of study for the Kenya

38
sugar firms. These results suggest that managers can create value for their shareholders
by reducing the average collection period to a reasonable period. The negative
relationship between accounts payable and profitability is consistent with the view that
less profitable firms wait longer to pay their bills.
On basis of the above analysis we may further conclude that these results can be further
strengthened if the firms manage their working capital in more efficient ways.
Management of working capital means management of current assets and current
liabilities, and financing these current assets. If these firms properly manage their cash,
accounts receivables and debts in a proper way, this will ultimately increase profitability
of these companies.
5.3 Recommendations
The findings indicate that working capital management, particularly managing cash and
account receivables is important for the purpose of increasing sales and decreasing
operating costs. Working capital has an important role for value creation. It is particularly
important for the purpose of increasing sales by managing trade receivables. Based on the
findings, firms should focus on reducing the accounts receivable period.
The management can also create value for their shareholders by increasing their
inventories to a reasonable level. Firms can also take long to pay their creditors in as far
as they do not strain their relationship with the creditors.
Firms are capable of gaining sustainable competitive advantage by means of effective and
efficient utilization of the resources of the organization through a careful reduction of the
cash conversion cycle to its minimum. In so doing, profitability of the company is
expected to increase.

39
5.4 Limitations of the Study
The aim of the study was to establish the relationship between WCM and profitability of
Sugar Manufacturing firms in Kenya. However the study should be evaluated in light of
the following limitations:
Firstly, the study covered relatively a short period of time. This was occasioned by
constraints of data availability. Secondly, the study relied heavily on the financial
statements and also on ratio analysis. There are inherent limitations of using financial
statements. Thirdly, our case research is limited to the Kenya. Because of this limitation
it is not possible to extend our findings and conclusions to situations in other developing
countries. Similar research could be made in other countries in order to have the
possibility of comparison.
The other limitation of the study was that four out of the twelve companies targeted by
the study were not willing to provide the information required for the study. It was
therefore not possible to obtain their consolidated financial reports for the period covered
by the study, thus the findings of the study may not be generalized to these companies.
5.5 Suggestions for Further Research
There is much to be done about working capital in Kenya in future. The researcher
suggests that further research be conducted on the same topic with different companies
such as companies that are in other sectors such as education, agriculture, tourism among
others.
Future research may also consider extending the number of years of the study. The scope
for further research may be extended to the individual working capital components
including cash, marketable securities, and receivables.

40
There is room for research on the effect of changes in the components of working capital
on profitability. It would also be of interest to study the impact of information technology
on working capital and subsequently on the profitability of firms. This study suggests that
further research be conducted on the same topic extending the years of the sample.
41
REFERENCES
Afza, T., & Nazir, M. (2009). Impact of aggressive working capital management policy
on firms' profitability. The IUP Journal of Applied Finance, 15(8), 20-30.
Amarjit Gill 1, Nahum Biger 2, Neil Mathur 3, (2010). The Relationship Between
working Capital Management and Profitability: Evidence from The United States.
Appuhami, BAR, 2008, ‘The Impact of Firms’ Capital Expenditure on Working Capital
Management: An Empirical Study.
Brealey-Myers (2002), Principles of corporate Finance, in ed. 6, McGraw-Hill Book
Company, New-York, 445.
Caballero S., Gracia-Teruel P.J., & Solano P. (2010) Accounting and Finance, l50(3),
511- 527.
Chen H., Frank M., & O. Wu. (2007). US Retail and Wholesale Inventory Performance
from 1981 to 2003. Forthcoming, Manufacturing and Service Operations
Management.
Christopher, S., B. & Kamalavalli, A., L., (2009). Sensitivity of profitability to working
capital management in Indian corporate hospitals
Dash, M. & Ravipati, R.A. (2009). Liquidity-Profitability Trade-Off Model for Working
Capital Management working paper, Alliance Business School.
Deloof, M. (2003). Does working capital management affect profitability of Belgian
firms? Journal of Business Finance and Accounting, 30(3-4), 573-588.
Deloof, M. & Jegers, M. (1996). Trade credit, product Quality, and Intra Group Trade:
Some European Evidence, Financial Management, 25(3), 33-43

42
Dong, H. P. & Su, J. (2010).The Relationship between Working Capital Management and
Profitability: A Vietnam Case. International Research Journal of Finance and
Economics. 49, 59-67
Eljelly, A. M. (2004). Liquidity-profitability tradeoff: An Empirical Investigation in an
Emerging Market. International Journal of Commerce and Management, 14(2),
48-61.
Erlenkotter, D. (1990). Ford Whitman Harris and the Economic Order Quantity Model,
Operations Research, 38 (6), 937-946
Falope, OI, Ajilore, O.T, (2009). Working capital management and corporate
profitability: evidence from panel data analysis of selected quoted companies in
Nigeria. Research Journal of Business Management, 3, 73-84.
Filbeck, G., & Krueger, T. (2005). Industry related differences in working capital
management. Journal of Business, 20(2), 11-18.
Garcia-Teruel, P.J. & Martinez-Solano P.M. (2007). Effects of working capital
management on SME profitability. International Journal of Managerial Finance,
3, 164-177.
Gaur, V., M. F. & Raman, A. (2005). An Econometric Analysis of Inventory Turnover
Performance in Retail Services. Management Science, 51, 181-194.
Ghosh, S.K. & Maji, S.G. (2003). Working capital management efficiency: a study on the
Indian cement industry. The Institute of Cost and Works Accountants of India.
Harris, F. M. (1983) How Many Parts to Make at Once, Factory, The Magazine of
Management 10:2, 135–136, 152. Reprinted in Operations Research 38:6 (1990),
947–950.

43
Hayajneh, O. S, & Yassine, F. L, (2011). The Impact of Working Capital Efficiency on
Profitability – an Empirical Analysis on Jordanian Manufacturing Firms.
International Research Journal of Finance and Economics, 66, 67-69.
Hofstrand, (2013). Firm Profitability. Research Journal of Firm Profitabilitys, 6, (2013),
6-7.
Howorth, C. & Westhead, P. The focus of working capital management in UK small
firms: Management Accounting Research, 14(2), 94-111, 2003.
Joshi, S. M. (1995). Working Capital management under Inflations, 1st Ed. Anmol
Publishers, 20-93.
Keown, A. J., Martin, J. D., Petty, J. W., & Scott, D. (2003). Foundations of Finance,
4ed: Pearson Education, New Jersey
Kothari C. R., (2004). Research Methodology: Methods and Techniques. New Delhi:
New Age International (P) Ltd, Publishers.
Lazaridis, I. & Tryfonidis, D. (2006). Relationship between working capital management
and profitability of listed companies in Athens stock Exchange. A Journal of
Financial Management and Analysis, 19(1) 26-35.
Lyroudi, K., & Lazaridis, Y. (2000). The Cash Conversion Cycle and Liquidity Analysis
of the Food Industry in Greece (Electronic Version). EFMA 2000 Athens,
Manaseh, P. (2001). Business finance-Working capital Management. 2nd Edition.
Mathuva, D, (2009). The influence of working capital management components on
corporate profitability: A survey on Kenyan listed firms. Research Journal of
Business Management, 3: 1-11.

44
Nobanee, H. & Maryam, A. (2009). A Note on Working Capital Management and
Corporate Profitability of Japanese Firms, www.ssrn.com
Nobanee, H., Modar, A & Maryam Al Hajjar (2010). Cash Conversion Cycle and Firm’s
Performance of Japanese Firms,
Padachi, K. (2006). Trends in working capital management and its impact on firms
performance. An analysis of Mauritanian small firms. International review of
business research papers 2(2). 45-58.
Pandey, I. M., (2005). Financial Management. Vikas Publishing House PVT Ltd. New
Deldhi India.
Raheman, A. & Nasr, M. (2007). Working capital management and profitability. A case
study of Pakistani firms. International review of Business research papers 3(2)
275-296.
Rao, R. K. S. (1989). Fundamentals of Financial Management ,3 rd Ed. Macmillan
publishers, 550-644.
Roumiantsev, S. & S. Netessine. (2005b). Should Inventory Policy Be Lean or
Responsive? Evidence for US Public Companies. Working paper, University of
Pennsylvania.
Roumiantsev, S. & S. Netessine. (2007). Inventory and its Relationship With
Profitability: Evidence for an International Sample of Countries. Working paper,
University of Pennsylvania. Rezazade J., Heidarian J. (2010). Accounting & Auditing
Research Journal, 2(7), 20- 34.
Saalemi N. A., (2008/2009). Business Finance –Working capital management. East
African Edition. 40

45
Samiloglu, F., Demirgunes, K., (2008). The Effect of Working Capital Management on
Firm Profitability: Evidence from Turkey. International Research Journal of
Applied Economics and Finance, 2 (1), 44-50.
Shin, H. H., & Soenen, L. (1998). Efficiency of working capital management and
corporate profitability. Financial Practice and Education, 8(2), 37-45.
Singh, J. P., & Pandey, S. (2008). Impact of working Capital Management in the
Profitability of indalco Industries Limited. Icfai University Journal of Financial
Economics, 6(4), 62-72.
Smith, P. (1980). Profitability versus liquidity tradeoffs in working capital management,
in readings on the management of working capital. New York, St. Paul: West
Publishing Company.
Soenen, L. A., (1993). Cash Conversion Cycle and Corporate profitability. Journal of
Cash Management; 13, 53-57.
Torghe, S. (2008) Investigating the effect of working capital management on SME’s
Iranian firms. Master degree dissertation, Al Zahra University, Tehran, Iran.
Van Horne, J.C & Wachowicz, J. M., (1997-2000). Fundamentals of financial
management Eleventh edition. Prentice Hall Inc.

46
APPENDICES
APPENDIX I: LETTER OF INTRODUCTION

47
APPENDIX II: DATA COLLECTION SHEET
SUGAR COMPANY ………..
YEAR 2008 2009 2010 2011 2012 2013
NET PROFIT (SURPLUS)
SALES
COST OF SALES
TOTAL ASSETS
CURRENT ASSETS
TOTAL LIABILITIES
CURRENT LIABILITIES
CREDITORS
DEBTORS
INVENTORY

48
APPENDIX III: AVERAGE DATA
Current Ratio Creditors Debtors Debt Ratio Inventory
Stockholding Period
Debtors collection period
Creditors Payment Period
Cash Conversion Cycle
Inventory Turnover
Average Payment Period
1.346 1838272.000 2603991.000 0.240 1086254.000 51.569 33.123 87.270 -2.578 51.569 152.260
1.356 2509110.000 3262935.000 0.215 796096.000 34.480 24.642 108.674 -49.552 34.480 89.053
1.999 2567492.000 3327244.000 0.177 955078.000 32.631 22.321 87.722 -32.769 32.631 104.772
2.199 2024399.000 3863595.000 0.128 1191114.000 42.037 27.524 71.446 -1.884 42.037 112.526
1.254 2928017.000 4584048.000 0.209 1676088.000 55.311 39.361 96.624 -1.953 55.311 133.457
0.838 4844672.000 3765866.000 0.308 2463064.000 86.479 75.182 170.098 -8.437 86.479 238.728
0.451 1241616.000 175253.000 0.721 568200.000 99.693 81.451 217.847 -36.702 99.693 1183.392
0.950 950632.000 169070.000 0.685 413033.000 57.334 46.635 131.958 -27.990 57.334 891.684
1.174 1038524.000 222349.000 0.675 498506.000 70.749 52.506 147.389 -24.134 70.749 818.329
1.172 1025455.000 136556.000 0.515 529288.000 55.838 39.353 108.182 -12.991 55.838 1414.732
1.601 1214645.000 135411.000 0.511 646939.000 60.654 40.781 113.879 -12.444 60.654 1743.822
1.019 1265017.000 168282.000 0.525 520170.000 54.377 45.528 132.240 -32.336 54.377 1128.237
0.053 22000000.000 300000.000 2.365 500000.000 62.931 57.031 2768.966 -2649.003 62.931 608.333
0.052 23500000.000 350000.000 2.800 300000.000 37.759 33.182 2957.759 -2886.818 37.759 312.857
0.052 25000000.000 310000.000 3.230 650000.000 79.083 65.903 3041.667 -2896.681 79.083 765.323
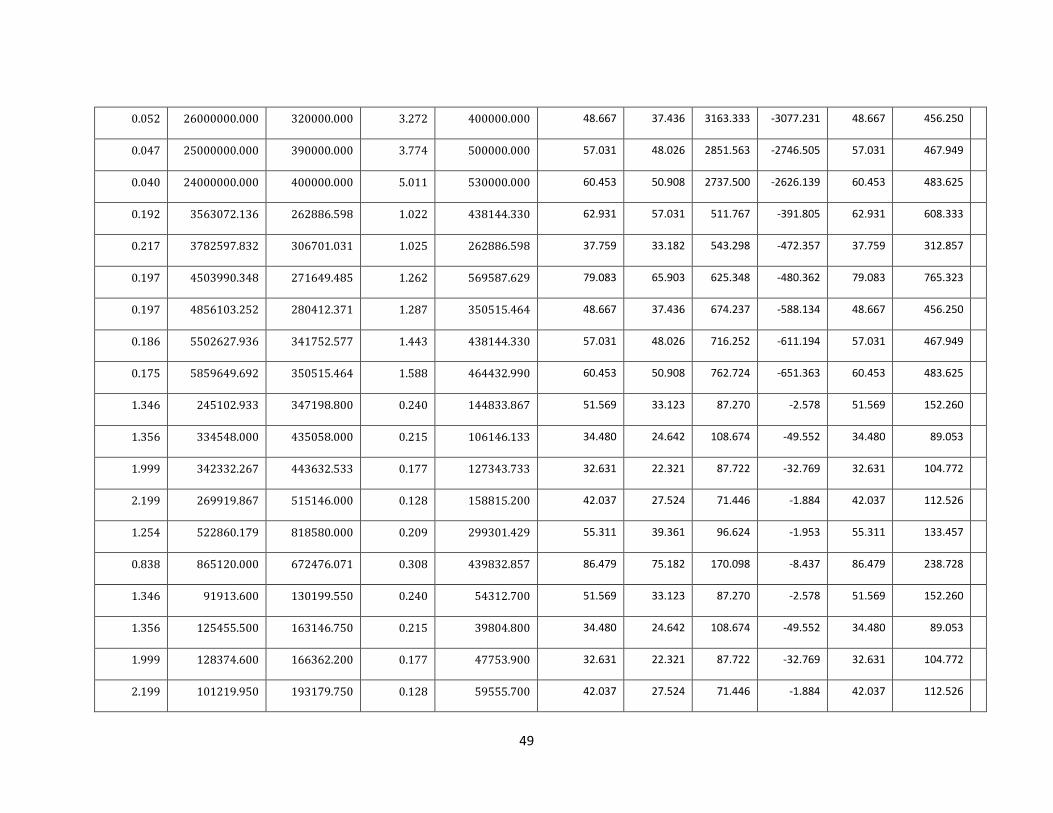
49
0.052 26000000.000 320000.000 3.272 400000.000 48.667 37.436 3163.333 -3077.231 48.667 456.250
0.047 25000000.000 390000.000 3.774 500000.000 57.031 48.026 2851.563 -2746.505 57.031 467.949
0.040 24000000.000 400000.000 5.011 530000.000 60.453 50.908 2737.500 -2626.139 60.453 483.625
0.192 3563072.136 262886.598 1.022 438144.330 62.931 57.031 511.767 -391.805 62.931 608.333
0.217 3782597.832 306701.031 1.025 262886.598 37.759 33.182 543.298 -472.357 37.759 312.857
0.197 4503990.348 271649.485 1.262 569587.629 79.083 65.903 625.348 -480.362 79.083 765.323
0.197 4856103.252 280412.371 1.287 350515.464 48.667 37.436 674.237 -588.134 48.667 456.250
0.186 5502627.936 341752.577 1.443 438144.330 57.031 48.026 716.252 -611.194 57.031 467.949
0.175 5859649.692 350515.464 1.588 464432.990 60.453 50.908 762.724 -651.363 60.453 483.625
1.346 245102.933 347198.800 0.240 144833.867 51.569 33.123 87.270 -2.578 51.569 152.260
1.356 334548.000 435058.000 0.215 106146.133 34.480 24.642 108.674 -49.552 34.480 89.053
1.999 342332.267 443632.533 0.177 127343.733 32.631 22.321 87.722 -32.769 32.631 104.772
2.199 269919.867 515146.000 0.128 158815.200 42.037 27.524 71.446 -1.884 42.037 112.526
1.254 522860.179 818580.000 0.209 299301.429 55.311 39.361 96.624 -1.953 55.311 133.457
0.838 865120.000 672476.071 0.308 439832.857 86.479 75.182 170.098 -8.437 86.479 238.728
1.346 91913.600 130199.550 0.240 54312.700 51.569 33.123 87.270 -2.578 51.569 152.260
1.356 125455.500 163146.750 0.215 39804.800 34.480 24.642 108.674 -49.552 34.480 89.053
1.999 128374.600 166362.200 0.177 47753.900 32.631 22.321 87.722 -32.769 32.631 104.772
2.199 101219.950 193179.750 0.128 59555.700 42.037 27.524 71.446 -1.884 42.037 112.526

50
1.254 156858.054 245574.000 0.209 89790.429 55.311 39.361 96.624 -1.953 55.311 133.457
0.838 259536.000 201742.821 0.308 131949.857 86.479 75.182 170.098 -8.437 86.479 238.728
1.346 82722.240 117179.595 0.240 48881.430 51.569 36.429 87.270 0.728 51.569 152.260
1.356 112909.950 146832.075 0.215 35824.320 34.480 27.921 108.674 -46.273 34.480 89.053
1.999 115537.140 149725.980 0.177 42978.510 32.631 23.310 87.722 -31.780 32.631 104.772
2.199 91097.955 173861.775 0.128 53600.130 42.037 27.537 71.446 -1.872 42.037 112.526
1.254 176465.310 276270.750 0.209 101014.232 55.311 47.126 96.624 5.813 55.311 133.457
0.838 291978.000 226960.674 0.308 148443.589 86.479 76.048 170.098 -7.571 86.479 238.728
0.451 1142286.720 161232.760 0.721 522744.000 99.693 81.451 217.847 -36.702 99.693 1183.392
0.950 874581.440 155544.400 0.685 379990.360 57.334 46.635 131.958 -27.990 57.334 891.684
1.174 955442.080 204561.080 0.675 458625.520 70.749 52.506 147.389 -24.134 70.749 818.329
1.172 943418.600 125631.520 0.515 486944.960 55.838 39.353 108.182 -12.991 55.838 1414.732
1.601 1117473.400 124578.120 0.511 595183.880 60.654 40.781 113.879 -12.444 60.654 1743.822
1.019 1163815.640 154819.440 0.525 478556.400 54.377 45.528 132.240 -32.336 54.377 1128.237