
Effects of wavelength, pulse duration and power density on ...
12
127 J. Elecrrounal. Chem., 310 (1991) 127-138 Elsevier Sequoia S.A., Lausanne Effects of wavelength, pulse duration and power density on laser activation of glassy carbon electrodes Ronald J. Rice and Richard L. McCreery Department of Chemistry The Ohio State Universiiy, 120 W. 18th Ave., Columbus, OH 43210 (USA) (Received 16 October 1990; in revised form 27 February 1991) Abstract The hypothesis that laser activation of glassy carbon (GC) electrodes is thermally driven was investigated by comparing simulated surface temperatures for several lasers and experimental conditions. Assuming no phase changes, the surface temperature vs. time profile for a laser pulse striking a GC electrode was predicted by finite difference simulation. It was predicted that peak surface temperature depends on power density, wavelength, pulse duration and the optical properties of the carbon. Experimentally, laser activa!ion is weakly wavelength dependent for ascorbic acid and Fe2+j3+. The surface temperatures required for activation were consistent for different lasers, supporting the conclu- sion that laser activation is thermally driven. Furthermore, predicted surface temperatures during activation were below the melting point of carbon but well above the boiling point of water. The results should be useful for predicting the effectiveness of different laser conditions on electron transfer activation. INTRODUCTION Laser effects on solids have been examined in a variety of contexts, including laser desorption mass spectrometry, laser welding and surgery, and laser induced melting of semiconductors. Of particular relevance to the present discussion are laser activation of solid electrodes for enhancing electron transfer kinetics [l-8], and pulsed laser melting of sp* carbon materials [lo-131. Our laboratory [l-3,14] and others [6-91 have reported that in-situ or ex-situ laser irradiation can greatly increase the heterogeneous electron transfer rate of several redox systems, particu- larly on carbon electrodes. The effect is fast, long-lived and repeatable, and can be carried out directly in the solution of interest. Activation has been attributed to formation of edge plane defects on highly ordered pyrolytic graphite (HOPG) electrodes [4] and to the removal of chemi and/or physisorbed impurities on glassy carbon (GC) [14]. A variety of lasers, pulse durations and peak power densities have been employed in our lab and others for electrochemical activation, including 0022-0728/91/$03.50 0 1991 - Elsevier Sequoia S.A.
Transcript of Effects of wavelength, pulse duration and power density on ...

127
J. Elecrrounal. Chem., 310 (1991) 127-138
Elsevier Sequoia S.A., Lausanne
Effects of wavelength, pulse duration and power density on laser activation of glassy carbon electrodes
Ronald J. Rice and Richard L. McCreery
Department of Chemistry The Ohio State Universiiy, 120 W. 18th Ave., Columbus, OH 43210 (USA)
(Received 16 October 1990; in revised form 27 February 1991)
Abstract
The hypothesis that laser activation of glassy carbon (GC) electrodes is thermally driven was investigated by comparing simulated surface temperatures for several lasers and experimental conditions.
Assuming no phase changes, the surface temperature vs. time profile for a laser pulse striking a GC electrode was predicted by finite difference simulation. It was predicted that peak surface temperature
depends on power density, wavelength, pulse duration and the optical properties of the carbon.
Experimentally, laser activa!ion is weakly wavelength dependent for ascorbic acid and Fe2+j3+. The
surface temperatures required for activation were consistent for different lasers, supporting the conclu- sion that laser activation is thermally driven. Furthermore, predicted surface temperatures during
activation were below the melting point of carbon but well above the boiling point of water. The results should be useful for predicting the effectiveness of different laser conditions on electron transfer
activation.
INTRODUCTION
Laser effects on solids have been examined in a variety of contexts, including laser desorption mass spectrometry, laser welding and surgery, and laser induced melting of semiconductors. Of particular relevance to the present discussion are laser activation of solid electrodes for enhancing electron transfer kinetics [l-8], and pulsed laser melting of sp* carbon materials [lo-131. Our laboratory [l-3,14] and others [6-91 have reported that in-situ or ex-situ laser irradiation can greatly increase the heterogeneous electron transfer rate of several redox systems, particu- larly on carbon electrodes. The effect is fast, long-lived and repeatable, and can be carried out directly in the solution of interest. Activation has been attributed to formation of edge plane defects on highly ordered pyrolytic graphite (HOPG) electrodes [4] and to the removal of chemi and/or physisorbed impurities on glassy carbon (GC) [14]. A variety of lasers, pulse durations and peak power densities have been employed in our lab and others for electrochemical activation, including
0022-0728/91/$03.50 0 1991 - Elsevier Sequoia S.A.
Nd : YAG (1064 nm, 9 ns and 532 nm, 7 us) [1,14], N, (337 nm, - 4 ns) [6,15], and iodine (1513 nm, 150 ps) [7]. With proper selection of parameters, laser activation of GC results in electron transfer rates which meet or exceed those achieved by the best ex-situ techniques such as ultraclean polishing and thermal treatments [14,16,17]. For completely different reasons, pulsed laser effects on graphite have been ex- amined, with the objective of forming and characterizing liquid carbon [lo-131. A phase transition to a metallic liquid state at ca. 4300 K has been reported when HOPG is irradiated with pica- and nanosecond laser pulses. The process was concluded to be completely thermally driven with rapid thermal expansion of the graphite layers followed by melting at 4300 K, Melting was observed when the energy density of a 694 nm, 30 ns ruby laser pulse exceeded 0.63 J/cm* [lo], Simulations of peak surface temperature and melt depth were consistent with experimental observations.
If laser activation of electron transfer is also the~ally driven, several questions arise about the activation mechanism and the effect of experimental conditions. Does the power density required for activation depend on laser wavelength and pulse duration? Is melting involved in activation? Is the same activation threshold expected for in-situ vs. ex-situ activation and for HOPG vs. GC? The questions were addressed by simulating the surface temperature of GC and HOPG under various irradiation conditions, and correlating such simulations with observed activation thresholds. Although si~fic~t assumptions are required to carry out the simula- tions, they do provide useful insights into the factors affecting the activation process.
THEORY
The variables which control the surface temperature of the laser irradiated carbon can be classified into three groups: those relating to the electrode materials, those of the laser, and those of the medium in which irradiation occurs. Carbon material variables include the real and imaginary parts of the refractive index (n and k), the heat capacity, density and thermal conductivity (C,, p and K), and the melting point and heat of fusion. Laser variables are wavelength (h), FWHM duration (t,), power density (I,), angle of incidence, and spatial beam unifo~ty. For illumination in an optically transparent (k = 0) medium, the medium’s refrac- tive index will affect electrode reflectivity, and its boiling point and heat of vaporization may be important. In order to make the temperature simulation tractable, several approbations will be made. First, n, k, p, C, and kr for carbon were assumed to be ind~ndent of temperature and equal to their values at 298 K. It is known that C,, K, and p vary siguificantly with T for HOPG due to thermal expansion [lo]. For example, the c-axis thermal conductivity decreases by 508, and the heat capacity increases by 21% from 298 to 1000 K. These effects should be smaller for GC due to smaller thermal expansion than for HOPG, and in any case are difficult to incorporate into the simulation. The second approximation is to ignore phase changes of carbon or solvent, including melting, vaporization, or
129
plasma formation. Below a carbon surface temperature of 4300 K in air or vacuum, this assumption is reasonable if the heat of possible desorption of surface layers is negligible. Given that the average ablation rate of GC for Nd : YAG pulses is a few A per pulse for typical conditions [3], there appears to be negligible heat loss through carbon ablation. In a solvent, it is likely that the heated surface will vaporize the solvent, resulting in a lower than predicted temperature. Once vaporized, however, the gaseous solvent will have low thermal conductivity and the surface temperature may rise well above the solvent boiling point. Any phase change (carbon melting, solvent vaporization, or desorption) will require heat, so a simula- tion ignoring these factors leads to an upper limit for surface temperature. A third assumption involving the electrode material is that all heat is conducted away from the surface by the carbon, since its thermal conductivity is high compared to the gas or solvent. Even in a high thermal conductivity solvent like water, K is less than 10% that of GC (5.7 X 10m3 vs. 8.7 X lo-’ W/cm K). Fourth, the laser beam is assumed to be spatially homogeneous across the irradiated electrode and its tem- poral profile is assumed gaussian. The latter is a reasonable assumption for most pulsed lasers, with the peak power (I,) being defined as the total pulse energy divided by the FWHM pulse width (t,).
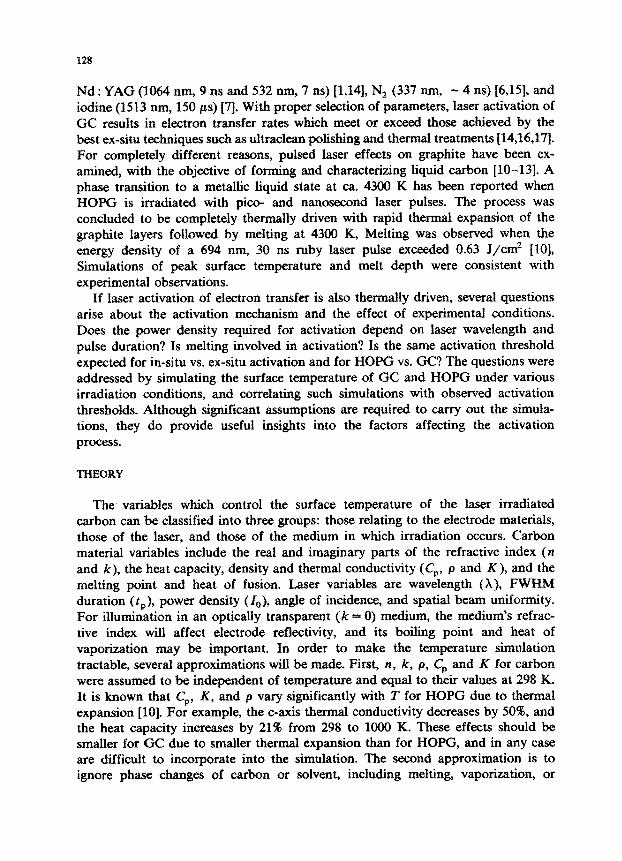
The approach to simulating temperature vs. time transients on laser irradiated carbon is based on an explicit finite difference calculation [18] similar to that used for diffusion problems, and resembles the approach used by Steinbeck et al. [lo], As shown schematically in Fig. 1, the distance into the solid electrode is divided into
AT
Bulk Carbon
Fig. 1. Laser intensity and temperature profiles within carbon electrode during laser pulse. Thermal penetration depth is approximately 6, where t is the time after the laser pulse. AT is the peak surface temperature.

130
increments and the temperature in each increment is simulated with respect to time. The laser beam penetrates the solid according to eqn. (l),
Z( z, t) = Z(0, t)(l - R) e-4akz/h (1)
where Z(0, t) is the surface irradiance, R the reflectivity, k the imaginary part of the refractive index of the carbon, z the depth and h the laser wavelength. Since k is fairly large for sp’ carbon materials, the light penetrates typically less than 1000 A before 50% attenuation. The heat deposited in each distance increment is the derivative of the intensity, and will also track the time profile of the laser pulse.
During and after the laser pulse, heat is conducted away from the surface into the solid. The thermal diffusivity D, (= K/PC,,) has units of cm*/s and governs thermal diffusion. It is necessary to define a parameter d which relates the average distance of thermal diffusion during the laser pulse to the penetration depth of the laser light :
d = (D&‘/*/A (2)
Along with the dimensionless thermal diffusion coefficient (DT AZ/AZ* = 0.45, by analogy to the diffusion parameter for electrochemical simulations), d and k are the only parameters required to calculate a dimensionless surface temperature vs. time profile, with dimensionless time being defined as t/t,. The dimensionless tempera- ture 8 is given by eqn. (3) [18],
e = (AT)pC,Db’*
Z,(l - R)t’,/* (3)
where I,, is the peak laser irradiance (W/cm*). In each time increment the heat deposited in each distance increment is calculated from eqn. (l), then heat is propagated into the solid. The resulting 0 vs. t/t, plots for each distance increment may be converted to AT vs. t at any depth z, but only surface values are reported here. A typical 8 vs. t/t, plot is shown in Fig. 2, along with axes showing AT vs. t for a particular set of conditions. The optical properties of GC (n and k) used to calculate Fig. 2 and Table 1 are from the literature [19,20], and the necessary thermal constants (K = 0.0870 J/cm s K, CP = 1.26 J/g K, and p = 1.48 g/cm3) were obtained from the Tokai product literature. R was calculated from standard expressions assuming normal incidence and known values of GC and solvent n and k. For GC, R ranged from 0.20 (1064 nm) to 0.11 (265 nm). The approach was partially validated by comparison to a simpler calculation by Ready [22] which assumed that the penetration depth of the laser was negligibly small. When the present calculation was performed for large k (corresponding to surface absorption of the laser) the AT vs. t curves agreed with Ready’s approach to better than 1%.
Under the constraints of the assumptions noted above, eqns. (l)-(3) and Fig. 2 permit some useful predictions before extensive calculations are made. First, the surface temperature change AT should be proportional to laser power density. This prediction should apply up to the temperature where phase changes occur, particu-

131
REAL TIME, RELATIVE TO PEAK LASER INTENSITV /ns
t/tp, DIMENSIONLESS TIME
Fig. 2. Laser pulse intensity (- - -) and 8 (- ) as functions of time. Left and lower axes are
dimensionless temperature and time, upper and right axes are the corresponding real time and tempera-
ture for a 9 ns, 25 MW/cm’, 1064 nm laser pulse applied to GC in air. Simulation parameters: k = 0.966,
Q, = 0.0461 cm*/s.
larly melting of the carbon. Second, AT is proportional to (1 - R), since less reflective materials will absorb more heat. Since R will be lower in water than in air, we would predict a higher activation threshold power density in air. Third, AT will depend on D, and I,, but the dependence is not obvious since these parameters are involved in both eqns. (2) and (3). They will be discussed further below. The principle qualitative conclusion to draw from the theoretical discussion so far is the dependence of AT on several variables, including D, A, t,, R, I,, p and Cr. These variables must be considered when using laser activation with different materials, solvents and lasers.
The effect of laser wavelength on B is shown in Fig. 3, for parameters appropriate to GC, t, was fixed at 9 ns, but X was varied from 308 to 1064 nm for which k equals 0.725 (308 nm), 0.711 (532 nm), and 0.966 (1064 nm) [20]. The curve corresponding to surface adsorption (large k) is shown for comparison. Notice that the peak 19 (e,), increases for shorter A, but not greatly. Since k is varying slowly with X, this effect is due mainly to smaller penetration depth as h is decreased (eqn. l), thus depositing heat in a thinner layer near the surface.
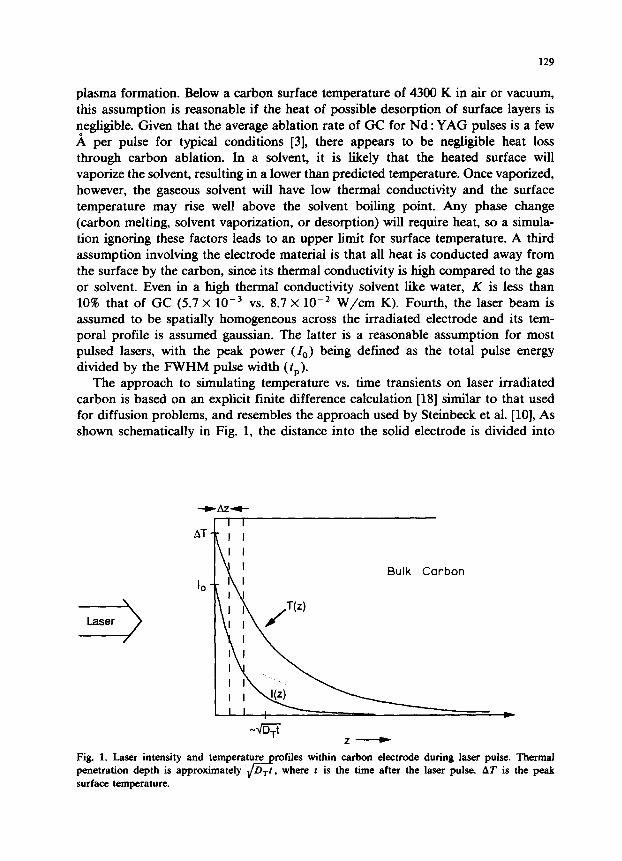
Table 1 lists the peak values of 8 and AT simulated for a variety of experimental conditions. The results are useful for predicting the effects of t,, A, etc. on AT, but AT values above 4000 K are suspect due to probable melting of carbon at 4300 K. However, since AT is linear with power density (ignoring melting) the tabulated ATr values are useful for scaling to lower power densities. Some entries are artificial in

132
% 0.5
lj 0.4
g 0.3 SURFACE ABSOR
z
3
0.2
z 0.1
6 d 1 2 3 4 5 6 7 _
t/t,, DIMENSIONLESS TIME
Fig. 3. Effect of laser wavelength on 0 for GC. tp was 9 ns and D, was 0.0467 cm’/s in all cases. Curve (a) is for surface adsorption with no laser penetration, and remaining curves are as follows: (b) X = 308 nm, k = 0.725; (c) 532 nm, k - 0.711; (d) X = 1064 nm, k = 0.966.
order to fix certain variables. For example, a Nd: YAG laser cannot normally sustain 25 MW/cm2 for 100 ns (group B), but the entry is present to show the effect of pulse duration at constant power density. Group A of Table 1 lists explicitly the effect of power density, and predicts a peak surface temperature for the Nd : YAG case at 25 MW/cm’ of 3230 K. These conditions are typical of several previous experiments with laser activation [l-3,5], and 25 MW/cm’ is adequate for GC activation for most redox reactions. Group B shows the effect of pulse duration. The first three entries show the expected increase in AT with longer pulses, provided the power is constant. When pulse energy is constant rather than power, shorter pulses produce higher surface temperature since less time is allowed for thermal diffusion. Group C shows the effect of laser wavelength on ATp, for constant t, and I,,. Since k varies slowly over most of the h range considered, most of the effect on AT stems from the smaller penetration depth at shorter wavelength. The resulting increase in heat deposition near the surface leads to higher ATP for shorter wavelength.
Group D of Table 1 shows simulated ATP results for conditions similar to those used in several reports on laser activation. AT, for activation in water and air are shown, but the only difference between the two media is assumed to be the different (1 - R) value caused by varying refractive index. Solvent vaporization or surface chemical effects are ignored. For the Nd : YAG laser (1064 nm) the lo-25 MW/cm’ power density range leads to AT = 1300-3300 K. A ruby laser (694 nm) at the same power produces larger AT due to greater 1,. The iodine (1513 nm) laser’s long t, yields high AT at lower I,,, with 0.15 MW/cm’ yielding a ATr comparable to a 25 MW/cm’ Nd : YAG laser. The short pulse of the N, laser (337 nm) produces a
133
TABLE 1
Peak values of 8 and AT simulated for a variety of experimental conditions
X/nm t,/ns k I,/MW cmT2 19~ Q/K
H2O Air
Glassy carbon (p = 1.48 g/cm3, C,, = 1.26 J/g K, DT = 0.0467 cm’/s) A 1064
1064 1064 1064
B 1064 1064 1064 1064 1064 1064
C 1064 694 532 331 308 265
D 1064 1064 694 694
1513 1513
532 337 337 308 265
9 9 9 9
100 9 0.1
100 0.1 0.004
9 9 9 9 9 9
9 9
30
30 150000 150000
7 4 5
17 7
0.966 10 0.686 1290 0.966 25 0.686 3230 0.966 50 0.686 6460 0.966 100 0.686 12900
0.966 25 0.835 13100 0.966 25 0.686 3230 0.966 25 0.203 101 0.966 2.25 0.835 1180 0.966 2250 0.203 9090 0.966 1000 0.0493 9810
0.966 25 0.686 3230 0.77 25 0.721 3580 0.711 25 0.750 3790 0.70 25 0.804 4160 0.725 25 0.816 4270 0.760 25 0.831 4350
0.966 25 0.686 3733 3230 0.966 10 0.686 1490 1290 0.77 25 0.802 8290 8100 0.77 10 0.802 3320 3240 0.958 0.4 0.902 8771 8443 0.958 0.15 0.902 3290 3170 0.711 25 0.731 3530 3260 0.70 25 0.755 2780 2610 0.70 19 0.771 2420 2261 0.75 15 0.835 3810 3569 0.76 15 0.820 2400 2270
HOPG (p = 2.25 g/cm3, Cp = 1.48 J/g K, D, (c-axis) = 0.027 cm’/s) E 1064 9 1.52 a 25 0.718
1064 9 1.52 37 0.718 1064 9 1.52 45 0.718 694 30 1.52 21 0.835 532 0.02 1.52 7000 0.214
2180 3230 3920 3890 8570
’ Calculated from ref. 23.
smaller ATP than the Nd : YAG even though the penetration depth is smaller. The XeCl excimer laser (308 nm) results in a 3100 K AT for 15 MW/cm* power density.
Finally, predictions of AT for illumination of the basal plane of HOPG are given in group E. Based on published data [19], k for HOPG varies slowly in the 500-1064 run range, and is assumed equal to the value at 515 nm (1.52). Differences

134
in (1 - R), D,, and k for HOPG compared to GC lead to significantly smaller ATr for the same conditions, with a 25 MW/cm* Nd : YAG pulse producing a 2200 K rather than 3200 K temperature excursion. Our laboratory has reported a damage threshold for the Nd: YAG fundamental on HOPG of 45 MW/cm* [4,5] corre- sponding to a ATr of 3920 K. Steinbeck et al. [lo] note a threshold of 0.63 J/cm* for a ruby laser (694 nm, 30 ns), corresponding to 3890 K. Despite differences in I,,, and X, and t,, the laser damage to HOPG occurs at similar ATr values close to the melting point of the carbon. Before this correlation is considered firm, however, note that the 140 mJ/cm* damage threshold reported by Malvezzi et al. [13] for 20 ps pulses on HOPG corresponds to a much higher surface temperature, shown in the last entry of Table 1.
EXPERIMENTAL
Except for the choice of laser, the activation experiments were conducted with the apparatus described previously [1,3]. The Nd: YAG fundamental (1064 nm, 9 ns) and second harmonic (532 nm, 7 ns) from a Quantel 580-10 and the fundamen- tal of a XeCl excimer (308 nm, 17 ns) were directed onto a GC electrode defined by a teflon washer on a GC disk. Power density was measured with a Scientech CW thermal power meter placed after the teflon aperture which defined the electrode diameter (0.9 mm). With the laser operating at ca. 10 Hz, the power density equalled the average power passing through the aperture divided by the repetition rate, pulse width and aperture area. The manufacturer’s stated pulse widths were verified with a fast photodiode and 400 MHz oscilloscope. As noted previously, the power densities stated here are f20X due to spatial and shot-to-shot power variation. Power density measurements were made with the cell window in place, but losses due to solvent absorption were ignored.
Passage of the laser beam through the teflon aperture produced Fresnel diffrac- tion and accompanying power density fluctuation at the electrode. This effect leads to a ca. f 20% spatial variation in power density which is largest nearest the edge of the illuminated area. For ordered materials such as HOPG, this phenomenon causes variable laser damage and was avoided by laser activation in the absence of any aperture. As will be shown below, the Fresnel diffraction effect is minor compared to effects of laser wavelength, and will be ignored.
All laser activation procedures involved three laser pulses delivered to a freshly polished electrode (0.05 pm Buehler alumina, on Texmet polishing cloth) in the solution of interest. Although ultraclean polishing has been demonstrated to lead to high electron transfer rates [16], the conventional procedure was used here to best illustrate laser effects. Repolishing after each activation experiment eliminated cumulative effects of repeated activation. Test redox systems included ascorbic acid (AA) in pH 7.0 phosphate buffer and Fe *+I’+ [from Fc(NH,),(SO,),] in 1 M H,SO,. The experimental approach involved observation of AA and Fe2+j3+ voltammograms as a function of laser wavelength and power density. GC was Tokai GC-20 in all cases.
135
RESULT?, AND DISCUSSION
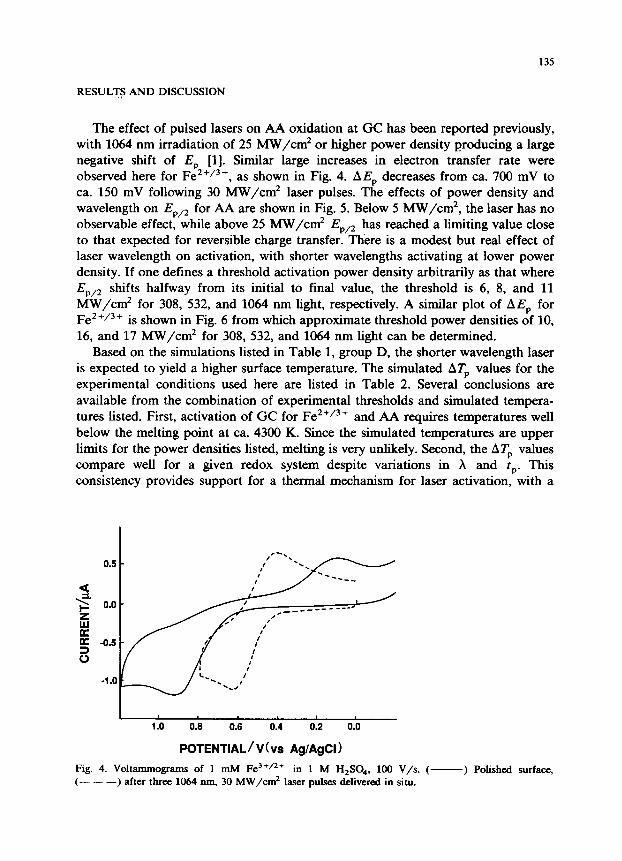
The effect of pulsed lasers on AA oxidation at GC has been reported previously, with 1064 nm irradiation of 25 MW/cm* or higher power density producing a large negative shift of E,, [l]. Similar large increases in electron transfer rate were observed here for Fe2+13+, as shown in Fig. 4. AEr decreases from ca. 700 mV to ca. 150 mV following 30 MW/cm* laser pulses. The effects of power density and wavelength on Ep,* for AA are shown in Fig. 5. Below 5 MW/cm’, the laser has no observable effect, while above 25 MW/cm* E,,,* has reached a limiting value close to that expected for reversible charge transfer. There is a modest but real effect of laser wavelength on activation, with shorter wavelengths activating at lower power density. If one defines a threshold activation power density arbitrarily as that where E p,2 shifts halfway from its initial to final value, the threshold is 6, 8, and 11 MW/cm* for 308, 532, and 1064 nm light, respectively. A similar plot of AE, for Fe2+j3+ is shown in Fig. 6 from which approximate threshold power densities of 10, 16, and 17 MW/cm* for 308, 532, and 1064 nm light can be determined.
Based on the simulations listed in Table 1, group D, the shorter wavelength laser is expected to yield a higher surface temperature. The simulated ATr values for the experimental conditions used here are listed in Table 2. Several conclusions are available from the combination of experimental thresholds and simulated tempera- tures listed. First, activation of GC for Fe2+13+ and AA requires temperatures well below the melting point at ca. 4300 K. Since the simulated temperatures are upper limits for the power densities listed, melting is very unlikely. Second, the ATr values compare well for a given redox system despite variations in X and I,. This consistency provides support for a thermal mechanism for laser activation, with a
0.5 -
1.0 0.6 0.6 0.4 0.2 0.0
POTENTIAL/V(vs AglAgCl)
Fig. 4. Volt-ograms of 1 mM Fe3+12+ in 1 M H,SO,, 100 V/s. (- ) Polished surface, (- - -) after three 1064 nm, 30 MW/cm2 laser pulses delivered in situ.

136
0.15
3 0 a 0.10
a a * 0.05 >
> -i 0.0 w”
x1064 nm 0 532 nm l 308 nm
0 5 10 15 20 25 30 35 40 45
POWER DENSlTY/MW cmS2
Fig. 5. Half peak potential for ascorbic acid oxidation on GC-20 in pH 7.0 phosphate buffer. Each point was determined from a freshly polished surface which was laser activated at the wavelengths and power
densities indicated. Smooth curves are for clarity and do not imply any fit to the results. Scan rate was 100 mV/s.
fairly weak dependence on laser wavelength. Third, the activation temperatures for AA differ significantly from those for Fe ‘+j3+. Although few details are available on laser activation of Fe2+13+ on GC, the higher temperature required may imply a different activation mechanism from that of AA. Although conjecture at this point, it is possible that Fe2+j3+ requires surface chemical changes beyond surface cleaning. Fourth, the 20-25 MW/cm2 (at 1064 nm) power densities used in previous investigations are well above the thresholds observed for GC, and imply ATP values
x1054 nm 0532 mn l 308 nm
i
0.1 1 I 0 10 20 30 40 50 60
POWER DENSITY/MW cti2 Fig. 6. AEP for Fe2+j3+ . m 1 M H,SO, in same format as Fig. 5.

137
TABLE ?;
Simulated threshold AT,, for GC, in water
System h/mm Wns I,, (threshold) ‘/MW cm-’ ATDb/K
AA 308 17 6 1524
532 7 8 1130
1064 9 11 1620
Fe2+/3+ 308 17 10 2540 532 7 16 2260
1064 9 17 2530
a Observed laser power density producing an EP,2 or AEP value midway between the fully activated and
unactivated values.
b Simulated surface temperature change for the experimental conditions present at threshold.
of 2500-3300 K. Finally, laser power densities above those required to reach the activation temperatures may be unnecessary or even counterproductive. Excessive laser power may lead to high background or extensive surface damage. Using the temperature simulation as a guide, these effects can generally be avoided.
As noted earlier, higher laser powers are required to heat basal plane HOPG, due mainly to higher reflectivity and density. The 45 MW/cm’ damage threshold for 1064 nm, 9 ns pulses produces a comparable ATr to the 30 ns, 21 MW/cm’, 694 nm ruby laser pulses required to initiate melting of HOPG [lo]. Although melting may occur during laser induced damage of HOPG, it may not be required. An alternative mechanism involves constrained thermal expansion of the heated graphite which can occur at temperatures below the melting point [14]. The significantly higher simulated temperatures required to activate or damage HOPG may imply a differ- ent activation mechanism for HOPG vs. GC.
Although laser activation of Pt electrodes has been demonstrated [2], it has not been studied in detail. Nevertheless, it is useful to compare predicted surface temperatures for Pt vs. GC electrodes. Based on physical constants for Pt at room temperature [24], the thermal diffusivity (0.251 cm*/s) is much higher than that of GC (0.0467 cm2/s) as is its reflectivity (ca. 70% rather than 15%). Primarily because of these differences, the laser power required to heat a Pt surface is significantly higher than that for GC. For example, a 1064 nm, 9 ns, 25 MW/cm2 pulse is predicted to heat a Pt surface by 630 K, while 100 MW/cm* would produce a 2500 K surface temperature excursion (ignoring melting). There is no assurance that the activation mechanisms are similar on Pt and GC, but the point remains that higher laser power densities are required to heat a more reflective, higher thermal conduc- tivity material.
CONCLUSIONS
While there are obvious limitations to the simulations presented here, the predicted ATp values do illustrate the effects of laser wavelength, pulse duration, and power density on surface temperature. Since phase changes are ignored in the simulation, the ATp values should be most reliable for activation in air or inert gas
138
and ATr values below 4300 K. The most significant experimental observation is the weak dependence of activation on laser wavelength. This observation is consistent with a completely thermally driven activation mechanism, and rules out photochem- ical effects in the wavelength range examined. It is important to note that different lasers produce markedly different ATr values for a given power density, and one should not assume that a threshold power density for activation will apply across all laser parameters. The current results imply that the peak surface temperature controls activation rather than power density per se. It appears that AA activation requires a ATp of ca. 1500 K, even if X, 1, or I, are varied. The temperature simulations are consistent with our previous conclusion that laser activation of GC involves primarily surface cleaning while activation of HOPG requires creation of edge plane sites [14]. The lower temperatures required for GC activation (1500-2500 K) may be adequate for surface cleaning but insufficient for graphite lattice damage which does not occur until ca. 4000 K. This possibility is corroborated by the observation that the Raman spectrum of GC does not change upon laser activation [14], while that of HOPG does [4]. Finally, the nitrogen, iodine, and YAG lasers used in several investigations of laser activation are predicted to lead to quite different surface temperature excursions. Variables of pulse duration, power density, and wavelength should be considered when choosing activation conditions.
REFERENCES
1 M. Poon and R.L. McCreery, Anal. Chem., 58 (1986) 2745. 2 M. Poon and R.L. McCreery, Anal. Chem., 59, (1987) 1615.
3 M. Poon and R.L. McCreery, Anal. Chem., 60, (1980) 1725. 4 R.J. Bowling, R.T. Packard and R.L. McCreery, J. Am. Chem. Sot., 111 (1989) 1217.
5 R.J. Rice and R.L. McCreery, Anal. Chem., 61 (1989) 1637.
6 L. Bodalbhai and A. Brajter-Toth, Anal. Chem., 60 (1988) 2557. 7 K. Stuhk, D. Brabcova and L. Kavan, J. Electroanal. Chem., 250, (1988) 173.
8 R. Alkire and M. Feldman, J. Electrochem. Sot., 135 (1988) 1850.
9 T. Strein and A.G. Ewing, Anal. Chem., 63 (1991) 194.
10 J. Steinbeck, G. Braunstein, M.S. Dresselhaus, T. Venkatesan and D.C. Jacobson, J. Appl. Phys., 58
(1985) 4374. 11 J.S. Speck, J. Steinbeck and M.S. Dresselhaus, J. Mater. Sci., 5 (1990) 980. 12 J. Heremans, C.H. OJk, G.L. Esley, J. Steinbeck and G. Dresselhaus, Phys. Rev. Lett. 60 (1988) 452.
13 A.M. Malvezzi, N. Bloembergen and C.Y. Huang, Phys. Rev. Lett., (1986) 146. 14 R. Rice, N. Pontikos and R.L. McCreery, J. Am. Chem. Sot., 112 (1990) 4617.
15 K.D. Stemitzke and R.L. McCreery, Anal. Chem., 62 (1990) 1339. 16 I.F. Hu, D.H. Karweik and T. Kuwana, J. Electroanal. Chem., 188 (1985) 59.
17 R.L. McCreery, in A.J. Bard (Ed.), Electroanalytical Chemistry, Vol. 17, Marcel Dekker, New York, 1991, pp. 221-314.
18 R.J. Rice, M.Sc. Thesis, The Ohio State University, 1987.
19 E.A. Taft and H.R. Phillip, Phys. Rev., 138 (1965) A197.
20 M.W. Williams and E.T. Arakawa, J. Appl. Phys., 43 (1972) 3460. 21 W.G. Driscoll, in W. Vaughn (Ed.), Handbook of Optics, McGraw-Hill, New York, 1978, p, 10-10. 22 J.F. Ready, J. Appl. Phys., 36 (1963) 462. 23 N. Wada and S. Solin, Physica, 105B (1981) 353. 24 R.C. Weast (Ed.), CRC Handbook of Chemistry and Physics, 66th ed., CRC Press, Boca Raton, FL,
1985.


![Generation of short pulses 2.7 fs. Ultrashort pulse generation 15 fs pulse Time [fs] Wavelength [m] Single cycle pulse.](https://static.fdocuments.net/doc/165x107/56649d2b5503460f94a00e2a/generation-of-short-pulses-27-fs-ultrashort-pulse-generation-15-fs-pulse.jpg)


