Effects of Traditional versus Electronic Note Taking in a ...
58
Louisiana State University LSU Digital Commons LSU Master's eses Graduate School 2015 Effects of Traditional versus Electronic Note Taking in a High School Biology Classroom Chelsea Ann Duhon Louisiana State University and Agricultural and Mechanical College Follow this and additional works at: hps://digitalcommons.lsu.edu/gradschool_theses is esis is brought to you for free and open access by the Graduate School at LSU Digital Commons. It has been accepted for inclusion in LSU Master's eses by an authorized graduate school editor of LSU Digital Commons. For more information, please contact [email protected]. Recommended Citation Duhon, Chelsea Ann, "Effects of Traditional versus Electronic Note Taking in a High School Biology Classroom" (2015). LSU Master's eses. 4179. hps://digitalcommons.lsu.edu/gradschool_theses/4179
Transcript of Effects of Traditional versus Electronic Note Taking in a ...

Louisiana State UniversityLSU Digital Commons
LSU Master's Theses Graduate School
2015
Effects of Traditional versus Electronic Note Takingin a High School Biology ClassroomChelsea Ann DuhonLouisiana State University and Agricultural and Mechanical College
Follow this and additional works at: https://digitalcommons.lsu.edu/gradschool_theses
This Thesis is brought to you for free and open access by the Graduate School at LSU Digital Commons. It has been accepted for inclusion in LSUMaster's Theses by an authorized graduate school editor of LSU Digital Commons. For more information, please contact [email protected].
Recommended CitationDuhon, Chelsea Ann, "Effects of Traditional versus Electronic Note Taking in a High School Biology Classroom" (2015). LSU Master'sTheses. 4179.https://digitalcommons.lsu.edu/gradschool_theses/4179

EFFECTS OF TRADITIONAL VERSUS ELECTRONIC NOTE TAKING IN A HIGH SCHOOL BIOLOGY CLASSROOM
A Thesis
Submitted to the Graduate Faculty of the Louisiana State University and
Agricultural and Mechanical College in partial fulfillment of the
requirements for the degree of Master of Natural Science
in
The Interdepartmental Program in Natural Sciences by
Chelsea Ann Duhon B.S., Louisiana State University, 2012
August 2015

ii
ACKNOWLEDGEMENTS I thank my committee members, Dr. Joseph F. Siebenaller and Dr. Christopher Gregg and especially my committee chair, Dr. William Wischusen. Thank you for your support and your kind wisdom. Dr. Wischusen, I especially thank you for pushing me and for pulling me back when I started running in circles. I also thank LaMSTI Biology cohort of 2013, without each of your laughs, tears, and exceptional knowledge we couldn’t all be winners. To my students, parents, friends, and fellow MSA-‐W teachers: thank you for putting up with all my #gradschoolproblems. This work was supported by NSF Grant 098847.

iii
TABLE OF CONTENTS
ACKNOWLEDGEMENTS ______________________________________________________ii ABSTRACT _________________________________________________________________ iv INTRODUCTION _____________________________________________________________ 1 METHODS AND MATERIALS __________________________________________________ 5
RESULTS ____________________________________________________________________ 9
DISCUSSION ________________________________________________________________ 18
BIBLIOGRAPHY _____________________________________________________________ 22
APPENDIX A: LA/TN ALIGNMENT ____________________________________________ 26
APPENDIX B: UNIT 1 PRE/POST TEST _________________________________________ 33
APPENDIX C: UNIT 2 PRE/POST TEST _________________________________________ 38
APPENDIX D: UNIT 3 PRE/POST TEST _________________________________________ 43
APPENDIX E: UNIT EXAM QUESTION ALIGNMENT _____________________________ 47
APPENDIX F: ENGAGEMENT SURVEY ________________________________________ 49
APPENDIX G: IRB APPROVAL ________________________________________________ 52
VITA _______________________________________________________________________ 53

iv
ABSTRACT This study investigated the effect of traditional and electronic note taking on student achievement and engagement in a Louisiana high school biology classroom. Over a 20-‐week period, traditional students (n= 58) took notes using pencil and paper and electronic note takers (n=46) used their laptop computers. Each group of students was given identical pre and posttests covering three units and a practice End of Course exam. Normalized learning gains were compared for each unit and suggest there is no significant difference in academic achievement between the traditional note takers and the electronic note takers. An attitudinal survey was also administered and indicated that both electronic and traditional note takers preferred taking notes traditionally. Observations conducted by the teacher indicated a low occurrence of off task behavior; there were no significant differences between note taking groups. Results that were self-‐reported by the students show greater off task occurrences, especially within the electronic group. Teachers should carefully consider integrating technology into the note taking process. Since electronic note taking affects student engagement, but does not impact student achievement, allowing students the freedom to choose whichever method they prefer may positively impact classroom culture.
1
INTRODUCTION Educators have a very important job to do: they teach. The question of how students learn best is often a topic of conversation within schools and teacher preparation programs. Educators are being held to higher standards and accountability within the profession is at an all time high. Schools, and in some cases, individual teachers, are being rated based on student performance on ever changing state mandated tests. There has been a clear shift from multiple-‐choice assessments led by No Child Left Behind (NCLB) to Common Core and PARCC assessments where students are required to write and apply content knowledge across disciplines (Conley, 2015). Some state mandated tests, like an End of Course Exam (EOC), require students to pass to graduate, and the ACT, once known as the American College Test, determines college and career readiness. Educators around the country are asking themselves what they can do to better prepare their students for the future. Studies support many different types of cognitive strategies for how people learn (Dunlosky et al., 2013; Bransford et al., 2001; Billing, 2007; Lemov, 2010,). One essential cognitive learning strategy is note taking. This strategy has been successfully implemented across all disciples and with students of all ages. For almost 90 years the education community has indicated the importance of note taking highlighting its positive effects on student achievement (Crawford, 1925; Fisher and Harris, 1974; Hartley and Davies, 1978; and Kiewra, 1985; Marzano et al., 2001). Traditionally note taking is defined as the process of capturing key ideas and concepts. These can be in the form of textual outlines, guided notes, concept maps and webs. DiVesta and Gray (1972) divided the process of note taking into two specific functions: the encoding function, which is the process of recording the notes, and the storage function, which is the process of reviewing the notes. Across 24 studies, reported by Hartley (1983) and Kiewra (1985), the process of integrating both the storage function and the encoding function, together rather than either function alone, has been the most beneficial note taking mechanism for boosting content retention across disciplines. The encoding function involves the process of recording content. This recording process can be in the form of concept maps, guided notes, outlines, recorded verbatim or summarized from the instructor, or any other written form of the presented content. The process of encoding content allows for facilitation of learning, even in the absence of review. A meta-‐analysis of over 100 studies of note taking across multiple disciplines and grade levels by Beesley and Apthorp (2010) illustrates a large overall effect, a Hedges’ g=0.90, demonstrating a positive effect of note taking on performance. In these studies, students were asked to take notes while listening to a lecture while another group was asked to only listen to the lecture. Neither group reviewed the material. Students who took notes performed on the final assessments than students who did not take notes, indicating the function of encoding within note taking is a primary cognitive strategy to improve student performance. The storage function of note taking is the process of reviewing notes as a mechanism to facilitate retention. The storage function can be applied to any encoded notes, regardless of the mechanism of encoding. The validity of the storage function has been established by multiple studies measuring the performance of students who studied notes versus students who did not

2
study notes (Kiewra, 1989). There are various methods of storing information, or studying, and there is an overwhelming amount of information indicating the storage function is beneficial to student achievement (King, 1992; Kiewra, 1985a). The storage function allows for review of the material while the encoding function describes the cognitive process of taking notes. Although the application of the storage function is more beneficial than the encoding function alone, encoding a complete note set is essential for storage and therefore essential to increase student achievement (Carter and Van Matre, 1975; Fisher and Harris, 1974; Kiewra, 1985; Rickards and Friedman, 1978). This indicates the necessity for both facets of note taking, the storage and encoding function, used together to boost student achievement (Hartley, 1983; Kiewra, 1985; Kiewra, 1989). By 2008 public schools in the United States had an average of 189 instructional computers on site, which was an increase from only 72 instructional computers in 1995 (U.S. Department of Education) (Figure 1). More computers on each site meant that the student to computer ratio across the country decreased. By 2008, there was one computer for every three students. This increase in available technology made it possible for teachers to integrate projects and activities that involved the use of student computers, shifting the classroom culture from teacher centered to student centered (Figure 2). In recent years, many schools are electing to participate in a 1:1 ratio where each student and teacher is in possession of a laptop. These investments are made for a variety of reasons, some including preparation for future jobs, increased exposure for low income students, and even classroom reform, specifically to make students and teachers more effective (Zucker and Light, 2009). Apple, Inc, in collaboration with many universities, research institutions, and teachers, has contributed to the 1:1 program and has conducted studies with hundreds of students and teachers across the country to evaluate the benefits of a 1:1 ratio. The Apple Classrooms of Tomorrow Initiative has concluded that these 1:1 programs can significantly increase the potential of student learning and engagement (Dwyer, 1994), however these findings may not be valid since this study was not independently tested. Because of a increase in available technology and state and district initiatives pushing for teachers to incorporate technology into their curricula and instruction, it is increasingly important to evaluate the effects of using computers as a metacognitive learning strategy.
Figure 1. Average number of computers for instructional purposes, in U.S. public schools from 1995-‐2008 (U.S. Department of Education).
0
50
100
150
200
250
300
350
1995 2000 2005 2008
Average number of com
puters
per school
Year
Elementary Secondary Average

3
Figure 2: Ratio of students to instructional computers, in U.S. public schools from 2000-‐2008 (U.S. Department of Education).
Students and teachers agree that computers can help promote student engagement, however much of the literature on implementing technology within the classroom shows conflicting impacts on student achievement. On one hand, the use of computers within the classroom provides students with access to a variety of supplemental resources, promotes active learning (Alavi, 1994), and increases student perception of engagement (Driver, 2002). While other sources show students become more distracted and are more likely to multitask in class, leading to lower comprehension of the material (Sana et al., 2013; Wood et al, 2012). This lack of consensus in current studies evaluating the effectiveness of computer use within the classroom warrants additional review. A recent study by Oppenheimer and Mueller (2014) examined the effects of taking traditional notes versus laptop notes. The study integrated the traditional encoding function with the idea of electronic encoding. Part one of the study showed that taking notes using pencil and paper had the same effect as taking notes using a computer when students were tested on factual knowledge. It did not have the same effect when students answer conceptual questions. Students who took notes electronically do not perform as well as traditional note takers when conceptual understanding is assessed. The by Oppenheimer and Mueller (2014) showed that the electronic note takers encode more notes than the traditional note taker, and of those notes, an average of 14.6% were verbatim for the electronic encoder compared to an average of 8.8% for traditional encoders. Although participants who encode more notes perform better, the best indicators of performance are encoded notes with less verbatim overlap. This study highlights the effects of laptops increasing quantity of notes during encoding but also demonstrates that this mechanism is not enough to increase higher metacognitive learning. In part two of the study, students in the electronic note taking group were asked to take notes as they normally do, but to try to avoid transcribing the lecture word for word since verbatim notes seem to inhibit student achievement. The results showed factual learning did not change between the two groups but conceptual understanding improved in the traditional note taking
0 1 2 3 4 5 6 7 8 9
2000 2005 2008
Student to computer ratio
Year
Elementary Secondary Average

4
group. The note taking intervention for the electronic group was determined to be unsuccessful since the electronic notes continued to be a verbatim copy of the lecture; the note set from study one was not statistically different from the note set in study two (Oppenheimer and Mueller, 2014). In part three of the study the students were broken into four groups. Two groups were traditional note takers and two groups were electronic note takers (Oppenheimer and Mueller, 2014). One group from traditional and one group from electronic were allowed to study their note sets for 10 minutes before being assessed while the other groups were assessed immediately following taking notes. This assessed the storage function, the process of reviewing the material, and encoding functions, the process of recording the material, together to determine the effects on student achievement. The results indicated that participants who encoded traditional notes and had time to study performed significantly better than all other participants. Surprisingly, traditional encoders out performed electronic encoders on factual questions and there was no statistical difference on conceptual questions. Results from part three of the study were inconsistent with parts one and two, displaying the necessity for studies in classrooms instead of cognitive learning labs. An interesting overall analysis of the student generated notes from Oppenheimer and Mueller, (2014) showed a positive correlation between the number of words within a note set and the participants score as well as a negative correlation between the percentage of verbatim notes and the participants score. This may indicate that although encoding more notes is beneficial, it is important to examine the quality of notes as well. Oppenheimer and Mueller concluded that encoding more notes is beneficial, provided the notes are summarized in the participants’ own words, which involves the proper implementation and practice of encoding strategies targeting quality notes. In light of the current literature and the increased implementation of technology in the classroom, the present study was designed to test the effectiveness of the encoding function. Specifically, this study aims to determine actual engagement, perceived engagement, preference and academic achievement of the participants within two modes of note-‐taking, traditional compared to electronic.

5
METHODS AND MATERIALS
Study Population Demographics This study took place in fall of 2014, over a period of 20 weeks from August 11-‐December 19, covering three units, which were taught by the same teacher. All participants included in this study attended Iberville Parish Math, Science, and Arts Academy-‐West (MSA-‐W). Of the 101 ninth grade students in the study, 57% were Caucasian students, 43% African American students and 1% were other ethnicities. The gender breakdown of the population was 64% female and 36% male. The majority of the population, 66%, receives free or reduced lunch indicating an overall low socioeconomic status of the study population (Table 1). The participants’ in this study were fairly representative of the MSA-‐W school’s population (Table 1). Table 1. Demographics of Iberville Math, Science, and Arts Academy-‐West and the study population
School Population
Electronic Group
Traditional Group
Total Study Population
Ethnicity Caucasian 55% 57% 57% 57%
African American 42% 43% 41% 43% Other 3% 0% 2% 1% Gender Female 53% 66% 62% 64% Male 47% 34% 38% 36%
Economic Status Free/reduced lunch 78% 61% 69% 66%
Full priced 22% 39% 31% 33%
Control versus Experimental Groups This study compared the effects of traditional note taking versus electronic note taking in a ninth grade biology class. Participants in the study were broken into two groups. Group 1, the control group, completed a note set traditionally. Traditional note taking required the participants to hand write a paper copy of their notes. Group 2, the experimental group, completed the same note set electronically using their school provided laptop (Table 2). Electronic note taking required participants to type their notes creating a digital copy of the material (Table 2). In this study, a note set was composed of teacher given descriptions, pictures, analogies, examples, annotations, questions and/or student comments. Prior to experimentation, students were taught annotation skills. The electronic note takers were given the same activity but also given time to annotate using Microsoft Word. Both groups received instruction and practiced note taking before the study. They were coached on specific tools to assist in effective outlining, prompted to recognize cuing, and facilitate effective summarizing either on paper or electronically.

6
Table 2. Number of participants in each group, control (traditional note takers) and experimental (electronic note takers) by unit
In order to be included in the study, each student had to complete the pretest and the posttest as well as the note set according to his or her test group. Specifically, students were eliminated from the study if they did not take the pre-‐test within three days of the initial testing date. This ensures that students were not exposed to the content of the unit prior to taking the pre-‐test. Students were not eliminated if they delayed post-‐testing, since no additional material on that unit was presented. The criterion to be included in the study applied to each of the three units covered and a participant’s data could have been used in one, two, and/or three of the units. For End Of Course (EOC) data to be included participants must have been present for the first and second practice exam as well as the actual EOC issued by the state of Louisiana (Table 2). Instruments Measuring Academic Achievement Table 3 shows a breakdown of the material and assessments given in each of the three units taught as well as a practice End of Course Exam (EOC). Unit one includes scientific method and inquiry, unit two includes cellular functions and cellular transport, unit three includes photosynthesis and cellular respiration, and EOC includes a sample of all Biology content, outlined by the state of Louisiana and its Biology Grade Level Expectations (GLEs). Both treatment groups completed a pretest, participated in class activities, received the opportunity for homework, and completed a posttest for each unit. At the end of the study, every participant completed a student engagement survey. Table 3. Unit breakdown with assessments used to determine academic achievement
Unit Unit 1 Unit 2 Unit 3 EOC Content Scientific Inquiry
and Scientific Method
Cells Photosynthesis and Cell Respiration
All Louisiana 9th grade Biology content
Assessments Pre-test Pre-test Pre-test Pre-test Post-‐test Post-‐test Post-‐test Mid-‐year post-‐test
Participants were initially assessed using a Biology practice EOC pretest to determine individual prior knowledge of biology content. The Biology practice EOC was composed of 65 multiple-‐choice questions and was given a second time at the conclusion of the study to determine student growth over one semester. Because Louisiana does not have a complete Biology Practice EOC, Tennessee’s Biology End of Course Assessment Practice Test was used to determine initial content knowledge as well as cumulative individual normalized learning gains (NLGs) (Hake, 1998) over one semester. The performance indicators for the Biology curriculum in Tennessee align with Louisiana grade level expectations (Appendix A). Participants were also given an additional pretest at the beginning of each unit. Unit 1 pre/post test, scientific method and inquiry, included 30 multiple-‐choice questions and five short answer questions (Appendix B). Unit 2 pre/post test, cells and cell transport, included 30 multiple-‐choice questions and five
Method of note-‐taking
Unit 1 participants
Unit 2 participants
Unit 3 participants
EOC participants
Survey Participants
Traditional 57 55 53 57 54 Electronic 43 36 38 43 46

7
short answer questions (Appendix C). Unit 3-‐pre/post test, photosynthesis and cellular respiration, included 30 multiple-‐choice questions and five short answer questions (Appendix D). The questions used on each unit test were adapted from Pearson Education, a publishing and assessment company. PearsonSuccessNet aligns assessments specifically to Louisiana Biology GLEs and Louisiana Biology Content Standards to aid in mastery of biology content (Appendix E). Instruments Measuring Student Engagement To measure the students’ engagement, two different methods were used. The first method of engagement data collection measured student perceived engagement. An attitudinal survey consisting of 10 engagement questions was administered two months after the final unit post-‐test (Appendix F) using the online survey data collection software, Survey Monkey. The goals of the survey were to gauge how students felt during the note-‐taking activity and evaluate their perception of their successes and engagement while taking notes. During semester one, students were assigned note-‐taking groups. They were required to complete their notes using either a traditional method or an electronic method. During semester two, however, students were allowed to choose their method of note taking. Although no instruments were used to collect data on academic achievement for semester two, students were able to gain exposure and experience with both note-‐taking methods allowing them to better answer the attitudinal survey. The second method of measuring student engagement was teacher observed. Students were systematically observed twice during each unit to determine teacher-‐observed engagement, for a total of six recorded observations during the study. For the purposes of this study, engagement during note taking was determined by three factors:
1. Students were on the correct note-‐taking slide. 2. Students were only taking notes, not doing any other activity. 3. Students were actively participating or listening during lecture, commonly known as
“zoned in” instead of “zoned out.” The teacher walked around the room during notes observing all students and recorded which students were not engaged in the lesson. Analysis of Academic Achievement The pretest scores of units 1, 2, 3 and EOC were compared to the posttest scores of each, respectively, to determine normalized learning gains for each student on each assessment (Equation 1)(Hake, 1998). Negative normalized learning gain values were substituted with 0 when pretest scores were greater than posttest scores. Comparisons between the treatment groups were made looking at averages and standard error as well as using an unpaired t test with Welch’s correction (Prism 6 for Mac OS X). Data were also collected from subpopulations within the note-‐taking groups. Two-‐way analyses of variances (ANOVA) were completed to determine whether there were differences between males versus females, blacks versus whites, and regular economic status versus low economic
G= posttest % – pretest % 100-‐pretest %
Equation 1: Normalized Learning Gain

8
status. A linear regression was done to look for trends between normalized learning gains of traditionally high achieving students and traditionally low achieving students. Students categorized in a low economic status were students who received free or reduced priced lunch where regular economic status student paid full price. Students’ GPAs at the start of the year were used as an achievement indicator. Specifically, students starting with a GPA of a 3.1 or above were considered traditionally high achieving while students with a 3.0 or below were considered low achieving. No students started the year with less than a 2.0 GPA. Analysis of student engagement Student engagement was measured two ways. The first method was self-‐reported by the students. These survey responses were analyzed two ways for each note-‐taking group, including chi-‐square tests and a binominal test. For the binomial test, only student responses that exhibited a strong preference for either traditional or electronic note taking were considered. The total engagement on the survey was calculated by averaging the student’s off task behavior per class. This was analyzed by an unpaired t test with Welch’s correction. The second method measuring student engagement was teacher observation. Teacher observed engagement was analyzed by summing off-‐task behavior during six observations. Off task behavior was analyzed using an unpaired t test, also with Welch’s correction, and a linear regression. Institutional Review Board Approval This project was approved by the Louisiana State University Institutional Review Board, exemption #E8824 (Appendix G), and Iberville Parish Schools. The students voluntarily participated in this study and provided a signed student assent form and a signed parental consent form.

9
RESULTS Traditional and Electronic Initial Comparison Of the 103 students who participated in this study, 57 made up the traditional note-‐taking group and 46 made up the electronic note-‐taking group. The Integrated Louisiana Educational Assessment Program (iLEAP) data from students’ 7th grade year and the Louisiana Educational Assessment Program (LEAP) data from their 8th grade year were gathered prior to experimentation. The iLEAP and LEAP assessments are standard-‐based assessments where items are based on grade specific Louisiana academic content standards. Data from each of these tests were analyzed using an unpaired t test with Welch’s correction, assuming unequal standard deviations to determine if any differences existed within the test populations. There were no significant differences between treatment groups on the iLEAP test (p=0.9739). Students in the traditional note-‐taking group averaged 325.5 ± 5.292, n=50 and students in the electronic note-‐taking group averaged 325.3 ± 4.491, n=41, with no significant difference between the two. There were also no significant differences in student scores on the LEAP test (p=0.4940). Students in the traditional note-‐taking group averaged 335.0 ± 4.415, n=51, while electronic note-‐takers averaged 330.2 ± 5.436, n=43, also with no significant difference between the note-‐taking groups. When the average scores for subpopulation were compared, there were no significant differences. The average scores between each subpopulation of gender, race, socioeconomic status, or GPA were not significantly different on iLEAP and LEAP (Table 4). Table 4. Average Integrated Louisiana Educational Assessment Program (iLEAP) and Louisiana Educational Assessment Program (LEAP) scores for traditional and electronic note-‐taking groups broken down by subpopulations.
Traditional Group Electronic Group iLEAP LEAP iLEAP LEAP
Gender Male 332.1 337.4 322.2 327.6 Female 321.1 333.5 331.2 335.1 Race White 331.6 340.5 325.3 331.8 Black 317.7 328.3 325.3 328.2
Socioeconomic status
Below average 318.7 327.3 323.2 331.2 Average 338.8 350.8 328.6 328.7 GPA
Above 3.0 330.8 341.3 333.0 344.4 3.0 and below 315.4 321.9 315.1 316.0
Traditional and Electronic Note-‐Taking Comparison Normalized Learning Gains (NLGs) were calculated from pre and post-‐test data for Unit 1, Unit 2, Unit 3 and a Practice EOC (Equation 1). NLGs with negative values were changed to 0, assuming knowledge between pre and post-‐tests cannot be lost. These data were analyzed

10
using unpaired t tests with Welch’s correction, assuming unequal standard deviations. The average NLGs for traditional and electronic note-‐takers was not significantly different for any unit tested (Unit 1: p=0.2299, Unit 2: p= 0.5055, Unit 3: p=0.8208, Practice EOC: p=0.1953) (Figure 2).
Figure 3: Average normalized learning gains (NLG) ± standard error for traditional and electronic note takers respectively for Units 1 (n=57,43), Unit 2 (n=55,36), Unit 3 (n=53,38), and Practice End of Course examination (EOC) (n=57,43). There were no differences between the traditional and electronic note-‐taking groups.
Because there was no difference in learning gains between the traditional and electronic note taking groups, subpopulations were assessed to determine if the method of note taking affected normalized learning gains of students within those subgroups. Gender Students were also separated by gender within their note-‐taking groups. An ANOVA showed differences between normalized learning gains for each unit assessed (Figure 4). Unit 1 showed a statistical significance between NLG of the treatment groups (p=0.04) and some significant interaction between gender and the type of note taking (p=0.04). Specifically, electronic note taking reduced the normalized learning gains in males, but increased the normalized learning gains of females. Unit 1 data showed electronic note-‐taking females, who averaged a NLG of +0.52, exhibited greater gains than their male counterparts, whose NLG averaged +0.40 (Figure 4). The opposite was true for the traditional note-‐takers where males averaged a NLG of +0.58 compared to their female counterparts whose NLG was +0.52 (Figure 4). In Unit 2, however, there were no statistical differences or interactions. In Unit 3, there were no differences between gender and treatment, however there was some significant interaction between them (p=0.03). Specifically, electronic note taking reduced the normalized learning gains in males, but increased the normalized learning gains of females. Unit 3 data showed electronic note-‐taking females, who averaged a NLG of +0.61, exhibited greater gains than their male counterparts, whose NLG averaged +0.49 (Figure 4). The opposite was true for the traditional note-‐takers where males averaged a NLG of +0.62 compared to their female counterparts whose NLG was +0.56 (Figure 4). This is consistent with Unit 1 results.
0 0.1 0.2 0.3 0.4 0.5 0.6 0.7
Unit 1 Unit 2 Unit 3 Practice EOC
Average NLG
Units
Traditional Note-‐Taking
Electronic

11
When examining gender and NLG from Practice EOC, significant interactions (p=0.02) were evident, however these interactions were different from those interactions observed in Unit 1 and Unit 3. On the practice EOC, electronic note taking increased the normalized learning gains in males, but decreased the normalized learning gains of females. EOC data showed electronic note-‐taking males had an average NLG of +0.28, which was greater than the average NLG of electronic note-‐taking females, which was only +0.17.
Figure 4. Average normalized learning gains (NLG) ± standard error for males and females for traditional (T) and electronic note (E) takers respectively for Unit 1, Unit 2, Unit 3, and Practice End of Course examination (EOC). Series “A” or “a” is significantly different than series “B” or “b.”
Race Note-‐taking groups were also separated by race. An ANOVA was used to compare black students to white students, indicating there were no significant interactions between students’ normalized learning gains of a particular race within respective note-‐taking groups for any of the units tested (EOC: p= 0.9962, Unit 1: p=0.9596, Unit 2: p=0.2128, Unit 3: p=0.3461) (Figure 5). Economic Status The impact of economic status on normalized learning gains of students within the two note-‐taking groups was analyzed. Economic status was determined by the students’ lunch status. Those students who paid regular price for lunch were considered regular economic status and those students who received free or reduced lunch rates were considered low economic status. An ANOVA indicated no statistical differences in the interactions between NLG averages between the economic status and the note-‐taking method of these groups for each unit (EOC: p= 0.8761, Unit 1: p=0.5476, Unit 2: p=0.1261, Unit 3: p=0.3473) (Figure 6).
0
0.1
0.2
0.3
0.4
0.5
0.6
0.7
EOC Unit 1 Unit 2 Unit 3
Average Normalized Learnign Gain
Assessment
Males (T) (n=22)
Females (T) (n=36)
Males (E) (n=15)
Females (E) (n=29)
A a B b A a B b
A a B b

12
Figure 5. Average normalized learning gains (NLG) ± standard error for black and white students from the traditional (T) and electronic (E) note taking groups respectively for Unit 1, Unit 2, Unit 3, and Practice End of Course examination (EOC).
Figure 6. Average normalized learning gains (NLG) ± standard error for students categorized by economic status for traditional (T) and electronic (E) note-‐takers respectively for Unit 1 Unit 2, Unit 3, and Practice End of Course examination (EOC).
0
0.1
0.2
0.3
0.4
0.5
0.6
0.7
EOC:NLG Unit 1: NLG Unit 2: NLG Unit 3: NLG
Average Normalized Learning Gains
Assessment
Black (E) (n=19)
White (E) (n=25)
Black (T) (n=24)
White (T) (n=34)
0
0.1
0.2
0.3
0.4
0.5
0.6
0.7
0.8
EOC:NLG Unit 1: NLG Unit 2: NLG Unit 3: NLG
Average Learning Gains
Assessment
Low Economic Status(T) (n=40)
Regular Economic Status (T) (n=18)
Low Economic Status (E) (n=27)
Regular Economic Status (E) (n16)

13
GPA Students within note-‐taking groups were separated into subgroups based on their starting grade point averages. Students starting the year with high GPAs, 3.1 or above were compared to students starting the year with low GPAs, 3.0 and below. There were differences between these two groups, which was expected. However, when comparing high GPA students from both note-‐taking groups, there were no differences in average normalized learning gains (ANOVA, p=0.53). Similar results were found when low GPA students from both treatment groups were compared and no differences were found (ANOVA, p=0.17). Traditional note takers who had a GPA of 3.1 or above at the beginning of the year displayed a positive correlation between GPA and the sum of NLG for three units (Linear regression, p=0.003, y = 0.8887x -‐ 1.367, R² = 0.3341), however there was no correlation in high achieving students who took notes electronically (Linear regression, p=0.10, y = 0.4492x + 0.1770, R² = 0.3129). The slope of the high GPA traditional group was not significantly different than the slope of the high GPA electronic group (p=0.27), indicating that although a positive correlation exists in the traditional group, it is very weak (Figure 7). These trends shown for high GPA students were not present for students in the low group, who had a GPA of 3.0 or less. There were no differences in slope between traditional and electronic note takers (linear regression, p=0.35). There were also no correlations in traditional note takers (linear regression, p=0.07, y = 1.035x -‐ 1.438, R² = 0.1859) or in electronic note takers (linear regression, p=0.14, y = 0.5446x +0.0054, R² = 0.1512) between GPA and the sum of NLG from three units (Figure 8).
Figure 7: Correlation between High GPAs and the sum of normalized learning gains from Units 1, 2, and 3 for traditional (T) (y = 0.8887x -‐ 1.367, R² = 0.3341) (n=33) and electronic (E) (y = 0.4492x + 0.1770, R² = 0.3129) (n=20) note takers.
0
0.5
1
1.5
2
2.5
3
2 2.5 3 3.5 4
Total NLG
GPA
High GPA (T)
High GPA (E)
Linear (High GPA (T))
Linear (High GPA (E))

14
Figure 8. Correlation between Low GPAs and the sum of normalized learning gains (NLG) from Units 1, 2, and 3 for traditional (T)(y = 1.035x -‐ 1.438, R² = 0.1859) (n=15) and electronic (E) (y = 0.5446x +0.0054, R² = 0.1512) (n=22) note takers.
Student-‐Perceived Engagement and Preference Of 100 students surveyed from both groups of note takers, sixty-‐four percent of students perceive traditional note taking takes longer than electronic note taking (Table 5). However, 45% of students perceive the traditional note taking method to be easier and 52% feel they learn the most with this method. When self-‐reporting, 56% of students said they are most distracted when taking electronic notes and 51% prefer traditional note taking (Table 5).
The method of note taking during this study did not change the engagement or preferences of the student (Table 5). Both traditional and electronic note takers completed the survey with no significant differences in their responses. Students who used the traditional note-‐taking method, as well as students who used the electronic note-‐taking method, thought the traditional note-‐taking method was easier. Both groups also agree that traditional note taking is more time consuming, however they feel they are less distracted and they learn more when using the traditional note-‐taking method. Overall, the survey data shows that students prefer traditional note taking, they believe they learn the most from traditional note taking, and they perceive their grades are better when taking notes using a traditional method. The average number of times each group of students were not engaged in note taking for each class period differed between the traditional and electronic note takers (unpaired t test with Welch’s correction, p=0.04) (Table 5). The traditional note takers report they are likely to be distracted an average of 7.72 times per class and electronic note takers report a higher average of 8.74 distractions per class (Table 5). A binomial test was also conducted to determine differences in the note-‐taking preference of the students. Of those who exhibited a strong preference for either traditional or electronic note taking, 51 students, or 63%, preferred traditional and 30 students, or 37%, preferred electronic. If no bias existed, the preference ratio should be 50/50, however this was not the case. Twenty-‐six percent more students preferred taking note traditionally than electronically (p=0.01) (Table 5), indicating a clear preference of traditional note taking.
0
0.5
1
1.5
2
2.5
2 2.5 3 3.5 4
Total NLG
GPA
Low GPA (E)
Low GPA (T)
Linear (Low GPA (E))
Linear (Low GPA (T))

15
Table 5. Attitudinal survey comparing preferences of traditional note takers, electronic note takers, and traditional and electronic note takers combined, indicating an overall preference for traditional note taking, which are highlighted in green.
Electronic notes (%)
Traditional notes (%)
Both, Neither or Not Sure (%)
I feel note taking is easiest when using… Traditional note takers 28 48 24
Electronic note takers 26 41 32
Total 27 45 28
I feel like note taking takes the longest when… Traditional note takers 19 70 9
Electronic note takers 33 57 11
Total 25 64 11
I feel like I learn the most when… Traditional note takers 17 57 25
Electronic note takers 24 46 21
Total 20 52 28
I prefer… Traditional note takers 30 58 13
Electronic note takers 31 44 24
Total 30 51 18
I learn more from… Traditional note takers 20 56 25
Electronic note takers 27 50 24
Total 23 53 24
I am most distracted when… Traditional note takers 57 11 26
Electronic note takers 54 15 29
Total 56 13 31
My grades are better when I use… Traditional note takers 17 56 28
Electronic note takers 22 41 37
Total 19 49 32

16
Table 6. Survey data of traditional and electronic note takers perceived engagement during one class period, indicating traditional note takers average less total distractions than electronic note-‐takers (unpaired t test with Welch’s correction, p=0.04).
On a different webpage
Doing something
that isn't notes "Zoned out" Total
Distractions Traditional Note-‐Taker 1.63 ± 2.59 2.17 ± 2.50 3.92 ± 3.50 7.72 ± 3.11 Electronic Note Taker 2.23 ± 3.57 2.67 ± 3.43 3.84 ±4.09 8.74 ± 3.761*
Teacher-‐Observed Student Engagement During the course of the study, six lessons were observed by the teacher to determine how often students lacked engagement in the note taking process. The sum from all six observations of off task instances typically ranged from 0 to 8, with one student being off task 17 times. This student was eliminated from the analysis. There were no differences between teacher-‐observed engagement in the traditional note taking group and electronic note taking group (unpaired t-‐test with Welch’s correction, p=0.25) (Table 7). The correlation between teacher-‐observed disengagement and sum of NLG was also analyzed. The electronic note-‐taking group experienced a greater range of NLG from the average, however the NLGs between both note-‐taking groups were not different (Figure 9). There was no correlation between the sum of NLG and teacher observed student engagement for the traditional group (linear regression, p=0.39, y = -‐0.0387x + 1.651, R² = 0.01564), however there was a negative correlation in the electronic note-‐taking group (linear regression, p=0.01, y = -‐0.1043x + 1.731, R² = 0.1995). This indicates the more the electronic note taker is off task, the lower the normalized learning gains will be. However, a comparison of the slopes from each note-‐taking group shows no difference between the two (p=0.27) indicating only weak correlations in the electronic group (Figure 9).
Figure 9. Comparison of teacher observed engagements and average normalized learning gains (NLG) from Units 1, 2, and 3 combined for traditional and electronic treatment groups.
0
0.5
1
1.5
2
2.5
3
0 2 4 6 8
Average NLG
Teacher observed dis-‐engagement
Traditional
Electronic
Linear (Traditional)
Linear (Electronic )
17
Traditional group: y = -‐0.0387x + 1.651, R² = 0.01564 (n=58); Electronic group: y = -‐0.1043x + 1.731, R² = 0.1995 (n=44).
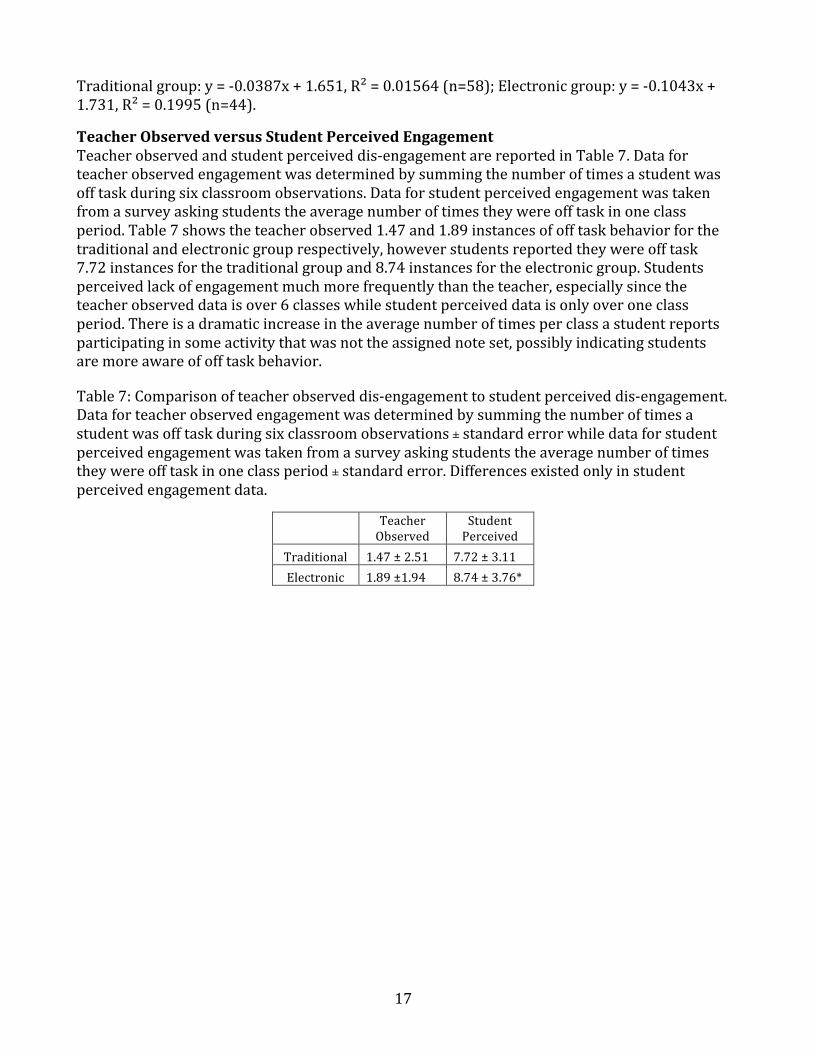
Teacher Observed versus Student Perceived Engagement Teacher observed and student perceived dis-‐engagement are reported in Table 7. Data for teacher observed engagement was determined by summing the number of times a student was off task during six classroom observations. Data for student perceived engagement was taken from a survey asking students the average number of times they were off task in one class period. Table 7 shows the teacher observed 1.47 and 1.89 instances of off task behavior for the traditional and electronic group respectively, however students reported they were off task 7.72 instances for the traditional group and 8.74 instances for the electronic group. Students perceived lack of engagement much more frequently than the teacher, especially since the teacher observed data is over 6 classes while student perceived data is only over one class period. There is a dramatic increase in the average number of times per class a student reports participating in some activity that was not the assigned note set, possibly indicating students are more aware of off task behavior. Table 7: Comparison of teacher observed dis-‐engagement to student perceived dis-‐engagement. Data for teacher observed engagement was determined by summing the number of times a student was off task during six classroom observations ± standard error while data for student perceived engagement was taken from a survey asking students the average number of times they were off task in one class period ± standard error. Differences existed only in student perceived engagement data.
Teacher Observed
Student Perceived
Traditional 1.47 ± 2.51 7.72 ± 3.11 Electronic 1.89 ±1.94 8.74 ± 3.76*

18
DISCUSSION This study looked at the potential impacts of note-‐taking method on three different student focused components, student performance, student engagement and student preference. There were no initial differences in academic performance between the two treatment groups (Table 4). After taking notes using either a traditional method or an electronic method, normalized learning gains were measured and it was determined that the method of note taking did not affect the academic achievement of 9th graders in Biology. Students who took notes using an electronic method performed equally as well as students who took notes using a traditional method (Figure 3). Most subpopulations studied also showed no significant differences in academic performance between traditional and electronic note takers. Specifically, no differences existed between the study population of blacks and whites (Figure 5), low economic status and regular economic status (Figure 6) or typically high achieving (Figure 7) and typically low achieving students (Figure 8) on any units. Inconsistent results between different units for males and females were evident (Figure 4). In the Unit 3 data electronic females exhibited greater gains than their male counterparts. The opposite was true for the traditional note-‐takers with males exhibiting greater learning gains compared to their female counterparts. The EOC data resulted in electronic note-‐taking males having greater NLG than electronic note-‐taking females. Some research suggests a possible gender bias towards students with higher pre-‐test scores, typically males, resulting in overall higher normalized learning gains of that gender (Willoughby and Metz, 2009). If this were the case, we would have seen consistently higher gains in the male population. Since this was not observed, any differences in NLG was most likely due to other driving factors besides gender. Possible influences could be variation in content between units or differences in students’ prior experiences. Methods of calculating learning gains and how it impacts bias towards gender should be more carefully considered in future studies. Overall, the findings from subpopulation analysis may support the idea that regardless of classroom demographics, students using an electronic note taking method will perform just as well as students using a traditional note taking method. One major concern expressed by many teachers is that students using electronic note-‐taking methods will be more easily distracted due to the ease with which the technology can be used for other purposes. Student engagement during traditional and electronic note taking was significantly different (p=0.0379) when engagement was self-‐reported by the students (Table 7), however, not significantly different when observed by the teacher (p=0.2462)(Figure 7). This is most likely because teacher observed engagement was less effective at catching off task behavior. Since this study took place in a classroom on a daily basis, students were most likely afraid to be caught off task. Traditionally, off task behavior results in reprimanding, subsequently triggering students to hide off task behavior by quickly changing screens when the teacher walks by. This is the most likely reason student self reported engagement data does not align with teacher observed engagement data. Despite this, I feel comfortable saying students who took notes electronically were off task more often than students who took notes traditionally. In addition, there were no differences in the normalized learning gains between each note taking group indicating engagement was not a driving factor in student achievement for this
19
study. Current literature is split regarding the use of technology in the classroom and its effects on student engagement. Some studies suggest that the use of computers increases student engagement (Suhr et al., 2010; Bebell and Kay, 2010; Dwyer, 1994; Driver, 2002) however the results of this study are more aligned with more recent literature that suggest computer use during class decreases student engagement (Sana et al., 2013; Aagaard, 2015; Taneja et al., 2015; Oppenheimer and Mueller, 2014; Wood et al, 2012; Awwad et al., 2013). A possible limitation of using the electronic note taking method could be that the process of taking notes alone does not lend itself to increasing student engagement. This may be because within the encoding function there is ease in the ability to transcribe verbatim what the teacher says. It may be more difficult for students in the electronic group to organize, reword, condense or synthesize lectured information compared to those in the well-‐practiced traditional note-‐taking group. If this is the case, then it may make sense that students are less engaged because they are thinking less during the note taking process. Lastly, this study addressed student preference. Across both note-‐taking groups, significantly more students preferred taking notes using a traditional note taking method rather than an electronic note taking method. The results also suggest that both groups found traditional note taking easier, even though both groups felt that traditional note taking takes longer. While these results are not due to the students’ unfamiliarity with laptops, this particular group of students has had personal laptops for three full academic years before starting this study. Many may lack the experience necessary to take notes electronically. On average, the study participants took notes two or three times a week, for less than an hour each time, over the course of the 20-‐week study. This intervention may not have been enough to overcome years of academic exposure to traditional note taking. Therefore, the students’ experiences prior to this study could be a main factor in their note taking preference. When dealing with the implementation of technologies in classrooms, it is important to consider all impacts. Dealing with technologies is neither a question of uncritical acceptance nor blind resistance but rather somewhere between yes and no we are looking for a how (Verbeek, 2013). Based on this study, since there is no clear consensus on the impacts of using computers on achievement, perhaps allowing students to choose their own method of note taking could at least provide a means to enhance class culture and empower the students to be involved in their learning. The use of technology in class may lead to students being distracted and choosing to multitask during lecture or it may lead to increased engagement and positive feelings towards science, ultimately it is up to the teacher to create a climate as well as culture conducive to increasing student performance. Classroom climate is viewed as behavior, while classroom culture is comprised on values and norms (Macneil et al., 2009). To change what students are doing during class teachers must get the students to change what is important to them. Having the option to take notes using a traditional or an electronic method allows flexibility for different learning styles, a means for differentiating instruction, and allows students to feel that their opinion matters, ultimately creating a class culture that promotes the possibility to increase student performance (Macneil et al., 2009). An educator’s ultimate goal is to prepare students for the future. Often this can be accomplished through increasing student performance on standardized test, leading to acceptance to accredited colleges and universities. However a recent shift in college readiness now includes the ability to integrate technology into the cognitive learning process, specifically using

20
computers as a note-‐taking tool. Traditional note taking, specifically the encoding function (DiVesta and Gray, 1972), which is the process of recording lecture material, has been an important metacognitive tool for over 90 years (Crawford, 1925; Fisher and Harris, 1974; Hartley and Davies, 1978; and Kiewra, 1985; Marzano et al., 2001) leading to increases in student achievement. One way to boost student achievement is to enhance the encoding function by improving the quantity and quality of notes. Early research suggest that improving the encoding process can be done by cueing students to which notes should be recorded (Moore, 1968), writing the essential concepts on the board (Locke 1977), providing note taking strategies and feedback (Robin et al., 1977), and repeating the lecture material (Kiewra et al., 1989). Since this study did not find any significant impacts of electronic note taking on student achievement, perhaps a different method of electronic encoding than the one used in this study should be adapted. Like all things, to be good at something, one needs practice. Students need much more practice taking efficient notes, specifically efficient electronic notes. Teachers should implement repetition, cuing, and the identification of essential information during the electronic note taking process. More study is obviously needed to address the associations between specific electronic note taking strategies and note-‐quality. Recent studies show that student achievement and engagement can be improved by the proper implementation of technology into the classroom, specifically through the use of computers (Penuel, 2006; Wenglinsky, 1998; Bartsch and Cobern, 2003; Lei and Zhao, 2007). Hundreds of students and teachers participated in the Apple Classroom of Tomorrow Initiative, implementing a 1:1 ratio of computers to students across the country. That study concluded an increased potential for learning and engagement when students were equipped with computers in the classroom. Computers can facilitate the electronic note taking process by increasing the number of words recorded; students who took more notes performed better (Oppenheimer and Mueller, 2014). However, computers used for note taking also increase the number of verbatim words written; students whose notes had more verbatim overlap with the lecture did not perform as well as students who had less verbatim notes (Oppenheimer and Mueller, 2014). This study did not address note quality or quantity. Future studies could address these factors to try to improve electronic note taking. When in a 1:1 school, perhaps administrators and teachers could work together to adapt traditional note taking methods to better fit the digital age, specifically addressing note quantity and quality. Ultimately electronic note taking could be integrated across all grade levels and all content disciplines. Is there a specific note-‐taking strategy that is more effective for computer notes? Does this specific strategy impact academic performance more than traditional note taking? These questions are significant because, as stated earlier, note taking is a critical skill that becomes a primary means of learning in most academic settings (Crawford, 1925; Fisher and Harris, 1974; Hartley and Davies, 1978; and Kiewra, 1985; Marzano et al., 2001), and the integration of technology into classroom has become increasingly popular (Penuel, 2006; Wenglinsky, 1998; Bartsch and Cobern, 2003; Lei and Zhao, 2007). Therefore, how can the process of electronic note taking be seamlessly integrated into the classroom climate? The answer to these questions requires further study and has the potential to significantly alter student achievement in classrooms across the country.

21
Next Steps This study is limited in that the sample is small for both the traditional note-‐taking group (n=58) and the electronic note-‐taking group (n=44). In addition, this study shows only 9th grade students at an overall high performing public school. Students’ prior experiences could have played a large part in the note taking preferences since the participants had limited practice note taking using computers. A larger sample or a study across multiple schools may strengthen the findings of this study. In addition, note taking methods specific to electronic notes should be explored to determine any possible changes in engagement or achievement. Since increasing note quality in traditional note taking seems to increase academic achievement, future studies could also look for significant differences in the quality of student-‐generated notes in the hopes of finding ways to increase electronic note quality and ultimately increase achievement.

22
BIBLIOGRAPHY
Aagaard, Jesper. "Drawn to Distraction: A Qualitative Study of Off-‐task Use of Educational Technology." Computers & Education 87 (2015): 90-‐97. Web. Ackerman, Rakefet, and Morris Goldsmith. "Metacognitive Regulation of Text Learning: On Screen versus on Paper." Journal of Experimental Psychology: Applied17.1 (2011): 18-‐32. Web. Alavi, Maryam. "Computer-‐Mediated Collaborative Learning: An Empirical Evaluation." MIS Quarterly 18.2 (1994): 159. Web. Awwad, Falah, Ahmad Ayesh, and Sarah Awwad. "Are Laptops Distracting Educational Tools in Classrooms." Procedia -‐ Social and Behavioral Sciences 103 (2013): 154-‐60. Web. Bartsch, Robert, and Kristi Cobern. "Effectiveness of PowerPoint Presentations in Lectures." Computers & Education 41.1 (2003): 77-‐86. Web. Bebell, Damien, and Laura O'Dwyer. "Educational Outcomes and Research from 1:1 Computer Settings." The Journal of Technology, Learning, and Assessment 9.1 (2010): n. pag. Web. Bebell, Damien, and Rachel Kay. "One to One Computing: A Summary of the Quantitative Results from the Berkshire Wireless Learning Initiative." The Journal of Technology, Learning, and Assessment 9.2 (2010): n. pag. Web. Becker, Henry. "Pedagogical Motivations for Student Computer Use That Lead to Student Engagement." Educational Technology (2000): n. pag. Web. Beesley, Andrea D. Ed., and Helen S. Ed. Apthorp. "Chapter 3: Summarizing and Note Taking." Classroom Instruction That Works, Second Edition: Research Report. N.p.: n.p., n.d. N. pag. Print. Billing, David. "Teaching for Transfer of Core/key Skills in Higher Education: Cognitive Skills." Higher Education 53.4 (2007): 483-‐516. Web. Boyle, Joseph R., and Gina A. Forchelli. "Differences in the Note-‐taking Skills of Students with High Achievement, Average Achievement, and Learning Disabilities." Learning and Individual Differences 35 (2014): 9-‐14. Web. Bransford, John D., Ann L. Brown, and Rodney R. Cocking. How People Learn: Brain, Mind, Experience and School. Washington, D.C.: National Academy, 2001. Print. Bui, Dung C., Joel Myerson, and Sandra Hale. "Note-‐taking with Computers: Exploring Alternative Strategies for Improved Recall." Journal of Educational Psychology 105.2 (2013): 299-‐309. Web. Carter, John F., and Nicholas H. Van Matre. "Note Taking versus Note Having." Journal of Educational Psychology 67.6 (1975): 900-‐04. Web. Conley, David. "English." EPAA Education Policy Analysis Archives (2015): n. pag. Web.

23
Crawford, C. C. "Some Experimental Studies of the Results of College Note-‐Taking." The Journal of Educational Research 12.5 (1925): 379-‐86. Web. Driver, Michaela. "Exploring Student Perceptions of Group Interaction and Class Satisfaction in the Web-‐enhanced Classroom." The Internet and Higher Education 5.1 (2002): 35-‐45. Web. Dunlosky, J., K. A. Rawson, E. J. Marsh, M. J. Nathan, and D. T. Willingham. "Improving Students' Learning With Effective Learning Techniques: Promising Directions From Cognitive and Educational Psychology." Psychological Science in the Public Interest 14.1 (2013): 4-‐58. Web. Dwyer, David, Ringstaff, Haymore, and Sandholtz. "Apple Classrooms of Tomorrow." Educational Leadership 51.7 (1994): 4-‐10. Web. Fisher, Judith L., and Mary B. Harris. "Effect Of Note-‐Taking Preference And Type Of Notes Taken On Memory." Psychological Reports 35.1 (1974): 384-‐86. Web. Friedman, Micheal. "Notes on Note-‐Taking: Review of Research and Insights for Students and Instructors." Harvard Initiative for Learning and Teaching (2013): n. pag. Web. Hake, Richard. "Interactive-‐engagement versus Traditional Methods: A Six-‐thousand-‐student Survey of Mechanics Test Data for Introductory Physics Courses." American Journal of Physics 66.1 (1998): n. pag. Web. Hartley, James, and Ivor K. Davies. "Note-‐taking: A Critical Review." Innovations in Education & Training International 15.3 (1978): 207-‐24. Web. Hartley, James. "Note-‐taking Research: Resetting the Scoreboard." American Psychological Association 36 (1983): 13-‐14. Web. Hounshell, Paul B., and Stanford R. Hill. "The Microcomputer and Achievement and Attitudes in High School Biology." J. Res. Sci. Teach. Journal of Research in Science Teaching 26.6 (1989): 543-‐49. Web. Kiewra, Kenneth A. "A Review of Note-‐taking: The Encoding-‐storage Paradigm and beyond." Educational Psychology Review Educ Psychol Rev 1.2 (1989): 147-‐72. Web. Kiewra, Kenneth. "Investigating Notetaking and Review: A Depth of Processing Alternative." Educational Psychologist 20.1 (1985): 23-‐32. Web. King, A. "Comparison of Self-‐Questioning, Summarizing, and Notetaking-‐Review as Strategies for Learning From Lectures." American Educational Research Journal 29.2 (1992): 303-‐23. Web. Lei, Jing, and Yong Zhao. "Technology Uses and Student Achievement: A Longitudinal Study." Computers & Education 49.2 (2007): 284-‐96. Web.

24
Lemov, Doug. Teach like a Champion: 49 Techniques That Put Students on the Path to College. San Francisco: Jossey-‐Bass, 2010. Print. Locke, Edwin A. "An Empirical Study of Lecture Note Taking among College Students." The Journal of Educational Research 71.2 (1977): 93-‐99. Web. Lovelace, M., and P. Brickman. "Best Practices for Measuring Students' Attitudes toward Learning Science." Cell Biology Education 12.4 (2013): 606-‐17. Web. Macneil, Angus J., Doris L. Prater, and Steve Busch. "The Effects of School Culture and Climate on Student Achievement." International Journal of Leadership in Education 12.1 (2009): 73-‐84. Web. Marzano, Robert J., Debra Pickering, and Jane E. Pollock. Classroom Instruction That Works: Research-‐based Strategies for Increasing Student Achievement. Alexandria, VA: Association for Supervision and Curriculum Development, 2001. Print. Meer, Jacques Van Der. "Students’ Note-‐taking Challenges in the Twenty-‐first Century: Considerations for Teachers and Academic Staff Developers." Teaching in Higher Education 17.1 (2012): 13-‐23. Web. Moore, James. "Cueing for Selective Note-‐Taking." The Journal of Experimental Education 36.4 (1968): 69-‐72. Web. Oppenheimer, Daniel M., and Pam A. Mueller. "The Pen Is Mightier than the Keyboard: Longhand and Laptop Note-‐Taking." PsycEXTRA Dataset (2012): n. pag. Web. Penuel, William R. "Implementation and Effects Of One-‐to-‐One Computing Initiatives." Journal of Research on Technology in Education 38.3 (2006): 329-‐48. Web. Rickards, John P., and Frank Friedman. "The Encoding versus the External Storage Hypothesis in Note Taking." Contemporary Educational Psychology 3.2 (1978): 136-‐43. Web. Ringstaff, Cathy, and Jean Marsh. "ACOT2." ACOT2. Apple, Inc, n.d. Web. 26 June 2015. Robin, Arthur, R.m. Foxx, John Martello, and Crystal Archable. "Teaching Note -‐Taking Skills to Underachieving College Students." The Journal of Educational Research 71.2 (1977): 81-‐85. Web. Sana, Faria, Tina Weston, and Nicholas J. Cepeda. "Laptop Multitasking Hinders Classroom Learning for Both Users and Nearby Peers." Computers & Education 62 (2013): 24-‐31. Web. Suhr, Kurt, David Hernandez, Douglas Grimes, and Mark Warschauer. "Laptops and Fourth-‐Grade Literacy: Assisting the Jump over the Fourth-‐Grade Slump."Journal of Technology, Learning, and Assessment 9.5 (2010): n. pag. Print. Taneja, Aakash, Vincent Fiore, and Briana Fischer. "Cyber-‐slacking in the Classroom: Potential for Digital Distraction in the New Age." Computers & Education 82 (2015): 141-‐51. Web.

25
U.S. Department of Education. "Digest of Education Statistics." National Center for Education Statistics. U.S. Department of Education, 2012. Web. 14 June 2015. Verbeek, Peter-‐Paul. "Resistance Is Futile." Research in Philosophy and Technology 17.1 (2013): 72-‐92. Web. Vesta, Francis J. Di, and G. Susan Gray. "Listening and Note Taking." Journal of Educational Psychology 63.1 (1972): 8-‐14. Web. Wenglinsky, Harold. "Does It Compute? The Relationship between Educational Technology and Student Achievement in Mathematics." ERIC Institute of Education Sciences (1998): 1-‐41. Web. Willoughby, Shannon D., and Anneke Metz. "Exploring Gender Differences with Different Gain Calculations in Astronomy and Biology." American Journal of Physics Am. J. Phys. 77.7 (2009): 651. Web. Wood, Eileen, Lucia Zivcakova, Petrice Gentile, Karin Archer, Domenica De Pasquale, and Amanda Nosko. "Examining the Impact of Off-‐task Multi-‐tasking with Technology on Real-‐time Classroom Learning." Computers & Education 58.1 (2012): 365-‐74. Web. Zucker, A. A., and D. Light. "Laptop Programs for Students." Science 323.5910 (2009): 82-‐85. Web.

26
APPENDIX A: LA/TN ALIGNMENT
Louisiana Grade Level Expectations aligned with Tennessee Course Level Expectations showing standards from Tennessee practice EOC fit the Louisiana course for Biology Louisiana GLEs Tennessee CLEs 1. Write a testable question or hypothesis when given a topic (SI-‐H-‐A1)
CLE 3210.Inq.2 Design and conduct scientific investigations to explore new phenomena, verify previous results, test how well a theory predicts, and compare opposing theories.
2. Describe how investigations can be observation, description, literature survey, classification, or experimentation (SI-‐H-‐A2)
CLE 3210.Inq.1 Recognize that science is a progressive endeavor that reevaluates and extends what is already accepted.
3. Plan and record step-‐by-‐step procedures for a valid investigation, select equipment and materials, and identify variables and controls (SI-‐H-‐A2)
CLE 3210.Inq.2 Design and conduct scientific investigations to explore new phenomena, verify previous results, test how well a theory predicts, and compare opposing theories.
4. Conduct an investigation that includes multiple trials and record, organize, and display data appropriately (SI-‐H-‐A2)
CLE 3210.Inq.4 Apply qualitative and quantitative measures to analyze data and draw conclusions that are free of bias.
5. Utilize mathematics, organizational tools, and graphing skills to solve problems (SI-‐H-‐A3)
CLE 3210.Inq.4 Apply qualitative and quantitative measures to analyze data and draw conclusions that are free of bias. CLE 3210.Math.1 Understand the mathematical principles associated with the science of biology. CLE 3210.Math.2 Utilize appropriate mathematical equations and processes to understand biological concepts
6. Use technology when appropriate to enhance laboratory investigations and presentations of findings (SI-‐H-‐A3)
CLE 3210.Inq.3 Use appropriate tools and technology to collect precise and accurate data. CLE 3210.T/E.1 Explore the impact of technology on social, political, and economic systems.
7. Choose appropriate models to explain scientific knowledge or experimental results (e.g., objects, mathematical relationships, plans, schemes, examples, role-‐playing, computer simulations) (SI-‐H-‐A4)
CLE 3210.Math.1 Understand the mathematical principles associated with the science of biology. CLE 3210.Math.2 Utilize appropriate mathematical equations

27
and processes to understand biological concepts
8. Give an example of how new scientific data can cause an existing scientific explanation to be supported, revised, or rejected (SI-‐H-‐A5)
CLE 3210.Inq.5 Compare experimental evidence and conclusions with those drawn by others about the same testable question.
9. Write and defend a conclusion based on logical analysis of experimental data (SI-‐H-‐A6) (SI-‐H-‐A2)
CLE 3210.Inq.4 Apply qualitative and quantitative measures to analyze data and draw conclusions that are free of bias. CLE 3210.Inq.6 Communicate and defend scientific findings.
10. Given a description of an experiment, identify appropriate safety measures (SI-‐H-‐A7)
CLE 3210.T/E.4 Describe the dynamic interplay among science, technology, and engineering within living, earth-‐space, and physical systems.
11. Evaluate selected theories based on supporting scientific evidence (SI-‐H-‐B1)
CLE 3210.Inq.5 Compare experimental evidence and conclusions with those drawn by others about the same testable question.
12. Cite evidence that scientific investigations are conducted for many different reasons (SI-‐H-‐B2)
CLE 3210.T/E.2 Differentiate among elements of the engineering design cycle: design constraints, model building, testing, evaluating, modifying, and retesting,
13. Identify scientific evidence that has caused modifications in previously accepted theories (SI-‐H-‐B2)
CLE 3210.Inq.1 Recognize that science is a progressive endeavor that reevaluates and extends what is already accepted.
14. Cite examples of scientific advances and emerging technologies and how they affect society (e.g., MRI, DNA in forensics) (SI-‐H-‐B3)
CLE 3210.T/E.4 Describe the dynamic interplay among science, technology, and engineering within living, earth-‐space, and physical systems.
15. Analyze the conclusion from an investigation by using data to determine its validity (SI-‐H-‐B4) 16. Use the following rules of evidence to examine experimental results: (a) Can an expert's technique or theory be tested, has it been tested, or is it simply a subjective, conclusive approach that cannot be reasonably assessed for reliability? (b) Has the technique or theory been subjected to peer review and publication? (c) What is the known or potential rate of
CLE 3210.Inq.5 Compare experimental evidence and conclusions with those drawn by others about the same testable question. CLE 3210.Inq.6 Communicate and defend scientific findings.

28
error of the technique or theory when applied? (d) Were standards and controls applied and maintained? (e) Has the technique or theory been generally accepted in the scientific community? (SI-‐H-‐B5) (SI-‐H-‐B1) (SI-‐H-‐B4) 1. Compare prokaryotic and eukaryotic cells (LS-‐H-‐A1)
CLE 3210.1.1 Compare the structure and function of cellular organelles in both prokaryotic and eukaryotic cells.
2. Identify and describe structural and functional differences among organelles (LS-‐H-‐A1)
CLE 3210.1.1 Compare the structure and function of cellular organelles in both prokaryotic and eukaryotic cells. CLE 3210.1.2 Distinguish among the structure and function of the four major organic macromolecules found in living things.
3. Investigate and describe the role of enzymes in the function of a cell (LS-‐H-‐A1)
CLE 3210.1.2 Distinguish among the structure and function of the four major organic macromolecules found in living things. CLE 3210.1.3 Describe how enzymes regulate chemical reactions in the body.
4. Compare active and passive cellular transport (LS-‐H-‐A2)
CLE 3210.1.5 Compare different models to explain the movement of materials into and out of cells.
5. Analyze the movement of water across a cell membrane in hypotonic, isotonic, and hypertonic solutions (LS-‐H-‐A2)
CLE 3210.1.5 Compare different models to explain the movement of materials into and out of cells.
6. Analyze a diagram of a developing zygote to determine when cell differentiation occurs (LS-‐H-‐A3)
CLE 3210.1.4 Describe the processes of cell growth and reproduction.
CLE 3210.1.2 Distinguish among the structure and function of the four major organic macromolecules found in living things.
7. Identify the basic structure and function of nucleic acids (e.g., DNA, RNA) (LS-‐H-‐B1)
CLE 3210.4.1 Investigate how genetic information is encoded in nucleic acids. CLE 3210.1.2 Distinguish among the structure and function of the four major organic macromolecules found in living things.

29
8. Describe the relationship among DNA, genes, chromosomes, and proteins (LS-‐H-‐B1)
CLE 3210.4.2 Describe the relationships among genes, chromosomes, proteins, and hereditary traits.
9. Compare mitosis and meiosis (LS-‐H-‐B2) CLE 3210.4.5 Recognize how meiosis and sexual reproduction contribute to genetic variation in a population.
10. Analyze pedigrees to identify patterns of inheritance for common genetic disorders (LS-‐H-‐B3)
CLE 3210.4.6 Describe the connection between mutations and human genetic disorders.
11. Calculate the probability of genotypes and phenotypes of offspring given the parental genotypes (LS-‐H-‐B3)
CLE 3210.4.3 Predict the outcome of monohybrid and dihybrid crosses. CLE 3210.4.4 Compare different modes of inheritance: sex linkage, co-‐dominance, incomplete dominance, multiple alleles, and polygenic traits.
12. Describe the processes used in modern biotechnology related to genetic engineering (LS-‐H-‐B4) (LS-‐H-‐B1)
CLE 3210.4.7 Assess the scientific and ethical ramifications of emerging genetic technologies.
13. Identify possible positive and negative effects of advances in biotechnology (LS-‐H-‐B4) (LS-‐H-‐B1)
CLE 3210.4.7 Assess the scientific and ethical ramifications of emerging genetic technologies.
14. Analyze evidence on biological evolution, utilizing descriptions of existing investigations, computer models, and fossil records (LS-‐H-‐C1)
CLE 3210.5.4 Summarize the supporting evidence for the theory of evolution.
15. Compare the embryological development of animals in different phyla (LS-‐H-‐C1)(LS-‐H-‐A3)
CLE 3210.5.2 Analyze the relationship between form and function in living things.
16. Explain how DNA evidence and fossil records support Darwin’s theory of evolution (LS-‐H-‐C2)
CLE 3210.5.2 Analyze the relationship between form and function in living things.
17. Explain how factors affect gene frequency in a population over time (LS-‐H-‐C3)
CLE 3210.5.1 Associate structural, functional, and behavioral adaptations with the ability of organisms to survive under various environmental conditions. CLE 3210.5.3
30
Explain how genetic variation in a population and changing environmental conditions are associated with adaptation and the emergence of new species. CLE 3210.2.4 Describe the sequence of events associated with biological succession.
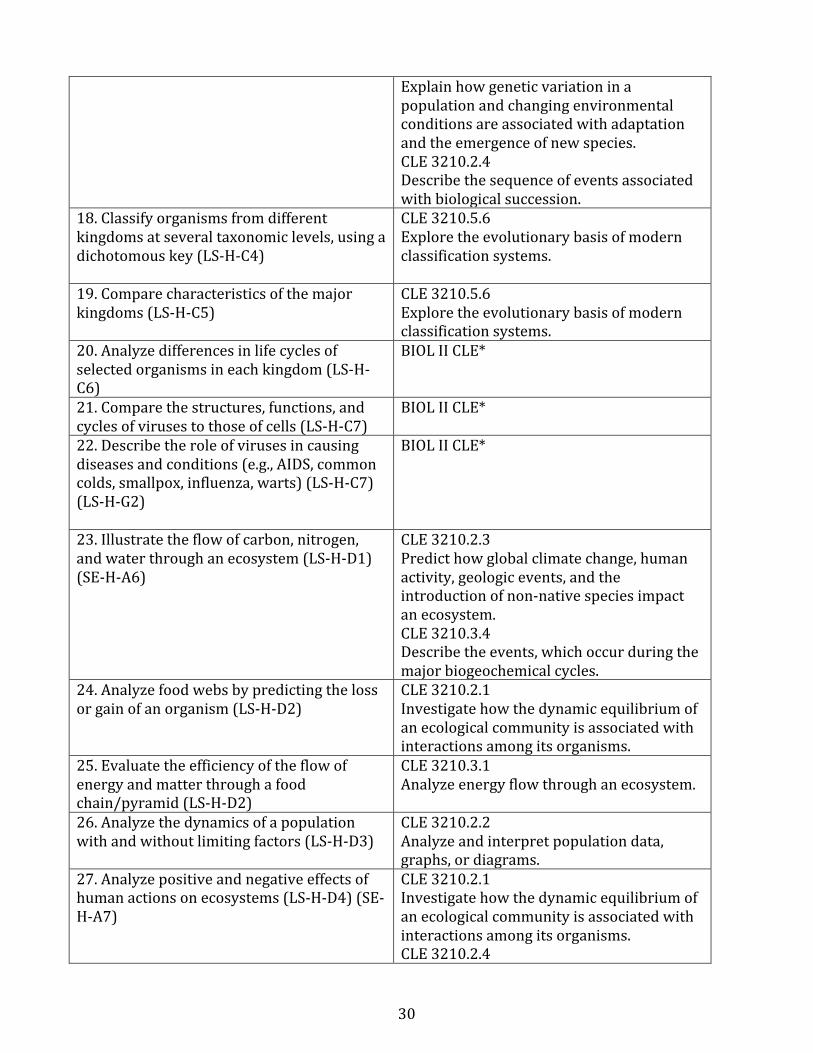
18. Classify organisms from different kingdoms at several taxonomic levels, using a dichotomous key (LS-‐H-‐C4)
CLE 3210.5.6 Explore the evolutionary basis of modern classification systems.
19. Compare characteristics of the major kingdoms (LS-‐H-‐C5)
CLE 3210.5.6 Explore the evolutionary basis of modern classification systems.
20. Analyze differences in life cycles of selected organisms in each kingdom (LS-‐H-‐C6)
BIOL II CLE*
21. Compare the structures, functions, and cycles of viruses to those of cells (LS-‐H-‐C7)
BIOL II CLE*
22. Describe the role of viruses in causing diseases and conditions (e.g., AIDS, common colds, smallpox, influenza, warts) (LS-‐H-‐C7) (LS-‐H-‐G2)
BIOL II CLE*
23. Illustrate the flow of carbon, nitrogen, and water through an ecosystem (LS-‐H-‐D1) (SE-‐H-‐A6)
CLE 3210.2.3 Predict how global climate change, human activity, geologic events, and the introduction of non-‐native species impact an ecosystem. CLE 3210.3.4 Describe the events, which occur during the major biogeochemical cycles.
24. Analyze food webs by predicting the loss or gain of an organism (LS-‐H-‐D2)
CLE 3210.2.1 Investigate how the dynamic equilibrium of an ecological community is associated with interactions among its organisms.
25. Evaluate the efficiency of the flow of energy and matter through a food chain/pyramid (LS-‐H-‐D2)
CLE 3210.3.1 Analyze energy flow through an ecosystem.
26. Analyze the dynamics of a population with and without limiting factors (LS-‐H-‐D3)
CLE 3210.2.2 Analyze and interpret population data, graphs, or diagrams.
27. Analyze positive and negative effects of human actions on ecosystems (LS-‐H-‐D4) (SE-‐H-‐A7)
CLE 3210.2.1 Investigate how the dynamic equilibrium of an ecological community is associated with interactions among its organisms. CLE 3210.2.4

31
Describe the sequence of events associated with biological succession. CLE 3210.T/E.4 Describe the dynamic interplay among science, technology, and engineering within living, earth-‐space, and physical systems.
28. Explain why ecosystems require a continuous input of energy from the Sun (LS-‐H-‐E1)
CLE 3210.2.3 Predict how global climate change, human activity, geologic events, and the introduction of non-‐native species impact an ecosystem.
29. Use balanced equations to analyze the relationship between photosynthesis and cellular respiration (LS-‐H-‐E1)
CLE 3210.3.2 Distinguish between aerobic and anaerobic respiration CLE 3210.3.3 Investigate the relationship between the processes of photosynthesis and cellular respiration.
30. Explain the role of adenosine triphosphate (ATP) in a cell (LS-‐H-‐E2)
CLE 3210.1.2 Distinguish among the structure and function of the four major organic macromolecules found in living things.
31. Compare the levels of organization in the biosphere (LS-‐H-‐E3)
CLE 3210.2.4 Describe the sequence of events associated with biological succession.
32. Analyze the interrelationships of organs in major systems (LS-‐H-‐F1) (LS-‐H-‐E3)
BIOL II CLE*
33. Compare structure to function of organs in a variety of organisms (LS-‐H-‐F1)
BIOL II CLE*
34. Explain how body systems maintain homeostasis (LS-‐H-‐F2)
BIOL II CLE*
35. Explain how selected organisms respond to a variety of stimuli (LS-‐H-‐F3)
BIOL II CLE*
36. Explain how behavior affects the survival of species (LS-‐H-‐F4)
BIOL II CLE*
37. Explain how fitness and health maintenance can result in a longer human life span (LS-‐H-‐G1)
BIOL II CLE*
38. Discuss mechanisms of disease transmission and processes of infection (LS-‐H-‐G2) (LS-‐H-‐G4)
BIOL II CLE*

32
39. Compare the functions of the basic components of the immune system (LS-‐H-‐G3)
BIOL II CLE*
40. Determine the relationship between vaccination and immunity (LS-‐H-‐G3)
BIOL II CLE*
41. Describe causes, symptoms, treatments, and preventions of major communicable and noncommunicable diseases (LS-‐H-‐G4)
BIOL II CLE*
42. Summarize the uses of selected technological developments related to the prevention, diagnosis, and treatment of diseases or disorders (LS-‐H-‐G5)
CLE 3210.4.7 Assess the scientific and ethical ramifications of emerging genetic technologies. CLE 3210.T/E.3 Explain the relationship between the properties of a material and the use of the material in the application of a technology.

33
APPENDIX B: UNIT 1 PRE/POST TEST
The Science of Biology Unit Test 1 Multiple Choice Write the letter that best answers the question or completes the statement on the line provided. _____ 1. Science differs from other disciplines, such as history and the arts, because science relies on a. facts. b. testing explanations.
c. observations. d. theories.
_____ 2. Measurements made while observing a plant grow 3 cm over a two-‐week period are called a. inferences. b. variables.
c. hypotheses. d. data.
_____ 3. Based on your observations, you suggest that if water is present, it could accelerate the growth of bread mold. This is
a. a conclusion. c. an experiment. b. a hypothesis. d. an analysis. _____ 4. Suppose that a scientist proposes a hypothesis about how a newly discovered virus affects
humans. Other virus researchers would likely a. reject the hypothesis right away. b. change the hypothesis to fit their own findings. c. design new experiments to test the proposed hypothesis. d. assume that the hypothesis is true for all viruses. _____ 5. Who reviews articles for peer-‐reviewed journals? a. friends of the scientists who wrote the articles b. anonymous and independent experts c. the scientists who did the experiments d. people who paid for the experiments _____ 6. How does sharing ideas through peer-‐reviewed articles help advance science?
a. Peer-‐reviewed articles are published only when the ideas they contain have been accepted by most scientists.
b. Experiments in peer-‐reviewed articles do not need to be repeated. c. Scientists reading the articles may come up with new questions to study. d. Ideas in the articles always support and strengthen dominant theories. _____ 7. If a student was doing an experiment on osmosis and she was trying to measure the amount
of sugar absorbed into a cell, what tool would she use? a. graduated cylinder b. triple beam balance
c. thermometer d. beaker
_____ 8. The basic unit of length in the metric system is the a. gram. b. liter.
1

34
c. yard. d. meter. _____ 9. How many micrometers are in 2.4m? a. 240 b. 2,400
c. 24,000 d. 240,000
_____ 10. During a controlled experiment, a scientist isolates and tests a. a conclusion. c. a control group. b. a mass of information. d. a single variable.
_____ 11. A student sees a bee on a flower. The student wonders how the bee finds flowers. This student is a. forming a question. c. collecting data. b. forming a conclusion. d. analyzing results.
_____ 12. What does a reviewer do during peer-‐review? a. Focus on mistakes in spelling. b. Change data to support results. c. Check for mistakes and bias. d. Repeat the experiments in the article.
_____ 13. A well-‐tested explanation that explains a lot of observations is a. a hypothesis. c. a theory. b. an inference. d. a controlled experiment.
_____ 14. A personal preference or point of view is a. a bias. c. a hypothesis. b. a theory. d. an inference.
_____ 15. Scientists often try to repeat each other’s results. Which of the following should a scientist do to make it easier for others to replicate his or her experiment?
a. Not use a control to save time. b. Collect only one set of data. c. Skip peer-‐review so the results are available sooner. d. Use the metric system when communicating procedures and results.
_____ 16. What is the name of the piece of lab equipment in the picture to the right?
a. beaker c. glassware b. graduated cylinder d. pipette
_____ 17. What is the volume measured in the picture to the
right? a. 36mL c. 36.5mL b. 32.5mL d. 32mL
_____ 18. What should you do if you spill something in lab?

35
a. tell the teacher immediately c. call 911 b. wipe it up d. hide it so someone else can figure it out
_____ 19. When should you wear goggles, gloves, and aprons in lab? a. when the teacher tells you to c. only if dangerous chemicals are used b. anytime glass is used d. we won’t have to so we won’t worry about it
_____ 20. What is the purpose of a broken glass container? a. to store glassware c. to put broken glassware b. to wash the broken glass d. to hide the glass from the teacher
Use the following situation to answer questions 21-25 below. Four pea plants were set up under different lights (red, white, blue, and green). Everyday the plants will be watered 50mL and the plant’s growth will be recorded in centimeters. Data will be collected everyday at for 2 weeks. _____ 21. From the lab setup described above, what would the scientist’s independent variable be?
a. the growth of the plants c. the different colored light b. the amount of water d. the plant growing in the white light
_____ 22. From the lab setup described above, what would the scientist’s dependent variable be? a. the growth of the plants c. the different colored light b. the amount of water d. the plant growing in the white light
_____ 23. From the lab setup described above, what would be a constant in this experiment? a. the growth of the plants c. the different colored light b. the amount of water d. the plant growing in the white light
_____ 24. From the lab setup described above, which plant would act as a control? a. the plant growing in the blue light c. the plant growing in the red light b. there is no control d. the plant growing in the white light
_____ 25. From the lab setup described above, what is the most likely hypothesis of the scientist? a. If light affects plant growth, then the plant with the most light will grow the most. b. If light affects plant growth, then the plant with the most light will grow the least. c. If the color of light affects plant growth, then the plant with green light will grow the most.
d. If a plant’s growth affects the color of light, then the plant with green light will grow the most.

36
Use the following data to answer questions 26-30 below. One of the best-‐known examples of a population study came from the records of a fur-‐trading company in Canada. The Hudson’s Bay Company (HBC) kept records of its catches of hare and lynx over a long period of time. Charles Elton, an English ecologist, used the records to hypothesize about cycles in animal populations. The table shows the HBC data for hares and lynx pelts taken between 1845 and 1899.
Comparison of HBC Hare and Lynx Pelts Year Hare Lynx Year Hare Lynx 1845 20 32 1873 70 20 1847 20 50 1875 100 34 1849 52 12 1877 92 45 1851 83 10 1879 70 40 1853 64 13 1881 10 15 1855 68 36 1883 11 15 1857 83 15 1885 137 60 1859 12 12 1887 137 80 1861 36 6 1889 18 26 1863 150 6 1891 22 18 1865 110 65 1893 52 37 1867 60 70 1895 83 50 1869 7 40 1897 18 35 1871 10 9 1899 10 12
_____ 26. From the data described above, what would the independent variable be?
a. the years the study took place c. the number of pelts for hare and lynx b. the population d. the HBC records
_____ 27. From the data described above, what data would go on the vertical axis? a. the years the study took place c. the number of pelts for hare and lynx b. the population d. the HBC records
_____ 28. From the data described above, what would be the best graph to display this data? a. bar graph c. line graph b. pie chart d. double line graph
_____ 29. From the data described above, what would be the best title for the data set? a. Number of hare and lynx pelts from 1845 to 1899 b. HBC Records c. Hare and lynx population d. Data from 1845 to 1988
_____ 30. The data above was used to hypothesize what? a. the productivity of fur trading c. the number of all animals in a Canadian forest b. the cycles in animal populations d. the mating patterns of hares with lynx

37
Using Science Skills Use the diagram below to answer the following questions on the lines provided. A scientist conducted an experiment to determine the effect of environment on the fur color of a Himalayan rabbit. The Himalayan rabbit typically has a white coat except for its colder nose, feet, tail, and ears, which are black. The scientist shaved an area of hair on the back of each rabbit, then placed an ice pack over the shaved area on one rabbit (A).
Figure 1–1 31. Interpret Visuals In Figure 1–1, which rabbit is the control?
32. Interpret Visuals In Figure 1–1, what is the variable in this experiment?
33. Form a Hypothesis Before completing the experiment in Figure 1–1, the scientist made a hypothesis. What is the hypothesis she is testing?
34. Apply Concepts Why is Rabbit B essential to the experiment in Figure 1–1?
35. Draw Conclusions Based on your observations of Figure 1–1, conclude what effect temperature has on Himalayan rabbits.

38
APPENDIX C: UNIT 2 PRE/POST TEST
Cells Unit 2 Test Multiple Choice Write the letter that best answers the question or completes the statement on the line provided. _____ 1. Which of the following makes up a molecule of water? a. one atom of hydrogen and one atom of oxygen b. one atom of sodium and one atom of chlorine c. one atom of hydrogen and two atoms of oxygen d. two atoms of hydrogen and one atom of oxygen
_____ 2. A substance with a pH of 6 is called a. an acid. c. water. b. a base. d. a suspension.
_____ 3. Amino acid is to protein as a. fat is to lipid. c. sugar is to fat. b. DNA is to RNA. d. simple sugar is to starch. _____ 4. Which of the following diagrams correctly shows the reaction pathway of a reaction that
absorbs energy? a. c.
b. d.
_____ 5. Which of the following statements about enzymes is NOT true? a. Enzymes work best at a specified pH. b. All enzymes have the same shape as their substrates. c. Enzymes are proteins. d. The shape of an enzyme allows it to do its job.
2

39
_____ 6. A map of eastern North America, showing the pH of rainfall in the various states, indicates that the pH of rain in New York State varies from 4.22 to 4.40. According to these figures, the most acidic rainfall in New York State has a pH of
a. 4.22 c. 4.35 b. 4.30 d. 4.40 _____ 7. Identify the reactant(s) shown here: CO2 + H2O → H2CO3.
a. CO2, H2O, and H2CO3 c. H2CO3 b. CO2 and H2O d. CO2
_____ 8. The energy needed to get a reaction started is the a. adhesion energy. c. cohesion energy. b. activation energy. d. chemical energy.
_____ 9. Which of the following statements is true about catalysts? a. Catalysts slow down the rate of chemical reactions. b. All catalysts are enzymes. c. Catalysts are used up during a chemical reaction. d. Catalysts lower the activation energy of a chemical reaction.
_____ 10. Looking at a cell under a microscope, you note that it is a prokaryote. How do you know? a. The cell lacks cytoplasm. c. The cell lacks a nucleus. b. The cell lacks a cell membrane. d. The cell lacks genetic material.
_____ 11. Which of the following is NOT found in the nucleus? a. mitochondria. c. chromatin b. nucleolus d. DNA
_____ 12. Which organelle breaks down organelles that are no longer useful? a. Golgi apparatus c. endoplasmic reticulum b. lysosome d. mitochondrion
_____ 13. Which structure in the cell shown in Figure 7–1 above stores materials, such as water, salts, proteins, and carbohydrates?
a. structure A c. structure C b. structure B d. structure D
_____ 14. Which sequence correctly traces the path of a protein in the cell? a. ribosome, endoplasmic reticulum, Golgi apparatus b. ribosome, endoplasmic reticulum, chloroplast c. endoplasmic reticulum, lysosome, Golgi apparatus d. ribosome, Golgi apparatus, endoplasmic reticulum
_____ 15. Which organelle converts the chemical energy stored in food into useable energy? a. chloroplast c. endoplasmic reticulum b. Golgi apparatus d. mitochondrion
_____ 16. Which of the following is a function of the cell membrane?

40
a. breaks down lipids, carbohydrates, and proteins from foods b. stores water, salt, proteins, and carbohydrates c. keeps the cell wall in place d. regulates the movement of materials into and out of the cell
_____ 17. The cell membrane contains channels and pumps that help move materials from one side to the other. What are these channels and pumps made of? a. carbohydrates c. bilipids b. lipids d. proteins
_____ 18. Diffusion occurs because a. molecules are attracted to one another. b. molecules move and collide with each other forcing them to low concentrations c. cellular energy forces molecules to collide with each other. d. cellular energy pumps molecules across the cell membrane.
_____ 19. An animal cell that is surrounded by fresh water will burst because the osmotic pressure causes a. water to move into the cell. c. solutes to move into the cell. b. water to move out of the cell. d. solutes to move out of the cell.
_____ 20. You decide to buy a new fish for your freshwater aquarium. When you introduce the fish into its new tank, the fish swells up and dies. You later learn that it was a fish from the ocean.
Based on what you know of tonicity, the most likely explanation is that unfortunate fish went from a(n) _______________ solution into a(n) _______________ solution. a. isotonic, hypotonic c. hypotonic, hypertonic b. hypertonic, isotonic d. hypotonic, isotonic
Use Figure 7-2 to answer questions 21 - 25 below. _____ 21. Which of the following diagrams represents
active transport? a. A b. B c. C d. A and B
_____ 22. Facilitated diffusion moves particles from ____ to ____ concentration. a. high, low b. low, high c. high, high d. low, low

41
_____ 23. Diagram B represents a. diffusion c. osmosis b. active transport d. facilitated diffusion
_____ 24. Which means of particle transport requires input of energy from the cell? a. diffusion c. facilitated diffusion b. osmosis d. active transport
_____ 25. In osmosis, what molecule is being transported? a. CO2 c. H20 b. K d. ATP
Using Science Skills Use the diagram below to answer the following questions on the lines provided.
Effect of Temperature on Two Enzymes That Function at Different Temperatures
in Two Different Organisms
Figure 7–3 _____ 26. Which enzyme would you expect to find in a bacterium growing in a hot spring?
a. Enzyme X b. Enzyme Y c. Both enzymes X and Y d. No enzymes would be found in bacteria from a hot spring.
_____ 27. At what temperature do the two enzymes have the same amount of activity? a. 0° C c. 50° C b. 45° C d. 60° C
_____ 28. What are the optimum temperatures for each enzyme (X and Y)? a. 0° C and 0° C c. 40° C and 80° C b. 50° C and 50° C d. 0° C and 100° C
_____ 29. Which enzyme would have the most activity in humans? a. Enzyme X b. Enzyme Y c. Both enzymes X and Y
d. Enzymes are not found in humans.
_____ 30. Which enzyme is active over the largest temperature range?

42
a. Enzyme X b. Enzyme Y
c. Both enzymes X and Y d. No enzymes are ever active
Using Science Skills Use the diagram below to answer the following questions on the lines provided.
Figure 7–4 31. Interpret Visuals Which drawing in Figure 7–4, A or B, contains structures that carry out
photosynthesis? What is this structure labeled in the diagram?
32. Interpret Visuals Which organelle is labeled K in Figure 7–4? What is the function of this organelle?
33. Draw Conclusions Do the drawings in Figure 7–4 represent prokaryotes or eukaryotes? How do you know?
34. Apply Concepts I forgot to water my plants for 3 days and they began to sag. What happened to the vacuole in the plant cell? Why did it sag? Diagram and label this. 35. Extend For each of the following, indicate if the structure is found only in eukaryotes, or if it is found in eukaryotes and prokaryotes:
Organelle Prokaryotes Eukaryotes Cell Membrane Mitochondria Ribosomes Golgi Apparatus Nucleus Cytoplasm DNA

43
APPENDIX D: UNIT 3 PRE/POST TEST
Photosynthesis & Cell Respiration Unit 3 Test
Multiple Choice Write the letter that best answers the question or completes the statement on the line provided. _____ 1. What are the three parts of an ATP molecule?
a. adenine, thylakoid, and a phosphate group b. stroma, grana, and chlorophyll c. adenine, ribose, and three phosphate groups d. NADH, NADPH, and FADH2
_____ 2. Energy is released from ATP when a. a phosphate group is added. c. ATP is exposed to sunlight. b. adenine bonds to ribose. d. a phosphate group is removed.
_____ 3. Organisms, such as plants, that make their own food are called a. autotrophs. c. thylakoids. b. heterotrophs. d. pigments.
_____ 4. Which of the following organisms is a heterotroph? a. mushroom c. wheat b. alga d. sunflower
_____ 5. Plants get the energy they need for photosynthesis by absorbing a. high-‐energy sugars. c. chlorophyll b. b. chlorophyll a. d. energy from the sun.
_____ 6. Most plants appear green because chlorophyll a. absorbs green light. c. does not absorb green light. b. absorbs violet light. d. does not absorb violet light.
_____ 7. The stroma is the region outside the a. thylakoids. c. plant cells. b. chloroplasts. d. all of the above
_____ 8. Where in the chloroplast is chlorophyll found? a. in the ATP b. in the stroma
c. in the thylakoid membrane d. in the thylakoid space
_____ 9. What is the function of NADP+ in photosynthesis? a. electron carrier b. high-‐energy sugar
c. photosystem d. pigment
_____ 10. Photosynthesis uses sunlight to convert water and carbon dioxide into a. oxygen and carbon. b. high-‐energy sugars and proteins.
c. ATP and oxygen. d. oxygen and high-‐energy sugar
____ 11. Where do the light-‐dependent reactions take place? a. in the stroma of the chloroplast b. within the mitochondria membranes c. within the thylakoid membranes
3

44
d. in the outer membrane of the chloroplasts _____ 12. What are the products of the light-‐dependent reactions?
a. oxygen gas and glucose b. ATP, NADPH, and oxygen gas c. ATP, carbon dioxide gas, and NADPH d. carbon dioxide gas, oxygen gas, and NADPH
_____ 13. Where are photosystems I and II found? a. in the stroma c. in the Calvin cycle. b. in the thylakoid membrane d. in the cell membrane
_____ 14. Which of the following activities happens within the stroma? a. Photosystem I absorbs light. b. ATP synthase produces ATP. c. The Calvin cycle produces sugars. d. Electrons move through the electron transport chain.
_____ 15. The Calvin cycle is another name for the a. light-‐independent reactions. c. photosynthesis reaction. b. light-‐dependent reactions. d. electron transport chain.
_____ 16. Which chemical equation represents cell respiration? a. light + 6CO2 + H20 à C6H12O6 b. light + H20 + 6CO2 à C6H12O6 + 602 c. C6H12O6 + 602 à 6H20 + 6CO2 d. C6H12O6 + H20 + 6CO2 à light + 602
_____ 17. How do organisms get the energy they need? a. by burning food molecules and releasing their energy as heat b. by breathing oxygen into the lungs and combining it with carbon dioxide c. by breaking down food molecules gradually and capturing their chemical energy d. by using the sun’s energy to break down food molecules and form chemicals
_____ 18. Which of the following is NOT a stage of cellular respiration? a. fermentation c. glycolysis b. electron transport d. Krebs cycle
_____ 19. Cellular respiration is called an aerobic process because it requires a. light. c. oxygen. b. exercise. d. glucose.
_____ 20. Photosynthesis is to chloroplasts as cellular respiration is to a. chloroplasts. c. mitochondria. b. cytoplasm. d. nuclei.
_____ 21. The products of photosynthesis are the a. products of cellular respiration. b. reactants of cellular respiration. c. products of glycolysis.

45
d. reactants of fermentation. _____ 22. Glycolysis provides a cell with a net gain of
a. 2 ATP molecules. c. 18 ATP molecules. b. 4 ATP molecules. d. 36 ATP molecules.
_____ 23. Glycolysis requires a. ATP. c. sunlight. b. oxygen. d. NADP+.
_____ 24. In eukaryotes, electron transport occurs in the a. inner mitochondrial membrane. b. nucleus.
c. cell membrane. d. cytoplasm.
_____ 25. Cellular respiration uses 1 molecule of glucose to produce approximately a. 2 ATP molecules. b. 4 ATP molecules.
c. 32 ATP molecules. d. 36 ATP molecules.
Using Science Skills Use the figure to answer the following questions on the lines provided. A student prepared two beakers with identical sprigs of a water plant as shown below. She placed one beaker in the shade and the other beaker beside a fluorescent lamp. She then systematically changed the distance from the beaker to the lamp. She counted the bubbles given off by the plants in each beaker. Shown here is the graph of the data for the beaker she placed beside the lamp. _____ 26. In the experiment described in Figure 8-‐2, which beaker is the students control?
a. beaker in the shade b. beaker 0 cm from the light
c. beaker 10 cm from the light d. beaker 30 cm from the light
_____ 27. Look at Figure 8–2. If the student later tested the bubbles collected in the test tube, what would she find they are made of?
a. CO2 b. H20
c. O2 d. C6H12O6
_____ 28. Look at the graph in Figure 8–2. At what distance from the light source was the greatest number of bubbles produced
a. 5 b. 10
c. 15 d. 20
_____ 29. Which chemical equation represents photosynthesis?

46
a. light + 6CO2 + H20 à C6H12O6 b. light + H20 + 6CO2 à C6H12O6 + 602 c. C6H12O6 + 02 à 6H20 + 6CO2 d. C6H12O6 + H20 + 6CO2 à light + 602
_____ 30. Look at the graph in Figure 8–2. What do the student’s data show? a. The closer the plant is to the light source the lower the rate of photosynthesis. b. The further the plant is away from light source the higher the rate of photosynthesis. c. The closer the plant is to the light source the higher the rate of photosynthesis. d. There is no relationship between the light and the rate of photosynthesis.
Short Answer In complete sentences, write the answers to the questions on the lines provided. 31. Figure 9–1 shows how energy flows among the sun, plants, animals, and fossil fuels. Which arrow
represents cellular respiration? Explain your reasoning.
32. What roles does oxygen play in photosynthesis and in cellular respiration?
33. The electron transport chain uses the energy stored in high-‐energy electrons to pump H+ ions across the inner mitochondrial membrane. Why?
34. What role does oxygen play in the electron transport chain?
35. Given the inefficiency of two of the pathways shown in Figure 9–2, what advantage could there be to using these pathways to produce energy?
Figure 9–1
Figure 9–2

47
APPENDIX E: UNIT EXAM QUESTION ALIGNMENT
Question alignment of each unit exam to the Louisiana GLEs for Biology
Alignment to Louisiana Biology Grade Level Expectations: Unit 1 Question GLE Question (cont.) GLE (cont.)
1 SI-‐H-‐B1 #11 19 SI-‐H-‐A7 #10 2 SI-‐H-‐A2 #3 20 SI-‐H-‐A7 #10 3 SI-‐H-‐A1 #1 21 SI-‐H-‐A2 #3 4 SI-‐H-‐B2 #13 22 SI-‐H-‐A2 #3 5 SI-‐H-‐B1,4,5 #16 23 SI-‐H-‐A2 #3 6 SI-‐H-‐B1,4,5 #16 24 SI-‐H-‐A2 #3 7 SI-‐H-‐A3 #6 25 SI-‐H-‐A1 #1 8 SI-‐H-‐A3 #6 26 SI-‐H-‐A2 #3 9 SI-‐H-‐A3 #6 27 SI-‐H-‐A3 #5 10 SI-‐H-‐A2 #3 28 SI-‐H-‐A3 #5 11 SI-‐H-‐A1 #1 29 SI-‐H-‐A3 #5 12 SI-‐H-‐B1,4,5 #16 30 SI-‐H-‐A1 #1 13 SI-‐H-‐B1 #11 31 SI-‐H-‐A2 #3 14 SI-‐H-‐B1 #11 32 SI-‐H-‐A2 #3 15 SI-‐H-‐A2 #3 33 SI-‐H-‐A1 #1 16 SI-‐H-‐A2 #3 34 SI-‐H-‐A2 #3 17 SI-‐H-‐A3 #6 35 SI-‐H-‐A2 #9 18 SI-‐H-‐A7 #10
Alignment to Louisiana Biology Grade Level Expectations: Unit 2
Question GLE Question (cont.) GLE (cont.) 1 LS-‐H-‐A1 #3 19 LS-‐H-‐A2 #4 2 LS-‐H-‐A1 #3 20 LS-‐H-‐A2 #5 3 LS-‐H-‐A1 #2 21 LS-‐H-‐A2 #4 4 LS-‐H-‐A1 #3 22 LS-‐H-‐A2 #4 5 LS-‐H-‐A1 #3 23 LS-‐H-‐A2 #4 6 LS-‐H-‐A1 #3 24 LS-‐H-‐A2 #4 7 LS-‐H-‐A1 #3 25 LS-‐H-‐A2 #4 8 LS-‐H-‐A1 #3 26 SI-‐H-‐A3 #5 9 LS-‐H-‐A1 #3 27 SI-‐H-‐A3 #5 10 LS-‐H-‐A1 #1 28 SI-‐H-‐A3 #5 11 LS-‐H-‐A1 #2 29 SI-‐H-‐B4 #15 12 LS-‐H-‐A1 #2 30 SI-‐H-‐B4 #15 13 LS-‐H-‐A1 #2 31 LS-‐H-‐A1 #2 14 LS-‐H-‐A1 #2 32 LS-‐H-‐A1 #2 15 LS-‐H-‐A1 #2 33 LS-‐H-‐A1 #1 16 LS-‐H-‐A1 #2 34 LS-‐H-‐A2 #5 17 LS-‐H-‐A1 #2 35 LS-‐H-‐A1 #2 18 LS-‐H-‐A2 #4

48
Alignment to Louisiana Biology Grade Level Expectations: Unit 3 Question GLE Question (cont.) GLE (cont.)
1 LS-‐H-‐E2 #30 19 LS-‐H-‐E1 #29 2 LS-‐H-‐E2 #30 20 LS-‐H-‐A1 #2 3 LS-‐H-‐D2 #25 21 LS-‐H-‐E1 #29 4 LS-‐H-‐D2 #25 22 LS-‐H-‐E2 #30 5 LS-‐H-‐E1 #28 23 SE-‐H-‐A6 #23 6 LS-‐H-‐E1 #29 24 LS-‐H-‐A1 #2 7 LS-‐H-‐E1 #29 25 LS-‐H-‐E2 #30 8 LS-‐H-‐E1 #29 26 SI-‐H-‐A2 #3 9 LS-‐H-‐E1 #29 27 SI-‐H-‐A2 #3 10 LS-‐H-‐E1 #29 28 SI-‐H-‐A3 #5 11 LS-‐H-‐A1 #2 29 LS-‐H-‐E1 #29 12 LS-‐H-‐E1 #29 30 SI-‐H-‐A2,6 #9 13 LS-‐H-‐A1 #2 31 LS-‐H-‐E1 #29 14 LS-‐H-‐A1 #2 32 LS-‐H-‐E1 #29 15 LS-‐H-‐E1 #29 33 LS-‐H-‐E2 #30 16 LS-‐H-‐E1 #29 34 LS-‐H-‐E1 #29 17 LS-‐H-‐E1 #28 35 LS-‐H-‐E1 #29 18 LS-‐H-‐E1 #29

49
APPENDIX F: ENGAGEMENT SURVEY

50

51

52
APPENDIX G: IRB APPROVAL

53
VITA
Chelsea Ann Duhon, native of Lutcher, Louisiana, received her Bachelors of Science at Louisiana State University in 2012. Immediately following graduation she was hired by Iberville Parish School Board to teach at the Mathematics, Science, and Arts Academy-‐West, a National Magnet School of Distinction. There she has taught 6th grade Physical Science, 7th grade Life Science, Biology, and Environmental Science, and she has coordinated the school and district science fair each year. She is a current sponsor of the science club, the Knights of the Periodic Table, and she is the head swimming coach for Plaquemine High School. She is a 2015 candidate for the Master of Natural Science degree from Louisiana State University, and plans to pursue employment at a local community college upon graduation.