
Cyclic azasilanes: volatile coupling agents for - Gelest Inc

EFFECTS OF TITANATE COUPLING AGENTS ON LOW DENSITY POLYETHYLENE AND POLYPROPYLENE BLENDS AND COMPOSITES
A THESIS SUBMITTED TO THE GRADUATE SCHOOL OF NATURAL AND APPLIED SCIENCES
OF MIDDLE EAST TECHNICAL UNIVERSITY
BY
GÖKHUN YILMAZ
IN PARTIAL FULFILLMENT OF THE REQUIREMENTS
FOR THE DEGREE OF MASTER OF SCIENCE
IN POLYMER SCIENCE AND TECHNOLOGY
NOVEMBER 2008

iii
I hereby declare that all information in this document has been obtained and presented in accordance with academic rules and ethical conduct. I also declare that, as required by these rules and conduct, I have fully cited and referenced all material and results that are not original to this work. Name, Last name: Gökhun Yılmaz
Signature

iv
ABSTRACT
EFFECTS OF TITANATE COUPLING AGENTS ON LOW DENSITY POLYETHYLENE AND POLYPROPYLENE BLENDS AND COMPOSITES
Yılmaz, Gökhun
M.S., Department of Polymer Science and Technology
Supervisor : Prof. Dr. Erdal Bayramlı
Co-Supervisor: Dr. Ahmet Bedii Erdemir
November 2008, 104 pages
The objective of this study is to investigate the effects of titanate coupling agents on low
density polyethylene (LDPE) and polypropylene (PP) blends and composites in terms of
their mechanical and morphological properties. PP and LDPE composites were produced
separately in a Brabender internal mixer, and CaCO3 was used as inorganic filler with
compositions of 20, 40 and 60 %. PP/LDPE blends were produced in a twin-screw
extruder with ratios of 75/25, 50/50 and 25/75. Their composites were prepared with
addition of untreated and titanate-treated CaCO3 at 20% filler content.
Titanate coupling agent which is appropriate for LDPE, PP and CaCO3 was used to
improve the mechanical properties of the blends and composites. For this purpose, “Lica
12” which is a kind of neoalkoxy organotitanate was used. Two forms of Lica 12 were
used: powder form (Capow L12) and pellet form (Caps L12).
v
Samples with and without titanate were prepared and then they were injection molded to
make specimens for tensile and impact tests. Tensile fracture surfaces of samples were
examined by scanning electron microscopy (SEM). Their mechanical and morphological
properties were compared with each other to determine the effects of Lica 12.
This study showed that Capow L12 improved strain at break and impact strength of
PP/CaCO3 composites and PP/LDPE blends containing 75% and 50% PP. The strain at
break value of of PP75 composite with 20% titanate-treated filler increased significantly
up to 509% which is the highest value among all blends and composites in this study.
Capow L12 exhibited its functions in PP matrix much more effectively than in LDPE
matrix.
Keywords: Titanate coupling agent, Lica 12, Polypropylene, Low density polyethylene,
Calcium carbonate.

vi
ÖZ
TİTANAT BAZLI BAĞLAYICILARIN ALÇAK YOĞUNLUKLU POLİETİLEN VE POLİPROPİLEN KARIŞIMLARI VE KOMPOZİTLERİ ÜZERİNDEKİ
ETKİLERİ
Yılmaz, Gökhun
Yüksek Lisans, Polimer Bilimi ve Teknolojisi Bölümü
Tez Yöneticisi : Prof. Dr. Erdal Bayramlı
Ortak Tez Yöneticisi: Dr. Ahmet Bedii Erdemir
Kasım 2008, 104 sayfa
Bu çalışmanın amacı titanat bazlı bağlayıcıların, alçak yoğunluklu polietilen ve
polipropilen karışımlarının ve kompozitlerinin üzerindeki etkilerini mekanik ve
morfolojik özellikler bakımından araştırmaktır. PP ve LDPE kompozitleri, bir içsel
karıştırıcı türü olan Brabender’da üretilmişlerdir. Bu işlemlerde inorganik dolgu olarak
CaCO3 20, 40 ve 60 yüzdelerinde kompozitlere katılmıştır. PP/LDPE karışımları 75/25,
50/50 ve 25/75 oranlarında çift vidalı ekstruder’de üretilmişlerdir. Bu karışımlara %20
oranında titanatla muamele edilmiş ve edilmemiş CaCO3 katılarak kompozitler
hazırlanmıştır.
PP ve LDPE için uygun olan titanat bazlı bağlayıcı, kompozit ve karışımların mekanik
özelliklerinin geliştirilmesi için kullanılmıştır. Bu amaçla bir neoalkoksi organotitanat
türü olan “Lica 12” kullanılmıştır. Lica 12’nin iki farklı fiziksel haldeki yapıları
kullanılmıştır: toz hali (Capow L12) ve granül hali (Caps L12).

vii
Titanat içeren ve içermeyen örnekler hazırlanmıştır ve daha sonra bu örnekler
enjeksiyonlu kalıplama yöntemiyle, çekme ve darbe testlerinde kullanılmak üzere test
çubuğu şekline getirilmişlerdir. Çekme testinde kopan yüzeyler, taramalı electron
mikroskop (SEM) yöntemiyle incelenmiştir. Lica 12’nin etkilerini belirlemek için bu
örneklerin mekanik ve morfolojik özellikleri birbirleriyle karşılaştırılmıştır.
Bu çalışma göstermiştir ki PP/CaCO3 kompozitleri ile 75% ve 50% PP içeren PP/LDPE
karışımlarında Capow L12, kopmadaki uzamayı ve darbe dayanımını geliştirmiştir. %20
oranında titanatla işlenmiş dolgu içeren PP75 kompozitinde kopma uzaması önemli
derecede yükselerek %509’ a kadar gelmiştir. Bu değer, çalışmadaki bütün karışım ve
kompozitlerde elde edilen kopma uzaması değerlerinin en yükseğidir. Capow L12,
işlevlerini PP matriks içinde LDPE matriks içindekine göre daha etkili göstermiştir.
Anahtar Sözcükler: Titanat bazlı bağlayıcılar, Lica 12, Polipropilen, Alçak yoğunluklu
polietilen, Kalsiyum karbonat.

viii
To my parents and my dear grandmother

ix
ACKNOWLEDGEMENTS
I would like to express my deepest gratitude to my thesis supervisor Prof. Dr. Erdal
Bayramlı for his guidance, understanding, kind support and encouraging advices
throughout my thesis.
I am greatly indebted to my thesis co-supervisor Dr. A. Bedii Erdemir for his guidance,
essential advices, criticism and precious discussions throughout my thesis.
Special thanks go to Osman Yaslıtaş from Department of Chemistry for his technical
support and unforgotten helps during my study in laboratory.
I especially thank to my sweetie Ayşe Kırcalı for her patient love and for not leaving me
alone in my stressful days.
I would sincerely thank to H. Onur Bektaş and M. Alper Fakılı as my faithful comrades
for their endless friendship, being always right beside me and making my life at METU
happy and memorable.
I express my special thanks to my labmates Mehmet Doğan and Ümit Tayfun for sparing
their time and all helps during my experiments and study. I wish to thank my friends; B.
Fuat Çankaya, Selahattin Erdoğan, Yasin Kanbur, Cenk Konuk, Erkan Biber and
especially Murat Erdoğan for cooperation and friendship with their all kind of supports.
I dedicate this dissertation to my parents Vildan-Özcan Yılmaz, my brother Orçun
Yılmaz and specially my grandmother Yüksel Bıçkıcı. They always offered their love,
care and support during my whole education life. My family’s absolute unquestionable
belief in me, have been a constant source of encouragement to achieve my goals.
x
TABLE OF CONTENTS
ABSTRACT…………………………………………………………………….... iv
ÖZ……………………………………………………………………………....... vi
ACKNOWLEDGEMENTS……………………………………………………… ix
TABLE OF CONTENTS………………………………………………..……….. x
LIST OF TABLES……………………………………………………………….. xiv
LIST OF FIGURES…...…………………………………………………….…… xv
CHAPTERS
1. INTRODUCTION………...………………………………….……………….. 1
2. BACKGROUND INFORMATION…………………………………………... 3
2.1 Composites………………………………………..……….……………… 3
2.1.1 Polymer Matrix Composites……………………………..…………. 4
2.2 Polymer Blends…………………….…………………………….……….. 5
2.3 Polyethylene (PE)…………………………………………….................. 6
2.3.1 Low-density Polyethylene (LDPE)…………………………….…... 9
2.4 Polypropylene (PP)………………………………….……………………. 10
2.4.1 Structure of PP……………………………………………………… 10
2.4.2 Properties of PP……………………………………………………... 12
2.4.3 Processing behavior of PP and comparison with PE………………. 13

xi
2.5 Fillers……………………………………………………………………… 15
2.5.1CaCO3……………………………………………………………….. 16
2.6 Titanate Coupling Agents………………………………………………… 17
2.6.1 Description of Coupling Agents……………………………………. 17
2.6.1.1 Silane Coupling Agents……………………………………... 18
2.6.2 Structure and Property of Titanate Coupling Agents……………….. 19
2.6.3 Functions of Titanate Coupling Agents…………………………….. 22
2.6.4 Effects of Titanate Coupling Agents……………………………….. 24
2.6.4.1 Effects of Function (1)……………………………………… 24
2.6.4.1.1 Coupling Effect........................................................ 24
2.6.4.1.2 Dispersion Effect………………………………….. 25
2.6.4.1.3 Adhesion Effect………………………………….... 27
2.6.4.2 Effects of Function (2)…………............................................ 27
2.6.5 Surface Modification of Fillers with Titanate Coupling Agents........ 28
2.7 Polymer Processing……………………………………………………….. 30
2.7.1 Extrusion……………………………………………………………. 30
2.7.1.1 Twin-Screw Extruders……………………………………… 32
2.7.2 Internal Mixing……………………………………………………... 34
2.7.3 Injection Molding…………………………………………………… 36
2.8 Polymer Characterization…………………………………………………. 37
2.8.1 Mechanical Properties………………………………………………. 38
2.8.1.1 Tensile Test…………………………………………………. 38
2.8.1.2 Impact Test………………………………………………….. 41

xii
2.8.2 Scanning Electron Microscopy (SEM)……………………………... 42
3. EXPERIMENTAL…………………………………………………………….. 43
3.1 Materials…………………………………………………………………... 43
3.1.1 Low-Density Polyethylene (LDPE)…………..……….……………. 43
3.1.2 Polypropylene (PP)………………………………………………..... 44
3.1.3 CaCO3……………………………………………….……………… 44
3.1.4 Titanate Coupling Agents…………………………………………... 45
3.1.4.1 Treatment of CaCO3 with Capow L12/H…………………. 46
3.2 Experimental Procedure…………………………………………………... 47
3.2.1 Internal Mixing……………………………………………………... 47
3.2.1.1 Sample Preparation and Mixing Parameters in Brabender… 49
3.2.2 Melt Blending with Extrusion………………………………………. 50
3.2.2.1 Sample Preparation and Extrusion Parameters……………... 52
3.2.3 Injection Molding…………………………………………………… 54
3.3 Characterization…………………………………………………………... 55
3.3.1 Mechanical Tests………………...…………………………………. 55
3.3.1.1 Tensile Tests………………………………………………... 55
3.3.1.2 Impact Test………………………………………………….. 57
3.3.2 Morphological Analysis (SEM)…………………………………….. 58
4. RESULTS AND DISCUSSION………………………………………………. 59
4.1 Mechanical Analysis……………………………………………………… 59
4.1.1 Tensile Properties…………………………………………………… 59

xiii
4.1.1.1 Tensile Properties for PP/CaCO3 Composites……………… 60
4.1.1.2 Tensile Properties for LDPE/CaCO3 Composites…………... 65
4.1.1.3 Tensile Properties for PP/LDPE Blends and Composites….. 71
4.1.2 Impact Properties………………………………………………..….. 85
4.1.2.1 Impact Properties for PP/CaCO3 Composites………………. 85
4.1.2.2 Impact Properties for LDPE/CaCO3 Composites................... 86
4.1.2.3 Impact Properties for PP/LDPE Blends and Composites....... 87
4.2 Morphological Analysis with Scanning Electron Microscopy (SEM)........ 89
4.2.1 Morphological Analysis of LDPE/CaCO3 Composite........................ 89
4.2.2 Morphological Analysis of PP/LDPE Blends and Composites.......... 93
5. CONCLUSIONS................................................................................................ 98
REFERENCES....................................................................................................... 101

xiv
LIST OF TABLES
TABLES
Table 2.1 Types of PE…………………………………………………….……... 8
Table 2.2 Forms of various fillers …………………………………………….…. 16
Table 2.3 Chemical description and structure of some titanate coupling agents.... 20
Table 3.1 Physical Properties of LDPE ………………….…………………….... 43
Table 3.2 Properties of PP ………………………………………..……………... 44
Table 3.3 Chemical Composition of CaCO3………………….…………………... 44
Table 3.4 Physical properties of CaCO3………………………….……………….. 45
Table 3.5 Sample Codes and compositions produced with brabender…………..... 50
Table 3.6 Specifications of Thermo Prism TSE 16 TC Extruder ……………….... 51
Table 3.7 Drying conditions of materials before extrusion ……………………..... 52
Table 3.8 Sample Codes and compositions produced with extruder …………...... 53
Table 3.9 Temperature profle of extruder for all experiments …………………… 54
Table 3.10 Dimensions of tensile test specimen………………………………….. 57

xv
LIST OF FIGURES
FIGURES
Figure 2.1 Polymerization of PE ………………………………..…………………....... 6
Figure 2.2 Chain configurations of polyethylene.…………………………………....... 8
Figure 2.3 Radical polymerization of LDPE …...…………………..………………..... 10
Figure 2.4 Polymerization of polypropylene ….………………………….………........ 11
Figure 2.5 Isotactic, syndiotactic and atactic PP chains ……………………….…........ 11
Figure 2.6 General Structure of organosilanes ……………………………….……...... 18
Figure 2.7 Mode of reaction between a silanol and an inorganic surface…………........ 19
Figure 2.8 Basic chemical structure of a titanate molecule …………..……………..... 19
Figure 2.9 Chemical Structure of Lica 12 (neopentyl(diallyl)oxy tri(dioctyl) pyro-
phospato titanate )……………………………………………………….......
20
Figure 2.10 Schematic representation of the monomolecular layer formation by
titanate..........................................................................................................
21
Figure 2.11 Number of functions signed on basic structure of coupling agents…....…. 23
Figure 2.12 Illustration of the dispersion effect of coupling a titanatemonolayer on an
agglomerated inorganic in an organic phase……………............…….…...
25
Figure 2.13 a) Micrograph of a suspension of a CaCO3 (untreated)/ liquid paraffin
system. b) Micrograph of a suspension of a CaCO3 (treated with KR
TTS) /liquid paraffin system demonstrating deagglomeration………….....
26
Figure 2.14 Comparision the CPVC point of untreated CaCO3-filled mineral oil (left)
with KR TTS treated CaCO3-filled mineral oil (right)………...................
27

xvi
Figure 2.15 Schematic representation of coating of a filler by titanates…………....…. 29
Figure 2.16 Schematic Representation of Single-screw extruder…………………….... 31
Figure 2.17 Intermeshing twin screw extruder (a) Co-rotating and (b) counter-
rotating…………………….....................…………………………….........
33
Figure 2.18 Schematic representation of brabender (Courtesy C. W. Brabender
Instruments, Inc.)………………… ............................………………….....
34
Figure 2.19 Schematic representation of a batch internal mixer ….....………………... 35
Figure 2.20 (a) a ram-fed (b) a screw fed injection molding machine……...…………. 37
Figure 2.21 Tensile specimen and test mechanism…………………………...……….. 39
Figure 2.22 Stress-strain behavior over the entire strain range for a typical polymeric
material……………………….…………………………………………....
40
Figure 2.23 Schematic representation of Charpy impact test with notced bar……....… 41
Figure 2.24 Schematic representation of scanning electron microscope………….…... 42
Figure 3.1 Chemical structure of Lica 12…………………………………………….... 45
Figure 3.2 a) Photograph of Brabender with its heating tank and indicators …………. 47
Figure 3.2 (cont’d) b) Mixing chamber of Brabender (closed as in operation)
c) Screw configuration and open chamber of Brabender.............................. 48
Figure 3.3 (a) Picture of Thermo Prism TSE 16 TC Extruder and its control panel..... 51
Figure 3.3 (cont’d) b) Screw configuration of Thermo Prism TSE 16 TC Extruder....... 52
Figure 3.4 Injection molding machine ……………...…………....……………………. 55
Figure 3.5 Picture of Lloyd LS 5000 tensile test machine……...……………………… 56
Figure 3.6 Dog-bone shaped specimen for tensile test……………………………….... 56
Figure 3.7 Ceast Resil Impactor Machine........................................................................ 57
Figure 4.1 Stress-strain curves for PP composites 20% filled with (a) untreated
CaCO3 (b) titanate-treated CaCO3………………………………………….
60

xvii
Figure 4.2 Stress-strain curves for PP composites 40% filled with (a) untreated
CaCO3 (b) titanate-treated CaCO3.................................................................
61
Figure 4.3 Stress-strain curves for PP composites 60% filled with (a) untreated
CaCO3 (b) titanate-treated CaCO3…..............................................................
61
Figure 4.4 Elastic modulus values of PP/ CaCO3 composites……………………........ 62
Figure 4.5 Percentage strain at break values of PP/CaCO3 composites……………...... 63
Figure 4.6 Tensile strength values of PP/CaCO3 composites………………………...... 64
Figure 4.7 Stress-strain curves for (a) 100% (Neat) LDPE (b) LDPE filled with
20% untreated CaCO3 (c) LDPE filled with 20% titanate-treated CaCO3...
66
Figure 4.8 Stress-strain curves for LDPE composites 40% filled with (a) untreated
CaCO3 (b) titanate-treated CaCO3………..........................................………
66
Figure 4.9 Stress-strain curves for LDPE composites 60% filled with (a) untreated
CaCO3 (b) titanate-treated CaCO3..................................................................
67
Figure 4.10 Elastic modulus values of LDPE/CaCO3 composites…………………...... 68
Figure 4.11 Percentage strain at break values of LDPE/CaCO3 composites………...... 69
Figure 4.12 Tensile strength values of LDPE/CaCO3 composites…………………...... 70
Figure 4.13 Stress-strain curves of PP/LDPE (75/25) blends and composites.……....... 72
Figure 4.14 Elastic Modulus values of PP/LDPE (75/25) blends and composites…...... 73
Figure 4.15 Percentage strain at break values of PP/LDPE (75/25) blends and
composites………………………................................……………………
74
Figure 4.16 Tensile strength values of PP/LDPE (75/25) blends and composites……. 75
Figure 4.17 Stress-strain curves of PP/LDPE (50/50) blends and composites………... 76
Figure 4.18 Elastic Modulus values of PP/LDPE (50/50) blends and composites……. 77
Figure 4.19 Percentage strain at break values of PP/LDPE (50/50) blends and
composites………………........................…………………………………
78
Figure 4.20 Tensile strength values of PP/LDPE (50/50) blends and composites……. 80

xviii
Figure 4.21 Stress-strain curves of PP/LDPE (25/75) blends and composites………... 81
Figure 4.22 Elastic Modulus values of PP/LDPE (25/75) blends and composites……. 82
Figure 4.23 Percentage strain at break values of PP/LDPE (25/75) blends and
composites…………….....................................................................……… 83
Figure 4.24 Tensile strength values of PP/LDPE (25/75) blends and composites…..… 83
Figure 4.25 Impact strength values of PP/CaCO3 composites ……………………….... 85
Figure 4.26 Impact strength values of LDPE/CaCO3 composites…………………….. 86
Figure 4.27 Impact strength values of PP/LDPE blends and composites……………... 88
Figure 4.28 SEM micrographs of LDPE/CaCO3 composites with 20% CaCO3............. 90
Figure 4.29 SEM micrographs of LDPE/CaCO3 composites with 40% CaCO3............. 91
Figure 4.30 SEM micrographs of LDPE/CaCO3 composites with 60% CaCO3............. 92
Figure 4.31 SEM micrographs of PP/LDPE (75/25) blends and composites.................. 94
Figure 4.32 SEM micrographs of PP/LDPE (50/50) blends and composites.................. 95
Figure 4.33 SEM micrographs of PP/LDPE (25/75) blends and composites.................. 97

1
CHAPTER 1
INTRODUCTION
Plastics have become quite important and widely used materials in daily life and
industry for the last forty years. One of the reasons for the great popularity of plastics
in a wide variety of industrial applications is due to the tremendous range of
properties exhibited by plastics and their ease of processing. Plastic properties can be
tailored to meet specific needs by blending with other plastics and through
modification with an enormous range of additives (fillers, fibers, plasticizers,
stabilizers) [1].
Polymer composites are mixtures of polymers with inorganic additives having
certain geometries (fibers, flakes, spheres, particulates). Thus, they consist of two or
more components and two or more phases. Modification of organic polymers
through the incorporation of additives yields, with few exceptions, multiphase
systems containing the additive embedded in a continuous polymeric matrix. The
resulting mixtures are characterized by unique microstructures or macrostructures
that are responsible for their properties. The primary reasons for using additives are:
property modification or enhancement; overall cost reduction; improving and
controlling of processing characteristics [2].
There is considerable interest in polymer blends. This is driven by consideration of
the difficulty in developing new polymeric materials from monomers. In many cases
it can be more cost effective to tailor the properties of a material through the
blending of existing materials. One of the most basic questions in blends is whether
or not the two polymers are miscible or exist as a single phase. Although miscible

2
blends of polymers exist, most blends of high molecular weight polymers exist as
two-phase materials. The morphology of the phases is of great importance in this
manner. A variety of morphologies exist such as dispersed spheres of one polymer in
another, lamellar structures, and co-continuous phases [3].
Coupling agents are molecular bridges at the interface between two substrates, an
inorganic filler and organic polymer matrix. Titanium derived coupling agents are
unique in that their reaction with the protons at the inorganic interface results in the
formation of organic monomolecular layers on the inorganic surface. Titanate-treated
inorganic fillers are hydrophobic, organophilic and organofunctional. When
incorporated into polymer systems, they often promote adhesion, improve dispersion,
improve impact strength and thus reduce embrittlement, make inorganic loadings
even though at high filler content, prevent phase separations [4].
This study aims to investigate effects of titanate coupling agents on polypropylene
and low-density polyethylene blends and composites in terms of mechanical and
morphological properties. As titanate coupling agent, a kind of neoalkoxy organo-
titanate having a trade name of “Lica 12” is selected. Its powder and pellet forms are
used where their trade names are “Capow L12” and “Caps L12”, respectively.
Composites of PP/CaCO3 and LDPE/CaCO3 with varying filler content are prepared
by internal mixing in Brabender. PP/LDPE blends and their composites containing
CaCO3 are produced in twin-screw extruder.
All samples are injection molded in order to obtain standard test specimens for
mechanical characterization. Tensile test is performed to investigate tensile strength,
percentage strain at break and Young’s modulus of all samples. Besides that, impact
strength values are obtained by charpy impact test. As morphological analysis tensile
fracture surfaces are examined by scanning electron microscopy (SEM). Tensile test
data and SEM data is found to be in agreement with offered discussion as regards the
treated and untreated filler inclusions.

3
CHAPTER 2
BACKGROUND INFORMATION
2.1 Composites
A Composite is a heterogeneous material that consists of two or more phases that are
insoluble in each other. At least one phase is mostly inorganic as dispersed phase.
Composites are designed to have mechanical properties and performances superior
than constituent materials have independently. They may have unique advantages
over monolithic materials such as high strength, high stiffness, low density, high
corrosion, long fatigue life, high thermal stability, insulation and conduction. Besides
that they have an important advantage that is reduction in life cycle cost [5].
Composites mainly consist of two phases: matrix phase and reinforcement phase.
Matrix phase is the main constituent binding the other components together in the
composite. It can be metallic, ceramic or polymeric. The second constituent is
reinforcement phase, which enhances and improves the mechanical properties of the
matrix. Reinforcement phase is dispersed in matrix phase and properties of
composite depends on properties of the constituent phases, their relative amounts and
geometry of the dispersed phase (i.e., size and shape of the reinforcing component,
their distribution and orientation) [6]. Reinforcing agents are filler materials which
can be minerals, metallic powders, organic by products or synthetic inorganic
compounds [7]. They can be also classified according to their geometry as; particles,
fibers and flakes which have different properties.

4
The interaction of components at phase boundaries, associated with the existence of a
thick interface, i.e. interphase, is also a parameter affecting the properties of polymer
composites. It is often considered as a separate phase, which controls adhesion
between the components, thus, it can play an important role in controlling the failure
mechanisms, fracture toughness and overall stress-strain behavior of the material [5].
2.1.1 Polymer Matrix Composites
Polymers are the most common matrix materials for composites. Polymer matrix
composites have found widespread applications since they have the advantage of
being easily fabricated into any large complex shape [6]. Composites can have
thermoplastic or thermosetting polymer matrices. Thermosetting and thermoplastic
matrix composites are in many ways superior materials compared to common metals
and ceramic materials. Matrix selection is performed based on chemical, thermal,
electrical, flammability, environmental, cost, performance and manufacturing
requirements [8].
Thermosetting materials cannot be remelted and reshaped once they are cured as they
form three-dimensional molecular chains, called crosslinking. The most common
thermoset polymer matrix materials are unsaturated polyesters, epoxies and
polyamides [6]. Thermoplastic materials generally have high toughness values and
proper damage tolerances compared thermosetting materials. They are used for a
wide variety of nonstructural applications without fillers and reinforcements [6].
Thermoplastic molecules can be reshaped with heat and pressure since they do not
cross-link. This provides them the property of being easily fabricated by
conventional plastics processing techniques such as extrusion, injection molding and
blow molding. Thermoplastic materials also provide low cost-high volume
processing of composite structures [6]. The most common thermoplastic matrices are
polyolefinic (polyethylene, polypropylene), vinylic polymers (polyvinyl chloride,
polyamides) [6].

5
2.2 Polymer Blends
Mixing of two or more polymers at different chemical composition is an effective
way of combining performance and economic relationships using existing materials.
Fundamental issues that affect the properties of blends include interfacial behavior
and equilibrium phase, physical and chemical interactions between the components,
phase morphology and rheology, all of which are related to the issues of
compatibility. One of the most important way of polymer blending is the
incorporation of an elastomeric phase in a rigid matrix to enhance mechanical
toughness [9].
Control of the morphology of these two-phase systems is critical to achieve the
desired properties. However, most of the polymer pairs are thermodynamically
immiscible and technologically incompatible; hence produce a multi-phase system
during processing, which may damage the performance of the materials. Fortunately,
owing to the deformable nature of the dispersed phase in the immiscible blends,
various morphologies can be generated in-situ such as fiber, ribbon, plate, etc. during
processing some of which enhance the properties of the blends. As a result, the
properties of the polymer blend depend on the type of polymers, the morphology of
the blend, and the effects of processing parameters [1]. Polymer blends can be
typically prepared in five techniques: melt blending, latex blending, partial block
copolymerization, graft copolymerization, and synthesis of interpenetrating
networks. Melt blending is a simple mechanical means of creating a well-dispersed
mixture of polymers. It could be performed in twin or single screw extruder, two-roll
mill, or in an intensive mixer.
The physical properties of a blend depend on the degree of miscibility between the
components. Fully-miscible blends generally represent the simplest case. For
amorphous polymers, most properties follow some additive relationship; thus
miscible blends are similar to random copolymers in this regard [3]. For blends
where the components form separate phases, properties depend on the arrangement
of these phases in between and the nature of the interface (i.e. interfacial reactions

6
and strength) between the phases. Immiscible blends behave like composite materials
in many respects. Properties like softening temperature, modulus, permeation etc, are
dominated by the properties of the component that forms the continuous phase [12].
The nature of the interface is related to the thermodynamic interaction between the
components, which then governs morphology generation in the melt via interfacial
tension, and adhesion in the solid state via the thickness of the interfacial zone and
the degree to which chains from the two phases entangle. When the thermodynamic
affinity is very low, the blend can exhibit a degree of toughness well below that of
either component and is regarded as incompatible. Improvement of this property
response is often called compatibilization and approaches to this important aspect of
blend technology are described in the forthcoming part. When the interaction
between phases is good enough, additive properties may be obtained without
compatibilization [13].
2.3 Polyethylene (PE)
Polyethylene (PE) is the highest-volume polymer in the world. PE which has the
simplest basic structure among all over polymers is a member of polyolefins. The
monomer of PE is ethylene and polymerization of PE is shown in Figure 2.1.
Figure 2.1 Polymerization of PE [1]

7
Its high toughness, ductility, excellent chemical resistance, low water vapor
permeability, and very low water absorption, combined with the ease with which it
can be processed, make PE of all different density grades an attractive choice for a
variety of goods. PE is limited by its relatively low modulus, yield stress, and
melting point. PE is used to make containers, bottles, film, and pipes, among other
things. It is an incredibly versatile polymer with almost limitless variety due to
copolymerization potential, a wide density range, a MW which ranges from very low
(waxes have a MW of a few hundred) to very high (6x10⁶), and the ability to vary
MW distribution [1].
PE homopolymers are made up exclusively of carbon and hydrogen atoms, different
grades of PE have markedly different thermal and mechanical properties. While PE
is generally a whitish, translucent polymer, it is available in grades of density that
range from 0.91 to 0.97 g/cm3. The density of a particular grade is governed by the
morphology of the backbone; long, linear chains with very few side branches can
assume a much more three-dimensionally compact, regular, crystalline structure [1].
According to its density and branching, PE is classisified into three major groups:
• Low-density PE (LDPE)
• Linear low-density PE (LLDPE)
• Medium-density PE (MDPE)
• High-density PE (HDPE)
Their density range and degree of branching is given in Table 2.1.

8
Table 2.1 Types of PE [14]
Figure 2.2 demonstrates figurative differences in chain configuration which govern
the degree of crystallinity, which, along with MW, determines final
thermomechanical properties. Generally, yield strength and the melt temperature
increase with density, while elongation decreases with increased density [1].
Figure 2.2 Chain configurations of polyethylene [1]
When polyethylene is subjected to high-energy irradiation, gases such as hydrogen
and some lower hydrocarbons are evolved, there is an increase in unsaturation and,
most important, cross-linking occurs by the formation of C-C bonds between

9
molecules. The formation of cross-link points interferes with crystallisation and
progressive radiation will eventually yield an amorphous but cross-linked polymer.
Extensive exposure may lead to colour formation and in the presence of air surface
oxidation will occur. Oxygen will cause polymer degradation during irradiation and
this offsets the effects of cross-linking [3].
2.3.1 Low-Density Polyethylene (LDPE)
LDPE is a highly branched long- chain thermoplastic polymer having density of
0,915- 0,925 g/cm3 and molecular weight up to 4×10⁶ [15]. The thermal properties of
LDPE include a melting range 106-112 °C . Its relatively low melting point and
broad melting range result in easy process applications. The glass transition
temperature of LDPE is well below the room temperature (~ -120 °C), accounting for
the polymer’s soft and flexible nature. Also, LDPE does not break when subjected to
the Izod impact test [16].
LDPE combines high impact strength, toughness, and ductility to make it the
material of choice for packaging films, which is one of its largest applications. Films
range from shrink film, thin film for automatic packaging, heavy sacking, and
multilayer films (both laminated and co-extruded) where LDPE acts as a seal layer or
a water vapor barrier. LDPE is formed via free-radical polymerization, with alkyl
branch groups [given by the structure -(CH2)xCH3] of two to eight carbon atom
lengths. The most common branch length is four carbons long. High reaction
pressures encourage crystalline regions [1]. The reactions to form LDPE are shown
in Figure 2.3.

10
Figure 2.3 Radical polymerization of LDPE [15]
2.4 Polypropylene (PP)
Polypropylene is very important and common polymer used in various applications
from films to fibers.
2.4.1 Structure of PP
Polypropylene(PP) is synthesized by the polymerization of propylene, a monomer
derived from petroleum products through the reaction shown in Figure 2.4 [1]. It was
not until Ziegler-Natta catalysts became available that polypropylene could be
polymerized into a commercially viable product. These catalysts allowed the control
of stereochemistry during polymerization to form polypropylene in the isotactic and
syndiotactic forms, both capable of crystallizing into a more rigid, useful polymeric
material. The range of molecular weights for PP is Mn _ 38,000 to 60,000 and Mw _
220,000 to 700,000. The molecular weight distribution (Mn/Mw) can range from 2 to
about 11 [3].
11
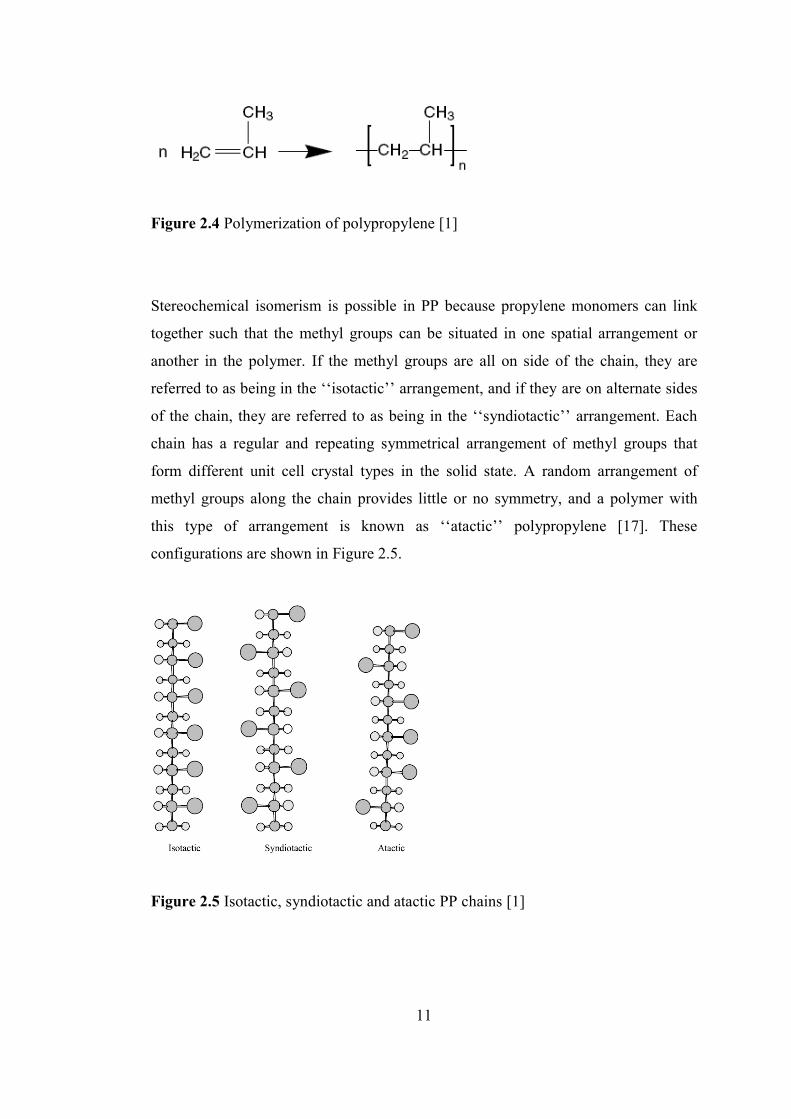
Figure 2.4 Polymerization of polypropylene [1]
Stereochemical isomerism is possible in PP because propylene monomers can link
together such that the methyl groups can be situated in one spatial arrangement or
another in the polymer. If the methyl groups are all on side of the chain, they are
referred to as being in the ‘‘isotactic’’ arrangement, and if they are on alternate sides
of the chain, they are referred to as being in the ‘‘syndiotactic’’ arrangement. Each
chain has a regular and repeating symmetrical arrangement of methyl groups that
form different unit cell crystal types in the solid state. A random arrangement of
methyl groups along the chain provides little or no symmetry, and a polymer with
this type of arrangement is known as ‘‘atactic’’ polypropylene [17]. These
configurations are shown in Figure 2.5.
Figure 2.5 Isotactic, syndiotactic and atactic PP chains [1]

12
Different behavior can be found for each of the three stereoisomers. Isotactic and
syndiotactic polypropylene can pack into a regular crystalline array giving a polymer
with more rigidity. Both materials are crystalline; however, syndiotactic
polypropylene has a lower Tm than the isotactic polymer [18]. The isotactic polymer
is the most commercially used form with a melting point of 165°C. Atactic
polypropylene has a very small amount of crystallinity (5 to 10%) because its
irregular structure prevents crystallization, thus, it behaves as a soft flexible material.
It is used in applications such as sealing strips, paper laminating, and adhesives [3].
2.4.2 Properties of PP
Unlike polyethylene, which crystallizes in the planar zigzag form, isotactic
polypropylene crystallizes in a helical form because of the presence of the methyl
groups on the chain [3]. Commercial polymers are about 90 to 95% isotactic. The
amount of isotacticity present in the chain will influence the properties. As the
amount of isotactic material (often quantified by an isotactic index) increases, the
amount of crystallinity will also increase, resulting in increased modulus, softening
point, and hardness [1].
Although, in many respects, polypropylene is similar to polyethylene, since both are
saturated hydrocarbon polymers, they differ in some significant properties. Isotactic
polypropylene is harder and has a higher softening point than polyethylene, so it is
used where higher stiffnes materials are required. Polypropylene is less resistant to
degradation, particularly high-temperature oxidation, than polyethylene, but has
better environmental stress cracking resistance [19]. The decreased degradation
resistance of PP is due to the presence of a tertiary carbon in PP, allowing for easier
hydrogen abstraction compared to PE. As a result, antioxidants are added to
polypropylene to improve the oxidation resistance. The degradation mechanisms of
the two polymers are also different. PE cross-links on oxidation, while PP undergoes
chain scission. This is also true of the polymers when exposed to high energy
radiation, a method commonly used to cross-link PE [20].

13
Polypropylene is one of the lightest plastics with a density of 0.905. The nonpolar
nature of the polymer gives PP low water absorption. Polypropylene has good
chemical resistance, but liquids, such as chlorinated solvents, gasoline and xylene,
can affect the material. Polypropylene has a low dielectric constant and is a good
insulator. Difficulty in bonding to polypropylene can be overcome by the use of
surface treatments to improve the adhesion characteristics [20].
Polypropylene has a higher Tg and melting point than polyethylene with the
exception of UHMWPE. Service temperature is increased, but PP needs to be
processed at higher temperatures. Because of the higher softening, PP can withstand
boiling water and can be used in applications requiring steam sterilization [3].
Polypropylene is also more resistant to cracking in bending than PE and is preferred
in applications that require tolerance to bending. This includes applications such as
ropes, tapes, carpet fibers, and parts requiring a living hinge. Living hinges are
integral parts of a molded piece that are thinner and allow for bending [19]. One
weakness of polypropylene is its low-temperature brittleness behavior, with the
polymer becoming brittle near 0°C [3]. This can be improved through
copolymerization with other polymers such as ethylene.
2.4.3 Processing behavior of PP and comparison with PE
Comparing the processing behavior of PP to PE, it is found that polypropylene is
more non-Newtonian than PE and that the specific heat of PP is lower than
polyethylene. The melt viscosity of PE is less temperature sensitive than PP. Mold
shrinkage is generally less than for PE, but is dependent on the actual processing
conditions. Unlike many other polymers, an increase in molecular weight of
polypropylene does not always translate into improved properties. The melt viscosity
and impact strength will increase with molecular weight, but often with a decrease in
hardness and softening point. A decrease in the ability of the polymer to crystallize
as molecular weight increases is often offered as an explanation for this behavior [3].

14
The molecular weight distribution (MWD) has important implications for processing.
A PP grade with a broad MWD is more shear sensitive than a grade with a narrow
MWD. Broad MWD materials will generally process better in injection-molding
applications. In contrast, a narrow MWD may be preferred for fiber formation.
Various grades of polypropylene are available tailored to a particular application.
These grades can be classified by flow rate, which depends on both average
molecular weight and MWD. Lower flow rate materials are used in extrusion
applications. In injection-molding applications, low flow rate materials are used for
thick parts and high flow rate materials are used for thin-wall molding [1].
Polypropylene can be processed by methods similar to those used for PE. The melt
temperatures are generally in the range of 210 to 250°C. Heating times should be
minimized to reduce the possibility of oxidation. Blow molding of PP requires the
use of higher melt temperatures and shear, but these conditions tend to accelerate the
degradation of PP. Because of this, blow molding of PP is more difficult than for PE.
The screw metering zone should not be too shallow in order to avoid excessive shear.
For a 60 mm screw the flights depths are typically about 2.25 and 3.0 mm for a 90
mm screw [3]. In film applications, film clarity requires careful control of the
crystallization process to ensure that small crystallites are formed. This is
accomplished in blown film by extruding downwards into two converging boards. In
the Shell TQ process the boards are covered with a film of flowing, cooling water.
Oriented films of PP are manufactured by passing the PP film into a heated area and
stretching the film both transversely and longitudinally. To reduce shrinkage the film
may be annealed at 100°C while under tension [3]. Highly oriented films may show
low transverse strength and a tendency to fibrillate. Other manufacturing methods for
polypropylene include extruded sheet for thermoforming applications and extruded
profiles [1].

15
2.5 Fillers
Fillers are solid additives, which are incorporated into the polymer matrix. They are
generally inorganic materials, and can be classified according to their effect on the
mechanical properties of the resulting mixture. Inert or extender fillers are added
mainly to reduce the cost of the compound, while reinforcing fillers are added in
order to improve certain mechanical properties such as modulus or tensile strength
[1]. Although termed inert, inert fillers can nonetheless affect other properties of the
compound besides cost. In particular, they may increase the density of the
compound, lower the shrinkage, increase the hardness, and increase the heat-
deflection temperature [1].
Reinforcing fillers typically will increase the tensile, compressive, and shear
strength; increase the heat deflection temperature; lower shrinkage; increase the
modulus; and improve the creep behavior. Reinforcing fillers improve the properties
via several mechanisms. In some cases a chemical bond is formed between the filler
and the polymer, while in other cases the volume occupied by the filler affects the
properties of the thermoplastic. As a result, the surface properties and interaction
between the filler and the thermoplastic are of great importance [1].
Certain properties of the fillers are of particular importance. These include the
particle shape, the particle size and distribution of sizes, and the surface chemistry of
the particle. In general, the smaller the particle, the higher the mechanical property of
interest (such as tensile strength) is [3]. Larger particles may give reduced properties
compared to the pure thermoplastic. Particle shape can also influence the properties.
For example, platelike particles or fibrous particles may be oriented during
processing. This may result in properties that are anisotropic. The surface chemistry
of the particle is important to promote interaction with the polymer and allow for
good interfacial adhesion. It is important that the polymer wet the particle surface
and have good interfacial bonding in order to obtain the best property enhancement
[1].

16
Examples of inert or extender fillers include china clay (kaolin), talc, and calcium
carbonate. Glass spheres are also used as thermoplastic fillers. They may be either
solid or hollow, depending on the particular application. Talc is an important filler
with a lamellar particle shape [21]. It is a natural, hydrated magnesium silicate with
good slip properties. Kaolin and mica are also natural materials with lamellar
structure. Other fillers include wollastonite, silica, barium sulfate, and metal
powders. Carbon black is used as a filler primarily in the rubber industry, but it also
finds application in thermoplastics for conductivity, UV protection, and as a pigment.
Fillers in fiber form are often used in thermoplastics. Types of fibers include wood
flour, fiberglass, and carbon [1]. Table 2.2 shows the fillers and their forms.
Table 2.2 Forms of various fillers [1]
2.5.1 CaCO3
Calcium carbonate is important filler with a particle size of 1-3 µm. It is a natural
product from sedimentary rocks and is separated into chalk, limestone, and marble.
In some cases the calcium carbonate may be treated to improve the bonding with the
thermoplastic [21]. CaCO3 is abundant, largely inert, low cost, white filler. The
primary function of calcium carbonate as a filler is to lower costs, while having
moderate effects on mechanical properties [2].

17
The mechanical properties of polymer composites with CaCO3 are dependent on
interfaces where the polymer matrix and filler are in contact. As inorganic filler,
CaCO3 particles have mostly polar, hydrophilic and high free energy surfaces. Thus,
filler particles might be incompatible with polymer matrices having non-polar, more
hydrophobic and relatively low free energy surfaces. In order to overcome that
possible incompatibility, several methods such as filler surface treatment are
conducted and filler’s surface becomes appropriate for adhesion with non-polar
polymer matrices.
2.6 Titanate Coupling Agents
2.6.1 Description of Coupling Agents
Coupling agents are additives used in reinforced and filled plastic composites to
enhance the plastic–filler-reinforcement interface to meet increasingly demanding
performance requirements. In general, there is little affinity between inorganic
materials used as reinforcements and fillers and the organic matrices in which they
are blended. With silicate reinforcements (glass fiber or wollastonite), silane
coupling agents act by changing the interface between the dissimilar phases. This
results in improved bonding and upgraded mechanical properties. By chemically
reacting with the resin and the filler or reinforcement components, coupling agents
form strong and durable composites. Coupling agents significantly improve
mechanical and electrical properties for a wide variety of resins, fillers, and
reinforcements. In addition, they act to lower composite cost by achieving higher
mineral loading [22]. Mainly there are two types of coupling agent: silane and
titanate (or zirconate) based coupling agents.

18
2.6.1.2 Silane Coupling Agents
Silane coupling agents comprise more than 90% of the plastic coupling agent market.
As shown in Figure 2.6 organosilanes can be represented chemically by the formula
Y-Si(X)3 where X- represents a hydrolyzable group such as ethoxy or methoxy and
Y- is a functional organic group which provides covalent attachment to the organic
matrix.
Figure 2.6 General Structure of organosilanes
The silane coupling agent is initially bonded to the surface hydroxy groups of the
inorganic component by the Si(X)3 either directly or more commonly via its
hydrolysis product, Si(OH)3 which is termed as “silanol”. The Y- functional group
(amino, methoxy, epoxy, etc.) attaches to the matrix when the silane-treated filler or
reinforcement is compounded into the plastic, resulting in improved bonding and
upgraded mechanical and electrical properties [22]. The coupling reaction of silanes
to an inorganic filler surface is represented in Figure 2.7.

19
Figure 2.7 Mode of reaction between a silanol and an inorganic surface [22].
2.6.2 Structure and Properties of Titanate Coupling Agents
Titanate coupling agents are organometallic interphase chemicals based on titanium
or zirconium. Titanate coupling agents impart increased functionality to fillers in
plastics. The different ways that these additives work in filled polymers can be
explained by breaking down the various mechanisms of the titanate (or zirconate)
molecule into six distinct functions [23]. The titanate structure may be tailored to
provide desired properties through the six functionalities on the basic structure
shown in Figure 2.8.
(1) (2) (3) (4) (5) (6)
(RO)n-Ti-(-O X R’ Y)4–n
Figure 2.8 Basic chemical structure of a titanate molecule
There are many types of titanate coupling agents with varying chemical structures
and contents. These many kinds of titanates are used according to polymer and its
several properties. Table 2.3 provides a chemical description and structure of four
common coupling agents along with their commercial name. The commercial name
is often used alone in this study for the sake of brevity.

20
Table 2.3 Chemical description and structure of some titanate coupling agents
In this study Lica12 is used as titanate coupling agent. Its detailed chemical structure
is given in Figure 2.9.
Figure 2.9 Chemical Structure of Lica 12 (neopentyl (diallyl) oxy, tri (dioctyl)
pyrophospato titanate).
Titanate coupling agents react with free protons at the surface of the inorganic
material, resulting in the formation of organic monomolecular layers on the surface
as shown schematically in Figure 2.10. Typically, titanate-treated inorganic fillers or
reinforcements are hydrophobic, organophilic, and organofunctional and, therefore,
exhibit enhanced dispersibility and bonding with the polymer matrix [22].

21
Figure 2.10 Schematic representation of the monomolecular layer formation by
titanate [24].
Esters of titanium (or zirconium) couple or chemically bridge two dissimilar species
such as an inorganic filler/organic particulate/fiber and an organic polymer through
proton coordination. This permits coupling to non-hydroxyl bearing, and therefore
non-silane reactive, inorganic substrates such as CaCO3 and boron nitride as well as
organic substrates such as carbon black and nitramines without the need of water of
condensation as with silanes [23]. Titanate coupling agents are unique in that their
reaction with free protons on the substrate surface results in a monomolecular layer
on the surface whether it be a filler or substrate. This is likely the cause of one of the
problems in using organic titanates - over concentration. Since excess titanate
(amount greater than necessary to form a monolayer) does not result in a polymer
network at the interface, it is suspected that it can form a weak boundary layer
resulting in degraded properties. Thus, the amount of titanate that is used is an
important parameter [24].
The thermally stable quaternary carbon structure of the neoalkoxy organometallics
permits in situ reactions to take place in the thermoplastic melt. In addition, the
coupling of monolayers of a phosphato or a pyrophosphato heteroatom titanate (or
zirconate) imparts synergistic intumescence to non-halogenated flame retardants

22
such as Mg(OH)2 and aluminum trihydrate (ATH); flame retardance function to
fillers such as CaCO3; control of the burn rate and burn rate exponent of aluminum
powder rocket fuels; and extinction of the flame spread of spalls of polymer-bound
nitramines used in propellants and explosives [23].
The organometallic monolayer covered filler surface becomes a catalysis support bed
for “repolymerization” of the surrounding polymer phase, thus allowing fillers to act
as mechanical property improvers. Furthermore, the in situ monomolecular
deposition of titanate on the surface of a particulate, such as nanofiller, renders the
particulate hydrophobic and organophilic. Under melt compounding shear
conditions, the titanate assists in the removal of air voids and moisture from the
particle surface, resulting in complete dispersion and formation of a true continuous
phase, thus optimizing filler performance.
Minor amounts of thermally stable neoalkoxy titanate and zirconate additives may
provide a means for post-reactor, in situ metallocene-like “repolymerization”
catalysis of a filled or unfilled polymer during the plasticization phase. This may
result in the creation of metallocene-like (titanocene or zirconocene) behavior
associated with effects such as increased composite strain to failure, resulting in
increased impact toughness, or enhanced polymer foamability. Other effects to be
discussed below with specific examples are related to enhanced processability,
reduced polymer chain scission, shortened polymer recrystallization time, and the
compatibilization of dissimilar polymers [23].
2.6.3 Functions of Titanate Coupling Agents
Organosilanes have long been used to enhance the chemical bonding of a variety of
thermoset resins with siliceous surfaces and more recently of thermoplastics. It is
observed that organosilanes are essentially non-functional as bonding agents when
employing carbon black, CaCO3, boron nitride, graphite, aramid or other organic
derived fibers [25]. A comparison of the six functional sites of a titanate (or

23
zirconate) to a silane on basic structures as shown in Figure 2.11 is useful to explain
their performance differences.
Titanate Coupling Agent Silane Coupling Agent
(1) (2) (3) (4) (5) (6) (1) (5)
(RO)n-Ti-(-O X R’ Y)4–n (RO)3-Si-(-R’Y)
Figure 2.11 Number of functions signed on basic structure of titanate coupling agent
and silane coupling agent
As shown in the Figure 2.11, titanate coupling agent has 6 functions according to
relevant parts on molecular structure where:
Function (1) RO = Hydrolyzable group/substrate-reactive group with surface
hydroxyls or protons.
Function (2) Ti (Zr), Si = Tetravalent titanium, zirconium or silicon. The Ti–O (or
Zr–O) bond is capable of disassociation allowing transesterification, transalkylation,
and other catalyzed reactions such as “repolymerization”, while the Si–C bond is
more stable and thus unreactive.
Function (3) X = Binder functional groups such as phosphato, pyrophosphato,
sulfonyl, carboxyl, etc., that may impart intumescence, burn rate control, anti-
corrosion, quaternization sites, dissociation rate/electron-transfer control, etc.
Function (4) R’ = thermoplastic-specific functional groups such as aliphatic and
non-polar isopropyl, butyl, octyl, isostearoyl groups; naphthenic and mildly polar
dodecylbenzyl groups; or aromatic benzyl, cumyl or phenyl groups. Provide
entanglements with long hydrocarbon chains and bonding via van der Waals forces.

24
Function (5) Y = thermoset (but also thermoplastic)-specific functional groups such
as acrylyl, methacrylyl, mercapto, amino, etc. Provide thermoset reactivity
chemically bonding the filler to the polymer.
Function (6) 4–n = mono-, di- or triorganofunctionality. Hybrid titanate (or
zirconate) coupling agents, such as those containing 1 mole each of a carboxyl
[function (3)] and aliphatic isostearoyl [function (4)] ligand and 2 moles of carboxyl
[function (3)] and acrylyl [function (5)] ligands, are possible.
Therefore, function (1) relates to filler/fiber substrate reaction mechanisms, while
functions (2) to (6) are polymer/curative reactive [23].
2.6.4 Effects of Titanate Coupling Agents
Effects of titanate coupling agents are classified according to functional sites
expressed in previous part 2.6.3.
2.6.4.1 Effects of Function (1)
The functional site (1) of the titanate molecule is associated with coupling,
dispersion, adhesion, and hydrophobicity effects. These effects are also related to the
method of application of the titanate on the filler surface.
2.6.4.1.1 Coupling Effect
In its simplest terms, the titanate function (1) mechanism may be classed as
protonreactive through solvolysis (monoalkoxy) or coordination (neoalkoxy) without
the need of water of condensation, while the silane function (1) mechanism may be
classed as hydroxyl-reactive through a silanol–siloxane mechanism requiring water

25
of condensation. The silane’s silanol–siloxane water of condensation mechanism
limits its reactions to temperatures below 100oC, thereby reducing the possibility of
in situ reaction in the thermoplastic or elastomer melt above 100oC as is possible
with titanates. In addition, a variety of particulate fillers such as carbonates, sulfates,
nitrides, nitrates, carbon, boron, and metal powders used in thermoplastics,
thermosets, and cross-linked elastomers do not have surface silane-reactive hydroxyl
groups, while almost all three-dimensional particulates and species have surface
protons thereby apparently making titanates more universally reactive [23].
2.6.4.1.2 Dispersion Effect
Dispersion of fillers results from the application of electrochemical and mechanical
forces to the interface of the inorganic filler/polymer so as to cause complete
deagglomeration to the attrited or original particle size in an organic phase, complete
elimination of air voids and water, and the creation of a true continuous inorganic/
organic composition. The coupling of the titanate to the inorganic/organic substrate
in monolayers allows for elimination of air voids, enhanced hydrophobicity, and a
complete continuous phase for stress/strain transfer. Figure 2.12 shows “before and
after” effect of a titanate monolayer on agglomerated fillers [23].
Figure 2.12 Illustration of the dispersion effect of coupling a titanate monolayer on
an agglomerated inorganic in an organic phase [23]
26
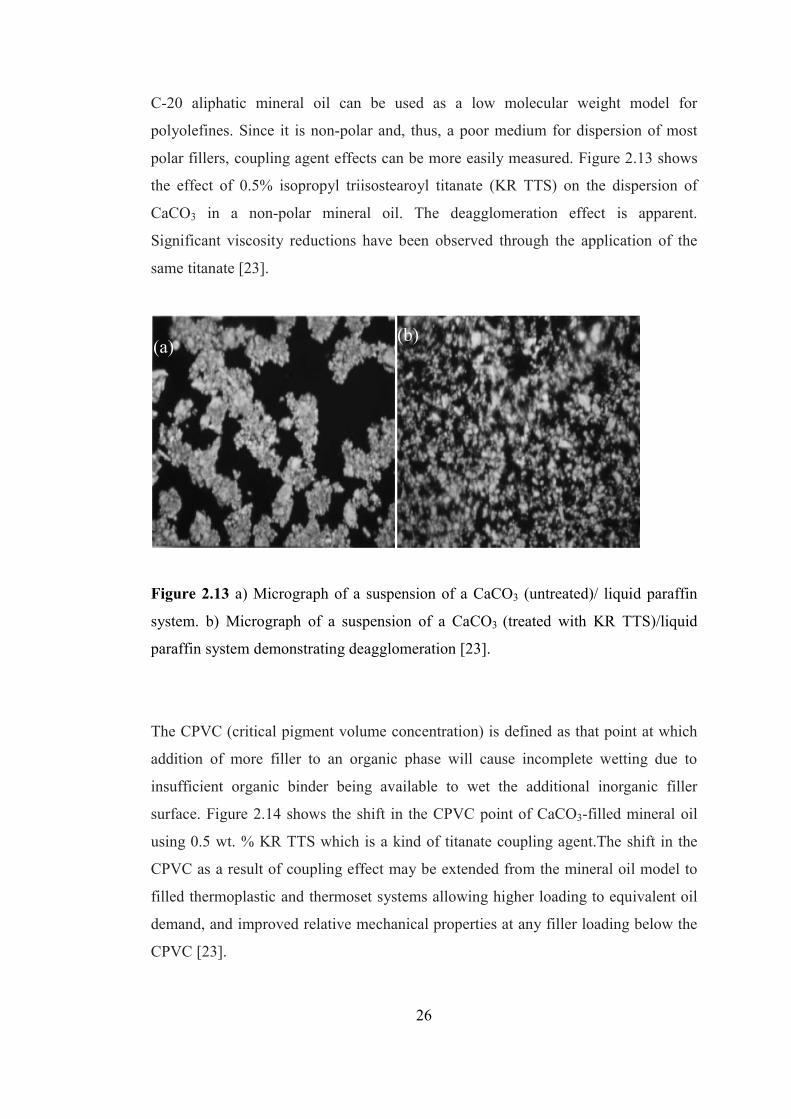
C-20 aliphatic mineral oil can be used as a low molecular weight model for
polyolefines. Since it is non-polar and, thus, a poor medium for dispersion of most
polar fillers, coupling agent effects can be more easily measured. Figure 2.13 shows
the effect of 0.5% isopropyl triisostearoyl titanate (KR TTS) on the dispersion of
CaCO3 in a non-polar mineral oil. The deagglomeration effect is apparent.
Significant viscosity reductions have been observed through the application of the
same titanate [23].
Figure 2.13 a) Micrograph of a suspension of a CaCO3 (untreated)/ liquid paraffin
system. b) Micrograph of a suspension of a CaCO3 (treated with KR TTS)/liquid
paraffin system demonstrating deagglomeration [23].
The CPVC (critical pigment volume concentration) is defined as that point at which
addition of more filler to an organic phase will cause incomplete wetting due to
insufficient organic binder being available to wet the additional inorganic filler
surface. Figure 2.14 shows the shift in the CPVC point of CaCO3-filled mineral oil
using 0.5 wt. % KR TTS which is a kind of titanate coupling agent.The shift in the
CPVC as a result of coupling effect may be extended from the mineral oil model to
filled thermoplastic and thermoset systems allowing higher loading to equivalent oil
demand, and improved relative mechanical properties at any filler loading below the
CPVC [23].
(a) (b)

27
Figure 2.14 Comparision the CPVC point of untreated CaCO3-filled mineral oil
(left) with KR TTS treated CaCO3-filled mineral oil (right) [23].
2.6.4.1.3 Adhesion Effect
One of the reasons why the dispersion of inorganics in plastics and the adhesion of a
plastic to an inorganic substrate are so difficult is because many thermoplastics and
rubbers, such as olefin-based polymers, are non-polar. Titanates and zirconates are
well established adhesion promoters. A recent example of bonding polyolefins to
metals and another example of the adhesion of polyolefins to foil electrodes using
various titanate coupling agents had been observed in some researhes [23].
2.6.4.2 Effects of Function (2)
Repolymerization is a concept that has been patented to explain new and novel
rheology and stress/strain effects in thermoplastics and thermosets obtained with

28
titanate and zirconate that are independent of cross-linking and curative effects. The
aromatic (e.g., phenyl, naphthyl, styrenic) or aliphatic (e.g., ethyl, propyl, butyl)
backbones that typically make up the thermoplastic macromolecule, liquid chemical
compounds, or thermoplastic elastomers are reactive with titanate (or zirconate)
[functions (2) to (4)], independent of any curative reaction mechanisms [function
(5)]. Thus, the monolayered, organometallic-coupled particulate and/or fiber may be
considered as a catalyst support bed for single-site, in situ metallocenelike
repolymerization of the surrounding polymer [23].
Currently, published efforts in metallocene (titanocene and zirconocene) chemistry
by major polymer producers appear to be centered on olefin polymers and
copolymers. Metallocene-derived HDPE and engineering plastics seemingly remain
a future goal, while titanate and zirconate esters appear to be efficacious to some
degree in virtually all polymers synthesized by various routes. Moreover, the
titanocene or zirconocene catalysts used in the synthesis of metallocene-derived
polymers do not remain in the polymer. With repolymerization, thermoplastics may
now be regenerated to virgin or recycled more efficiently since the thermally stable
titanate or zirconate ester forms of the relevant organometallics “anneal” or
“reconnect” polymer chain lengths that normally undergo scission during processing
and remain in the polymer for subsequent repeat thermal cycles [23].
2.6.5 Surface Modification of Fillers with Titanate Coupling Agents
Titanate coupling agents act as a chemical bridge between the adhesive resin and the
substrate or filler. Coupling agents were first used to treat fillers before they are
incorporated into liquid or melt resin to make composite materials. While the
treatment of inorganic fillers, the organic titanates react with surface hydroxyl groups
to produce a polymer network at the interface of fillers. This reaction results in
formation of monomolecular layer on the surface of the filler [24]. In Figure 2.15
coating of filler by titanates is represented schematically.

29
Figure 2.15 Schematic representation of coating of filler by titanates
Typically, titanate treated inorganic fillers or reinforcements are hydrophobic,
organophilic and organofunctional thus they exhibit enhanced dispersability and
bonding with the polymer matrix. The use of organic titanates and zirconates for
surface modification is based on their ability to hydrolyze to a coating that is very
thin, amorphous, and primarily inorganic. The properties of this film depend on the
type and amount of organometallic coupling agent used, the chemistry of the
organometallic, and the processing properties used to apply the coating. These
coatings modify the surface of the filler or substrate to provide the following unique
properties [24]:
• They promote adhesion of adhesives and coatings to glass, metal and plastics.
• The organometallic interface improves dispersability of pigments and fillers
in aqueous and non-aqueous systems and reduces viscosity.
• It can provide scratch-resistant and reflective properties to glass.
• It can modify frictional characteristics of the substrate.
• Modify surface characteristics (water repellency or hydrophobicity)
• Improves wet-out between resin and filler
• Decreases water-vapor transmission

30
2.7 Polymer Processing
Polymer processing is the operation by which solid or liquid polymers are converted
to finished products. It consists of several steps, such as, pre-shaping, shaping
(molding, casting, die-forming, calendering etc.), post-shaping (decorating,
fastening, sealing, welding, dyeing, printing, etc.). Pre-shaping involves melting and
softening, pressurization and pumping of the polymer melt, homogeneous mixing
and devolatilization and stripping of residual monomers, solvents, contaminants [2].
In this study extrusion and internal mixing are used for polymer melting and
homogeneous mixing of polymers with each other and fillers. For shaping the
resultant products, injection molding is used.
2.7.1 Extrusion
Extrusion is a polymer conversion operation in which a solid thermoplastic material
is melted or softened, forced through an orifice (die) of the desired cross section, and
cooled. The process is used for compounding plastics and for the production of tubes,
pipes, sheet, film, wire coating, and profiles. All extrusion lines include a melt pump
called an extruder, but other equipment is specific to the particular process [26]. This
process is also used to produce the plastic pellets that are later used by all the other
plastics manufacturing processes. In addition to the shaping of parts by the extrusion
process, extrusion is the most efficient and widely used process for melting plastic
resin as part of the process of adding or mixing fillers, colorants, and other additives
into the molten plastics. Extrusion can be used to shape the part directly after this
mixing or an extruder can be used as the melting device that is coupled with other
shaping processes [27].
In normal plastics extrusion, plastics granules or pellets and any other materials to be
mixed with them are fed into a hopper attached to the extrusion machine. From the
hopper the materials falls through a hole in the top of the extruder onto the extrusion

31
screw. This screw, that turns inside the extruder barrel, conveys the plastic forward
into a heated region of the barrel where the combination of external heating and
heating from viscous dissipation melts the plastic. The screw moves the molten
plastic until it exists through a hole in the end of the extruder barrel to which a die
has been attached. The die imparts a shape to the molten plastic stream which is
immediately cooled by a water bath [27]. A kind of single-screw extruder is shown in
Figure 2.16.
Figure 2.16 Schematic Representation of Single-screw extruder [26]
The screw is the main part of the extruder which directly affects the performance of
the machine. It performs a number functions as followings:
• conveying the plastic pellets
• melting the material
• conveying the molten material
• mixing the plastic melt to obtain homogeneity.
The screw is placed inside the cylinder extruder barrel. It provides the bearing
surface where shear is imparted to the plastic granules. The barrel consists of cast or
fabricated steel sections and a smooth inner liner, often made of a wear-resistant

32
material. Heating and cooling media surrounds the barrel to keep it at the desired
temperatures.
The polymer is shaped in the die zone. The objective of an extrusion die is to
distribute the polymer melt in the flow channel in such a way that the material exits
from the die with a uniform velocity. The polymer melt is forced through the die by
means of the die-head pressure [27]. According to screw numbers, extruders are
classified into single screw and multi screw extruders. In this study twin-screw
extruder is used for compounding applications.
2.7.1.1 Twin-Screw Extruders
Although twin-screw extruders are used less than single-screw extruders they are
widely employed for difficult compounding applications, devolatilization, chemical
reaction, and profile extrusion of thermally sensitive materials in the polymer
processing industry [27].
The complex flow patterns in twin-screw extruders have several advantages, such as
good mixing, good heat transfer, large melting capacity, good devolatilization
capacity, and good control over stock temperatures [27]. Type of transport in
extruder is different in single-screw and twin-screw extruders. Material transport in
single-screw extruder is by frictional drag in solid conveying zone and viscous drag
in the melt conveying zone. On the other hand, the transport in an intermeshing twin-
screw extruder is a positive displacement type of transport [27]. There is a
tremendous variety of twin-screw extruders, with vast differences in design, principle
of operation and field of applications. The twin-screw construction substantially
increases the number of design variables, such as direction of rotation, intermeshing,
non-intermeshing, etc. [27]. There are two different patterns for intermeshing twin-
screw extruders according to the direction of rotation of the screws: co-rotating and
counter-rotating twin- screw extruders. Figure 2.17 shows intermeshing co-rotating
and counter-rotating twin-screws.
33
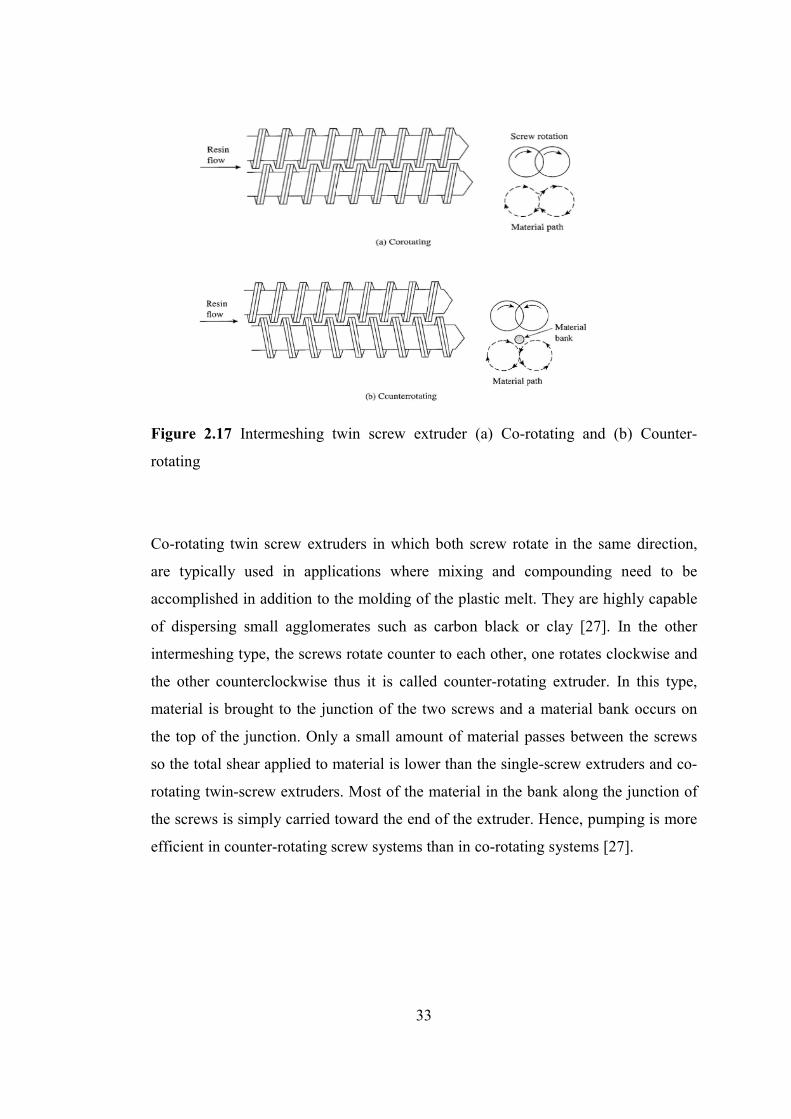
Figure 2.17 Intermeshing twin screw extruder (a) Co-rotating and (b) Counter-
rotating
Co-rotating twin screw extruders in which both screw rotate in the same direction,
are typically used in applications where mixing and compounding need to be
accomplished in addition to the molding of the plastic melt. They are highly capable
of dispersing small agglomerates such as carbon black or clay [27]. In the other
intermeshing type, the screws rotate counter to each other, one rotates clockwise and
the other counterclockwise thus it is called counter-rotating extruder. In this type,
material is brought to the junction of the two screws and a material bank occurs on
the top of the junction. Only a small amount of material passes between the screws
so the total shear applied to material is lower than the single-screw extruders and co-
rotating twin-screw extruders. Most of the material in the bank along the junction of
the screws is simply carried toward the end of the extruder. Hence, pumping is more
efficient in counter-rotating screw systems than in co-rotating systems [27].

34
2.7.2 Internal Mixing
Internal mixer equipped with a ram is introduced by Banbury around 1920 after
single-rotor mixers and primitive twin-rotor mixers are developed. Ram is used to
force the material into the mixing chamber and to provide sealing. The rotors in the
Banbury mixer are nonintermeshing and counterrotating. Most internal mixers use
counter-rotating rotors. Figure 2.18 illustrates a commercially available torque
rheometer [28].
Figure 2.18 Schematic representation of Brabender (Courtesy C. W. Brabender
Instruments, Inc.) [29]
The main components of a batch internal mixer are the rotors, the mixer housing, the
ram, the ram air cylinder, the feed hopper, and the door for discharge (Figure 2.18).

35
Figure 2.19 Schematic representation of a batch internal mixer [28]
The advantages of the batch internal mixer are:
1. It accepts feed stock in various forms,
2. It has intensive mixing action,
3. It has a well-defined residence time,
4. Quick material changes can be made, and
5. A wide range of mixing procedures can be used [28].
The mixing action of the internal mixer is concentrated in the narrow gaps between
the rotor and the housing. In these regions, high rates of shear and elongation occur,
resulting in intensive mixing action. Because the mixer is usually equipped with high
horse power drives, the mixer can handle high-viscosity materials quite well. Some
disadvantages of the batch internal mixer are:
1. It is not a self-wiping mixing device,
2. Batch-to-batch variations can affect product quality,
3. It is difficult to achieve fine process control,
4. It cannot handle high-temperature engineering plastics [23].

36
The sequence of the addition of the ingredients is key to good mixing in internal
mixers. Generally, the objective is to arrange the sequence to maintain adequate
stiffness in the mixture until the most difficult step in the dispersion is achieved.
Normal sequence of mixing of a filled polymer is as follows:
• Step 1. Load polymer and one-half of the filler and mix until the material
softens.
• Step 2. Add remaining filler and mix until fully incorporated.
• Step 3. Add plasticizers and/or softeners and complete mixing [28].
In some cases, a batch may soften too quickly before a good dispersion is obtained.
In this case, an alternate technique may be used, referred to as "upside down
mixing". In this technique, all ingredients are added at once, maximum ram pressure
is applied, and maximum rotor speed is used. The main process variables in the batch
mixing process are batch weight (fill factor), material feed temperature, mixer
temperature, rotor speed, ram pressure, and sequence and timing of the feeding of the
ingredients [28].
2.7.3 Injection Molding
Injection molding is a widely used process to produce parts with variable
dimensions. It is a major processing technique for converting thermoplastic and
thermosetting materials into all types of products.
The injection molding process cycle includes melting of plastic resin, injection of
melt into the mold under high pressure, cooling of the mold, and removing the part.
Cycle time depends on the cooling time of the thermoplastic or the curing time of the
thermosetting plastic [26].
The injection unit may be ram fed or screw fed. Their schematic representation is
shown in Figure 2.19. The ram fed injection molding machine uses a hydraulically

37
operated plunger to push the material through a heated region. The reciprocation
single screw injection molding machine is the most common injection unit used. In
this system, the screw rotates and axially reciprocates. A hydraulic motor produces
the rotation and acts to melt, mix, and pump the polymer. In addition to the material
properties, the injection molding process itself has a large influence on the final
properties of the material, since the polymer chains undergo orientation in the flow
direction during the melt-filling phase of the injection cycle [26].
Figure 2.20 a) a ram-fed b) a screw fed injection molding machine [17].
2.8 Polymer Characterization Polymer characterization is applied to polymer blends and composites in order to
analyze and determine their mechanical, thermal, morphological and rheological
properties. In this study characterization techniques are used for this purpose as
following:
• Mechanical properties Tensile test and impact test
• Morphological properties SEM (Scanning Electron Microscopy)

38
2.8.1 Mechanical Properties
In many industrial applications mechanical properties is very important for polymer
blends and composites as multi-functional materials. According to different purposes
of usage, different types of polymers are desired in industry with varying mechanical
properties. Enhancement of mechanical properties of polymer blends and composites
is very large area for researchers. There are various mechanical tests to observe
properties such as tensile strength, elongation, modulus, impact strength,
compression, abression etc. In this study tensile and impact tests are applied to detect
the enhancement of mechanical properties of studied polymer blends and composites.
2.8.1.1 Tensile Test Tensile properties are measured according to a standard test method of ASTM D
638M-91a. In this test specimen should have a specified shape, typically a dog-bone
as seen in Figure 2.19. The ends of the specimen are clamped into the jaws of the
testing machine and the jaws are separated by the application of a known force. Since
the specimen is pulled up, it elongates or breaks when the load applied is higher than
the load which the specimen can resist. The tensile test mechanism is given in Figure
2.14. Tensile test provides a stress-strain diagram, which is used to determine the
tensile modulus. Stress-strain tests not only give the modulus and an indication of the
strength of the material but also toughness which is an indication of the energy that a
material can absorb before breaking [19].
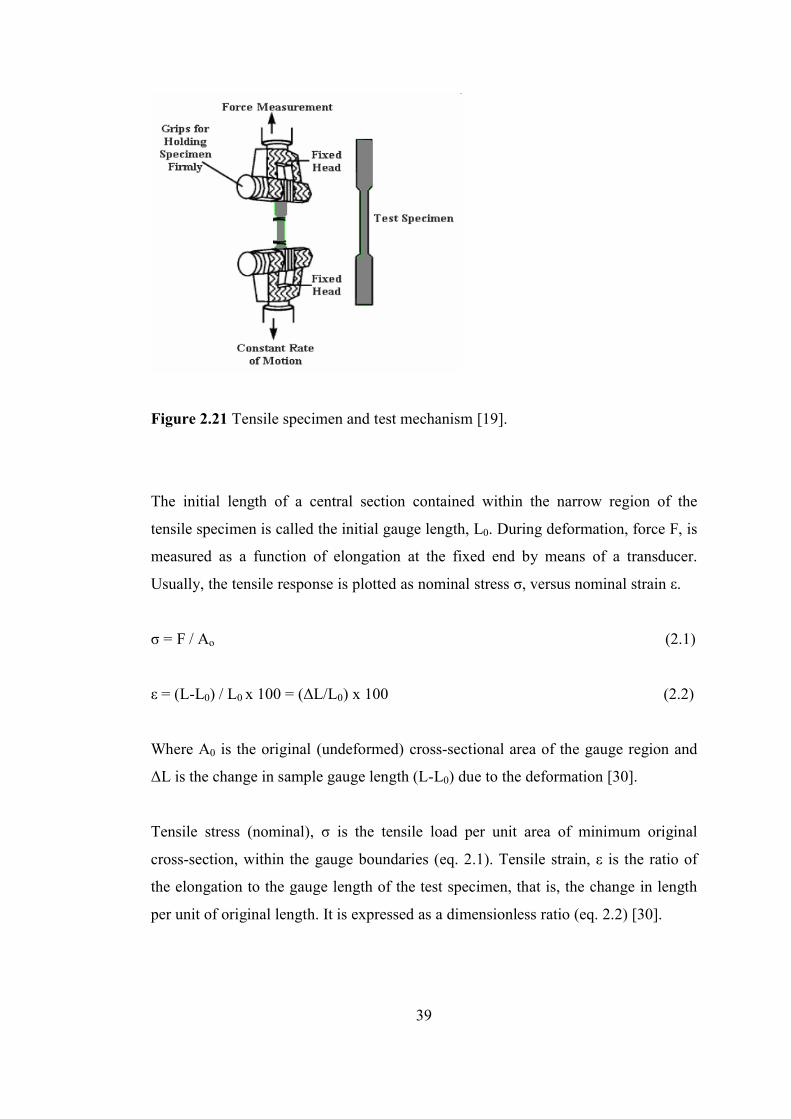
39
Figure 2.21 Tensile specimen and test mechanism [19].
The initial length of a central section contained within the narrow region of the
tensile specimen is called the initial gauge length, L0. During deformation, force F, is
measured as a function of elongation at the fixed end by means of a transducer.
Usually, the tensile response is plotted as nominal stress σ, versus nominal strain ε.
σ = F / Ao (2.1)
ε = (L-L0) / L0 x 100 = (ΔL/L0) x 100 (2.2)
Where A0 is the original (undeformed) cross-sectional area of the gauge region and
ΔL is the change in sample gauge length (L-L0) due to the deformation [30].
Tensile stress (nominal), σ is the tensile load per unit area of minimum original
cross-section, within the gauge boundaries (eq. 2.1). Tensile strain, ε is the ratio of
the elongation to the gauge length of the test specimen, that is, the change in length
per unit of original length. It is expressed as a dimensionless ratio (eq. 2.2) [30].

40
E = σ / ε (2.3)
Modulus of elasticity, E is the ratio of stres (nominal) to corresponding strain below
the proportional limit of a material. It is also known as elastic modulus or Young’s
modulus (eq. 2.3) [25]. Figure 2.20 represents the stress-strain behavior for a typical
polymeric material .
Figure 2.22 Stress-strain behavior over the entire strain range for a typical polymeric
material [31].
Tensile strength (nominal), σm is the maximum tensile stress sustained by the
specimen during a tension test. When the maximum stress occurs at the yield point, it
is designated tensile strength at yield. When the maximum stress occurs at break, it is
designated tensile strength at break [30].

41
2.8.1.2 Impact Test
Impact tests measure the energy required for failure when a standard specimen
receives a rapid stress loading. The impact strength of a polymer can be measured
employing a number of techniques including the Izod and the Charpy tests. For both
the Izod and Charpy tests a hammer like weight strikes a specimen and the energy-
to-break is determined from the loss in the kinetic energy of the hammer [20]. The
specimen can be a notched or unnotched bar.
The standart test method of these two tests are found in ASTM D256-92. In this
study, Charpy impact test was applied to polymer blends and composites to find out
their degree of toughness. In Charpy test, the specimen is supported on both ends and
struck in the middle. If the notch is present, it is on the side away from the striker.
The hammer is released and allowed to strike through the specimen as represented in
Figure 2.21.
Figure 2.23 Schematic representation of Charpy impact test with notced bar
In high speed tensile tests and similar tests on unnotched specimens, the impact
strength is defined in terms of the area under the stress-strain curve or as energy to
break. For notched Charpy tests, impact strength is defined as:
Impact Strength = absorbed energy / initial cross-sectional area behind notch (2.4)

42
2.8.2 Scanning Electron Microscopy (SEM)
Scanning electron microscopy is very important and useful technique to examine the
surface of the material with higher magnifications. SEM has become one of the most
used instruments in research areas today because of the large depth of focus, greater
resolution, and ease of sample preparation. SEM shows very detailed 3-dimensional
images at much higher magnifications than is possible with a light microscope [7].
In SEM analysis, the surface of a specimen to be examined is scanned with an
electron beam, and the reflected (or back-scattered) beam of electrons is collected,
and then displayed at the same scanning rate on a cathode ray tube. The image on the
screen, which may be photographed, represents the surface features of the specimen.
The surface must be electrically conductive; therefore a very thin metallic surface
coating must be applied to nonconductive materials. Magnifications ranging from 10
to in excess of 50000 diameters are possible [32]. Schematic representation of SEM
mechanism is given in Figure 2.22.
Figure 2.24 Schematic representation of scanning electron microscope [33].

43
CHAPTER 3
EXPERIMENTAL
3.1 Materials
In this study low-density polyethylene and polypropylene is used as polymer
matrices, CaCO3 is used as inorganic filler and Lica 12 is used as titanate coupling
agent. This section involves origins and properties of these materials briefly.
3.1.1 Low-Density Polyethylene (LDPE)
Low density polyethylene was purchased from Petkim Petrokimya Holding A.Ş,
İzmir, Turkey. The commercial name of the LDPE used is “Petilen G 03-5 “ and it is
packaged as pellet form in 25 kg white colored PE bags. This type of LDPE is used
in production of industrial films, bottles, containers and pipes, cable coating, etc.
Physical properties of LDPE obtained from the company are given in Table 3.1.
Table 3.1 Physical Properties of LDPE
Property Unit Value Test Method
MFI (Melt Flow Index) ( 2.16 kg, 190oC)
g /10min 0.2 – 0.4 ASTM D-1238
Density (23oC) g /cm3 0.919 – 0.923 ASTM D-1505

44
3.1.2 Polypropylene (PP)
Polypropylene was supplied from İŞBİR Holding A.Ş., Bursa, Turkey and has a
trade name of “100-GA02”. This homopolymer PP resin is a versatile general
purpose grade which can be used in many different applications such as
thermoforming, flexible packaging, etc. Some physical, mechanical and thermal
properties are illustrated in Table 3.2.
Table 3.2 Properties of PP
3.1.3 CaCO3
CaCO3 used in this study was supplied from Omya Mining A.Ş., İstanbul, Turkey. Its
trade name is “OMYACARB 2-KA”. The chemical composition and physical
properties of this filler are illustrated in Table 3.3 and 3.4, respectively.
Table 3.3 Chemical Composition of CaCO3
Materials Composition (wt%)
CaCO3 98.5
MgCO3 1.5
Fe2O3 0.05
Amount insoluble in HCl 0.2
Property Unit Value Test Method
MFI (Melt Flow Index) ( 2.16 kg, 230oC)
g /10min 2.0 ISO 1133
Density (at 23oC) g /cm3 0.905 ASTM D-1505
Tensile Strength (at 23oC) MPa 35 ISO 527-1,-2
Izod Impact Strength (notched, at 23oC) kJ/m2 4 ISO 180/1A
Melting Point oC 163 ASTM D-3417

45
Table 3.4 Physical properties of CaCO3
Property Value
Average Particle Size 3.0 µm
Density 2.7 g/cm3
pH 9.5
Humidity (plant outlet) 0.3 %
3.1.4 Titanate Coupling Agents
In this study titanate coupling agents were used to investigate their effects on
mechanical and morphological properties of LDPE and PP blends and composites.
For this purpose a kind of neoalkoxy organo-titanate which is appropriate for these
polymers and filler was selected and purchased from Kenrich Petrochemical Inc.,
USA. The trade name of this titanate coupling agent is “Lica 12” and its chemical
name is “Titanium IV 2,2 (bis 2-propenolatomethyl) butanolato, tris (dioctyl)
pyrophospato -O ”. Chemical structure of Lica12 is illustrated in Figure 3.1.
Figure 3.1 Chemical structure of Lica 12
Lica 12 has three physical forms that can be used for different purposes in many
areas: liquid, powder and pellet forms. In this study two forms of Lica 12 were used:

46
1- Capow L12/H: It is the powder form of Lica 12 and its name comes from the
abbreviation of “Coupling Agent Powder form of Lica 12”. Its chemical composition
involves 65% Lica 12 and 35% hydrated amorphous silica. This type of Lica 12 was
used to coat the surface of CaCO3 by a treatment before incorporation to polymer
melt compounding. When Capow L12/H is added directly into polymer melt at about
190oC, decomposition of titanate molecules occurs and their activity between filler
and polymer is restricted.
2- Caps L12/L: This is the pellet form of Lica 12 and its name comes from the
abbreviation of “Coupling Agent Pellet System form of Lica 12”. It has a chemical
composition of 20% Lica 12, 69% LLDPE as binder and 11% hydrated amorphous
silica. This type of Lica 12 was used in PP/LDPE blends by direct addition into melt
blending.
3.1.4.1 Treatment of CaCO3 with Capow L12/H
CaCO3 particles surface were coated with Capow L12/H which is powder form of
titanate coupling agent Lica 12. This treatment is done by using toluene as solvent.
Titanate amount was set as 0.7 wt % of CaCO3 employed. Since 65% of Capow
L12/H contains active titanate, calculation of amounts was done in accordance. For
instance, 400 g CaCO3 requires 2.8 g titanate for treatment which corresponds to
4.31 g Capow L12/H. The calculated amount of Capow L12/H was dissolved in 400
ml toluene at 30oC on a heater then, 400 g CaCO3 was added to this solution and they
were stirred intensively to achieve good dispersion of titanate molecules among filler
particles. After mixing and waiting for 10 minute interval, the slurry was taken on a
wide tray and put into an oven at 30oC in order to remove toluene. The mixture is
kept in the oven for 24 hours and then fine particles of titanate-treated filler were
powderized. The temperature was kept rather low for dissolution and drying since
titanate may be lost by evaporation.

47
3.2 Experimental Procedure
Materials were processed in two ways to prepare two different types of material:
1- Internal mixing was applied by using Brabender to obtain PP and LDPE
homopolymer composites.
2- Extrusion process was done for obtaining PP/PE blends and their composites.
After these melt processes, products obtained are injection molded to form in a dog-
bone shaped specimen. Specimens were used for tensile and impact tests. After
tensile tests, fractured surfaces were examined with scanning electron microscopy
(SEM) for morphological analysis.
3.2.1 Internal Mixing
A counter-rotating internal mixer was used in order to obtain PP and PE composites.
The model of the internal mixer is Brabender Plasti-Corder Torque Rheometer,
PLV-151. Figure 3.2 shows the equipment used in this study.
Figure 3.2 a) Photograph of Brabender with its heating tank and indicators
(a)

48
Figure 3.2 (cont’d) b) Mixing chamber of Brabender (closed as in operation)
c) Screw configuration and open chamber of Brabender
(b)
(c)

49
3.2.1.1 Sample Preparation and Mixing Parameters in Brabender
Composites of PP and LDPE with CaCO3 were produced by internal mixing in
Brabender. In the first set of experiments PP/CaCO3 composites were prepared with
the filler contents of 20, 40, 60 % as control experiments. Then in the second set of
experiments Capow L12/H treated CaCO3 was used with the same ratios for
producing PP/CaCO3 composites with titanate coupling agent. Same experiments
were done for LDPE/ CaCO3 composites with the same filler contents. In all mixing
processes polymers were molten in Brabender’s chamber which has 50cm3 volume
and then filler was added onto melt polymer. Brabender was operated with constant
screw speed of 60 rpm and mixing time was 10 min for PP/CaCO3 composites and
20 min for LDPE/CaCO3 composites. Process temperature was adjusted to 190oC for
LDPE composites and 200oC for PP composites. The temperatures were decreased
by 10oC for PP and LDPE composites with titanate coupling agents in order to
compensate the viscosity reduction effect of the titanate. At a lower temperature the
shear rate will be approximately the same for both cases. Total of 12 polymer
composites were produced; 6 for LDPE composites, 6 for PP composites. These
samples are listed in Table 3.5 with their compositions and sample codes. In sample
codes the numbers of 100, 80, 60 and 40 coming after polymers’ abbreviations
indicates the percentage of defined polymer in the composite. The letters of “Cpw”
used after that number represents the presence Capow L12/H as titanate coupling
agent.
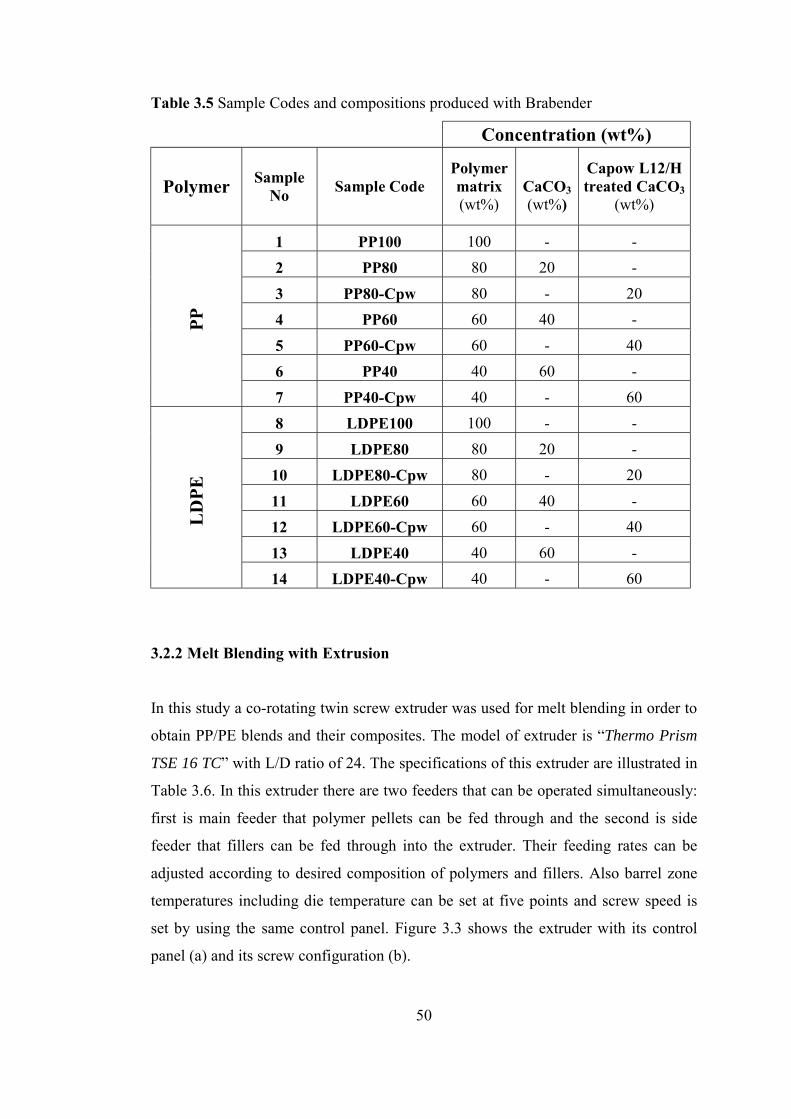
50
Table 3.5 Sample Codes and compositions produced with Brabender
Concentration (wt%)
Polymer Sample No Sample Code
Polymer matrix (wt%)
CaCO3 (wt%)
Capow L12/H treated CaCO3
(wt%)
1 PP100 100 - -
2 PP80 80 20 -
3 PP80-Cpw 80 - 20
4 PP60 60 40 -
5 PP60-Cpw 60 - 40
6 PP40 40 60 -
PP
7 PP40-Cpw 40 - 60
8 LDPE100 100 - -
9 LDPE80 80 20 -
10 LDPE80-Cpw 80 - 20
11 LDPE60 60 40 -
12 LDPE60-Cpw 60 - 40
13 LDPE40 40 60 -
LD
PE
14 LDPE40-Cpw 40 - 60
3.2.2 Melt Blending with Extrusion
In this study a co-rotating twin screw extruder was used for melt blending in order to
obtain PP/PE blends and their composites. The model of extruder is “Thermo Prism
TSE 16 TC” with L/D ratio of 24. The specifications of this extruder are illustrated in
Table 3.6. In this extruder there are two feeders that can be operated simultaneously:
first is main feeder that polymer pellets can be fed through and the second is side
feeder that fillers can be fed through into the extruder. Their feeding rates can be
adjusted according to desired composition of polymers and fillers. Also barrel zone
temperatures including die temperature can be set at five points and screw speed is
set by using the same control panel. Figure 3.3 shows the extruder with its control
panel (a) and its screw configuration (b).

51
Table 3.6 Specifications of Thermo Prism TSE 16 TC Extruder
Thermo Prism TSE 16 TC Unit Value
Barrel Length mm 384
Barrel bore diameter mm 16
Screw diameter mm 15.6
Screw speed (max.) rpm 500
Torque (max.) Nm 12
Internal free volume cm3 68
Peripheral surface area cm2 316
Surface area/unit free volume m2/ lt 0.47
Figure 3.3 a) Picture of Thermo Prism TSE 16 TC Extruder and its control panel
(a)

52
Figure 3.3 (cont’d) b) Screw configuration of Thermo Prism TSE 16 TC Extruder.
3.2.2.1 Sample Preparation and Extrusion Parameters
Polypropylene/low-density polyethylene (PP/LDPE) blends and their composites
were produced in twin-screw extruder. Prior to extrusion, materials were dried to
remove moisture at different conditions that are shown in Table 3.7.
Table 3.7 Drying conditions of materials before extrusion
Material Drying Temperature (oC) Drying Time (h)
PP 80 24
LDPE 60 12
CaCO3 60 24
Capow L12 treated CaCO3 30 24
Caps L12 30 12
(b)

53
In the first set of experiments PP/LDPE blends were prepared with ratios of 75/25,
50/50 and 25/75 as control experiments. PP and LDPE pellets were fed into extruder
from main feeder together according to blend ratios with flowrate of 20 g/min. The
other experiments in extruder were done by the basis of these three blends and the
other blends and composites were compared with them. In the second set of
experiments ternary blends of PP/LDPE/Caps L12 was prepared by feeding all
pellets through the main feeder into the extruder. The flowrate is adjusted to 20
g/min. In the third set of experiments Capow L12 treated and untreated CaCO3 was
mixed with PP/LDPE blends of three different ratios as mentioned. Polymer pellets
with desired ratio are put into main feeder and fed to extruder with flowrate of
20g/min while the filler is fed through side feeder with flowrate of 5g/min. Thus,
composites include 80% of polymer matrix (PP+LDPE) and 20% of filler. All
samples produced in the extruder are illustrated in Table 3.8 with their sample codes
and concentrations.
Table 3.8 Sample Codes and compositions produced with extruder
Concentration (wt%)
PP/LDPE (wt/wt)
Sample No Sample Code
Polymer matrix (wt%)
CaCO3 (wt%)
Capow L12
treated CaCO3 (wt%)
Caps L12
(wt%)
1 PP75/0 100 - - -
2 PP75/0-Caps L12 100 - - 0.5
3 PP75/20 80 20 - - 75/2
5
4 PP75/20-Capow L12 80 - 20 -
5 PP50 100 - - -
6 PP50/0-Caps L12 100 - - 0.5
7 PP50/20 80 20 - - 50/5
0
8 PP50/20-Capow L12 80 - 20 -
9 PP25 100 - - -
10 PP25/0-Caps L12 100 - - 0.5
11 PP25/20 80 20 - - 25/7
5
12 PP25/20-Capow L12 80 - 20 -

54
The temperatures and screw speed were adjusted from the control panel as extrusion
parameters. Screw speed was set to 200 rpm in all experiments. The temperature
profile of the barrel was 200-200-200-200-200oC from hopper to the die for PP/PE
blends and composites without titanates. The temperatures were decreased to 190oC
at all barrel zones for PP/PE blends and composites with titanates because titanates
have viscosity reduction effect and so make the melt less viscous leading to low
shear rate. Since mixing is more effective at high shear rates, temperatures were
decreased in order to decrease the effect of viscosity reduction on shear rate.
Temperature profiles are given in Table 3.9.
Table 3.9 Temperature profle of extruder for all experiments
Temperatures (oC)
Inlet Mixing Zones Die
PP/PE systems without titanates 200 200 200 200 200
PP/PE systems with titanates 190 190 190 190 190
3.2.3 Injection Molding
Samples were dried at 80oC for 24 hours before injection molding process. The
specimens for mechanical tests were obtained by using injection molding machine
(Daca Instruments). Its schematic representation is illustrated in Figure 3.4. In this
molding machine the parameters that can be controlled are: barrel temperature, mold
temperature, injection time, speed and pressure. Barrel temperature was adjusted to
220oC for PP/CaCO3 composites and all PP/LDPE blends and composites. This
temperature was taken as 200oC for LDPE/CaCO3 composites. All materials were
kept in this barrel for 1.5 minute and they were injected to mold.
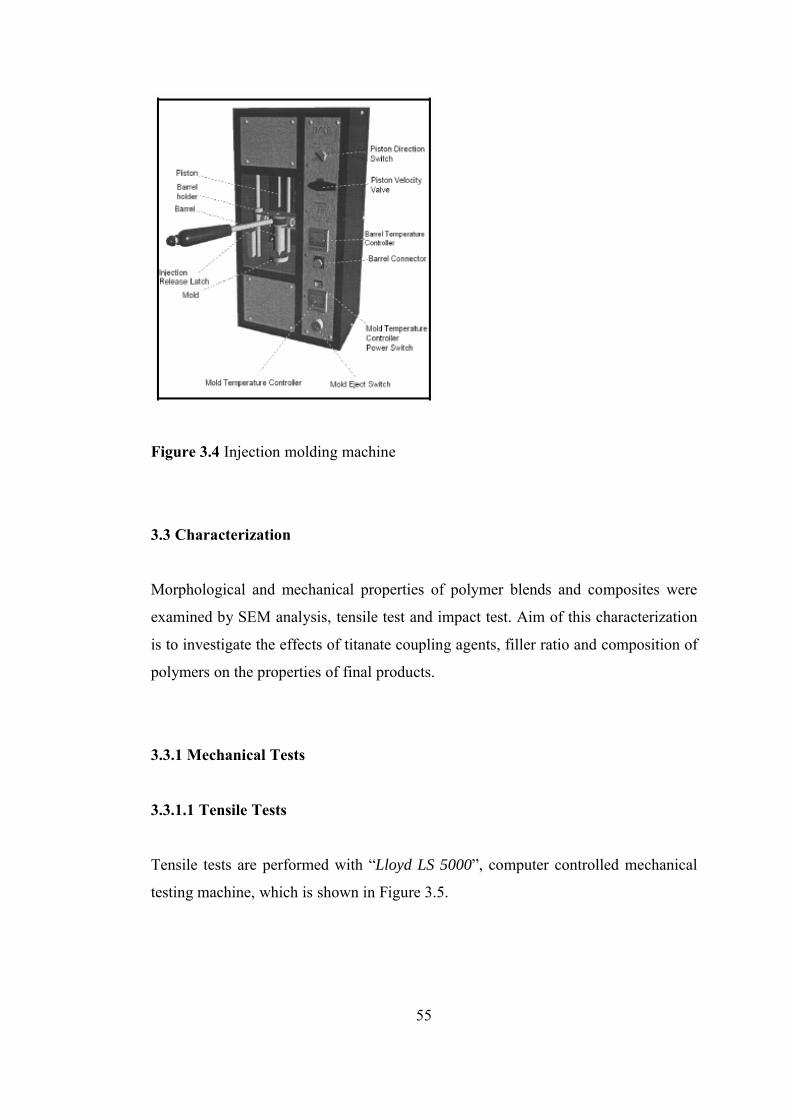
55
Figure 3.4 Injection molding machine
3.3 Characterization
Morphological and mechanical properties of polymer blends and composites were
examined by SEM analysis, tensile test and impact test. Aim of this characterization
is to investigate the effects of titanate coupling agents, filler ratio and composition of
polymers on the properties of final products.
3.3.1 Mechanical Tests
3.3.1.1 Tensile Tests
Tensile tests are performed with “Lloyd LS 5000”, computer controlled mechanical
testing machine, which is shown in Figure 3.5.

56
Figure 3.5 Picture of Lloyd LS 5000 tensile test machine
The test was carried out under constant strain rate of 5cm/min. The specimen was
pulled at this constant rate of extension until the center of the specimen fails. The
shape and dimensions of the specimens are given in Figure 3.6 and Table 3.10,
respectively. After stress vs. strain diagrams of the measurements were examined;
tensile strength, percentage strain at break and Young’s modulus values were
obtained from the computer program of Lloyd tensile machine. For each sample,
average results of at least five measurements were recorded.
Figure 3.6 Dog-bone shaped specimen for tensile test

57
Table 3.10 Dimensions of tensile test specimen
Symbol, Term Dimension (mm) D - distance between grips 80
L0- overall length 110
T- Thickness 2
W-width of narrow section 7.6
Gauge length 50
3.3.1.2 Impact Test
Bar shaped specimen, obtained by cutting out of grips of dog-bone shaped specimen,
were used for impact test. The dimensions of the bar shaped samples were 60mm x
7.5mm x 2mm. The notches were formed by a notcher (Notchvis, Ceast) with using a
V-shaped knife in it. The depth of notch was determined as 2 mm in the middle of
the specimen by electronic displacement measurement. V-shape notched specimens
were tested with pendulum impact tester of Ceast Resil Impactor at room temperature
of 22oC.
Figure 3.7 Ceast Resil Impactor Machine

58
3.3.2 Morphological Analysis (SEM)
In morphology observation, samples that were fractured in tensile test were
investigated. In tensile test dog-bone shaped samples were elongated up to rupture
and obtained fracture surface was prepared for SEM observation. The fracture
surfaces of the samples were investigated by using “QUANTA 400F Field Emission
SEM” with high resolution of 1.2 nm. The instrument is demonstrated in Figure 3.8.
The surfaces were coated with a thin layer of gold to provide a conductive surface.
Several micrographs of fracture surfaces were taken for each sample at various
magnifications. This analysis was made to investigate the effect of titanate coupling
agent on dispersion and behaviour of fillers in the polymer matrix for LDPE and PP
composites and compatibility of PP/LDPE blends.

59
CHAPTER 4
RESULTS AND DISCUSSION
4.1 Mechanical Analysis
Effects of titanate coupling agents on the mechanical properties of polypropylene and
low density polyethylene composites and their blends were investigated by
mechanical tests. Tensile and impact tests were performed on injection molded
specimens of produced polymeric materials. Mechanical properties were measured
on at least five specimens and the test results discussed in this part are the average
values of appropriate specimens for each material. Test results are given and
discussed in this section by classifying them into 3 parts according to material and
their process types. These are PP/CaCO3 composites, LDPE/CaCO3 composites and
PP/LDPE blends and composites. Polymer composites were processed in Brabender
and polymer blends were processed in extruder so, test results of different types of
composites were not compared. The test results were compared with each other for 3
types of polymer compounds separately. Effects of titanate coupling agents were
investigated according to polymer type, filler content, titanate type and composition
of polymer blends.
4.1.1 Tensile Properties
Tensile tests were performed for all samples to obtain stress-strain curves. Stress –
strain curves provide information about tensile strength, percentage strain at break

60
and Young’s (elastic) modulus values of materials. In this part these three properties
are discussed for three different types of material.
4.1.1.1 Tensile Properties for PP/CaCO3 Composites
The tensile tests performed on PP/CaCO3 composites where untreated and titanate
treated filler was incorporated with ratios of 20, 40, 60%. Their tensile properties are
compared with each other to investigate effects of titanate coupling agent and filler
content. Titanate coupling agent was used to coat CaCO3 surface with the dosage of
0.7% of filler and added to polymer matrix via treated CaCO3. Neat PP was
processed under the same conditions in Brabender in order to obtain its tensile
properties as reference to the other PP containing compositions. Stress-strain curves
are illustrated in Figures 4.1 to 4.3.
Figure 4.1 Stress-strain curves for PP composites 20% filled with a) untreated
CaCO3 b) titanate-treated CaCO3.

61
Figure 4.2 Stress-strain curves for PP composites 40% filled with a) untreated
CaCO3 b) titanate-treated CaCO3.
Figure 4.3 Stress-strain curves for PP composites 60% filled with (a) untreated
CaCO3 b) titanate-treated CaCO3.

62
From these curves tensile property values of PP/CaCO3 composites were obtained
and their averages were calculated. These results are shown in Figures 4.4 to 4.6.
0
200
400
600
800
1000
1200
1400
0 20 40 60
Filler Content (wt%)
Ela
stic
Mod
ulus
(MPa
)
PP with untreated filler PP with titanate treated filler
Figure 4.4 Elastic modulus values of PP/CaCO3 composites
As shown in Figure 4.4 elastic (Young’s) modulus values of PP/ CaCO3 composites
increase as filler content increases. It is seen that titanate coupling agents have
positive effect on elastic modulus in all compositions. As filler content increase,
titanate makes the composite’s modulus much higher. This can be explained by the
improvement of the interaction between polymer matrix and filler due to effective
interfacial adhesion of titanate molecules. Thus, PP/CaCO3 composites can resist to
high stresses with the aid of coupling agent.

63
0
20
40
60
80
100
120
140
160
180
200
220
240
0 20 40 60
Filler Content (wt%)
Perc
enta
ge S
train
at B
reak
PP with untreated filler PP with titanate treated filler
Figure 4.5 Percentage strain at break values of PP/CaCO3 composites
In Figure 4.5 results of percentage strain at break values are given. Neat PP has the
highest strain among untreated filled PP composites. As the ratio of untreated CaCO3
goes up from 0 to 60%, percentage strain of composites decreases from about 142%
to 4.7%. It is known that inorganic filler restricts the segmental mobility of polymer
since continuity of segments is impeded by inorganic particles. Therefore, elongation
of PP/CaCO3 composites decreases with respect to increasing filler content.
However, PP composites with titanate-treated filler have significantly higher strains
than the ones with untreated filler. At 20% filler level, titanate coupling agents raised
the percentage strain from 120% to 224%, approximately 2 times higher which is
even higher than that of neat PP. At 40 % filler level percentage strain increased
from 40% to 120% and at 60 % filler level it improved from 4.7% to 16.8%. Capow
L12 treated samples have about 3 times higher strain values. With a different view,
neat PP and 40% titanate-treated CaCO3 filled PP have similar strain values. These
results indicate that at 20% treated filler addition, a considerable improvement is

64
obtained which should have a very positive effect on impact strength. Addition of
treated filler also has an economic advantage as it makes possible to lower the cost
per kg of PP.
These results can be explained with the plasticizing effect of titanate coupling agents.
In the presence of titanate coupling agent, the dispersion of filler particles in polymer
phase is enhanced by the lack of hydration water at surface of inorganic filler, with
organofunctional titanate causing inorganic/polymer interface compatible, thereby
eliminating air voids in the system [34]. A representation of this event has been
mentioned in Figure 2.12 at “Dispersion Effect” part in Chapter 2. In addition to
these results as seen in Figure 4.5, higher filler content would tend to reduce the
plasticizing effect of the coupling agent, so percentage strain values of composites
with titanate decrease as treated-filler content increase.
0
5
10
15
20
25
30
0 20 40 60
Filler Content (wt%)
Tens
ile S
treng
th (M
Pa)
PP with untreated filler PP with titanate treated filler
Figure 4.6 Tensile strength values of PP/CaCO3 composites

65
There is no significant variation in tensile strength values as represented in Figure
4.6. The highest tensile strength value of 28.3 Mpa has been reached by neat PP. The
other tensile strength values decrease very slightly as untreated-filler content
increases as expected since inorganic fillers impede the mechanical resistance of
polymers. Titanate treated-filler has little negative effect at 20% and 60% filler
contents; however titanate molecules have a small positive effect at 40% filler level.
According to these results it can be claimed that titanate coupling agents have not
improved the tensile strength of PP/CaCO3 composites.
4.1.1.2 Tensile Properties for LDPE/CaCO3 Composites
LDPE/CaCO3 composites were prepared with untreated and titanate treated filler
with ratios of 20, 40 and 60%. Their tensile properties were measured to investigate
effects of the titanate coupling agent and the filler content on LDPE/CaCO3
composites. Neat LDPE processed with the same condition was used as reference
sample. Stress-strain curves obtained from tensile testing machine are illustrated in
Figures 4.7 to 4.9 at different filler contents.
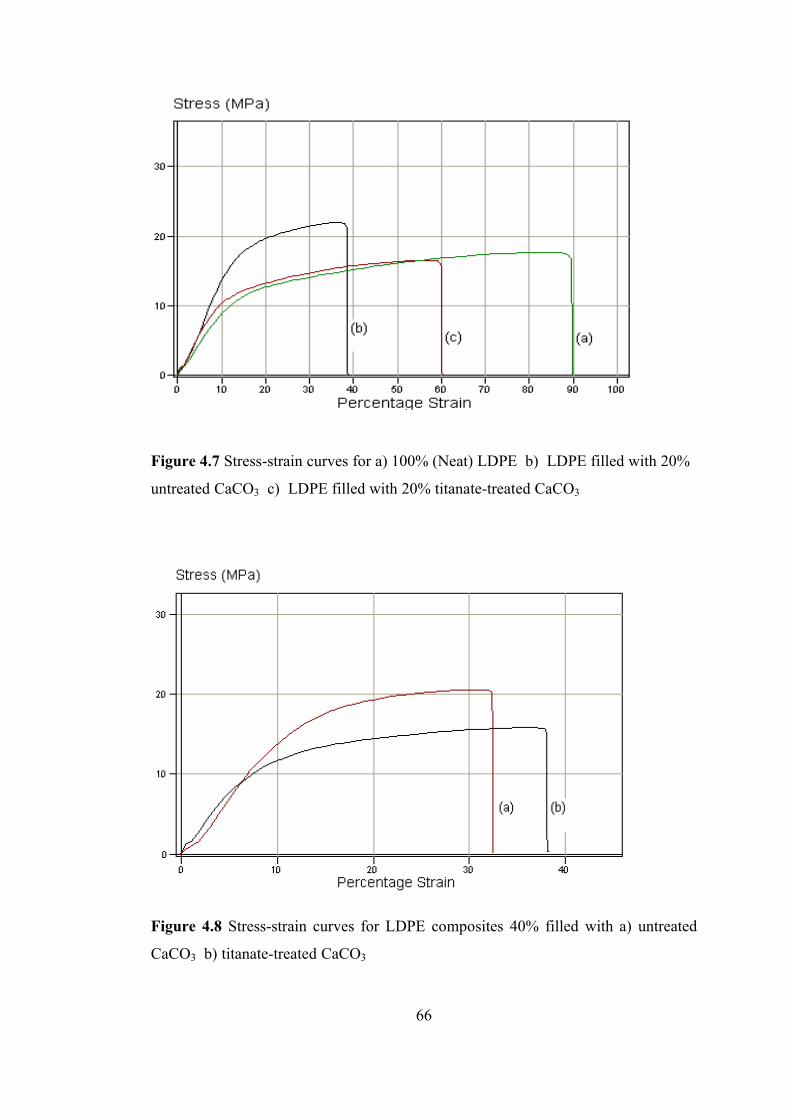
66
Figure 4.7 Stress-strain curves for a) 100% (Neat) LDPE b) LDPE filled with 20%
untreated CaCO3 c) LDPE filled with 20% titanate-treated CaCO3
Figure 4.8 Stress-strain curves for LDPE composites 40% filled with a) untreated
CaCO3 b) titanate-treated CaCO3

67
Figure 4.9 Stress-strain curves for LDPE composites 60% filled with a) untreated
CaCO3 b) titanate-treated CaCO3
As it is seen from stress-strain curves, no necking is observed during tensile tests for
all LDPE/CaCO3 composites. Firstly a specimen was passing elastic region with a
certain tensile modulus is observed, then it reached to a maximum stress and fracture
of specimen occurred. Contrary to PP/CaCO3 composites, decreasing of stress after
maximum point was not seen and so, any drawing stress leading to elongation of
specimen was not accomplished. The maximum elongation was achieved in neat
LDPE and it can be considered as the most ductile material among all LDPE/CaCO3
composites. Addition of untreated CaCO3 to the virgin LDPE makes it less ductile.
Also, the decrease in strain at break due to increasing of filler content is clearly
observed in all Figures from 4.7 to 4.9. When titanate-treated CaCO3 is added to
LDPE, enhancement in strain at break and ductility can be observed at two filler
ratios of 20% and 40%. On the other hand LDPE composites with titanate reached to
lower maximum stress compared to the ones without titanate. This effect is observed
at all filler levels.

68
Average values of tensile properties obtained from stress-strain curves for each
composition were evaluated and the tensile results are shown in Figures 4.10 to 4.12.
0
50
100
150
200
250
300
350
0 20 40 60
Filler Content (wt%)
Ela
stic
Mod
ulus
(MP
a)
LDPE with untreated filler LDPE with titanate treated filler
Figure 4.10 Elastic modulus values of LDPE/CaCO3 composites
The Figure 4.10 shows that the elastic modulus increase gradually with increasing
untreated filler content as observed in most particulate filled polymers. Titanate
molecules have varying effects on Young’s modulus values according to different
filler content. At 20% filler content, it is seen that elastic modulus of material
decreased from 162 MPa to 140 MPa approximately with the presence of titanate
coupling agents. At the other filler ratio of 40% and 60%, titanate molecules raised
the elastic modulus of composites considerably. The results of young modulus values
can be related to strain results, because high modulus causes the composite to be
more brittle and it can restrict the elongation of the material.

69
0
10
20
30
40
50
60
70
80
90
100
0 20 40 60
Filler Content (wt%)
Per
cent
age
Stra
in a
t Bre
ak
LDPE with untreated filler LDPE with titanate treated filler
Figure 4.11 Percentage strain at break values of LDPE/CaCO3 composites
According to Figure 4.11 showing percentage strain results, pure LDPE has the
highest strain with the value of 89%. Composites 20% and 40% filled with untreated
CaCO3 have values of about36% and 34%, respectively. This means that percentage
strain decreased by about 60% with addition of 20% untreated filler. As filler content
goes to 60%, percentage strain decreased quitely to 19%. Titanate treated samples
show almost 66% increase in 20% filled LDPE; they raised the percentage strain of
this composite from 36% to 60%. However, this plasticizing effect of titanate
coupling agent is not observed in 40% and 60% filled LDPE composites. At 40%
filler lever, very slight increase from 34% to 38% can be achieved and at 60% level,
a remarkable decrease from 19% to 9% can be seen.

70
0
5
10
15
20
25
0 20 40 60
Filler Content (wt%)
Tens
ile S
treng
th (M
Pa)
LDPE with untreated filler LDPE with titanate treated filler
Figure 4.12 Tensile strength values of LDPE/CaCO3 composites
In Figure 4.12 results of tensile strength show an oscillation between the values of
15.8 MPa to 22.3 MPa among all LDPE/CaCO3 composites. Neat LDPE has a tensile
strength of 17.8 MPa and with the addition of untreated CaCO3 these values became
22.3 MPa, 18.1 MPa and 19.0 MPa with respect to filler contents of 20, 40 and 60%.
It is seen that incorporation of titanate coupling agent to all compositions resulted in
slight decrease in tensile strengths.
Influences of titanate coupling agent on tensile strength is relatively negative as seen
in Figure 4.12. LDPE was moderately affected by untreated filler since fillers
provide the polymer to gain mechanical resistance against applied load. Especially
with 20% filler, composite reached maximum tensile strength value of 22.3 MPa.
When titanate-treated filler was employed, the resistive compact chain became less
compact and weaker compared to composites with untreated filler. The reason is that
titanate molecules improves the dispersion of fillers so, agglomerations causing
compactness can be eliminated. Therefore, tensile strengths of composites with

71
titanate are lower than those of the untreated ones. A gradual decrease in tensile
strength with incorporation of titanate coupling agents is observed as filler content
goes higher. This gradually decrease result also supports dispersion effect of titanates
on LDPE including composites. As filler content increases, dispersion effect of
titanates becomes less efficient due to too high compactness that titanate molecules
do not exhibit their function. Consequently, higher filler content tend to reduce
activity of titanate coupling agents.
It is possible to say that the mechanical improvement was achieved considerably
with appropriate filler content of up to 40% for LDPE/CaCO3 composites. It is seen
that titanate molecules did not work effectively for higher level filler composition.
4.1.1.3 Tensile Properties for PP/LDPE Blends and Composites
PP/LDPE blends were prepared in twin-screw extruder with ratios of 75/25, 50/50
and 25/75 from virgin polymers. The blends were produced with addition of Caps
L12 which is in pellet form. The composites were formed by addition of titanate
(Capow L12) treated and untreated CaCO3 separately at a constant filler ratio of
20%. The PP/LDPE blends and composites were injection molded and dog-bone
shaped samples were tested in tensile machine. Their test results were examined to
investigate effects of titanate coupling agent on PP/LDPE blends and composites.
Stress-strain curves were obtained and illustrated in Figures 4.13, 4.17 and 4.21
according to blend compositions of 75/25, 50/50 and 25/75, respectively.

72
Figure 4.13 Stress-strain curves of PP/LDPE (75/25) blends and composites:
a) PP75/0 - Neat
b) PP75/0-Caps L12 - with 0.5% Caps L12
c) PP75/20 - with 20% untreated CaCO3
d) PP75/20-Capow L12 - with 20% Capow L12-treated CaCO3
Elastic (Young’s) modulus, percentage strain at break and tensile strength values of
PP/LDPE(75/25) blends and composites are shown as a function of filler content in
Figures 4.14, 4.15 and 4.16 respectively.

73
PP/LDPE (75/25)
0
100
200
300
400
500
600
700
0 20
Filler Content (wt%)
Elas
tic M
odul
us (M
Pa)
PP/LDPE/CaCO3 without titanate PP/LDPE/CaCO3 with titanate
Figure 4.14 Elastic Modulus values of PP/LDPE (75/25) blends and composites
Due to the polymer blend ratio, the continuous polymer phase should be
polypropylene and the dispersed phase is low-density polyethylene. There is no
significant change between the Young’s modulus value of neat PP75/0 and that of
titanate added PP75/0-Caps L12 at levels of 460 MPa. With addition of 20%
untreated CaCO3 as filler, this value increased to 596 MPa since inorganic filler
made the polymer more brittle as seen in Figure 4.4. Capow L12 treated filler at the
same filler level of 20% lowered this elastic modulus value to 515 MPa due to
plasticizer effect of titanate coupling agent by better dispersing the inorganic filler.
However, this effect can not be seen in unfilled polymer blend since there are no
inorganic particles causing brittleness and naturally titanate molecules did not affect
any dispersion. The other reason of the difference might be that compatibility of
these immiscible polymers was accomplished by Capow L12 type but was not done
effectively by Caps L12 type due to difference in their physical forms. As Caps L12
is present in pellet form with LDPE, its activity can be hindered. On the other hand,
Capow L12 is in powder form and was added to polymer as coated on CaCO3 with a

74
treatment operation. Thus, activity of Capow L12 should be higher than Caps L12
leading to a modification the interfaces in polymer blend more effectively than Caps
L12 does. This result of activity difference is observed very remarkably in
percentage strain at break values between samples with and without titanate coupling
agents.
PP/LDPE (75/25)
0
100
200
300
400
500
600
0 20
Filler Content (wt%)
Perc
enta
ge S
trai
n (%
)
PP/LDPE/CaCO3 without titanate PP/LDPE/CaCO3 with titanate
Figure 4.15 Percentage strain at break values of PP/LDPE (75/25) blends and
composites
According to Figure 4.15 it is seen that percentage strain value of Caps L12 added
polymer blend is slightly higher than neat blend. Caps L12 raised this value from
247% to 283 %. It can be deduced that pelletized titanate molecules modify the
compatibility of intermolecular chains of polymers up to a certain degree but not
very much due insufficient activity of Caps L12. Percentage strain value of PP75/20
composite considerably decreased to about 75% compared to neat one. When the
polymer components in a blend are partially miscible and untreated inorganic filler
was added into them, phase separation can form large areas with weak interfacial

75
bonding among ternary system. This formation make the polymer system less ductile
and cause that dramatic decrease in percentage strain at break Titanate coupling
agents are used in order to prevent this formation of phase separation and strengthen
interfacial adhesion. As a result Capow L12 treated CaCO3 gave rise to very high
strain about 509% degrees. This result shows that compatibility of two distinct
polymers was achieved with incorporation of Capow L12 treated CaCO3. Such
increase leads to consider that these polymers behave like nearly single-phase
polymer system against tension load. The coupling of the titanate to the organic
polymer matrix and inorganic filler provided a continuous phase for stress transfer
leading to compatibility of molecular chains of two different polymer types. Also
better dispersion of fillers attained by Capow L12 has influence on this result causing
elimination of air voids and agglomerations substantially. Otherwise, with presence
of them, sample could no longer sustain its elongational deformation under tensile
stress and fracture occurs easily. The strain values indicate that titanate coupling
agents may act as compatabilizers promoting phase miscibility of polymers in the
presence of acceptable filler amounts.
PP/LDPE (75/25)
0
5
10
15
20
25
30
0 20
Filler Content (wt%)
Tens
ile S
tren
gth
(MPa
)
PP/LDPE/CaCO3 without titanate PP/LDPE/CaCO3 with titanate
Figure 4.16 Tensile strength values of PP/LDPE (75/25) blends and composites

76
As seen in Figure 4.16 tensile strength values exhibit the same trends as elastic
modulus values. There are no important changes among all tensile strength values.
Neat PP75/0 has a value of 25 MPa and incorporation of Caps L12 to that polymer
blend nearly has no effect on tensile strength since its value is the same with neat
one’s averagely. When polymer blend was filled with 20% untreated and Capow L12
treated CaCO3, approximately values of 25 MPa and 23 MPa can be observed from
the figure respectively. A slight decrease is observed with incorporation of Capow
L12. According to plasticizer effect of coupling agent, titanate molecules might have
caused reduction of intermolecular forces between PP and LDPE molecular chains.
This reduction may lead the specimen to withstand lower tensile strength under
tensile stress. It is observed that titanate coupling agent could not reinforce the
tensile strength of this polymer blend.
Figure 4.17 Stress-strain curves of PP/LDPE (50/50) blends and composites:
a) PP50/0 - Neat
b) PP50/0-Caps L12 - with 0.5% Caps L12
c) PP50/20 - with 20% untreated CaCO3
d) PP50/20-Capow L12 - with 20% Capow L12-treated CaCO3
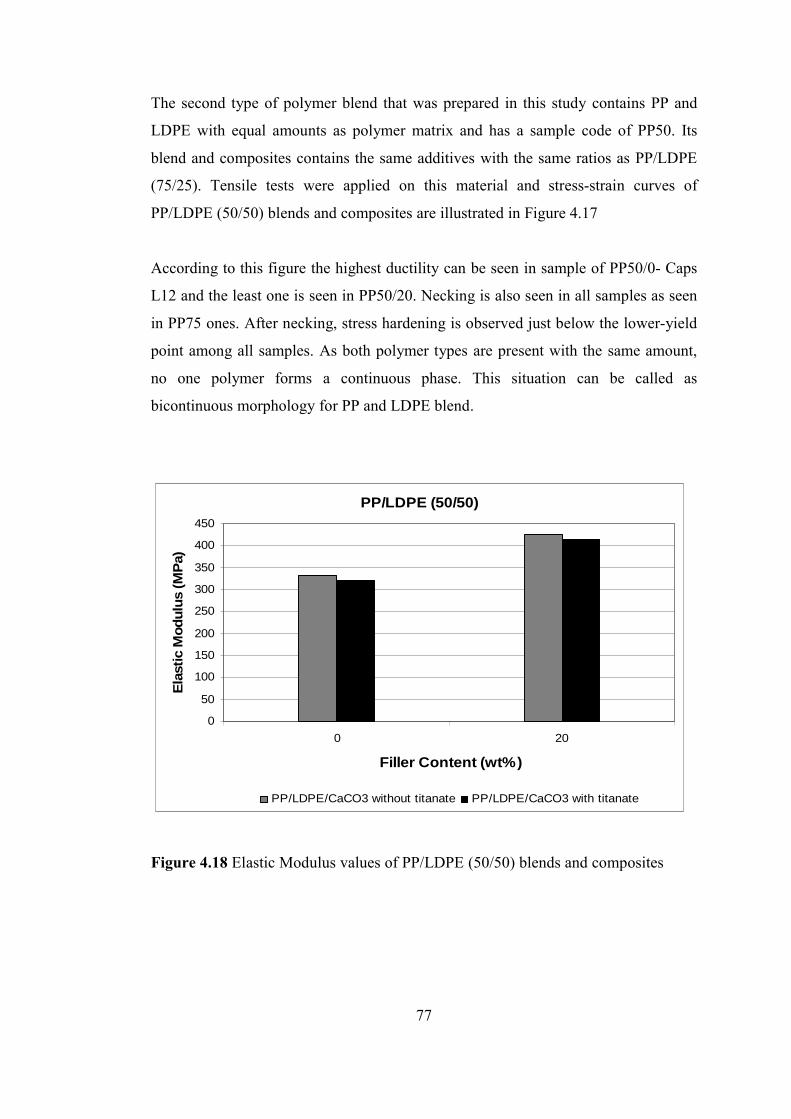
77
The second type of polymer blend that was prepared in this study contains PP and
LDPE with equal amounts as polymer matrix and has a sample code of PP50. Its
blend and composites contains the same additives with the same ratios as PP/LDPE
(75/25). Tensile tests were applied on this material and stress-strain curves of
PP/LDPE (50/50) blends and composites are illustrated in Figure 4.17
According to this figure the highest ductility can be seen in sample of PP50/0- Caps
L12 and the least one is seen in PP50/20. Necking is also seen in all samples as seen
in PP75 ones. After necking, stress hardening is observed just below the lower-yield
point among all samples. As both polymer types are present with the same amount,
no one polymer forms a continuous phase. This situation can be called as
bicontinuous morphology for PP and LDPE blend.
PP/LDPE (50/50)
0
50
100
150
200
250
300
350
400
450
0 20
Filler Content (wt%)
Elas
tic M
odul
us (M
Pa)
PP/LDPE/CaCO3 without titanate PP/LDPE/CaCO3 with titanate
Figure 4.18 Elastic Modulus values of PP/LDPE (50/50) blends and composites
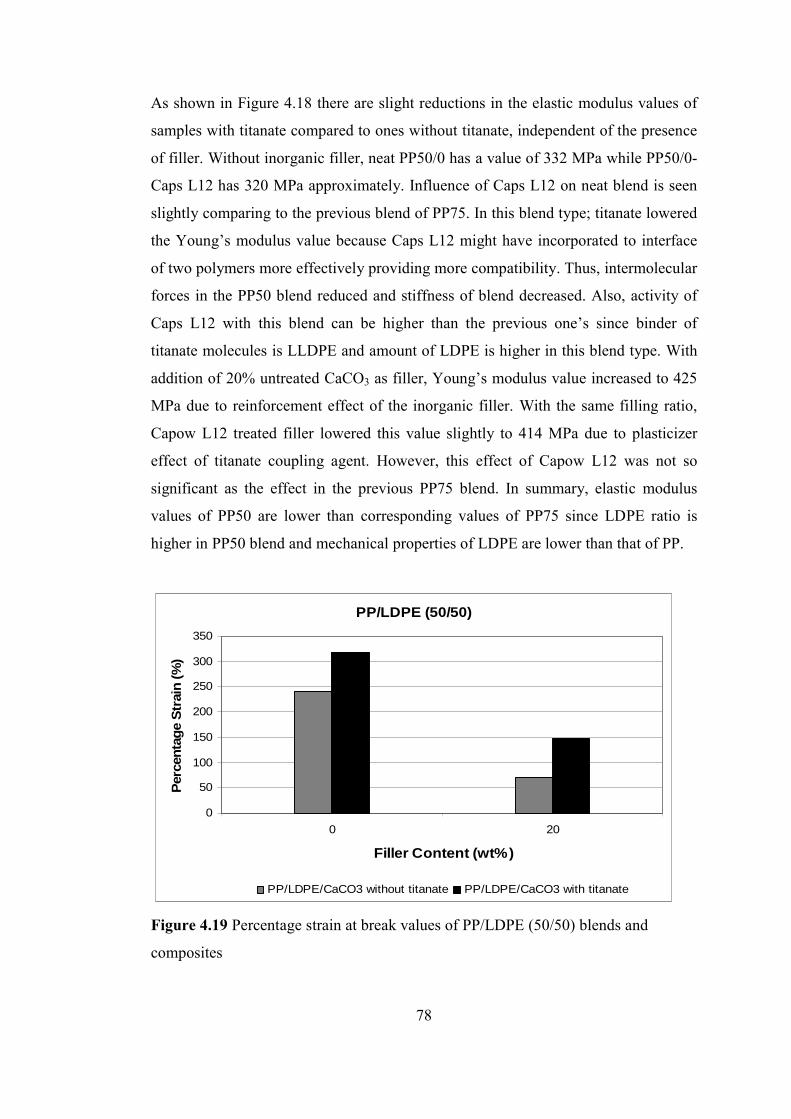
78
As shown in Figure 4.18 there are slight reductions in the elastic modulus values of
samples with titanate compared to ones without titanate, independent of the presence
of filler. Without inorganic filler, neat PP50/0 has a value of 332 MPa while PP50/0-
Caps L12 has 320 MPa approximately. Influence of Caps L12 on neat blend is seen
slightly comparing to the previous blend of PP75. In this blend type; titanate lowered
the Young’s modulus value because Caps L12 might have incorporated to interface
of two polymers more effectively providing more compatibility. Thus, intermolecular
forces in the PP50 blend reduced and stiffness of blend decreased. Also, activity of
Caps L12 with this blend can be higher than the previous one’s since binder of
titanate molecules is LLDPE and amount of LDPE is higher in this blend type. With
addition of 20% untreated CaCO3 as filler, Young’s modulus value increased to 425
MPa due to reinforcement effect of the inorganic filler. With the same filling ratio,
Capow L12 treated filler lowered this value slightly to 414 MPa due to plasticizer
effect of titanate coupling agent. However, this effect of Capow L12 was not so
significant as the effect in the previous PP75 blend. In summary, elastic modulus
values of PP50 are lower than corresponding values of PP75 since LDPE ratio is
higher in PP50 blend and mechanical properties of LDPE are lower than that of PP.
PP/LDPE (50/50)
0
50
100
150
200
250
300
350
0 20
Filler Content (wt%)
Perc
enta
ge S
trai
n (%
)
PP/LDPE/CaCO3 without titanate PP/LDPE/CaCO3 with titanate
Figure 4.19 Percentage strain at break values of PP/LDPE (50/50) blends and
composites

79
In percentage strain at break values shown in Figure 4.19, for PP50 blends and
composites positive influences of titanate coupling agents can be observed similar to
PP75. Neat PP50/0 has a percentage strain value of 240% which is very close to the
value of neat PP75/0. When Caps L12 was added to neat blend, that value rose up to
about 320% . Here the rate of increase is nearly 33% whereas it is about 14% in
PP75 samples. It can be claimed that Caps L12 is more effective when used in
bicontinuous PP/LDPE blend rather than PP/LDPE (75/25) blend where the
continuous phase is PP. In both types of blends titanate molecules raised elongation
of materials because of plasticizer effect. However, elongation of PP50/0- Caps L12
blend is more than the PP75/0-Caps L12. As a result compatibility of two polymers
improved by Caps L12 in PP50 blend better since Caps L12 with LLDPE binder
formed a better interaction with LDPE phase which is present in this blend with
higher ratio than PP75 blend.
As expected, addition of 20% untreated CaCO3 decreased the percentage strain at
break value from 240% to 71% in PP50 blend which is also close to PP75 result.
With incorporation of 20% Capow L12-treated CaCO3 increased this value to 148%.
This result can be explained by compatibility and filler dispersion effects of titanate
coupling agents mentioned in previous blend part. However, these effects are not
observed in PP50 blend as significant as seen in PP75 blend where the increasing
rate in percentage strain is 580%. The reason might be that compatibility of
PP/LDPE/CaCO3 in PP50 ternary system can not be associated by Capow L12
effectively due to presence of higher ratio of LDPE comparing to amount in PP75.
Since Capow L12-treated CaCO3 is more effective on PP matrix than LDPE matrix,
high ratio of LDPE in PP50 inhibited the compatibility effect of Capow L12 on this
blend. In spite of this inhibition, a remarkable increase in percentage strain at break
value can be seen in Figure 4.19.

80
PP/LDPE (50/50)
0
5
10
15
20
25
0 20
Filler Content (wt%)
Tens
ile S
tren
gth
(MPa
)
PP/LDPE/CaCO3 without titanate PP/LDPE/CaCO3 with titanate
Figure 4.20 Tensile strength values of PP/LDPE (50/50) blends and composites
As shown in Figure 4.20 tensile strength values of PP50 do not exhibit significant
variations like values of PP75 but they are lower than previous blend’s results since
ratio of LDPE increased. Neat PP50/0 has a value of 21.0 MPa and incorporation of
Caps L12 to that polymer blend has slightly positive effect on tensile strength as its
value is 22.5 MPa. This little increase can be explained with good interaction
between titanate molecules and LDPE which is not observed in PP75 blend. Caps
L12 with LLDPE binder cause little entanglements among branches of LDPE
molecules. These entanglements act as load-bearing elements and provide material to
strengthen and withstand to maximum stress at higher levels of load.
When the polymer blend is prepared with 20% untreated and Capow L12 treated
CaCO3, approximately values of 22.8 MPa and 20.8 MPa in tensile strength is
observed, respectively. At this filler level, moderately positive effect of untreated
CaCO3 is seen since it is a reinforcing inorganic additive. A decrease occurred with
incorporation of Capow L12, the same trend is observed in PP75 blend. The reason

81
of the decrease should be the same with that of previous blend. Capow L12 could not
form strong interfacial adhesion among ternary polymer system and weak adhesion
caused lower tensile strength compared to the untreated filler. It is observed that
titanate coupling agent exhibits different effects according to physical form of
titanate and polymer matrix type. Caps L12 has positive effect on tensile strength of
PP50 polymer blend while Capow L12 does not have such effect on PP50/CaCO3
composite.
The third type of polymer blend that was examined in this study contains 25% PP
and 75% LDPE with weight fraction and has a sample code PP25. The other filler
and titanate types and amount that were added to PP25 are the same with those of
previous blends. After tensile tests, stress-strain curves of PP/LDPE (25/75) blends
and composites were obtained and illustrated in Figure 4.21.
Figure 4.21 Stress-strain curves of PP/LDPE (25/75) blends and composites:
a) PP25/0 - Neat
b) PP25/0-Caps L12 - with 0.5% Caps L12
c) PP25/20 - with 20% untreated CaCO3
d) PP25/20-Capow L12 - with 20%Capow L12-treated CaCO3

82
PP25 blend consisting of two phases: continuous phase is LDPE and dispersed phase
is PP. As shown in Figure 4.21, PP25 blends and composites have lower mechanical
properties comparing to PP75 and PP50 blends since LDPE is the dominant phase
and its mechanical properties are lower than PP. Necking formation is not seen in
any sample and at maximum stress fracture occurred. Consequently, PP25 blends and
composites do not exhibit an elongation trend after maximum stress is achieved.
Besides, the ductility of these samples are at the lowest level comparing to other
PP/LDPE blends and composites.
Tensile properties of PP25 blends and composites are given in Figures 4.22, 4.23 and
4.24 according to elastic modulus, percentage strain at break and tensile strength
values, respectively.
PP/LDPE (25/75)
0
50
100
150
200
250
300
0 20
Filler Content (wt%)
Ela
stic
Mod
ulus
(MP
a)
PP/LDPE/CaCO3 without titanate PP/LDPE/CaCO3 with titanate
Figure 4.22 Elastic Modulus values of PP/LDPE (25/75) blends and composites

83
PP/LDPE (25/75)
0
20
40
60
80
100
120
140
160
0 20
Filler Content (wt%)
Per
cent
age
Stra
in (%
)
PP/LDPE/CaCO3 without titanate PP/LDPE/CaCO3 with titanate
Figure 4.23 Percentage strain at break values of PP/LDPE (25/75) blends and
Composites
PP/LDPE (25/75)
0
5
10
15
20
25
0 20
Filler Content (wt%)
Tens
ile S
treng
th (M
Pa)
PP/LDPE/CaCO3 without titanate PP/LDPE/CaCO3 with titanate
Figure 4.24 Tensile strength values of PP/LDPE (25/75) blends and composites

84
As shown in Figure 4.22 elastic modulus values of PP25 are the lowest values
comparing to previous PP/LDPE blends since content of LDPE in blend reached the
highest amount among all blend types. For instance neat PP25 has a Young’s
modulus value of 202 MPa showing that increasing LDPE amount reduced the
stiffness of PP/LDPE blend. When Caps L12 was added to this blend making ternary
polymer system, Young’s modulus value slightly decreased to 188 MPa due to
reduction of intermolecular forces by titanate coupling agent as seen before in other
blends. However, as shown in Figure 4.23 Caps L12 also caused a decrease in
percentage strain at break value from 150% to 131% which was not observed in
other blends. Its reason might be that Caps L12 was not able to affect the interface of
two polymers sufficiently for improvement of compatibility of them because
continuous phase is LDPE. Much amount of slightly cross-linked LDPE which does
not let necking formation during elongation should be the main reason for inhibition
of Caps L12 functionality. As a result of insufficiency of Caps L12, good interfacial
adhesion could not be achieved and tensile strength was negatively affected too.
According to Figure 4.24, tensile strength values decreased from 22.1 MPa to 20.7
MPa with incorporation of Caps L12 to neat blend PP25.
There is no remarkable change in tensile properties of PP25 composites containing
20% untreated and Capow L12-treated CaCO3. No influence of Capow L12 was
observed in PP25 blend where the continuous phase is LDPE. Only slight increase in
Young’s modulus value is observed, percentage strain at break values decreased and
tensile strength value remained the same with titanate coupling agent. According to
the results effective interfacial adhesion can not be achieved by Capow L12 with
PP/LDPE/CaCO3 composites.
It can be concluded that Caps L12 does not have a positive effect on providing a
good adhesion between the continuous LDPE phase and dispersed phase PP in neat
blends. Since Capow L12 also did not give an improvement in mechanical values,
one can say that both coupling agent types do not work effectively with LDPE. When
PP is the continuous phase in PP75/0 and PP75/20 blends and composite, an
improvement in percentage strain values were observed.

85
4.1.2 Impact Properties
Impact tests with charpy method were applied to polypropylene and low-density
polyethylene blends and composites prepared for this study. To investigate effect of
titanate coupling agent on impact properties, impact strength values were obtained.
Five bar shaped V-notched specimens were used for each composition and averages
of impact strength values were evaluated.
4.1.2.1 Impact Properties for PP/CaCO3 Composites
Impact strength values of PP/CaCO3 composites are given in Figure 4.25.
0
0,5
1
1,5
2
2,5
3
0 20 40 60
Filler Content (wt%)
Impa
ct S
tren
gth
(kJ/
m2)
PP with untreated filler PP with titanate treated filler
Figure 4.25 Impact strength values of PP/CaCO3 composites
Processed neat PP has an impact strength value of about 2 kj/m2 and with addition of
inorganic filler this value decreases gradually up to 0.7 kj/m2 level at 60% filler level.

86
With incorporation of titanate coupling agent of Capow L12 treated CaCO3,
significant improvement in impact properties are observed compared to samples with
untreated filler. This improvement is strongly related with modification of interfacial
adhesion and interaction between polymer and filler by titanate molecules. Better
adhesion and interaction give polypropylene composites a degree of toughness
against impact load. One should notice that PP has inherently a low impact strength
value compared to LDPE as expected.
4.1.2.2 Impact Properties for LDPE/CaCO3 Composites
Figure 4.26 shows impact strength values with respect to filler content for
LDPE/CaCO3 composites. Impact strength values of LDPE composites are higher
than ones of PP composites since LDPE is more ductile polymer than PP. Especially
processed neat LDPE has an impact strength of 207 kj/m2 and they were not broken
during the test.
0
50
100
150
200
250
0 20 40 60
Filler Content (wt%)
Impa
ct S
treng
th (k
J/m
2)
LDPE with untreated filler LDPE with titanate treated filler
Figure 4.26 Impact strength values of LDPE/CaCO3 composites

87
The impact strength was lowered quitely to 131.5 kj/m2 by addition of 20% untreated
filler and specimens were broken under impact load. Inorganic particles give rise to
brittle interfaces due to incompatibility of filler and polymer matrix. When 20%
titanate-treated CaCO3 was employed, interfacial adhesion was accomplished more
than in untreated filled ones and impact strength was raised slightly to 158.5 kj/m2.
Increasing amount of inorganic filler leads to decrease of impact strength of
LDPE/CaCO3 due to agglomerations among filler particles. At 40% and 60% filler
content levels, the values were observed 94.2 kj/m2 and 70.5 kj/m2, respectively.
Contrary to samples with 20% titanate-treated filler, titanate coupling agents did not
give an improvement in impact strength with high filler contents. The impact results
are consistent with tensile results of LDPE/CaCO3 composites and probably due to
the same reasons, influence of titanate coupling agent on impact property becomes
insufficient for highly filled compositions.
4.1.2.3 Impact Properties for PP/LDPE Blends and Composites
Impact strength values of PP/LDPE blends are presented with respect to 3 blend
types in Figure 4.27. Each blend type includes 4 different samples according to
inorganic filler content and presence of titanate coupling agent. The definitions of
sample codes written in label of figure can be listed in order of columns like this:
1- Neat PP75* - no additive
2- PP75/0-Caps L12 - with 0.5% Caps L12
3- PP75/20 - with 20% untreated CaCO3
4- PP75/20-Capow L12 - with 20%Capow L12-treated CaCO3
* PP75 is the sample code of PP/LDPE (75/25) blend type for the sake of brevity.
As expected, impact strength values of these blends are in the range between values
of neat polymers of PP (2 kj/m2) and LDPE (207 kj/m2). Also it is seen that impact
strength values exhibit an increasing trend with increasing ratio of LDPE.

88
0
20
40
60
80
100
120
140
160
180
PP/LDPE (75/25) PP/LDPE (50/50) PP/LDPE (25/75)
Blend Type (wt/wt)
Impa
ct S
teng
th (k
J/m
2)
Neat Blend Blend/0-CapsL12 Blend/20 Blend/20-CapowL12
Figure 4.27 Impact strength values of PP/LDPE blends and composites
The results of impact strength values for PP75 and PP50 blend types exhibit similar
variations as seen in Figure 4.27. In both blends, the pellet form of titanate coupling
agent Caps L12 has positive influence on ductility of materials compared to neat
blends since it raised the impact strength of both blends. This effect of Caps L12 can
be explained by improvement of compatibility between PP and LDPE which are
known as immiscible polymers. This compatibility provides these blends to have
more ductile fracture in response to impact load. With addition of 20% untreated
CaCO3, a significant decrease is observed for both blend types due to effect of
inorganic fillers on brittle fracture. Capow L12 improved this brittle fracture by
enhancing interfacial adhesion between filler and polymer matrix leading to higher
ductility for these composites.
The highest impact strength of 154 kj/m2 was obtained with neat PP25 blend among
all blend compositions. The reason of this high toughness is probably related to the
relative amount of LDPE which is highest. Contrary to PP75 and PP50 blend types,
89
incorporation of Caps L12 on unfilled PP25 blend did not improve the impact
strength. When PP25 blend was filled with 20% untreated CaCO3, impact resistance
decreased even more and composite became more brittle as expected. Addition of
20% Capow L12 treated filler reduced the impact strength more than untreated one.
Thus, Capow L12 caused the same negative effect as Caps L12 in PP25 blend and
composites. When considered together with tensile results of PP25 blend, it can be
claimed that functionality of both titanate coupling agents on impact properties
probably inhibited by physical cross-links of LDPE due to its branched structure.
4.2 Morphological Analysis with Scanning Electron Microscopy (SEM)
Morphological analysis was performed on surfaces of tensile fractured samples by
using SEM technique. The aim of this analysis is to examine the effect of titanate
coupling agents on morphology of PP and LDPE blends and composites which were
prepared in Brabender and twin-screw extruder. In SEM micrographs of these
materials, calcium carbonate particles in micron dimension and their dispersion can
clearly be seen. Also in most of samples including titanate coupling agent, effect of
titanate molecules on filler dispersion and filler-polymer interaction can be observed.
Morphology analysis will be discussed in two sections according to material type;
the first is LDPE/CaCO3 composites produced in Brabender and the second is
PP/LDPE blends and composites prepared in twin-screw extruder.
4.2.1 Morphological Analysis of LDPE/CaCO3 Composite
SEM micrographs of LDPE/CaCO3 composites were illustrated in Figures 4.28, 4.29
and 4.30 with respect to filler contents of 20%, 40% and 60%, respectively. Each
composition was prepared by addition of untreated CaCO3 and Capow L12 treated
CaCO3, separately and their micrographs are given in the same figure with two
different magnifications at x1000 and x10 000.
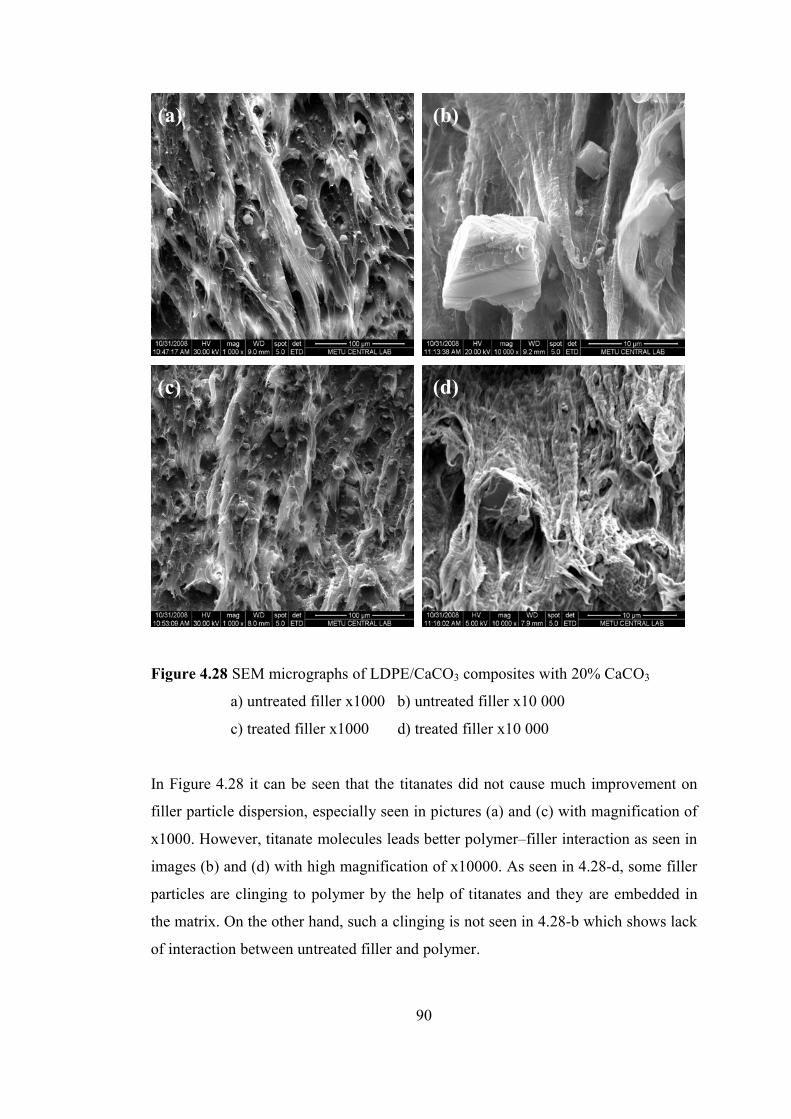
90
Figure 4.28 SEM micrographs of LDPE/CaCO3 composites with 20% CaCO3
a) untreated filler x1000 b) untreated filler x10 000
c) treated filler x1000 d) treated filler x10 000
In Figure 4.28 it can be seen that the titanates did not cause much improvement on
filler particle dispersion, especially seen in pictures (a) and (c) with magnification of
x1000. However, titanate molecules leads better polymer–filler interaction as seen in
images (b) and (d) with high magnification of x10000. As seen in 4.28-d, some filler
particles are clinging to polymer by the help of titanates and they are embedded in
the matrix. On the other hand, such a clinging is not seen in 4.28-b which shows lack
of interaction between untreated filler and polymer.
(b)
(c) (d)
(a)

91
Figure 4.29 SEM micrographs of LDPE/CaCO3 composites with 40% CaCO3
a) untreated filler x1000 b) untreated filler x10 000
c) treated filler x1000 d) treated filler x10 000
According to SEM images of (a) and (c) in Figure 4.29, there is no significant
difference in dispersion of filler particles between samples with untreated and
titanate-treated filler at 40% filler level. The pictures at x10000 magnifications show
that presence of titanate molecules cause adhesion of fillers to polymer matrix better
than untreated ones.
(a)
(b)
(c)
(d)

92
Figure 4.30 SEM micrographs of LDPE/CaCO3 composites with 60% CaCO3
a) untreated filler x1000 b) untreated filler x10 000
c) treated filler x1000 d) treated filler x10 000
In Figures 4.30-a and 4.30-c crack propagation lines appear discretely on the fracture
surfaces due to high inorganic filler content of 60%. There is no important distinction
in filler particle dispersion between two figures of (a) and (c). Besides that, it is
clearly observed in SEM images 4.30-b and 4.30-d that titanate coupling agents do
not enhance the filler-polymer interaction. The continuity of the polymer matrix is
broken by the presence of high filler amount and cracks can easily form.
(a) (b)
(d) (c)

93
4.2.2 Morphological Analysis of PP/LDPE Blends and Composites
SEM micrographs of PP/LDPE blends and composites were illustrated in Figures
4.31, 4.32 and 4.33. Three blend types were prepared in twin-screw extruder with
ratios of PP/LDPE: 75/25, 50/50 and 25/75. Their composites were filled with
untreated and Capow L12-treated CaCO3 at 20%.
In Figure 4.31 fractured surfaces of neat PP75 blend is seen in pictures (a) and (b),
blend containing 20% untreated CaCO3 is seen in pictures (c) and (d), blend with
20% titanate-treated CaCO3 is seen in pictures (e) and (f). In general view of neat
PP75 at x300 magnification (image a), distinction of PP and LDPE is seen at tensile
fractured surface where PP forms fibrillation during tensile deformation and LDPE
does not. So, some PP fibrils leave the initially continuous blend phase and phase
separation is seen in some areas where fracture occurs. Addition of 20% untreated
filler give rise to this phase separation in more areas since incompatibility of
PP/LDPE/CaCO3 composite is higher than neat PP/LDPE blend as seen in SEM
images (b) and (d) of Figure 4.31. When titanate-treated filler is used instead of
untreated one, dispersion of filler particles improved according to (c) and (e)
pictures. Also titanate coupling agent increase the compatibility between filler and
polymer matrix since treated filler particles hold on to polymer much more than
untreated ones as seen in (d) and (f) images. As a result, this improved compatibility
provides much better stress transfer for polymer matrix and it can be elongated to
higher strain levels compared to untreated filled PP75 blend.

94
Figure 4.31 SEM micrographs of PP/LDPE (75/25) blends and composites with
a) no filler x300 b) no filler x5000
c) 20% untreated CaCO3 x1000 d) 20% untreated CaCO3 x10 000
e) 20% treated CaCO3 x1000 f) 20% treated CaCO3 x10 000
(b) (a)
(c)
(f) (e)
(d)
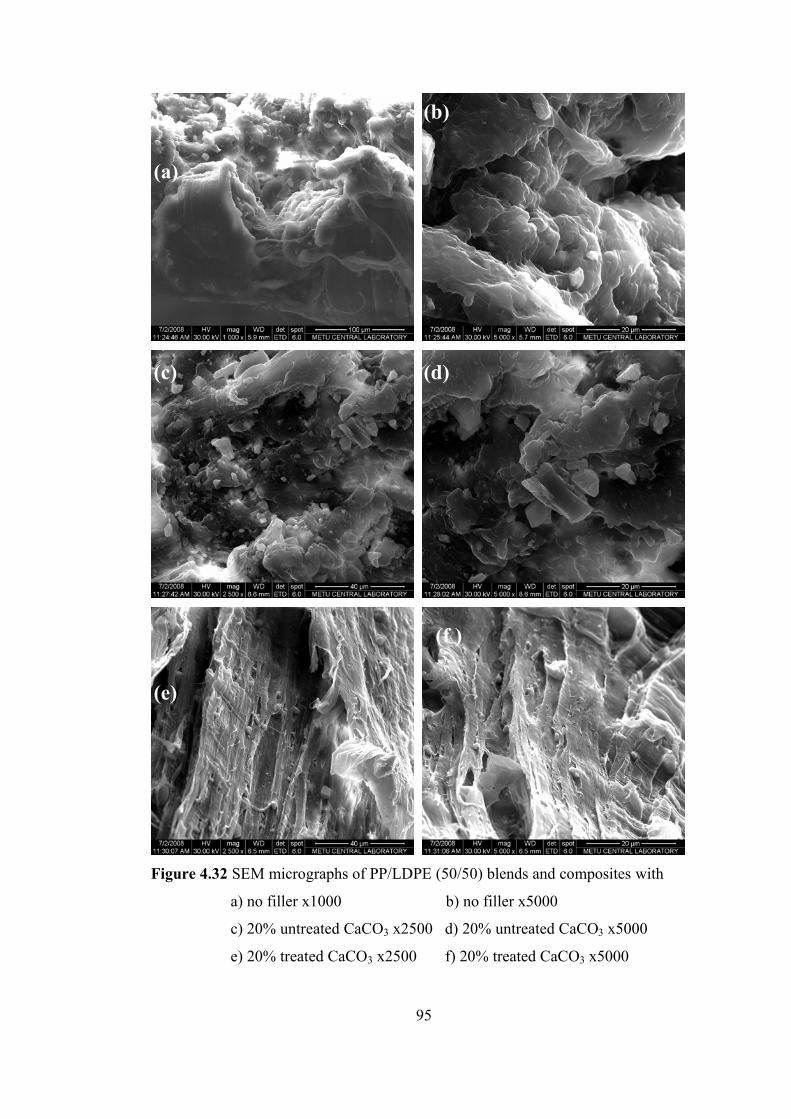
95
Figure 4.32 SEM micrographs of PP/LDPE (50/50) blends and composites with
a) no filler x1000 b) no filler x5000
c) 20% untreated CaCO3 x2500 d) 20% untreated CaCO3 x5000
e) 20% treated CaCO3 x2500 f) 20% treated CaCO3 x5000
(c)
(a)
(d)
(b)
(f )
(e)

96
In Figure 4.32 SEM micrographs of neat PP50 blend and its composites containing
20% untreated and titanate-treated CaCO3 are demonstrated. In neat PP50’s SEM
images of (a) and (b) a fine continuous polymer phase can not be seen and PP fibrils
can be observed distinctly among PP/LDPE polymer matrix at tensile fractured
surface. In Figures 4.32-c and 4.32-d showing fracture surfaces of blend containing
20% untreated filler, polymer phase seems discontinuous and there are remarkable
spaces among polymer matrix. Incorporation of titanate coupling agents makes the
polymer more continuous although some detachments between PP and LDPE exist
on the surface as seen in Figure 4.32-e and 4.32-f. Comparison of SEM images of (d)
and (f) show that improved adhesion of filler particles with polymer blend is
provided by titanate molecules. Figure 4.32-f shows that filler particles are drawn
with the stretching polymer molecules indicating strong interaction between filler
and polymer.
Figure 4.33 illustrates SEM micrographs of PP25 blend and composites at two
different magnifications of x1000 and x5000. In images (a) and (b) it can be seen
easily continuous phase LDPE is dominant with its semi-crystalline surface. These
surfaces become much rougher with addition of 20% CaCO3 indicating that poor
interaction between filler and polymer matrix exists as seen in figures (c) and (d).
Same trend is observed in Figures 4.33-e and 4.33-f which shows surfaces with
titanate-treated filler do not enhance the interaction. In addition, there are no
remarkable difference between figures (c) and (e) in terms of filler dispersion.

97
Figure 4.33 SEM micrographs of PP/LDPE (25/75) blends and composites with
a) no filler x1000 b) no filler x5000
c) 20% untreated CaCO3 x1000 d) 20% untreated CaCO3 x5000
e) 20% treated CaCO3 x1000 f) 20% treated CaCO3 x5000
(d)
(a) (b)
(c)
(e) (f )

98
CHAPTER 5
CONCLUSIONS
PP/CaCO3 and LDPE/CaCO3 composites were prepared in Brabender by addition of
untreated and Capow L12 treated filler with filler content of 20, 40 and 60%. In twin-
screw extruder, PP/LDPE blends were produced at ratios of 75/25, 50/50 and 25/75
with and without 0.5% Caps L12 as titanate coupling agent. PP/LDPE/CaCO3
composites were produced with addition of 20% untreated and Capow L12 treated
filler. Effects of titanate coupling agents on mechanical and morphological properties
were investigated.
Tensile test results for PP/CaCO3 composites show that titanate coupling agents have
positive effects on percentage strain at break and Young’s modulus values.
Percentage strain values decreased with increasing untreated CaCO3 but titanate
molecules improved those percentage strain values up to 2 and 3 times higher
comparing to untreated ones at 20% and 40% filler level, respectively. Also titanate
coupling agents improved impact strength of PP composites which showed that
polymer-filler interaction was enhanced. However, tensile strength values of
PP/CaCO3 composites were not affected by titanate molecules. It is concluded that
Capow L12 has remarkable plasticizing effect on PP/CaCO3 composites.
Mechanical tests on LDPE/CaCO3 composites demonstrated that Capow L12 has
enhanced strain at break and impact strength values up to 20% filler content.
However the tensile strength values were adversely affected by the inclusion of
titanates. Modification of polymer-filler adhesion was observed in SEM
micrographs for the composite containing 20% filler. Thus it is concluded that
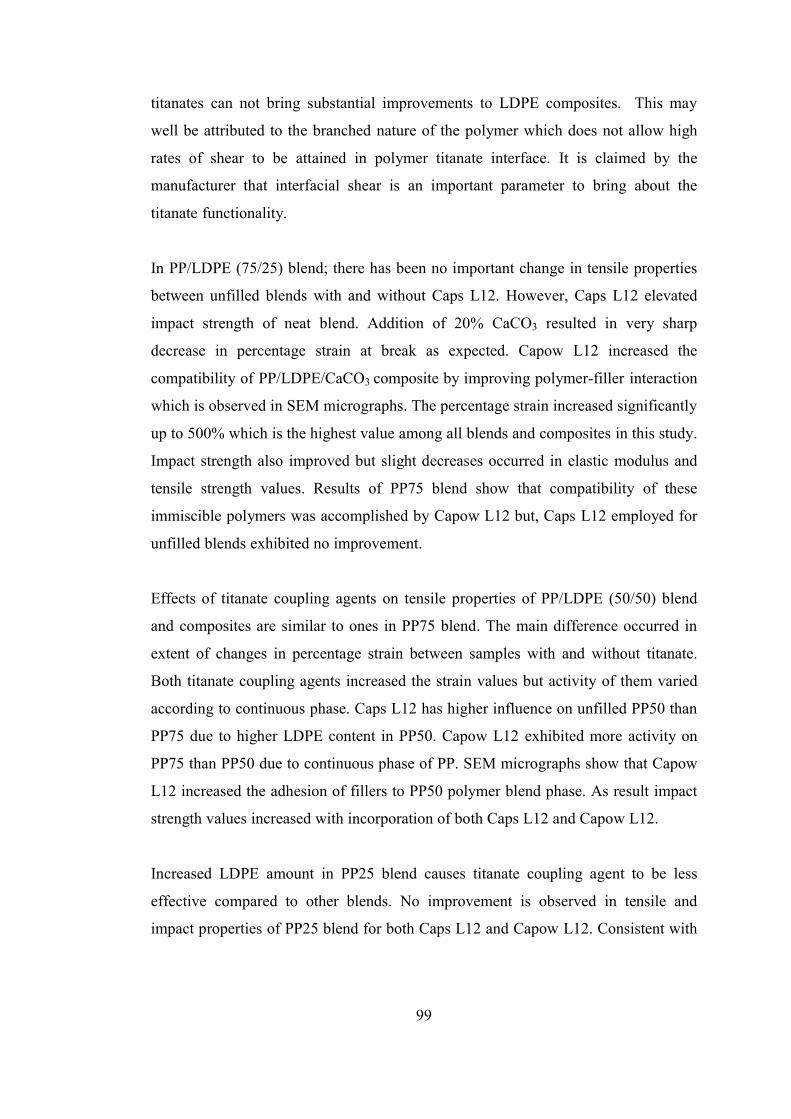
99
titanates can not bring substantial improvements to LDPE composites. This may
well be attributed to the branched nature of the polymer which does not allow high
rates of shear to be attained in polymer titanate interface. It is claimed by the
manufacturer that interfacial shear is an important parameter to bring about the
titanate functionality.
In PP/LDPE (75/25) blend; there has been no important change in tensile properties
between unfilled blends with and without Caps L12. However, Caps L12 elevated
impact strength of neat blend. Addition of 20% CaCO3 resulted in very sharp
decrease in percentage strain at break as expected. Capow L12 increased the
compatibility of PP/LDPE/CaCO3 composite by improving polymer-filler interaction
which is observed in SEM micrographs. The percentage strain increased significantly
up to 500% which is the highest value among all blends and composites in this study.
Impact strength also improved but slight decreases occurred in elastic modulus and
tensile strength values. Results of PP75 blend show that compatibility of these
immiscible polymers was accomplished by Capow L12 but, Caps L12 employed for
unfilled blends exhibited no improvement.
Effects of titanate coupling agents on tensile properties of PP/LDPE (50/50) blend
and composites are similar to ones in PP75 blend. The main difference occurred in
extent of changes in percentage strain between samples with and without titanate.
Both titanate coupling agents increased the strain values but activity of them varied
according to continuous phase. Caps L12 has higher influence on unfilled PP50 than
PP75 due to higher LDPE content in PP50. Capow L12 exhibited more activity on
PP75 than PP50 due to continuous phase of PP. SEM micrographs show that Capow
L12 increased the adhesion of fillers to PP50 polymer blend phase. As result impact
strength values increased with incorporation of both Caps L12 and Capow L12.
Increased LDPE amount in PP25 blend causes titanate coupling agent to be less
effective compared to other blends. No improvement is observed in tensile and
impact properties of PP25 blend for both Caps L12 and Capow L12. Consistent with

100
these mechanical results, SEM results show that improved filler dispersion and
enhanced interfacial adhesion with titanates were not observed.
In conclusion, titanate coupling agents of Capow L12 exhibited its functions in
polypropylene matrix much more effectively than in low-density polyethylene
matrix. Caps L12 has limited effects on unfilled PP/LDPE blends since it is already
incorporated in LLDPE.

101
REFERENCES
1. Baker, A.M.M., Mead, J., “Thermoplastics, in Modern Plastics Handbook”,
McGraw-Hill, Inc., 2000.
2. Xanthos M., “ Functional Fillers for Plastics”, Wiley-Vch Verlag GmbH & Co.
KgaA, Weinheim, 2005.
3. Brydson, J.A., “Plastics Materials”, 6/e, Butterworth-Heinemann, Oxford, 1995.
4. Monte, S. J., “Ken-React Reference Manual—Titanate, Zirconate and Aluminate
Coupling Agents”, American Chemical Society: Washington, DC, 1995.
5. Daniel I. and Ishai O., “Engineering Mechanics of Composite Materials”, Oxford
University Press Inc., USA, 1994.
6. Akovali G., “Handbook of Composite Fabrication”, Rapra Technology Ltd.,
England, 2001.
7. “Concise Encyclopedia of Polymer Science and Engineering”, John Wiley and
Sons Inc., New York, 1990.
8. Mazumdar S.K., “Composites Manufacturing; Materials, Product, and Process
Engineering”, CRC Press, USA, 2002.
9. Keskkula, H., Paul, D.R., “Polymer Blends, in Kirk Othmer Encyclopedia of
Chemical Technology”, John Willey & Sons Inc., 1996.

102
10. Friedrich K., Evstatiev M., Fakirov S., Evstatiev O., Ishii M., Harrass M.,
“Microfibrillar reinforced composites from PET/PP blends: processing, morphology
and mechanical properties”, Composites Science and Technology, vol. 65, pgs. 107-
116, 2005.
11. Ting, S.P., Pearce, E.M., Kwei, T.K., J., “Polymer Science”, Polymer Letter
Editor, 18, 201, 1980.
12. Stein, R.S., Paul, D.R., (Ed.), Newman, S., (Ed.), “Polymer Blends”, Academic
Press Inc., New York, 1978.
13. Callaghan, T.A., Takakuwa, K., Paul, D.R., Padwa, A.R., Polymer 34, 3796,
1993.
14. “Kirk-Othmer Encyclopedia of Chemical Technology”, 4th Edition, vol.17, 702-
707, John Wiley and Sons, Inc., New York, 1993.
15. Rubin I. I.,“Handbook of Plastic Materials and Technology”, John Wiley and
Sons Inc., New York, 1990.
16. Seymour R. B., Carraher C. E., “Structure-Property Relationships in Polymers”,
Plenum Press, New York, 1984.
17. Kissel, W.J., Han, J.H., Meyer, J.A., “Polypropylene: Structures, Properties,
Manufacturing Processes and Applications, in Handbook of Polypropylene and
Polypropylene Composites”, Marcel Deker,Inc., 2003.
18. Odian, “Principles of Polymerization”, 2d ed., John Wiley and Sons, Inc., New
York, 1981.
19. Strong, A.B., “Plastics: Materials and Processing”, Prentice-Hall, NJ, 1996.

103
20. Billmeyer, F.W., Jr., “Textbook of Polymer Scienc”, John Wiley & Sons, Inc.,
New York, 1984.
21. A.W. Bosshard and H.P. Schlumpf, “Fillers and Reinforcements in Plastics
Additives 2/e”, R. Gachter and H. Muller, Eds., Hanser Publishers, New York, 1987.
22. Kattas, L., Gastrock, F., Plastic Additives, in “Modern Plastics Handbook”,
McGraw-Hill, Inc., 2000.
23. Monte, S.J., Titanate Coupling Agents, in “Functional Fillers for Plastics”,
Wiley-Vch Verlag GmbH & Co. KgaA, Weinheim, 2005.
24. Pocius, A.V., “Adhesion and Adhesives Technology”, Hanser Publishers, New
York, 1997.
25. Plueddemann, E. P., “Silane Coupling Agents”, Plenum Press, New York, 1982.
26. Barry, C. M. F., Orroth S. A., Processing of Thermoplastics, in “Modern Plastics
Handbook”, 4 th Edition, McGraw - Hill, Inc., 2002.
27. Rauwendaal, C., “Polymer Extrusion”, Hanser Publisher, Munich, 2001.
28. Rauwendaal, C., “Polymer Mixing: A Self-Study Guide’’, Hanser Publishers,
Munich, 1998.
29. Shah, Vishu, “Handbook of Plastic Testing Technology’’, Second Edition, A
Wiley- Interscience Publication, 1998.
30. Annual Book of ASTM Standards, “ASTM D 638 M-91a: Standard Test Method
for Tensile Properties of Plastics”, Philadelphia, 1993.

104
31. Kılınç M., “Processing and Characterization of Poly(ethylene terephthalate)
Based Composites”, M.S. Thesis, Department of Chemical Engineering, METU,
Ankara, 2004.
32. Callister, “W.D., Materials Science and Engineering: An Introduction”, John-
Wiley and Sons Inc., New York, 1997.
33. http://acept.la.asu.edu/PiN/rdg/elmicr/elmicrs.html, 2006
34. Waha C.A., Choong L.Y., Neon G.S., “Effects of titanate coupling agent on
rheological behaviour, dispersion characteristics and mechanical properties of talc
filled polypropylene”, European Polymer Journal 36, p. 789±801, 2000.


![Materials Chemistry and Physics · 2020. 3. 5. · ferent natural or synthetic piezoelectric ceramics (e.g. calcium titanate, barium titanate and lead zirconate titanate (PZT)) [2]](https://static.fdocuments.net/doc/165x107/60b88a1c38582264692512fa/materials-chemistry-and-physics-2020-3-5-ferent-natural-or-synthetic-piezoelectric.jpg)