
Effects of the Operating Nuclear Power Plant on Marine Ecology and
38
11 Effects of the Operating Nuclear Power Plant on Marine Ecology and Environment - A Case Study of Daya Bay in China You-Shao Wang 1,2 1 Key Laboratory of Tropical Marine Environmental Dynamics, South China Sea Institute of Oceanology, Chinese Academy of Sciences, 2 Marine Biology Research Station at Daya Bay, Chinese Academy of Sciences, China 1. Introduction Bays and estuaries are known to be biologically productive and strongly influenced by human activities (Burger, 2003; Sohma et al., 2001; Tagliani et al., 2003; Zhao, 2005). Coastal bays is the region of strong land-ocean interaction, and their ecological functions are more complicated and vulnerable to the influence by human activities and land-source pollution than the open ocean (Bodergat et al., 2003; Hansom 2001; Huang et al., 2003; Yung et al., 2001). With the increase of population and rapid economic development, littoral areas are facing many ecological problems. Eutrophication and environmental pollution obviously occurred in many coastal sea areas, especially in estuaries and coastal bays (Cloern, 1996; Turner and Rabalais, 1994; Yin et al., 2001). These have directly resulted in the ecological unbalance, the decrease of biodiversity and the rapid reduction of biological resources in estuaries and coastal bays. Coastal ecosystems and the study of marine biological resources and ecological environment have attracted worldwide attention (Buzzelli, 1998; Fisher, 1991; Huang et al., 1989, 2003; Sohma et al., 2001, Souter and Linden, 2000; Zhang et al., 2001; Yung et al, 2001). Many international programs and projects have been launched to address the problems confronting the world’s coastal ecosystems and biological resources (Yanez- Arancibia et al., 1999; Huang et al., 2003). Tang et al (2003) applied AVHRR data to the study of thermal plume from power plant at Daya Bay. Satellite remote sensing can provide information on the distribution and seasonal variation of thermal plumes from nuclear power plants that discharge cooling waters to the coastal zone. Variation of phytoplankton biomass and primary production in the western part of Daya Bay during spring and summer has been reported (Song et al., 2004). Wang et al (2006) used multivariate statistical analysis to reveal the relation between water quality and phytoplankton characteristics in Daya Bay, China, from 1999 to 2002. Wu and Wang (2007) used chemometrics to evaluate anthropogenic effects in Daya Bay and found that increases in human activities alter the balance of nutrients in Chinese coastal waters, and that the human activities were the main factor to impact the ecological environment in Daya Bay. Data collected from 12 marine monitoring stations in Daya Bay from 1982 to 2004 reveal a substantial change in the ecological environment of this region (Wang et al., 2006, 2008, 2011). The average N/P ratio increased from 1.377 in 1985 to 49.09 in 2004. Algal species www.intechopen.com
Transcript of Effects of the Operating Nuclear Power Plant on Marine Ecology and
11
Effects of the Operating Nuclear Power Plant on Marine Ecology and Environment
- A Case Study of Daya Bay in China
You-Shao Wang1,2 1Key Laboratory of Tropical Marine Environmental Dynamics, South China Sea Institute
of Oceanology, Chinese Academy of Sciences, 2Marine Biology Research Station at Daya Bay, Chinese Academy of Sciences,
China
1. Introduction
Bays and estuaries are known to be biologically productive and strongly influenced by human activities (Burger, 2003; Sohma et al., 2001; Tagliani et al., 2003; Zhao, 2005). Coastal bays is the region of strong land-ocean interaction, and their ecological functions are more complicated and vulnerable to the influence by human activities and land-source pollution than the open ocean (Bodergat et al., 2003; Hansom 2001; Huang et al., 2003; Yung et al., 2001). With the increase of population and rapid economic development, littoral areas are facing many ecological problems. Eutrophication and environmental pollution obviously occurred in many coastal sea areas, especially in estuaries and coastal bays (Cloern, 1996; Turner and Rabalais, 1994; Yin et al., 2001). These have directly resulted in the ecological unbalance, the decrease of biodiversity and the rapid reduction of biological resources in estuaries and coastal bays. Coastal ecosystems and the study of marine biological resources and ecological environment have attracted worldwide attention (Buzzelli, 1998; Fisher, 1991; Huang et al., 1989, 2003; Sohma et al., 2001, Souter and Linden, 2000; Zhang et al., 2001; Yung et al, 2001). Many international programs and projects have been launched to address the problems confronting the world’s coastal ecosystems and biological resources (Yanez-Arancibia et al., 1999; Huang et al., 2003). Tang et al (2003) applied AVHRR data to the study of thermal plume from power plant at Daya Bay. Satellite remote sensing can provide information on the distribution and seasonal variation of thermal plumes from nuclear power plants that discharge cooling waters to the coastal zone. Variation of phytoplankton biomass and primary production in the western part of Daya Bay during spring and summer has been reported (Song et al., 2004). Wang et al (2006) used multivariate statistical analysis to reveal the relation between water quality and phytoplankton characteristics in Daya Bay, China, from 1999 to 2002. Wu and Wang (2007) used chemometrics to evaluate anthropogenic effects in Daya Bay and found that increases in human activities alter the balance of nutrients in Chinese coastal waters, and that the human activities were the main factor to impact the ecological environment in Daya Bay. Data collected from 12 marine monitoring stations in Daya Bay from 1982 to 2004 reveal a substantial change in the ecological environment of this region (Wang et al., 2006, 2008, 2011). The average N/P ratio increased from 1.377 in 1985 to 49.09 in 2004. Algal species
www.intechopen.com
Nuclear Power – Deployment, Operation and Sustainability
256
changed from 159 species of 46 genera in 1982 to 126 species of 44 genera in 2004, and the nutrients and phytoplankton are good environmental indicators which can rapidly reflect the changing water quality in Daya Bay (Wang et al., 2006). Major zooplankton species went from 46 species in 1983 to 36 species in 2004. The annual mean biomass of benthic animals was recorded at 123.10 g m2 in 1982 and 126.68 g m2 in 2004. Mean biomass and species of benthic animals near nuclear power plants ranged from 317.9 g m2 in 1991 to 45.24 g m2 in 2004 and from 250 species in 1991 to 177 species in 2004 (Wang et al., 2008). The waste warm water from nuclear power plants was the main factor influencing the ecology and environment in western areas of Daya Bay, especially for benthos near the Nuclear Power Plants in Daya Bay (Wang et al., 2011). Daya Bay is a multi-type ecosystem mainly driven by human activities (Wang et al., 2008). As a case study of Daya Bay in China in this chapter, it is summarized long-term changes of
Daya Bay and analyzed to effect of the operating Nuclear Power Plant on marine ecology &
environment according to the monitoring and research data in Daya Bay obtained during
1982-2004 in China (Wang et al., 2006, 2008, 2011).
2. Research area, materials and methods
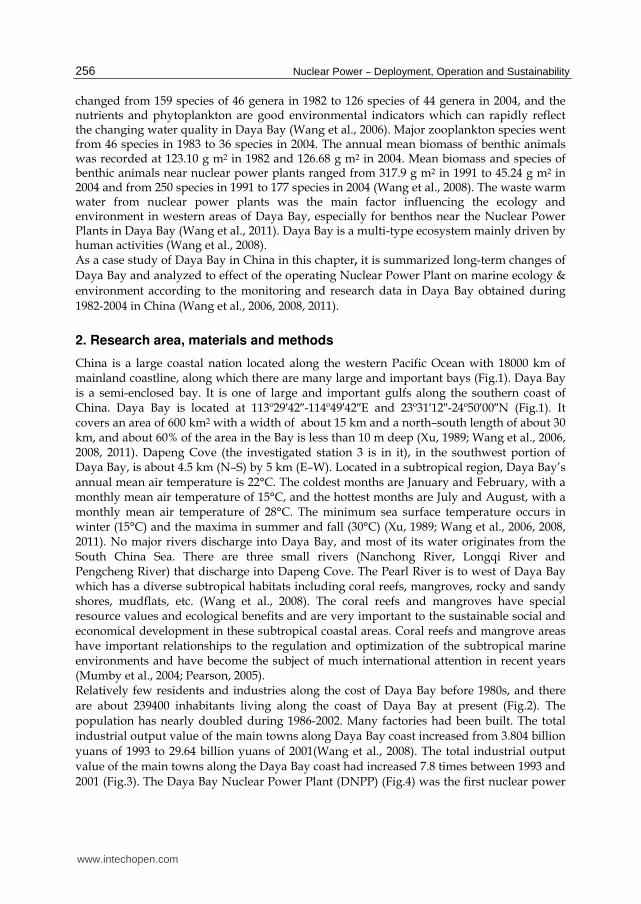
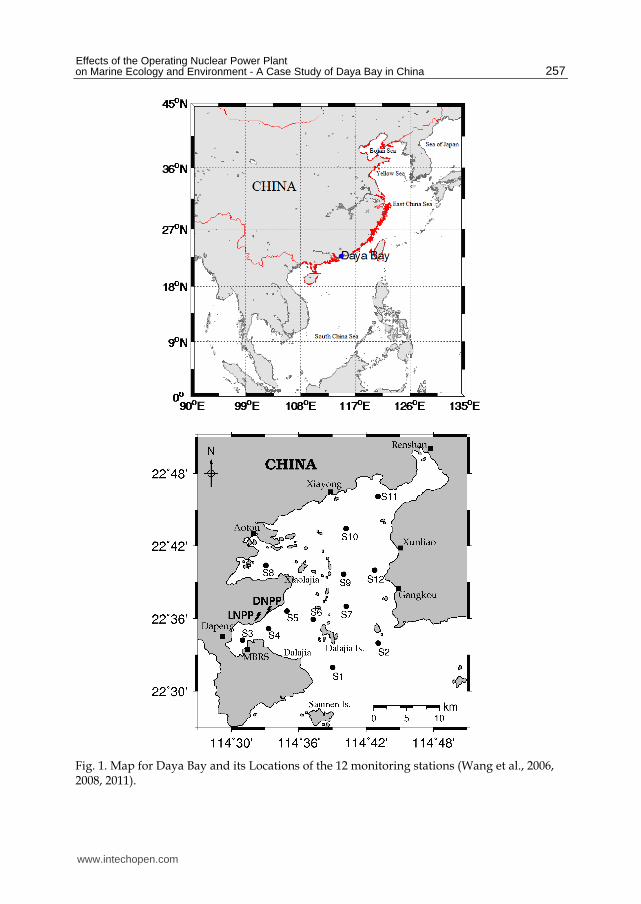
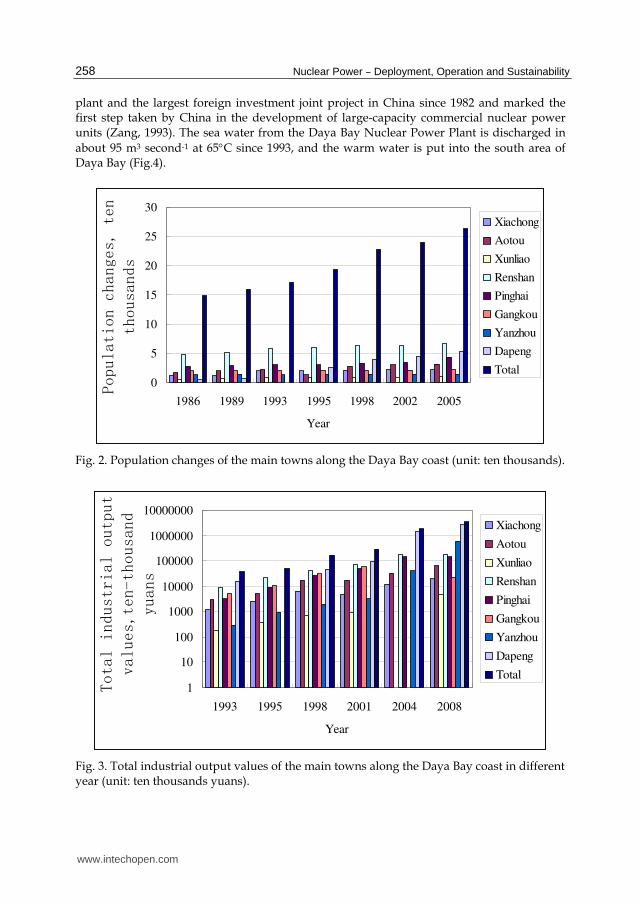
China is a large coastal nation located along the western Pacific Ocean with 18000 km of mainland coastline, along which there are many large and important bays (Fig.1). Daya Bay is a semi-enclosed bay. It is one of large and important gulfs along the southern coast of China. Daya Bay is located at 113º29t42u-114º49t42uE and 23º31t12u-24º50t00uN (Fig.1). It covers an area of 600 km2 with a width of about 15 km and a north–south length of about 30 km, and about 60% of the area in the Bay is less than 10 m deep (Xu, 1989; Wang et al., 2006, 2008, 2011). Dapeng Cove (the investigated station 3 is in it), in the southwest portion of Daya Bay, is about 4.5 km (N–S) by 5 km (E–W). Located in a subtropical region, Daya Bay’s annual mean air temperature is 22°C. The coldest months are January and February, with a monthly mean air temperature of 15°C, and the hottest months are July and August, with a monthly mean air temperature of 28°C. The minimum sea surface temperature occurs in winter (15°C) and the maxima in summer and fall (30°C) (Xu, 1989; Wang et al., 2006, 2008, 2011). No major rivers discharge into Daya Bay, and most of its water originates from the South China Sea. There are three small rivers (Nanchong River, Longqi River and Pengcheng River) that discharge into Dapeng Cove. The Pearl River is to west of Daya Bay which has a diverse subtropical habitats including coral reefs, mangroves, rocky and sandy shores, mudflats, etc. (Wang et al., 2008). The coral reefs and mangroves have special resource values and ecological benefits and are very important to the sustainable social and economical development in these subtropical coastal areas. Coral reefs and mangrove areas have important relationships to the regulation and optimization of the subtropical marine environments and have become the subject of much international attention in recent years (Mumby et al., 2004; Pearson, 2005). Relatively few residents and industries along the cost of Daya Bay before 1980s, and there
are about 239400 inhabitants living along the coast of Daya Bay at present (Fig.2). The
population has nearly doubled during 1986-2002. Many factories had been built. The total
industrial output value of the main towns along Daya Bay coast increased from 3.804 billion
yuans of 1993 to 29.64 billion yuans of 2001(Wang et al., 2008). The total industrial output
value of the main towns along the Daya Bay coast had increased 7.8 times between 1993 and
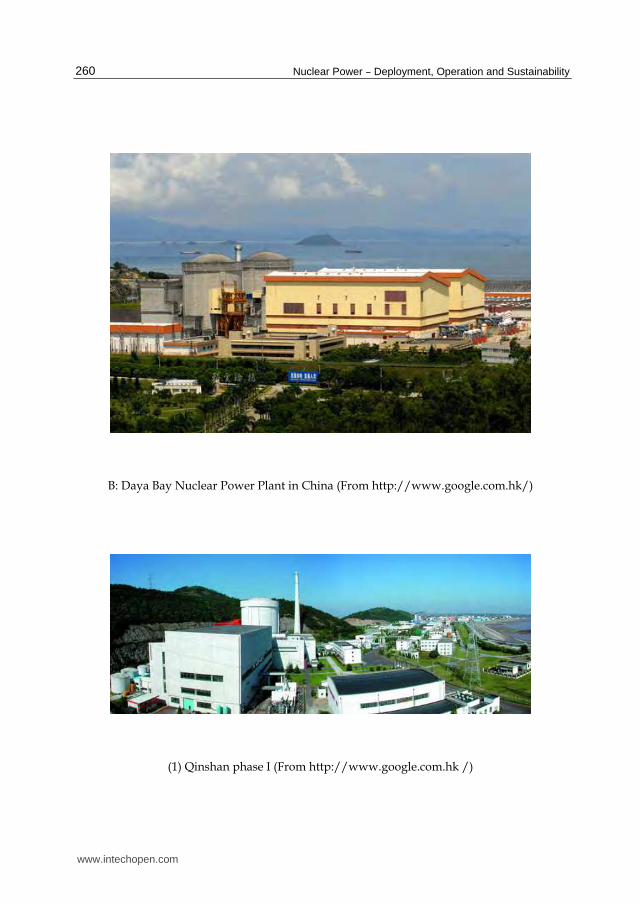
2001 (Fig.3). The Daya Bay Nuclear Power Plant (DNPP) (Fig.4) was the first nuclear power
www.intechopen.com
Effects of the Operating Nuclear Power Plant on Marine Ecology and Environment - A Case Study of Daya Bay in China
257
Fig. 1. Map for Daya Bay and its Locations of the 12 monitoring stations (Wang et al., 2006, 2008, 2011).
www.intechopen.com
Nuclear Power – Deployment, Operation and Sustainability
258
plant and the largest foreign investment joint project in China since 1982 and marked the first step taken by China in the development of large-capacity commercial nuclear power units (Zang, 1993). The sea water from the Daya Bay Nuclear Power Plant is discharged in
about 95 m3 second-1 at 65C since 1993, and the warm water is put into the south area of Daya Bay (Fig.4).
0
5
10
15
20
25
30
1986 1989 1993 1995 1998 2002 2005
Year
Population changes, ten
thousands
Xiachong
Aotou
Xunliao
Renshan
Pinghai
Gangkou
Yanzhou
Dapeng
Total
Fig. 2. Population changes of the main towns along the Daya Bay coast (unit: ten thousands).
1
10
100
1000
10000
100000
1000000
10000000
1993 1995 1998 2001 2004 2008
Year
Total industrial output
values,ten-thousand
yuans
Xiachong
Aotou
Xunliao
Renshan
Pinghai
Gangkou
Yanzhou
Dapeng
Total
Fig. 3. Total industrial output values of the main towns along the Daya Bay coast in different year (unit: ten thousands yuans).
www.intechopen.com

Effects of the Operating Nuclear Power Plant on Marine Ecology and Environment - A Case Study of Daya Bay in China
259
(1) Lingao phase I (From http://www.google.com.hk/)
(2) Lingao phase II (From http://www.google.com.hk/)
A: Lingao Nuclear Power Plant in China
www.intechopen.com
Nuclear Power – Deployment, Operation and Sustainability
260
B: Daya Bay Nuclear Power Plant in China (From http://www.google.com.hk/)
(1) Qinshan phase I (From http://www.google.com.hk /)
www.intechopen.com
Effects of the Operating Nuclear Power Plant on Marine Ecology and Environment - A Case Study of Daya Bay in China
261
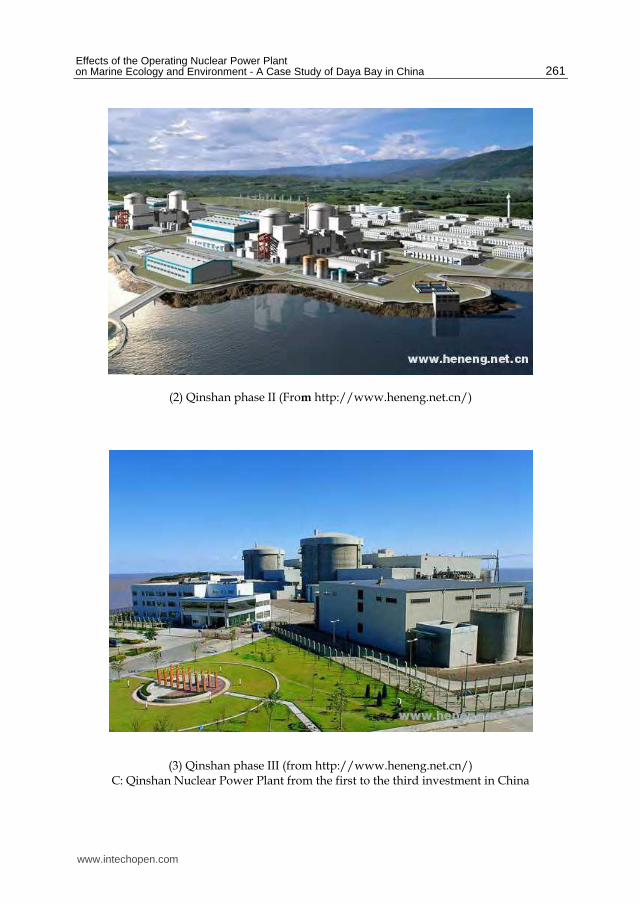
(2) Qinshan phase II (From http://www.heneng.net.cn/)
(3) Qinshan phase III (from http://www.heneng.net.cn/) C: Qinshan Nuclear Power Plant from the first to the third investment in China
www.intechopen.com
Nuclear Power – Deployment, Operation and Sustainability
262
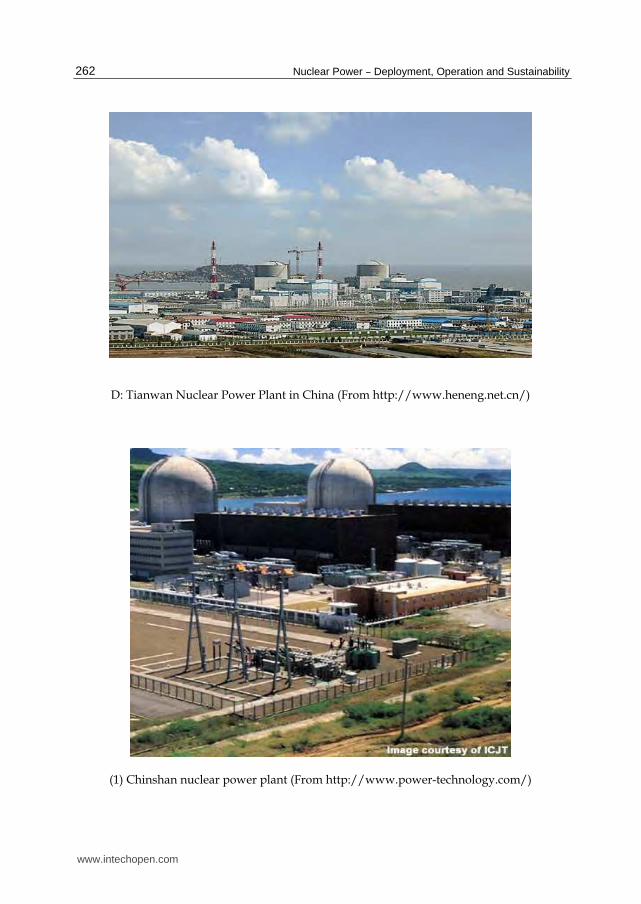
D: Tianwan Nuclear Power Plant in China (From http://www.heneng.net.cn/)
(1) Chinshan nuclear power plant (From http://www.power-technology.com/)
www.intechopen.com
Effects of the Operating Nuclear Power Plant on Marine Ecology and Environment - A Case Study of Daya Bay in China
263
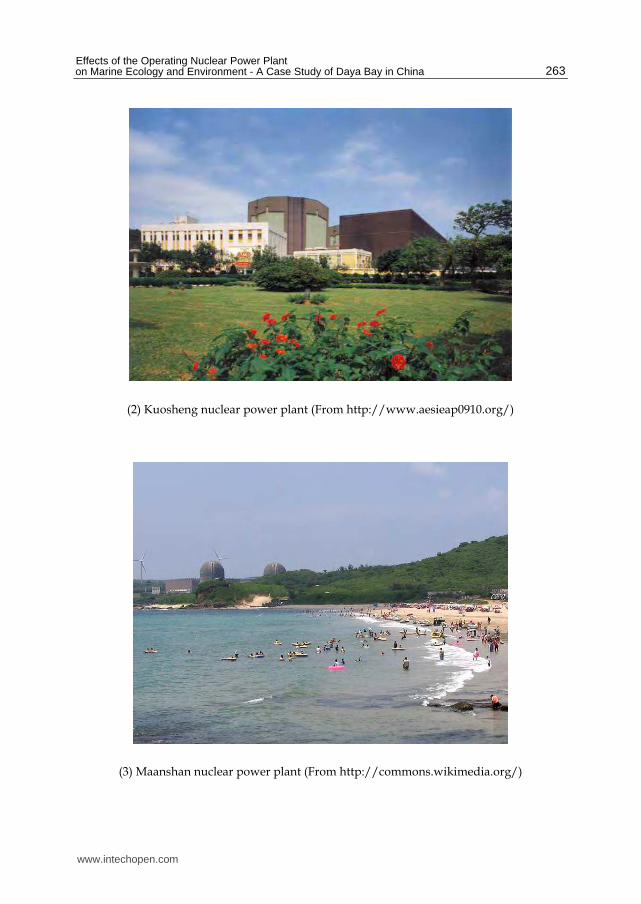
(2) Kuosheng nuclear power plant (From http://www.aesieap0910.org/)
(3) Maanshan nuclear power plant (From http://commons.wikimedia.org/)
www.intechopen.com
Nuclear Power – Deployment, Operation and Sustainability
264
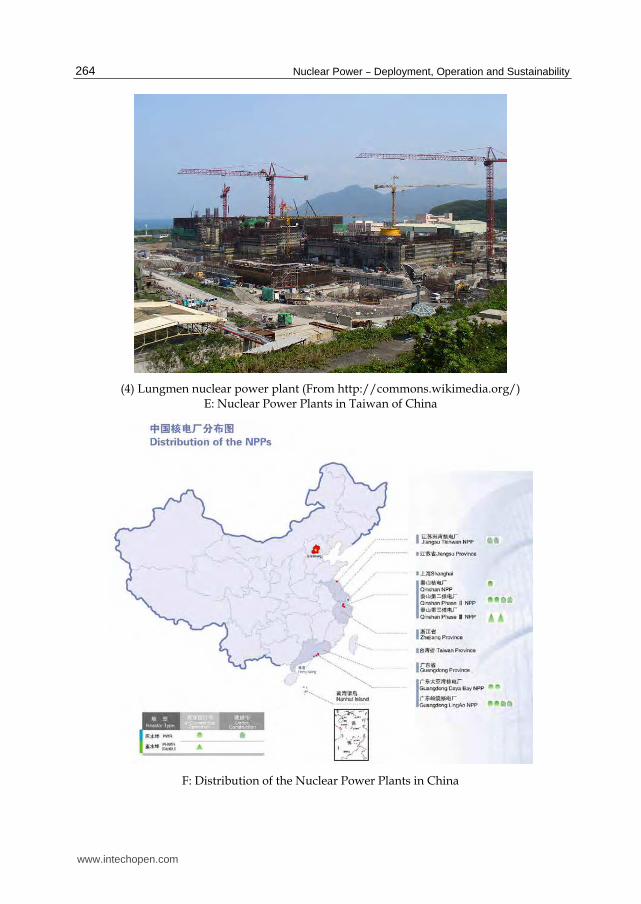
(4) Lungmen nuclear power plant (From http://commons.wikimedia.org/) E: Nuclear Power Plants in Taiwan of China
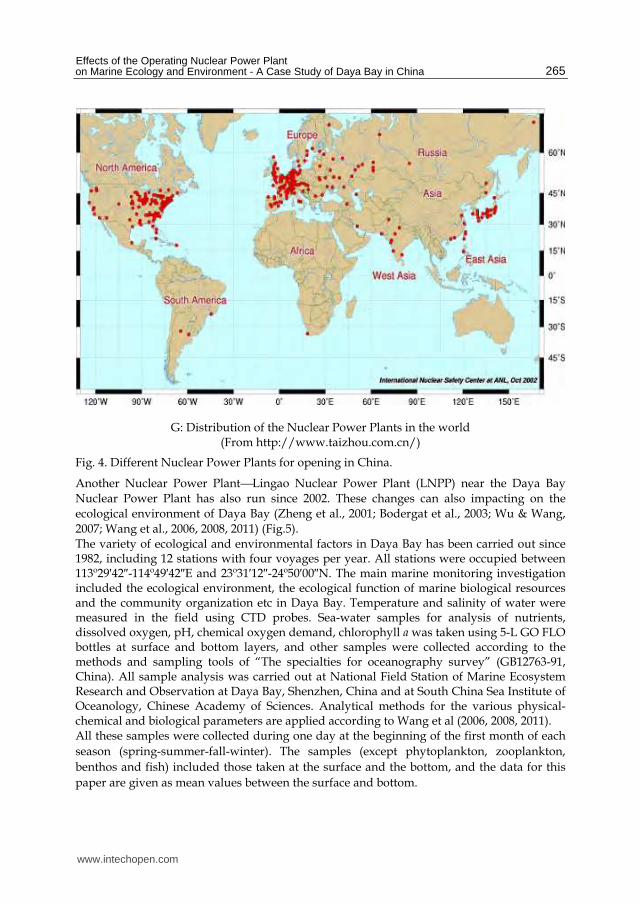
F: Distribution of the Nuclear Power Plants in China
www.intechopen.com
Effects of the Operating Nuclear Power Plant on Marine Ecology and Environment - A Case Study of Daya Bay in China
265
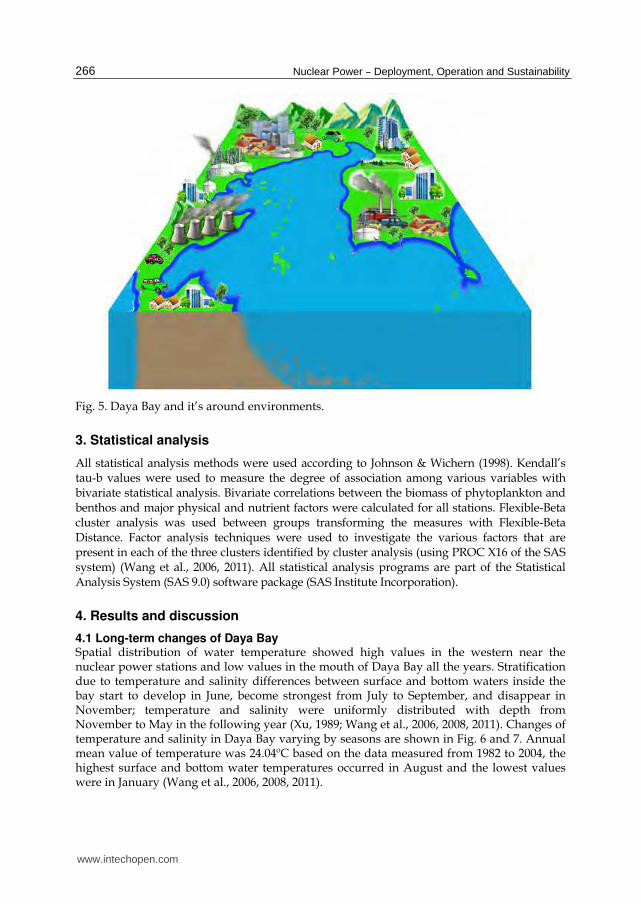
G: Distribution of the Nuclear Power Plants in the world (From http://www.taizhou.com.cn/)
Fig. 4. Different Nuclear Power Plants for opening in China.
Another Nuclear Power PlantLingao Nuclear Power Plant (LNPP) near the Daya Bay
Nuclear Power Plant has also run since 2002. These changes can also impacting on the
ecological environment of Daya Bay (Zheng et al., 2001; Bodergat et al., 2003; Wu & Wang,
2007; Wang et al., 2006, 2008, 2011) (Fig.5). The variety of ecological and environmental factors in Daya Bay has been carried out since 1982, including 12 stations with four voyages per year. All stations were occupied between 113º29t42u-114º49t42uE and 23º31t12u-24º50t00uN. The main marine monitoring investigation included the ecological environment, the ecological function of marine biological resources and the community organization etc in Daya Bay. Temperature and salinity of water were measured in the field using CTD probes. Sea-water samples for analysis of nutrients, dissolved oxygen, pH, chemical oxygen demand, chlorophyll a was taken using 5-L GO FLO bottles at surface and bottom layers, and other samples were collected according to the methods and sampling tools of “The specialties for oceanography survey” (GB12763-91, China). All sample analysis was carried out at National Field Station of Marine Ecosystem Research and Observation at Daya Bay, Shenzhen, China and at South China Sea Institute of Oceanology, Chinese Academy of Sciences. Analytical methods for the various physical-chemical and biological parameters are applied according to Wang et al (2006, 2008, 2011). All these samples were collected during one day at the beginning of the first month of each
season (spring-summer-fall-winter). The samples (except phytoplankton, zooplankton,
benthos and fish) included those taken at the surface and the bottom, and the data for this
paper are given as mean values between the surface and bottom.
www.intechopen.com
Nuclear Power – Deployment, Operation and Sustainability
266
Fig. 5. Daya Bay and it’s around environments.
3. Statistical analysis
All statistical analysis methods were used according to Johnson & Wichern (1998). Kendall’s tau-b values were used to measure the degree of association among various variables with bivariate statistical analysis. Bivariate correlations between the biomass of phytoplankton and benthos and major physical and nutrient factors were calculated for all stations. Flexible-Beta cluster analysis was used between groups transforming the measures with Flexible-Beta Distance. Factor analysis techniques were used to investigate the various factors that are present in each of the three clusters identified by cluster analysis (using PROC X16 of the SAS system) (Wang et al., 2006, 2011). All statistical analysis programs are part of the Statistical Analysis System (SAS 9.0) software package (SAS Institute Incorporation).
4. Results and discussion
4.1 Long-term changes of Daya Bay Spatial distribution of water temperature showed high values in the western near the nuclear power stations and low values in the mouth of Daya Bay all the years. Stratification due to temperature and salinity differences between surface and bottom waters inside the bay start to develop in June, become strongest from July to September, and disappear in November; temperature and salinity were uniformly distributed with depth from November to May in the following year (Xu, 1989; Wang et al., 2006, 2008, 2011). Changes of temperature and salinity in Daya Bay varying by seasons are shown in Fig. 6 and 7. Annual mean value of temperature was 24.04ºC based on the data measured from 1982 to 2004, the highest surface and bottom water temperatures occurred in August and the lowest values were in January (Wang et al., 2006, 2008, 2011).
www.intechopen.com

Effects of the Operating Nuclear Power Plant on Marine Ecology and Environment - A Case Study of Daya Bay in China
267
0
5
10
15
20
25
30
35
40
1982 1987 1991 1998 1999 2000 2001 2002 2003 2004 Mean
Year
Sal
inity
, ‰
Spring
Summer
Autumn
Winter
Mean
Fig. 6. Salinity of Daya Bay with different seasons from 1982 to 2004 (Wang et al., 2008) (Unit:‰).
0
5
10
15
20
25
30
35
1982 1987 1991 1996 1998 1999 2000 2001 2002 2003 2004 Mean
Year
Tem
per
atu
re, ℃
Spring
Summer
Autumn
Winter
Mean
Fig. 7. Temperature of Daya Bay with different seasons from 1982 to 2004 (Wang et al., 2008)
(Unit:C).
www.intechopen.com
Nuclear Power – Deployment, Operation and Sustainability
268
Cold-water upwelling influenced the distribution of nutrients and temperature, fluctuates in Daya Bay. The vertical and seasonal variations and distribution of water temperature suggest that the bay is affected by the East Guangdong upwelling and a thermocline occurring during June-August (Han, 1991; Wang et al., 2006, 2008, 2011). During this time, the thermocline temperature gradient averaged 0.5-1ºC m-1. The depths of the thermocline are ~ 6-10 m with a thickness of ~ 2-4 m in Daya Bay (Wang et al., 2006, 2008, 2011). The thermocline disappeared from November to the following May due to the mixing of the seawater. The seasonal variation of temperature of Daya Bay from 1982 to 2004 is shown in Fig.7.
Annual mean temperatures were increasing from 1982 to 2004, probably due to Global
Change. Climate change scenarios for the year 2100 indicates a significant increase in air
temperature (by 2.3-4.5ºC) which is major factor influencing the environment of the Gulf
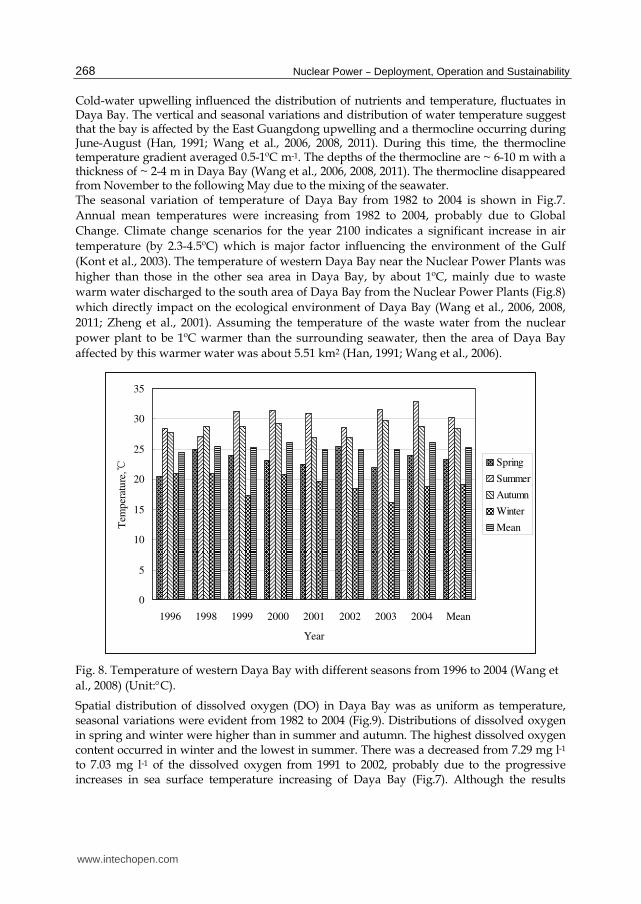
(Kont et al., 2003). The temperature of western Daya Bay near the Nuclear Power Plants was
higher than those in the other sea area in Daya Bay, by about 1ºC, mainly due to waste
warm water discharged to the south area of Daya Bay from the Nuclear Power Plants (Fig.8)
which directly impact on the ecological environment of Daya Bay (Wang et al., 2006, 2008,
2011; Zheng et al., 2001). Assuming the temperature of the waste water from the nuclear
power plant to be 1ºC warmer than the surrounding seawater, then the area of Daya Bay
affected by this warmer water was about 5.51 km2 (Han, 1991; Wang et al., 2006).
0
5
10
15
20
25
30
35
1996 1998 1999 2000 2001 2002 2003 2004 Mean
Year
Tem
per
atu
re, ℃
Spring
Summer
Autumn
Winter
Mean
Fig. 8. Temperature of western Daya Bay with different seasons from 1996 to 2004 (Wang et
al., 2008) (Unit:C).
Spatial distribution of dissolved oxygen (DO) in Daya Bay was as uniform as temperature, seasonal variations were evident from 1982 to 2004 (Fig.9). Distributions of dissolved oxygen in spring and winter were higher than in summer and autumn. The highest dissolved oxygen content occurred in winter and the lowest in summer. There was a decreased from 7.29 mg l-1 to 7.03 mg l-1 of the dissolved oxygen from 1991 to 2002, probably due to the progressive increases in sea surface temperature increasing of Daya Bay (Fig.7). Although the results
www.intechopen.com
Effects of the Operating Nuclear Power Plant on Marine Ecology and Environment - A Case Study of Daya Bay in China
269
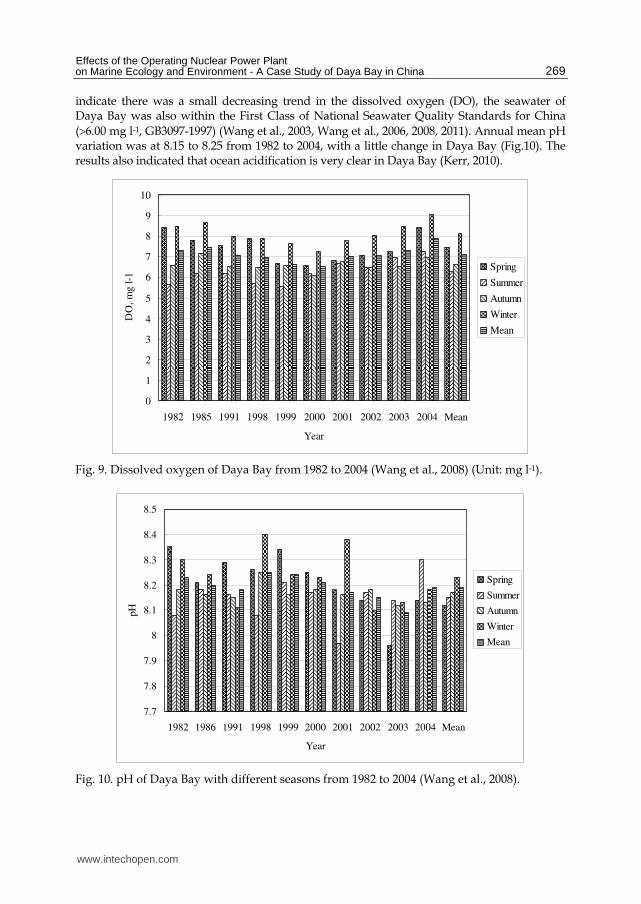
indicate there was a small decreasing trend in the dissolved oxygen (DO), the seawater of Daya Bay was also within the First Class of National Seawater Quality Standards for China
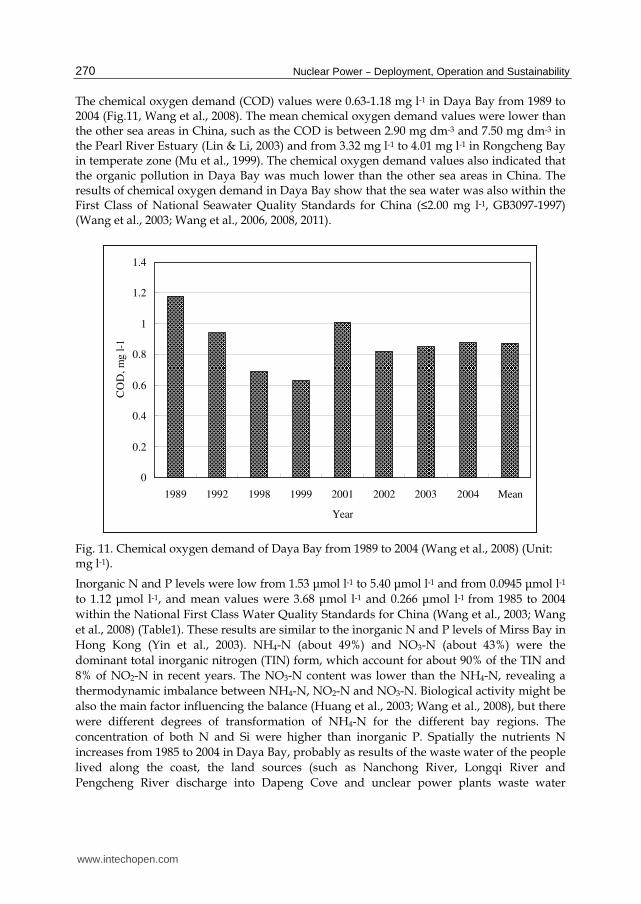
(6.00 mg l-1, GB3097-1997) (Wang et al., 2003, Wang et al., 2006, 2008, 2011). Annual mean pH variation was at 8.15 to 8.25 from 1982 to 2004, with a little change in Daya Bay (Fig.10). The results also indicated that ocean acidification is very clear in Daya Bay (Kerr, 2010).
0
1
2
3
4
5
6
7
8
9
10
1982 1985 1991 1998 1999 2000 2001 2002 2003 2004 Mean
Year
DO
, m
g l
-1
Spring
Summer
Autumn
Winter
Mean
Fig. 9. Dissolved oxygen of Daya Bay from 1982 to 2004 (Wang et al., 2008) (Unit: mg l-1).
7.7
7.8
7.9
8
8.1
8.2
8.3
8.4
8.5
1982 1986 1991 1998 1999 2000 2001 2002 2003 2004 Mean
Year
pH
Spring
Summer
Autumn
Winter
Mean
Fig. 10. pH of Daya Bay with different seasons from 1982 to 2004 (Wang et al., 2008).
www.intechopen.com
Nuclear Power – Deployment, Operation and Sustainability
270
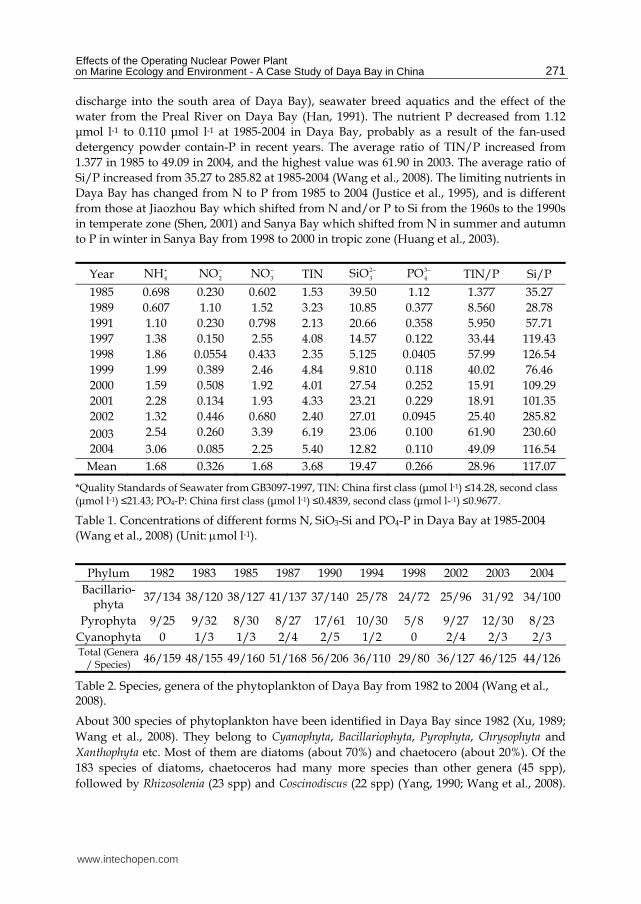
The chemical oxygen demand (COD) values were 0.63-1.18 mg l-1 in Daya Bay from 1989 to 2004 (Fig.11, Wang et al., 2008). The mean chemical oxygen demand values were lower than the other sea areas in China, such as the COD is between 2.90 mg dm-3 and 7.50 mg dm-3 in the Pearl River Estuary (Lin & Li, 2003) and from 3.32 mg l-1 to 4.01 mg l-1 in Rongcheng Bay in temperate zone (Mu et al., 1999). The chemical oxygen demand values also indicated that the organic pollution in Daya Bay was much lower than the other sea areas in China. The results of chemical oxygen demand in Daya Bay show that the sea water was also within the First Class of National Seawater Quality Standards for China (≤2.00 mg l-1, GB3097-1997) (Wang et al., 2003; Wang et al., 2006, 2008, 2011).
0
0.2
0.4
0.6
0.8
1
1.2
1.4
1989 1992 1998 1999 2001 2002 2003 2004 Mean
Year
CO
D, m
g l-1
Fig. 11. Chemical oxygen demand of Daya Bay from 1989 to 2004 (Wang et al., 2008) (Unit: mg l-1).
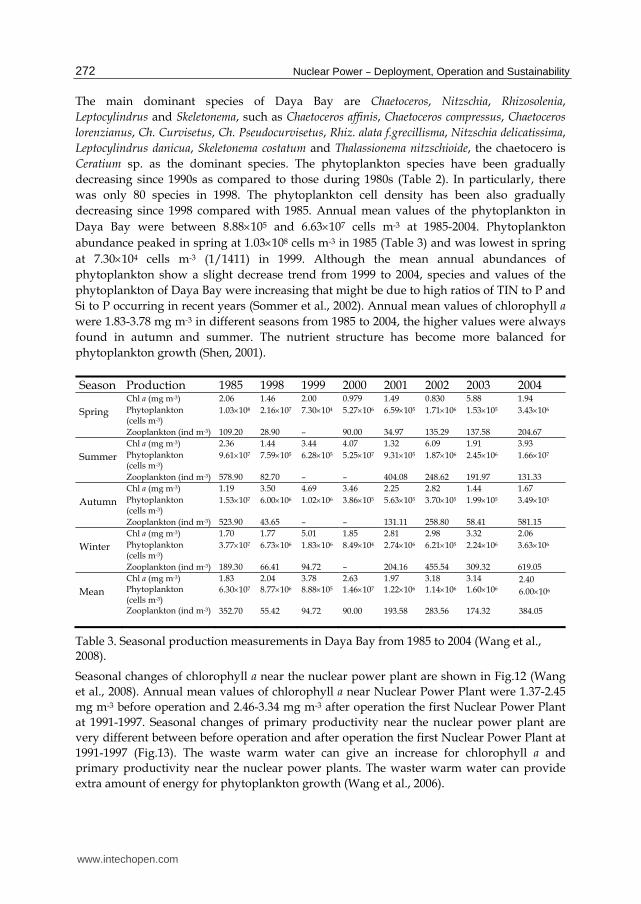
Inorganic N and P levels were low from 1.53 μmol l-1 to 5.40 μmol l-1 and from 0.0945 μmol l-1
to 1.12 μmol l-1, and mean values were 3.68 μmol l-1 and 0.266 μmol l-1 from 1985 to 2004
within the National First Class Water Quality Standards for China (Wang et al., 2003; Wang
et al., 2008) (Table1). These results are similar to the inorganic N and P levels of Mirss Bay in
Hong Kong (Yin et al., 2003). NH4-N (about 49%) and NO3-N (about 43%) were the
dominant total inorganic nitrogen (TIN) form, which account for about 90% of the TIN and
8% of NO2-N in recent years. The NO3-N content was lower than the NH4-N, revealing a
thermodynamic imbalance between NH4-N, NO2-N and NO3-N. Biological activity might be
also the main factor influencing the balance (Huang et al., 2003; Wang et al., 2008), but there
were different degrees of transformation of NH4-N for the different bay regions. The
concentration of both N and Si were higher than inorganic P. Spatially the nutrients N
increases from 1985 to 2004 in Daya Bay, probably as results of the waste water of the people
lived along the coast, the land sources (such as Nanchong River, Longqi River and
Pengcheng River discharge into Dapeng Cove and unclear power plants waste water
www.intechopen.com
Effects of the Operating Nuclear Power Plant on Marine Ecology and Environment - A Case Study of Daya Bay in China
271
discharge into the south area of Daya Bay), seawater breed aquatics and the effect of the
water from the Preal River on Daya Bay (Han, 1991). The nutrient P decreased from 1.12
μmol l-1 to 0.110 μmol l-1 at 1985-2004 in Daya Bay, probably as a result of the fan-used
detergency powder contain-P in recent years. The average ratio of TIN/P increased from
1.377 in 1985 to 49.09 in 2004, and the highest value was 61.90 in 2003. The average ratio of
Si/P increased from 35.27 to 285.82 at 1985-2004 (Wang et al., 2008). The limiting nutrients in
Daya Bay has changed from N to P from 1985 to 2004 (Justice et al., 1995), and is different
from those at Jiaozhou Bay which shifted from N and/or P to Si from the 1960s to the 1990s
in temperate zone (Shen, 2001) and Sanya Bay which shifted from N in summer and autumn
to P in winter in Sanya Bay from 1998 to 2000 in tropic zone (Huang et al., 2003).
Year 4NH
2NO
3NO
TIN
2
3SiO 3
4PO
TIN/P Si/P
1985 0.698 0.230 0.602 1.53 39.50 1.12 1.377 35.27 1989 0.607 1.10 1.52 3.23 10.85 0.377 8.560 28.78 1991 1.10 0.230 0.798 2.13 20.66 0.358 5.950 57.71 1997 1.38 0.150 2.55 4.08 14.57 0.122 33.44 119.43 1998 1.86 0.0554 0.433 2.35 5.125 0.0405 57.99 126.54 1999 1.99 0.389 2.46 4.84 9.810 0.118 40.02 76.46 2000 1.59 0.508 1.92 4.01 27.54 0.252 15.91 109.29 2001 2.28 0.134 1.93 4.33 23.21 0.229 18.91 101.35 2002 1.32 0.446 0.680 2.40 27.01 0.0945 25.40 285.82 2003 2004
2.54 0.260 3.39 6.19 23.06 0.100 61.90 230.60 3.06 0.085 2.25 5.40 12.82 0.110 49.09 116.54
Mean 1.68 0.326 1.68 3.68 19.47 0.266 28.96 117.07
*Quality Standards of Seawater from GB3097-1997, TIN: China first class (μmol l-1) ≤14.28, second class (μmol l-1) ≤21.43; PO4-P: China first class (μmol l-1) ≤0.4839, second class (μmol l--1) ≤0.9677.
Table 1. Concentrations of different forms N, SiO3-Si and PO4-P in Daya Bay at 1985-2004
(Wang et al., 2008) (Unit: mol l-1).
Phylum 1982 1983 1985 1987 1990 1994 1998 2002 2003 2004
Bacillario-phyta
37/134 38/120 38/127 41/137 37/140 25/78 24/72 25/96 31/92 34/100
Pyrophyta 9/25 9/32 8/30 8/27 17/61 10/30 5/8 9/27 12/30 8/23
Cyanophyta 0 1/3 1/3 2/4 2/5 1/2 0 2/4 2/3 2/3 Total (Genera
/ Species) 46/159 48/155 49/160 51/168 56/206 36/110 29/80 36/127 46/125 44/126
Table 2. Species, genera of the phytoplankton of Daya Bay from 1982 to 2004 (Wang et al., 2008).
About 300 species of phytoplankton have been identified in Daya Bay since 1982 (Xu, 1989;
Wang et al., 2008). They belong to Cyanophyta, Bacillariophyta, Pyrophyta, Chrysophyta and
Xanthophyta etc. Most of them are diatoms (about 70%) and chaetocero (about 20%). Of the
183 species of diatoms, chaetoceros had many more species than other genera (45 spp),
followed by Rhizosolenia (23 spp) and Coscinodiscus (22 spp) (Yang, 1990; Wang et al., 2008).
www.intechopen.com
Nuclear Power – Deployment, Operation and Sustainability
272
The main dominant species of Daya Bay are Chaetoceros, Nitzschia, Rhizosolenia,
Leptocylindrus and Skeletonema, such as Chaetoceros affinis, Chaetoceros compressus, Chaetoceros
lorenzianus, Ch. Curvisetus, Ch. Pseudocurvisetus, Rhiz. alata f.grecillisma, Nitzschia delicatissima,
Leptocylindrus danicua, Skeletonema costatum and Thalassionema nitzschioide, the chaetocero is
Ceratium sp. as the dominant species. The phytoplankton species have been gradually
decreasing since 1990s as compared to those during 1980s (Table 2). In particularly, there
was only 80 species in 1998. The phytoplankton cell density has been also gradually
decreasing since 1998 compared with 1985. Annual mean values of the phytoplankton in
Daya Bay were between 8.88105 and 6.63107 cells m-3 at 1985-2004. Phytoplankton
abundance peaked in spring at 1.03108 cells m-3 in 1985 (Table 3) and was lowest in spring
at 7.30104 cells m-3 (1/1411) in 1999. Although the mean annual abundances of
phytoplankton show a slight decrease trend from 1999 to 2004, species and values of the
phytoplankton of Daya Bay were increasing that might be due to high ratios of TIN to P and
Si to P occurring in recent years (Sommer et al., 2002). Annual mean values of chlorophyll a
were 1.83-3.78 mg m-3 in different seasons from 1985 to 2004, the higher values were always
found in autumn and summer. The nutrient structure has become more balanced for
phytoplankton growth (Shen, 2001).
Season Production 1985 1998 1999 2000 2001 2002 2003 2004 Spring
Chl a (mg m-3) 2.06 1.46 2.00 0.979 1.49 0.830 5.88 1.94
Phytoplankton (cells m-3)
1.03108 2.16107 7.30104 5.27106 6.59105 1.71106 1.53105 3.43106
Zooplankton (ind m-3) 109.20 28.90 – 90.00 34.97 135.29 137.58 204.67
Summer
Chl a (mg m-3) 2.36 1.44 3.44 4.07 1.32 6.09 1.91 3.93
Phytoplankton (cells m-3)
9.61107 7.59105 6.28105 5.25107 9.31105 1.87106 2.45106 1.66107
Zooplankton (ind m-3) 578.90 82.70 – – 404.08 248.62 191.97 131.33
Autumn
Chl a (mg m-3) 1.19 3.50 4.69 3.46 2.25 2.82 1.44 1.67
Phytoplankton (cells m-3)
1.53107 6.00106 1.02106 3.86105 5.63105 3.70105 1.99105 3.49105
Zooplankton (ind m-3) 523.90 43.65 – – 131.11 258.80 58.41 581.15
Winter
Chl a (mg m-3) 1.70 1.77 5.01 1.85 2.81 2.98 3.32 2.06
Phytoplankton (cells m-3)
3.77107 6.73106 1.83106 8.49104 2.74106 6.21105 2.24106 3.63106
Zooplankton (ind m-3) 189.30 66.41 94.72 – 204.16 455.54 309.32 619.05
Mean
Chl a (mg m-3) Phytoplankton (cells m-3) Zooplankton (ind m-3)
1.83
6.30107
352.70
2.04
8.77106
55.42
3.78
8.88105
94.72
2.63
1.46107
90.00
1.97
1.22106
193.58
3.18
1.14106
283.56
3.14
1.60106
174.32
2.40
6.00106
384.05
Table 3. Seasonal production measurements in Daya Bay from 1985 to 2004 (Wang et al., 2008).
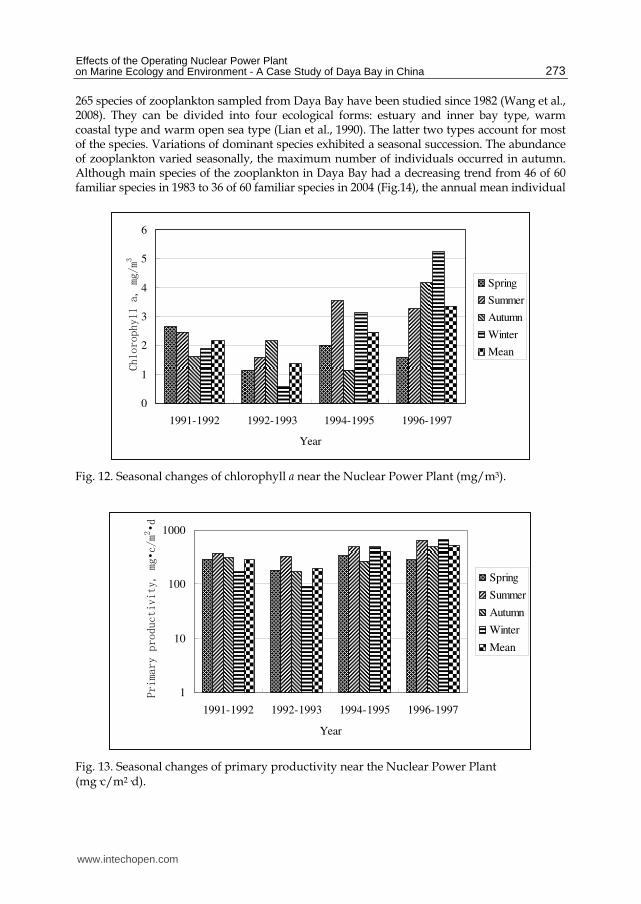
Seasonal changes of chlorophyll a near the nuclear power plant are shown in Fig.12 (Wang
et al., 2008). Annual mean values of chlorophyll a near Nuclear Power Plant were 1.37-2.45
mg m-3 before operation and 2.46-3.34 mg m-3 after operation the first Nuclear Power Plant
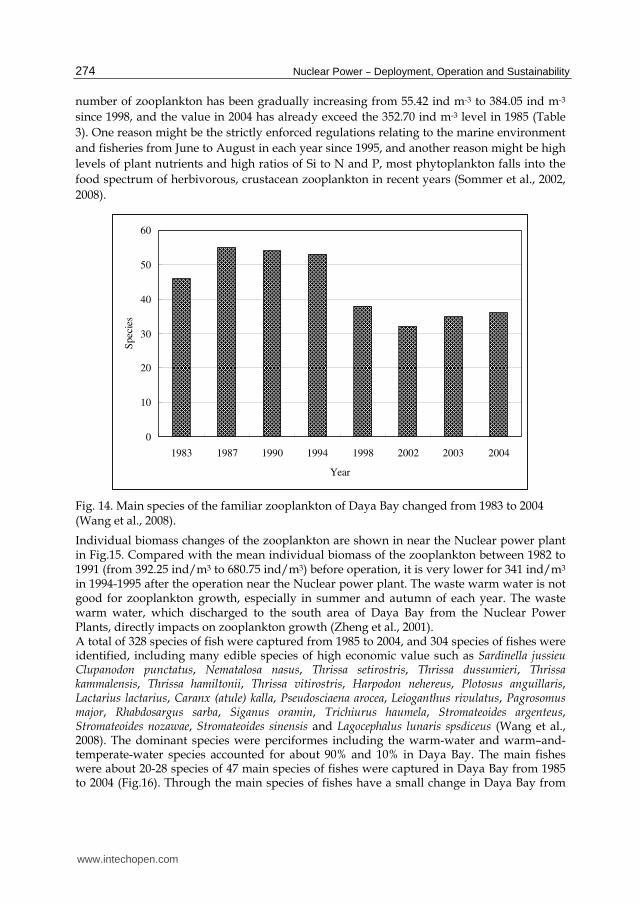
at 1991-1997. Seasonal changes of primary productivity near the nuclear power plant are
very different between before operation and after operation the first Nuclear Power Plant at
1991-1997 (Fig.13). The waste warm water can give an increase for chlorophyll a and
primary productivity near the nuclear power plants. The waster warm water can provide
extra amount of energy for phytoplankton growth (Wang et al., 2006).
www.intechopen.com
Effects of the Operating Nuclear Power Plant on Marine Ecology and Environment - A Case Study of Daya Bay in China
273
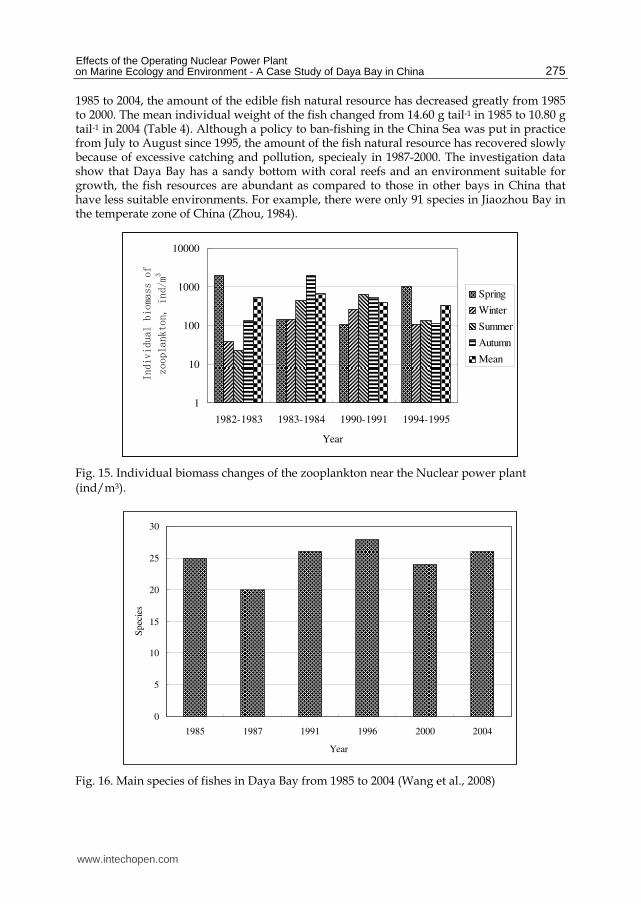
265 species of zooplankton sampled from Daya Bay have been studied since 1982 (Wang et al., 2008). They can be divided into four ecological forms: estuary and inner bay type, warm coastal type and warm open sea type (Lian et al., 1990). The latter two types account for most of the species. Variations of dominant species exhibited a seasonal succession. The abundance of zooplankton varied seasonally, the maximum number of individuals occurred in autumn. Although main species of the zooplankton in Daya Bay had a decreasing trend from 46 of 60 familiar species in 1983 to 36 of 60 familiar species in 2004 (Fig.14), the annual mean individual
0
1
2
3
4
5
6
1991-1992 1992-1993 1994-1995 1996-1997
Year
Chlorophyll a, mg/m
3
Spring
Summer
Autumn
Winter
Mean
Fig. 12. Seasonal changes of chlorophyll a near the Nuclear Power Plant (mg/m3).
1
10
100
1000
1991-1992 1992-1993 1994-1995 1996-1997
Year
Primary productivity, mg•c/m
2
•d
Spring
Summer
Autumn
Winter
Mean
Fig. 13. Seasonal changes of primary productivity near the Nuclear Power Plant (mg·c/m2·d).
www.intechopen.com
Nuclear Power – Deployment, Operation and Sustainability
274
number of zooplankton has been gradually increasing from 55.42 ind m-3 to 384.05 ind m-3
since 1998, and the value in 2004 has already exceed the 352.70 ind m-3 level in 1985 (Table
3). One reason might be the strictly enforced regulations relating to the marine environment
and fisheries from June to August in each year since 1995, and another reason might be high
levels of plant nutrients and high ratios of Si to N and P, most phytoplankton falls into the
food spectrum of herbivorous, crustacean zooplankton in recent years (Sommer et al., 2002,
2008).
0
10
20
30
40
50
60
1983 1987 1990 1994 1998 2002 2003 2004
Year
Spec
ies
Fig. 14. Main species of the familiar zooplankton of Daya Bay changed from 1983 to 2004 (Wang et al., 2008).
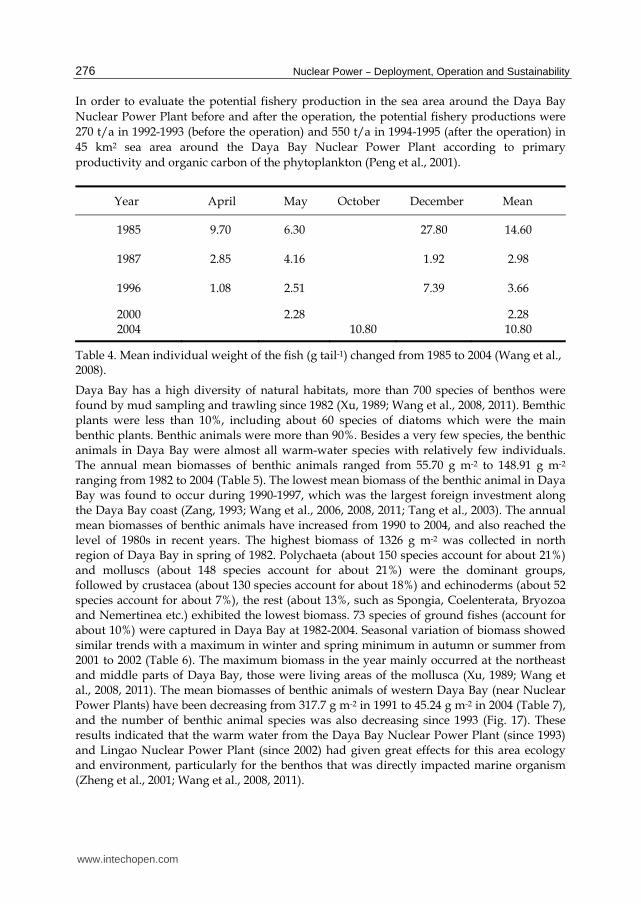
Individual biomass changes of the zooplankton are shown in near the Nuclear power plant in Fig.15. Compared with the mean individual biomass of the zooplankton between 1982 to 1991 (from 392.25 ind/m3 to 680.75 ind/m3) before operation, it is very lower for 341 ind/m3 in 1994-1995 after the operation near the Nuclear power plant. The waste warm water is not good for zooplankton growth, especially in summer and autumn of each year. The waste warm water, which discharged to the south area of Daya Bay from the Nuclear Power Plants, directly impacts on zooplankton growth (Zheng et al., 2001). A total of 328 species of fish were captured from 1985 to 2004, and 304 species of fishes were identified, including many edible species of high economic value such as Sardinella jussieu Clupanodon punctatus, Nematalosa nasus, Thrissa setirostris, Thrissa dussumieri, Thrissa kammalensis, Thrissa hamiltonii, Thrissa vitirostris, Harpodon nehereus, Plotosus anguillaris, Lactarius lactarius, Caranx (atule) kalla, Pseudosciaena arocea, Leioganthus rivulatus, Pagrosomus major, Rhabdosargus sarba, Siganus oramin, Trichiurus haumela, Stromateoides argenteus, Stromateoides nozawae, Stromateoides sinensis and Lagocephalus lunaris spsdiceus (Wang et al., 2008). The dominant species were perciformes including the warm-water and warm–and-temperate-water species accounted for about 90% and 10% in Daya Bay. The main fishes were about 20-28 species of 47 main species of fishes were captured in Daya Bay from 1985 to 2004 (Fig.16). Through the main species of fishes have a small change in Daya Bay from
www.intechopen.com
Effects of the Operating Nuclear Power Plant on Marine Ecology and Environment - A Case Study of Daya Bay in China
275
1985 to 2004, the amount of the edible fish natural resource has decreased greatly from 1985 to 2000. The mean individual weight of the fish changed from 14.60 g tail-1 in 1985 to 10.80 g tail-1 in 2004 (Table 4). Although a policy to ban-fishing in the China Sea was put in practice from July to August since 1995, the amount of the fish natural resource has recovered slowly because of excessive catching and pollution, speciealy in 1987-2000. The investigation data show that Daya Bay has a sandy bottom with coral reefs and an environment suitable for growth, the fish resources are abundant as compared to those in other bays in China that have less suitable environments. For example, there were only 91 species in Jiaozhou Bay in the temperate zone of China (Zhou, 1984).
1
10
100
1000
10000
1982-1983 1983-1984 1990-1991 1994-1995
Year
Individual biomass of
zooplankton, ind/m
3
Spring
Winter
Summer
Autumn
Mean
Fig. 15. Individual biomass changes of the zooplankton near the Nuclear power plant (ind/m3).
0
5
10
15
20
25
30
1985 1987 1991 1996 2000 2004
Year
Spec
ies
Fig. 16. Main species of fishes in Daya Bay from 1985 to 2004 (Wang et al., 2008)
www.intechopen.com
Nuclear Power – Deployment, Operation and Sustainability
276
In order to evaluate the potential fishery production in the sea area around the Daya Bay
Nuclear Power Plant before and after the operation, the potential fishery productions were
270 t/a in 1992-1993 (before the operation) and 550 t/a in 1994-1995 (after the operation) in
45 km2 sea area around the Daya Bay Nuclear Power Plant according to primary
productivity and organic carbon of the phytoplankton (Peng et al., 2001).
Year April May October December Mean
1985 9.70 6.30 27.80 14.60
1987 2.85 4.16 1.92 2.98
1996 1.08 2.51 7.39 3.66
2000 2004
2.28
10.80
2.28 10.80
Table 4. Mean individual weight of the fish (g tail-1) changed from 1985 to 2004 (Wang et al., 2008).
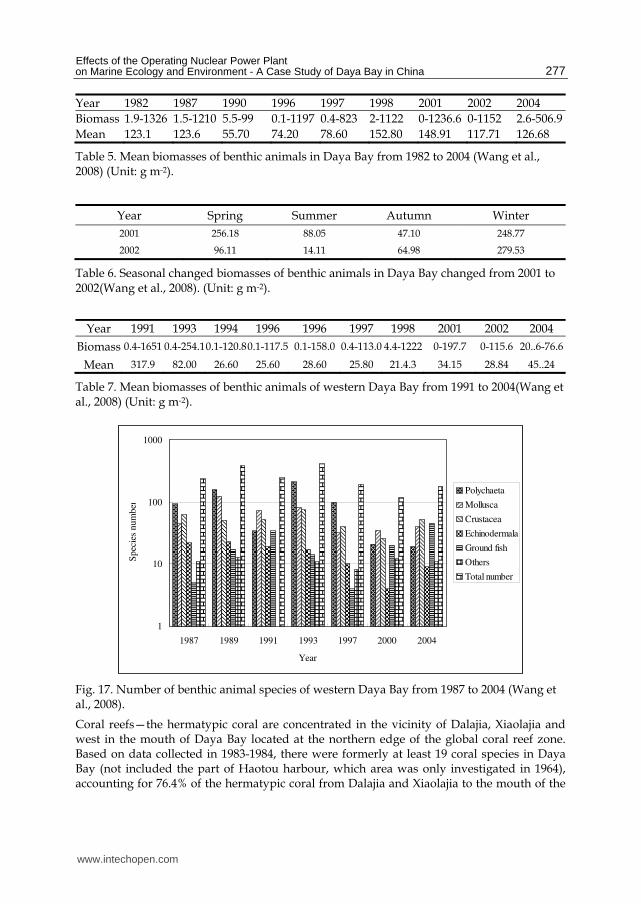
Daya Bay has a high diversity of natural habitats, more than 700 species of benthos were found by mud sampling and trawling since 1982 (Xu, 1989; Wang et al., 2008, 2011). Bemthic plants were less than 10%, including about 60 species of diatoms which were the main benthic plants. Benthic animals were more than 90%. Besides a very few species, the benthic animals in Daya Bay were almost all warm-water species with relatively few individuals. The annual mean biomasses of benthic animals ranged from 55.70 g m-2 to 148.91 g m-2 ranging from 1982 to 2004 (Table 5). The lowest mean biomass of the benthic animal in Daya Bay was found to occur during 1990-1997, which was the largest foreign investment along the Daya Bay coast (Zang, 1993; Wang et al., 2006, 2008, 2011; Tang et al., 2003). The annual mean biomasses of benthic animals have increased from 1990 to 2004, and also reached the level of 1980s in recent years. The highest biomass of 1326 g m-2 was collected in north region of Daya Bay in spring of 1982. Polychaeta (about 150 species account for about 21%) and molluscs (about 148 species account for about 21%) were the dominant groups, followed by crustacea (about 130 species account for about 18%) and echinoderms (about 52 species account for about 7%), the rest (about 13%, such as Spongia, Coelenterata, Bryozoa and Nemertinea etc.) exhibited the lowest biomass. 73 species of ground fishes (account for about 10%) were captured in Daya Bay at 1982-2004. Seasonal variation of biomass showed similar trends with a maximum in winter and spring minimum in autumn or summer from 2001 to 2002 (Table 6). The maximum biomass in the year mainly occurred at the northeast and middle parts of Daya Bay, those were living areas of the mollusca (Xu, 1989; Wang et al., 2008, 2011). The mean biomasses of benthic animals of western Daya Bay (near Nuclear Power Plants) have been decreasing from 317.7 g m-2 in 1991 to 45.24 g m-2 in 2004 (Table 7), and the number of benthic animal species was also decreasing since 1993 (Fig. 17). These results indicated that the warm water from the Daya Bay Nuclear Power Plant (since 1993) and Lingao Nuclear Power Plant (since 2002) had given great effects for this area ecology and environment, particularly for the benthos that was directly impacted marine organism (Zheng et al., 2001; Wang et al., 2008, 2011).
www.intechopen.com
Effects of the Operating Nuclear Power Plant on Marine Ecology and Environment - A Case Study of Daya Bay in China
277
Year 1982 1987 1990 1996 1997 1998 2001 2002 2004
Biomass 1.9-1326 1.5-1210 5.5-99 0.1-1197 0.4-823 2-1122 0-1236.6 0-1152 2.6-506.9
Mean 123.1 123.6 55.70 74.20 78.60 152.80 148.91 117.71 126.68
Table 5. Mean biomasses of benthic animals in Daya Bay from 1982 to 2004 (Wang et al., 2008) (Unit: g m-2).
Year Spring Summer Autumn Winter
2001 256.18 88.05 47.10 248.77
2002 96.11 14.11 64.98 279.53
Table 6. Seasonal changed biomasses of benthic animals in Daya Bay changed from 2001 to 2002(Wang et al., 2008). (Unit: g m-2).
Year 1991 1993 1994 1996 1996 1997 1998 2001 2002 2004
Biomass 0.4-1651 0.4-254.10.1-120.80.1-117.5 0.1-158.0 0.4-113.0 4.4-1222 0-197.7 0-115.6 20..6-76.6
Mean 317.9 82.00 26.60 25.60 28.60 25.80 21.4.3 34.15 28.84 45..24
Table 7. Mean biomasses of benthic animals of western Daya Bay from 1991 to 2004(Wang et al., 2008) (Unit: g m-2).
1
10
100
1000
1987 1989 1991 1993 1997 2000 2004
Year
Sp
ecie
s n
um
ber
Polychaeta
Mollusca
Crustacea
Echinodermala
Ground fish
Others
Total number
Fig. 17. Number of benthic animal species of western Daya Bay from 1987 to 2004 (Wang et al., 2008).
Coral reefs—the hermatypic coral are concentrated in the vicinity of Dalajia, Xiaolajia and west in the mouth of Daya Bay located at the northern edge of the global coral reef zone. Based on data collected in 1983-1984, there were formerly at least 19 coral species in Daya Bay (not included the part of Haotou harbour, which area was only investigated in 1964), accounting for 76.4% of the hermatypic coral from Dalajia and Xiaolajia to the mouth of the
www.intechopen.com
Nuclear Power – Deployment, Operation and Sustainability
278
bay (Zhang & Zhou, 1987), with Acropora pruinosa (Brook) as the dominant species. Only ~12-16 species were found in 1991-2002, accounting for 32% (Wen et al., 1996) and 36% of total cover rate for the hermatypic coral (Table 8). There has been a shift in the dominated species since 1990s. For example the dominated species were Favites abdita (Ellis & Solander) in 1991 and Platygyra daedalea (Ellis & Solander) in 2002, which was 7.4% of the hermatypic coral for its total cover rate. The hermatypic coral were demolished from 1984 to 2002, some of which were destroyed by men (Wen et al., 1996; Souter & Linden, 2000; Bellwood et al., 2004), such as bomb fishing, underwater coral reef sightseeing and exploitation of coral reef for making money. As one kind of sensitivity marine biology for water temperature, the coral bleaching is related to the going up of water temperature (Souter & Linden, 2000). If the seawater temperature increases by 0.5-1.5ºC in several weeks, about 90-95% coral will die (Zhang et al., 2001). The hermatypic coral of Daya Bay had a little recover from 1991 to 2002 (Wang et al., 2008). The increased temperature of Daya Bay being the global change and the warm water from the nuclear power plant may be also the other reasons for decreasing the cover rate of the hermatypic coral in Daya Bay (Zheng et al., 2001).
Year 1984 1991 2002
Total species/total cover rate (%)
19/76 12/32 16/36
Table 8. Investigation results of the hermatypic coral from 1984 to 2002 (Wang et al., 2008).
Mangrove plants grow along the coast of Daya Bay, such as in Aotou, Nianshan, Dongshan, Sanmen Island and Dalajia Island etc. There were 13 species belonged to 13 families (Chen et al., 1999; Zhong et al., 1999; Wang et al., 2008). There were some herbaceous and the ornamental vine in the mangrove plants of Daya Bay, such as Cyperusmalaccensis, Derristktrifoliata, Canavliamaritima, Ipomoeapescaprae, Plucheaindica, Sporobolusirginicus and Scavolahinanensis ect. The dominant species were Kandelia candel, Bruguiera gymnorrhiza, Aegiceras corniiculatum and Avicennia marina; and Ceriops tagal, Lumnitzera eacemosa, Rhizophora stylosa have gradually being deracinated (Chen et al., 1999). It now covers only 4% in some areas (such as in Baisha Bay of the northwest part in Daya Bay) as compared to 60-90% in 1950s, which is mainly consisted of small shrubs and bushes. A great deal of mangrove plants was felled in order to create farmland in 1970s. The total mangrove plants are about 850 hm2 along the Daya Bay coast at present. In recent years, the mangrove plants were again seriously destroyed and this phenomenon is accompanied with aquatic culture, the travel and economic development (Xue, 2002; Hens et al., 2000; Zoriniet al., 2004). Obviously, the coral reefs-the hermatypic coral and mangrove plants in Daya Bay have
seriously been degraded and destroyed since 1980s and 1970s. It will be need to make a
much greater effort to protect these diverse resources to maintain their ecological functions
(Wang et al., 2008).
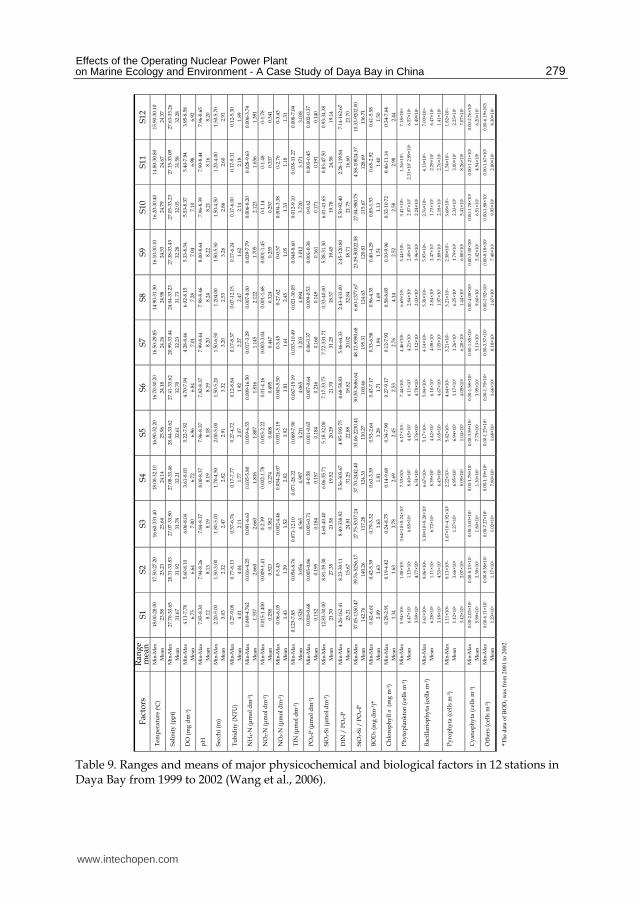
4.2 Identification of water quality and phytoplankton, benthos characteristics Water quality and phytoplankton data collected from 1999 to 2002 at 12 stations in Daya Bay
are summarized in Table 9 (Wang et al., 2006).
www.intechopen.com
Effects of the Operating Nuclear Power Plant on Marine Ecology and Environment - A Case Study of Daya Bay in China
279
Table 9. Ranges and means of major physicochemical and biological factors in 12 stations in Daya Bay from 1999 to 2002 (Wang et al., 2006).
www.intechopen.com
Nuclear Power – Deployment, Operation and Sustainability
280
Cluster analysis based on the major water quality parameters measured (first column Table 10) revealed that 12 monitoring stations could be grouped into three clusters. Flexible-Beta Cluster Analysis method was used and the corresponding dendrogram using FLExible-beta method between groups transforming measures with Flexible-Beta Distance is shown in Fig.18. Cluster I consisted of stations S1, S2, S7 and S11, in the south part of Daya Bay. Cluster II consisted of stations S5, S6, S9, S10 and S12, in the middle and northeast parts of Daya Bay. Cluster III consisted of stations S3, S4 and S8, in the cage culture areas of the southwest part of Daya Bay and the northwest part nearby the Aotou harbor of Daya Bay. By the FLExible-beta’s method for cluster analysis, the results could also reflect there were the different function areas in the sea of Daya Bay (Wang et al., 2006). Factor analysis techniques were used to investigate the various factors that present in each of three clusters identified by cluster analysis. Factors were identified by the principal component method with varimax rotation (using PROC X16 of the SAS system). Eigenvalues and cumulative proportions of correlation matrix are present in Table 10. In each cluster, more than 60% of the data variance could be explained by the first two principle components. In general, pH, NO3-N, TIN and TIN/PO4-P are the most important factors in differentiating the characteristics of the three clusters as evident from the factor loadings. Cluster I with factor 1 (positive loadings for secchi, NO3-N, DIN, TIN/PO4-P and BOD5) and factor 2 (positive loadings for temperature, DO, pH and chlorophyll a) combined accounting for 32.61 % of the data variance. Cluster II with factor 1 (positive loadings for NO2-N, NO3-N, TIN, PO4-P, SiO3-Si, and Chlorophyll a) and factor 2 (positive loadings for tubidity, TIN/PO4-P and chlorophyll a) combined accounting for 25.31 % of the data variance. Cluster III with factor 1 (positive loadings for temperature, pH, secchi, NO3-N, TIN, TIN/PO4-P, SiO3-Si/PO4-P and BOD5) and factor 2 (positive loadings for DO, pH, tubidity, NO2-N and chlorophyll a) combined accounting for 43.10 % of the data variance (Wang et al., 2006). Table 10 shows the corresponding factor loading in three clusters. It should be noted that
NO3-N and TIN/PO4-P were important factors among stations in the three clusters, while
concentrations of individual nutrient factors (i.e. NO2-N, NO3-N, TIN, PO4-P and SiO3-Si)
were more important in Cluster II. These results were different to the research in Port
Shelter, Hong Kong (Yung et al., 2001), which showed that nutrient ratios (i.e. TIN to TSi
and TP to TSi) were apparently the more important factors among stations in different
clusters (Wang et al., 2006).
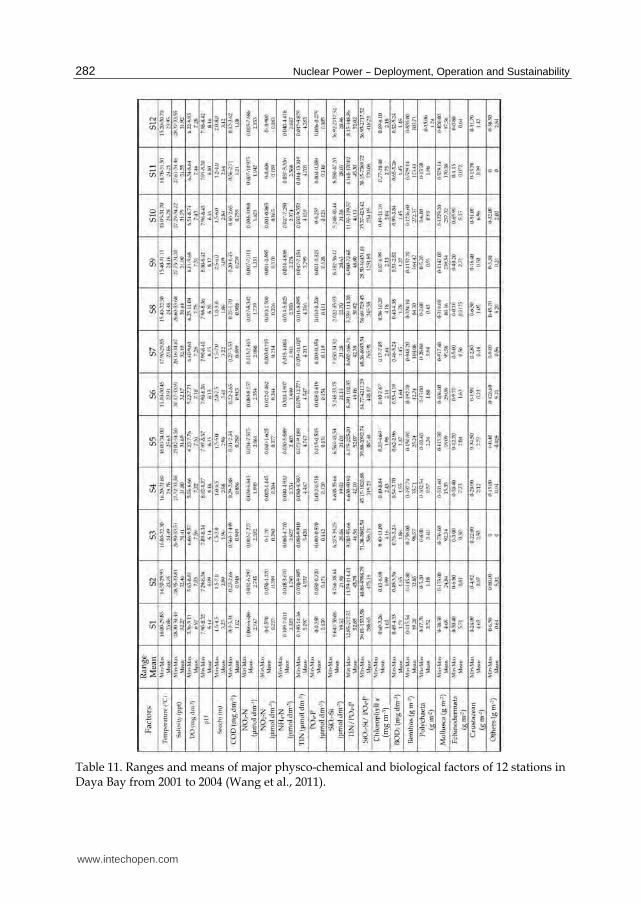
Water quality and benthos data collected from 2001 to 2004 at 12 stations in Daya Bay are
summarized in Table11 (Wang et al., 2011).
Bivariate correlations between benthos biomass and major physical and nutrient factors
were calculated for all stations. The density of benthos in all stations correlated positively
with temperature, DO, pH, NH4-N, SiO3-Si, SiO3-Si/PO4-P, chlorophyll a and negatively
correlated with salinity, Secchi, COD, NO3-N, NO2-N, TIN, PO4-P, TIN/PO4-P, BOD5. Such
relationship between nutrients and benthos was also found in the Lower Chesapeake Bay
(Dauer & Alden, 1995). The results of the correlation analysis revealed that not only
temperature, DO, pH, SiO3-Si, SiO3-Si/PO4-P, chlorophyll a, but also salinity, Secchi depth,
NO3-N, NO2-N, TIN, TIN/PO4-P, BOD5 could play an important role in determining the
biomass of benthos in Daya Bay (Dauer & Alden, 1995). The results are different from those
using multivariate statistical analysis to study water quality and phytoplankton
characteristics in Daya Bay from 1999 to 2002 (Wang et al., 2006).
www.intechopen.com
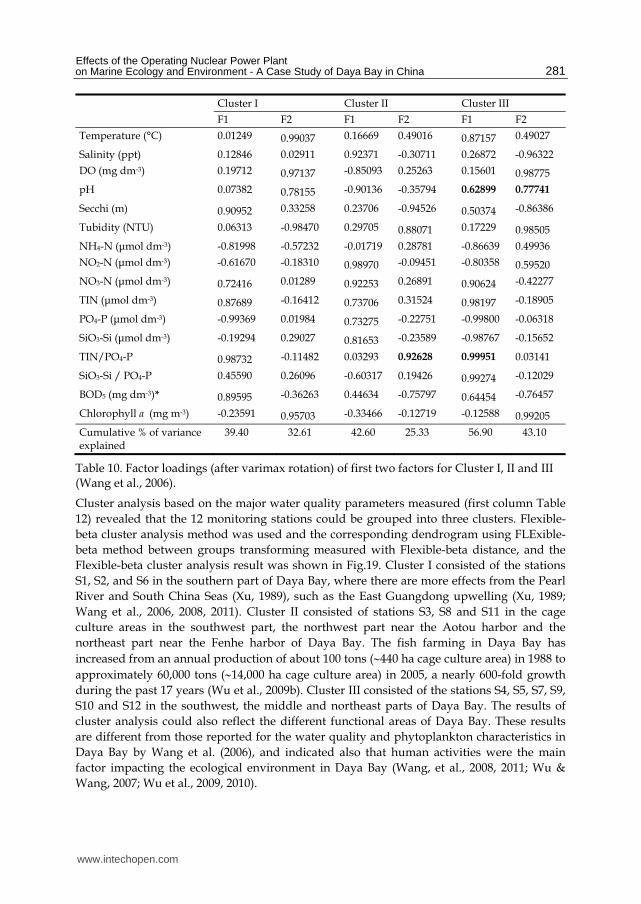
Effects of the Operating Nuclear Power Plant on Marine Ecology and Environment - A Case Study of Daya Bay in China
281
Cluster I Cluster II Cluster III
F1 F2 F1 F2 F1 F2
Temperature (°C) 0.01249 0.99037 0.16669 0.49016 0.87157 0.49027
Salinity (ppt) 0.12846 0.02911 0.92371 -0.30711 0.26872 -0.96322
DO (mg dm-3) 0.19712 0.97137 -0.85093 0.25263 0.15601 0.98775
pH 0.07382 0.78155 -0.90136 -0.35794 0.62899 0.77741
Secchi (m) 0.90952 0.33258 0.23706 -0.94526 0.50374 -0.86386
Tubidity (NTU) 0.06313 -0.98470 0.29705 0.88071 0.17229 0.98505
NH4-N (μmol dm-3) -0.81998 -0.57232 -0.01719 0.28781 -0.86639 0.49936
NO2-N (μmol dm-3) -0.61670 -0.18310 0.98970 -0.09451 -0.80358 0.59520
NO3-N (μmol dm-3) 0.72416 0.01289 0.92253 0.26891 0.90624 -0.42277
TIN (μmol dm-3) 0.87689 -0.16412 0.73706 0.31524 0.98197 -0.18905
PO4-P (μmol dm-3) -0.99369 0.01984 0.73275 -0.22751 -0.99800 -0.06318
SiO3-Si (μmol dm-3) -0.19294 0.29027 0.81653 -0.23589 -0.98767 -0.15652
TIN/PO4-P 0.98732 -0.11482 0.03293 0.92628 0.99951 0.03141
SiO3-Si / PO4-P 0.45590 0.26096 -0.60317 0.19426 0.99274 -0.12029
BOD5 (mg dm-3)* 0.89595 -0.36263 0.44634 -0.75797 0.64454 -0.76457
Chlorophyll a (mg m-3) -0.23591 0.95703 -0.33466 -0.12719 -0.12588 0.99205
Cumulative % of variance explained
39.40 32.61 42.60 25.33 56.90 43.10
Table 10. Factor loadings (after varimax rotation) of first two factors for Cluster I, II and III (Wang et al., 2006).
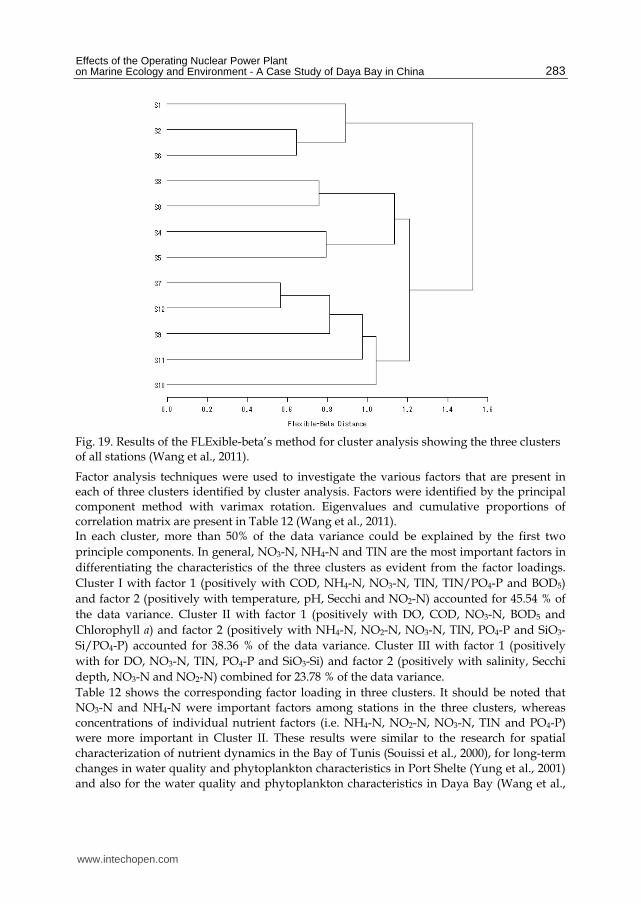
Cluster analysis based on the major water quality parameters measured (first column Table
12) revealed that the 12 monitoring stations could be grouped into three clusters. Flexible-
beta cluster analysis method was used and the corresponding dendrogram using FLExible-
beta method between groups transforming measured with Flexible-beta distance, and the
Flexible-beta cluster analysis result was shown in Fig.19. Cluster I consisted of the stations
S1, S2, and S6 in the southern part of Daya Bay, where there are more effects from the Pearl
River and South China Seas (Xu, 1989), such as the East Guangdong upwelling (Xu, 1989;
Wang et al., 2006, 2008, 2011). Cluster II consisted of stations S3, S8 and S11 in the cage
culture areas in the southwest part, the northwest part near the Aotou harbor and the
northeast part near the Fenhe harbor of Daya Bay. The fish farming in Daya Bay has
increased from an annual production of about 100 tons (440 ha cage culture area) in 1988 to
approximately 60,000 tons (14,000 ha cage culture area) in 2005, a nearly 600-fold growth
during the past 17 years (Wu et al., 2009b). Cluster III consisted of the stations S4, S5, S7, S9,
S10 and S12 in the southwest, the middle and northeast parts of Daya Bay. The results of
cluster analysis could also reflect the different functional areas of Daya Bay. These results
are different from those reported for the water quality and phytoplankton characteristics in
Daya Bay by Wang et al. (2006), and indicated also that human activities were the main
factor impacting the ecological environment in Daya Bay (Wang, et al., 2008, 2011; Wu &
Wang, 2007; Wu et al., 2009, 2010).
www.intechopen.com
Nuclear Power – Deployment, Operation and Sustainability
282
Table 11. Ranges and means of major physco-chemical and biological factors of 12 stations in Daya Bay from 2001 to 2004 (Wang et al., 2011).
(mg
m-3
)
www.intechopen.com
Effects of the Operating Nuclear Power Plant on Marine Ecology and Environment - A Case Study of Daya Bay in China
283
Fig. 19. Results of the FLExible-beta’s method for cluster analysis showing the three clusters of all stations (Wang et al., 2011).
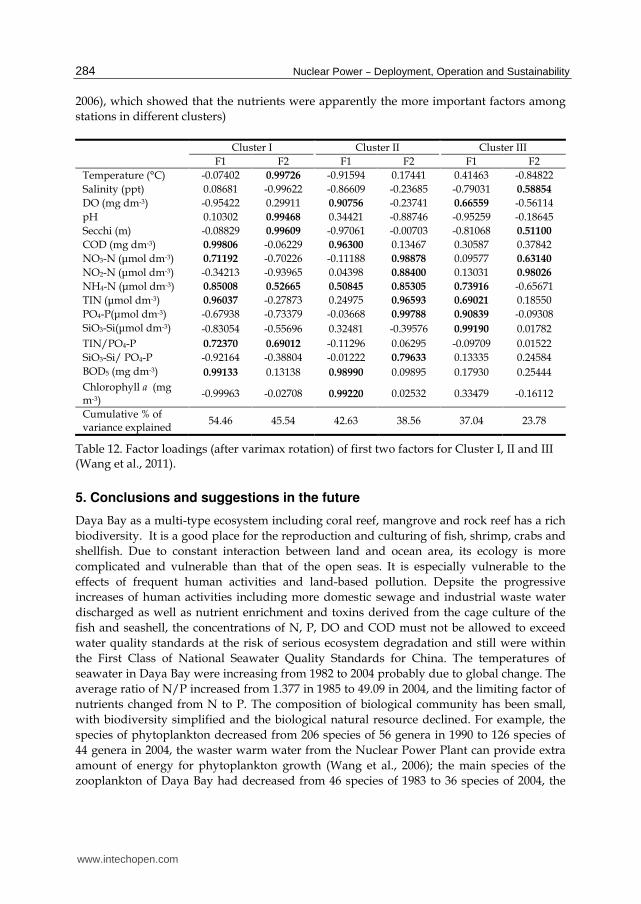
Factor analysis techniques were used to investigate the various factors that are present in each of three clusters identified by cluster analysis. Factors were identified by the principal component method with varimax rotation. Eigenvalues and cumulative proportions of correlation matrix are present in Table 12 (Wang et al., 2011). In each cluster, more than 50% of the data variance could be explained by the first two
principle components. In general, NO3-N, NH4-N and TIN are the most important factors in
differentiating the characteristics of the three clusters as evident from the factor loadings.
Cluster I with factor 1 (positively with COD, NH4-N, NO3-N, TIN, TIN/PO4-P and BOD5)
and factor 2 (positively with temperature, pH, Secchi and NO2-N) accounted for 45.54 % of
the data variance. Cluster II with factor 1 (positively with DO, COD, NO3-N, BOD5 and
Chlorophyll a) and factor 2 (positively with NH4-N, NO2-N, NO3-N, TIN, PO4-P and SiO3-
Si/PO4-P) accounted for 38.36 % of the data variance. Cluster III with factor 1 (positively
with for DO, NO3-N, TIN, PO4-P and SiO3-Si) and factor 2 (positively with salinity, Secchi
depth, NO3-N and NO2-N) combined for 23.78 % of the data variance.
Table 12 shows the corresponding factor loading in three clusters. It should be noted that
NO3-N and NH4-N were important factors among stations in the three clusters, whereas
concentrations of individual nutrient factors (i.e. NH4-N, NO2-N, NO3-N, TIN and PO4-P)
were more important in Cluster II. These results were similar to the research for spatial
characterization of nutrient dynamics in the Bay of Tunis (Souissi et al., 2000), for long-term
changes in water quality and phytoplankton characteristics in Port Shelte (Yung et al., 2001)
and also for the water quality and phytoplankton characteristics in Daya Bay (Wang et al.,
www.intechopen.com
Nuclear Power – Deployment, Operation and Sustainability
284
2006), which showed that the nutrients were apparently the more important factors among
stations in different clusters)
Cluster I Cluster II Cluster III
F1 F2 F1 F2 F1 F2
Temperature (°C) -0.07402 0.99726 -0.91594 0.17441 0.41463 -0.84822
Salinity (ppt) 0.08681 -0.99622 -0.86609 -0.23685 -0.79031 0.58854
DO (mg dm-3) -0.95422 0.29911 0.90756 -0.23741 0.66559 -0.56114
pH 0.10302 0.99468 0.34421 -0.88746 -0.95259 -0.18645
Secchi (m) -0.08829 0.99609 -0.97061 -0.00703 -0.81068 0.51100
COD (mg dm-3) 0.99806 -0.06229 0.96300 0.13467 0.30587 0.37842
NO3-N (μmol dm-3) 0.71192 -0.70226 -0.11188 0.98878 0.09577 0.63140
NO2-N (μmol dm-3) -0.34213 -0.93965 0.04398 0.88400 0.13031 0.98026
NH4-N (μmol dm-3) 0.85008 0.52665 0.50845 0.85305 0.73916 -0.65671
TIN (μmol dm-3) 0.96037 -0.27873 0.24975 0.96593 0.69021 0.18550
PO4-P(μmol dm-3) -0.67938 -0.73379 -0.03668 0.99788 0.90839 -0.09308
SiO3-Si(μmol dm-3) -0.83054 -0.55696 0.32481 -0.39576 0.99190 0.01782
TIN/PO4-P 0.72370 0.69012 -0.11296 0.06295 -0.09709 0.01522
SiO3-Si/ PO4-P -0.92164 -0.38804 -0.01222 0.79633 0.13335 0.24584
BOD5 (mg dm-3) 0.99133 0.13138 0.98990 0.09895 0.17930 0.25444
Chlorophyll a (mg m-3)
-0.99963 -0.02708 0.99220 0.02532 0.33479 -0.16112
Cumulative % of variance explained
54.46 45.54 42.63 38.56 37.04 23.78
Table 12. Factor loadings (after varimax rotation) of first two factors for Cluster I, II and III (Wang et al., 2011).
5. Conclusions and suggestions in the future
Daya Bay as a multi-type ecosystem including coral reef, mangrove and rock reef has a rich
biodiversity. It is a good place for the reproduction and culturing of fish, shrimp, crabs and
shellfish. Due to constant interaction between land and ocean area, its ecology is more
complicated and vulnerable than that of the open seas. It is especially vulnerable to the
effects of frequent human activities and land-based pollution. Depsite the progressive
increases of human activities including more domestic sewage and industrial waste water
discharged as well as nutrient enrichment and toxins derived from the cage culture of the
fish and seashell, the concentrations of N, P, DO and COD must not be allowed to exceed
water quality standards at the risk of serious ecosystem degradation and still were within
the First Class of National Seawater Quality Standards for China. The temperatures of
seawater in Daya Bay were increasing from 1982 to 2004 probably due to global change. The
average ratio of N/P increased from 1.377 in 1985 to 49.09 in 2004, and the limiting factor of
nutrients changed from N to P. The composition of biological community has been small,
with biodiversity simplified and the biological natural resource declined. For example, the
species of phytoplankton decreased from 206 species of 56 genera in 1990 to 126 species of
44 genera in 2004, the waster warm water from the Nuclear Power Plant can provide extra
amount of energy for phytoplankton growth (Wang et al., 2006); the main species of the
zooplankton of Daya Bay had decreased from 46 species of 1983 to 36 species of 2004, the
www.intechopen.com
Effects of the Operating Nuclear Power Plant on Marine Ecology and Environment - A Case Study of Daya Bay in China
285
waste warm water is not a good environment for zooplankton growth, especially in summer
and autumn of each year, which directly impacts on zooplankton growth (Zheng et al.,
2001); the mean individual weight of the fish has changed from 14.8 g tail-1 of 1985 to 10.80 g
tail-1 of 2004. Assessment for the potential fishery production between before and after the
operation indicated that the potential fishery production after the operation was one time
compared with before the operation in 45 km2 sea area around the Daya Bay Nuclear Power
Plant (Peng et al., 2001). More than 700 species of benthos were found, the annual mean
biomasses of benthic animals increased from 72.40 g m-2 in 1996 to 126.68 g m-2 in 2004. The
mean biomasses and species of benthic animals near the Nuclear Power Plants decreased
from 317.9 g m-2 in 1991 to 45.24 g m-2 in 2004 and from 250 species in 1991 to 177 species in
2004, the temperature value increased about 1ºC compared with the other sea areas in Daya
Bay (Wang et al., 2008). The waste warm water from the Nuclear Power Plants was the main
factor influencing ecology and environment in the western area of Daya Bay, particularly for
the benthos that directly impacted marine organism (Wang et al., 2008, 2011; Zheng et al.,
2001). Many changes had taken place in Daya Bay from 1982 to 2004, such as stony coral
bleaching, changed in dominate species of coral community, seriously degraded and
destroyed mangrove plants. These results indicated that the ecosystem of Daya Bay is
undergoing a rapid deterioration in some areas and in some aspects. At the same time, some
aspects of its ecological environment were recovering due to strategic protection and
management steps for protection and management of coastal marine ecosystems in China.
For example, the annual mean biomasses of benthic animals increased from 72.40 g m-2 of
1996 to 1126.68 g m-2 of 2004 and the nutrient P decreased from 1985 to 2004. Daya Bay is a
multi-type ecosystem mainly driven by human activities (Wang et al., 2006, 2008, 2011; Wu
& Wang, 2007).
The results of the present study indicated that the mean abundances of phytoplankton in all stations correlated positively with temperature, salinity, DO, pH, the ratio of TIN to PO4-P, NH4-N, NO3-N, TIN and PO4-P and negatively correlated with secchi, tubidity, SiO3-Si to PO4-P, and SiO3-Si and NO2-N by calculation with bivariate correlations. All stations could be groups into three clusters with Flexible-Beta Cluster Analysis method. Cluster I consisted of stations S1, S2, S7 and S11 in the south part and the northeast part of the Daya Bay. Cluster II consisted of stations S5, S6, S9, S10 and S12 in the middle and northeast parts of Daya Bay. Cluster III consisted of stations S3, S4 and S8 were in the cage culture areas in the southwest part of Daya Bay and in the northwest part near the Aotou harbor of the Daya Bay. The results also suggest that the nutrient and phytoplankton are good environmental indicators can rapidly image the changing water quality in Daya Bay, and this is the first attempt to analyze the water quality and phytoplankton characteristics in Daya Bay by
multivariate statistics based on the investigated data in Daya Bay. The results of multivariate statistical analysis revealed that the temperature, dissolved oxygen, NH4-N and NO3-N could also play an important role in determining the density of phytoplankton in Daya Bay (Wang et al., 2006). The results of the present study indicated that the biomass of benthos at all stations
correlated positively with temperature, DO, pH, NH4-N, SiO3-Si, SiO3-Si/PO4-P and
chlorophyll a and negatively correlated with salinity, Secchi depth, COD, NO3-N, NO2-N,
TIN, PO4-P, TIN/PO4-P and BOD5 by calculation with bivariate correlations between
benthos and major physical and nutrient factors. All stations could be grouped into three
clusters. Cluster I consisted of stations S1, S2, and S6 were in the south part of Daya Bay.
www.intechopen.com
Nuclear Power – Deployment, Operation and Sustainability
286
Cluster II consisted of stations S3, S4, S8 and S5 in the cage culture areas in the southwest
part, the northwest part near the Aotou harbor and the northeast part near the Fenhe harbor
of Daya Bay. Cluster III consisted of stations S7, S9, S10 S11 and S12 in the southwest, the
middle and northeast parts of Daya Bay. The results also suggest that the nutrient and
benthos are good environmental indicators that can rapidly image the changing water
quality in Daya Bay. As a multi-type ecosystem Daya Bay seems to be mainly driven by
human activities (Wang et al., 2008). The results revealed that temperature and nutrients
could also play an important role in determining the biomass of benthos in Daya Bay (Wang
et al., 2011).
The warm water from the Nuclear Power Plants and waste water from the cage culture areas had greatly influenced ecological processes and the environment in this region according to changes in biomass of benthos and water quality at different stations in Daya Bay (Wang et al., 2006, 2008, 2011). Particularly the benthos was directly impacted as marine organisms, thus there is a need for more research about waste warm water from the Nuclear Power Plants and from cage culture areas affecting the regional ecosystem of Daya Bay (Wang et al., 2006, 2008, 2011; Wu et al., 2009, 2010). Furthermore the development of fish-farming in Daya Bay should in future be controlled (Wu et al., 2009). According to the research of long-term changes of Daya Bay, regional coordination in protection and management of such vulnerable coastal marine ecosystems should be strengthened. The following strategic protection and management steps are recommended(Wang et al., 2008): (i) Enhance information dissemination and education to improve environmental protection awareness for people in the region; (ii) Strengthen the long-term monitoring of the marine environment and coastal ecosystems in Daya Bay, enhance the research of regional environmental capacity, and use that capacity to establish large-scale control of pollutant discharges; (iii) Promote the protection of coral reefs, mangroves, coastal ecosystem and regional biodiversity by carrying out scientific plans for resource use based on marine system functions; (iv) Strictly enforce regulations relating to the marine environment and fisheries from June to August in each year; (v) More research about the waste warm water from the Nuclear Power Plants for effecting the ecosystem of Daya Bay should be carried out.
6. Acknowledgements
This research was supported by the project of knowledge innovation program of Chinese Academy of Sciences (No. KZCX2-YW-Q07-02, No. KSCX2-SW-132, KSCX2-SW-214), the National Natural Science Foundation of China (No. 41076070), the key projects in the National Science & Technology Pillar Program in the Eleventh Five-year Plan Period (No. 2009BADB2B0606) and the National 908 project (No. 908-02-04-04).
7. References
Bellwood. D. R., Hughes. T.P., Folke, C. & Nystrom, M., 2004. Confronting the coral reef crisis. Nature, 429, 827-833.
Bodergat, A.M., Oki, K., Ishizaki, K., and Rio, M., 2003. Impact of volcanism, human activities, and water mass circulation on the distribution of ostracod populations in Kagoshima Bay (Kyushu Island, southern Japan). Comptes Rendus Geosciences, 334(14), 1053-1059.
www.intechopen.com
Effects of the Operating Nuclear Power Plant on Marine Ecology and Environment - A Case Study of Daya Bay in China
287
Burger, J., 2003. Perceptions about environmental use and future restoration of an urban estuary. Journal of Environmental Planning and Management, 46(3), 399-416.
Buzzelli, C.P., 1998. Dynamic simulation of littoral zone habitats in lower Chesapeake Bay: ecosystem characterization related to model development. Estuaries, 21, 659-672.
Chen, H., Miao, S., Wang, H., and Xu, Y.M., 1999. A study on syn-ecology of mangrove at Daya Bay, China. Chinese Journal of Guangzhou Normal University, 20(2), 90-94.
Cloern, J.E., 1996. Phytoplankton bloom dynamics in coastal ecosystems: a review with some general lessons from sustained investigation of San Francisco Bay, California. Reviews of Geophysics, 34(2), 127-168.
Dauer, D.M., Alden, R.W., 1995. Long-term trends in the macrobenthos and water quality of the Lower Chesapeake Bay (1985-1991). Marine Polluton Bulletin 30(12): 840-850.
Fisher, T.R., 1991. Phytoplankton, nutrient and turbiding in the Chesapeake, Delaware and Hudson estuarine. Estuarine, Coastal and Shelf Science, 32, 187-206.
Han, W.Y., 1991. Carbon cycles of Daya Bay and the Preal River. Science Press, Beijing, China, p12-42.
Hansom, J.D., 2001. Coastal sensitivity to environmental change: a view from the beach. CATENA, 42(2), 291-305.
Hens, L., Nierynck, E., Van, Y T., Quyen, N.H., Hien, L.T.T., An, L.D., 2000. Land cover changes in the extended HA long city area, North-Eastern Vietnam during the period 1988-1998. Environment, Development and Sustainability, 2(3-4), 235-252.
Huang, L., Chen, Q., and Yuan, W., 1989. Characteristics of chlorophyll distribution and estimation of primary productivity in Daya Bay, China. Asian Marine Biology, 6, 115-128.
Huang, L., Tan, Y., Song, X., Huang, X., Wang, H., Zhang, S., Dong, J., and Chen, R., 2003. The status of the ecological environment and a proposed protection strategy in Sanya Bay, Hainan Island, China. Marine Pollution Bulletin, 47(1-6), 180-186.
Johnson, R. A., Wichern, D. W., 1998. Applied multivariate statistical analysis. Prentice Hall, New York.
Justice, D., Rabalais, N.N., Turner, R.E., and Dortch, Q., 1995. Change in nutrient structure of river-dominated coastal waters: stoichiometric nutrient balance and its consequences. Estuarine, Coastal and Shelf Science, 40, 339-356.
Kerr R.A., 2010. Ocean acidification unprecedented, unsettling. Science, 328, 1500-1501. Kont, A., Jaagus, J., Aunap, R., 2003. Climate change scenarios and the effect of sea-level rise
for Estonia. Global and Planetary Change, 36(1), 1-15. Lian, G.S., Lin, Y.H., Cai, B.J., Lin, M., Dai, Y.Y., and Lin, J.H., 1990. Characteristics of
zooplankton community in Daya Bay. In: Third Institute of Oceanology, State Oceanic administration (eds), Collections of papers on marine ecology in the Daya Bay (II). China Ocean Press, Beijing, China, p274-281.
Lin, W.Q., and Li, S.Y., 2003. Three-D water quanity mathematical simulation of COD, DO, inorganic phosphorus and organic phosphorus in the Pearl River Estuary. Acta Oceanologica Sinica (in Chinese), 25(3), 129-137.
Mu, X.Y., Yang, Y.L., Li, C.Y., Yin, X.C., Jia, J.J., and Xue, Y.C., 1999. Eenvironmental characteristics of seawater in the Yuehu inlet Rongcheng Bay, China. Chinese Journal of Qingdao University, 14(4), 57-59.
Mumby, P. J., Edwards, A. J., Ernesto Arias-Gonzalez, J., Lindeman, K. C., Blackwell, P. G., Gall, A., Gorczynska, M. I., Harborne, A. R., Pescod, C. L., Renken, H., Wabnitz, C.
www.intechopen.com
Nuclear Power – Deployment, Operation and Sustainability
288
C. C., Llewellyn, G., 2004. Mangroves enhance the biomass of coral reef fish communities in the Caribbean. Nature, 427, 533-536.
Olivieri, R.A., Chavez, F.P., 2000. A model of plankton dynamics for the coastal upwelling system of Monterey Bay, California. Deep-Sea Research II, 47, 1077-1106.
Pearson, H., 2005. Scientists seek action to fix Asia’s ravaged ecosystems. Nature, 433, 94. Peng, Y.H,Chen, H.R.,Pan, M.X., Huang, H.H.,Gao, H.L.2001. The primary production and
potential fishery production in the sea area around the Daya Bay Nuclear Power Station before and after the operation of DBNPS. Journal of Fisheries China (in Chinese), 25 (2), 161-165.
Shen, Z.-L., 2001. Historical changes in nutrient structure and its influences on phytoplantkon composition in Jiaozhou Bay. Estuarine, Coastal and Shelf Science, 52, 211-224.
Sohma, A., Sekiguchi, Y., Yamada, H., Sato, T., and Nakata, K., 2001. A new coastal Marine ecosystem model study coupled with hydrodynamics and tidal flat ecosystem effect. Marine Pollution Bulletin, 43(7-12), 187-208.
Sommer, U., Stibor, H., Katechakis, A., Sommer, F., Hansen, T., 2002. Pelagic food web configurations at different levels of nutrient richness and their implications for the ratio fish production: primary production. Hydrobiologia, 484(1-3), 11-20.
Sommer, U., Lengfellner, K., 2008. Climate change and the timing, magnitude, and composition of the phytoplankton spring bloom. Global Change Biology, 14(6), 1199-1208.
Souissi, S., Daly Yahia-Kéfi, O., 2000. Spatial characterization of nutrient dynamics in the Bay of Tunis (south-western Mediterranean) using multivariate analyses: consequences for phyto- and zooplankton distribution. Journal of Plankton Research 22(11), 2039-2059.
Souter, D.W., and Linden, O., 2000. The health and future of coral reef systems. Ocean and Coastal Management, 43(8), 657-688.
Tagliani, P.R.A., Landazuri, H., Reis, E.G., Tagliani, C,R., Asmus ML, Sanchez-Arcilla A., 2003. Integrated coastal zone management in the Patos Lagoon estuary: perspectives in context of developing country. Ocean and Coastal Management, 46(9), 807-822.
Tang, D.L., Kester, D.R., Wang, Z.D., Lian, J.S., Kawamura, H., 2003. AVHRR satellite remote sensing and shipboard measurements of the thermal plume from the Daya Bay, nuclear power station, China. Remote Sensing of Environment, 84, 506-515.
Turner, R.E., Rabalais, N.N., 1994. Coastal eutrophication near the Mississippi River delta. Nature, 368, 619-621.
Wang, Y. S., Wang, Z.D., Huang, L.M., 2003. Changes in the ecological environment of Daya Bay and the trends in recent 20 years, [in:] Chinese Ecosystem Research Network (CERN), Center of Chinese Ecosystem Research Network (eds.), Proc. 11th Chinese Ecosystem Research Network, Sanya, China, 606-614.
Wang, Y.S., Xu, J.R., Dong, J.D., Jiang, H.C., 2004. Ecological environment characteristics of thermocline and its kinetic mechanism in Daya Bay. In: Center of Chinese Ecosystem Research Network (eds), Collections of chinese ecosystem research. Proc 12th Chinese Ecosystem Research Network, Changsha, China, p 226-231.
www.intechopen.com
Effects of the Operating Nuclear Power Plant on Marine Ecology and Environment - A Case Study of Daya Bay in China
289
Wang, Y.S., Lou, Z.P., Sun, C.C., Wu, M.L., Han, S.H., 2006. Multivariate statistical analysis of water quality and phytoplankton characteristics in Daya Bay, China, from 1999 to 2002. Oceanologia, 48 (2), 193-211.
Wang, Y.S., Lou, Z.P., Sun, C.C., Sun, S., 2008. Ecological environment changes in Daya Bay, China, from 1982 to 2004. Marine Pollution Bulletin. 56(11), 1871-1879.
Wang Y.S., Sun C.C., Lou Z.P. et al. Identification of water quality and benthos characteristics in Daya Bay, China, from 2001 to 2004. Oceanological and Hydrobiological Studies, 2011, 40(1), 82-95.
Wei G. F., Wang Z. D., Lian J. S., 2003. Succession of the dominant phytoplankton species in spring 2000 in at Dapeng’Ao cove, Daya Bay. Acta Ecologica Sinica (in Chinese), 32(11), 2285-2296.
Wen, W.Y., Zou, R.L., Du, W.C., Huang, X.P., Zheng, Q.H., Zhang, G.X., Liang, Z.Q., Li, T.S., 1996. Impacts of warm effluent from the Dayawan nuclear power plant on stony coral community I. Stony community before the operation of the nuclear power plant. In: Pian, J.P., Cai, G.X. (eds), Annual research reports of MBRS(I). Science Press, Beijing, China, p18-22.
Wu, M.L., Wang, Y.S., 2007. Using chemometrics to evaluate anthropogenic effects in Daya Bay, China. Estuarine, Coastal and Shelf Science, 72, 732-742.
Wu, M.L., Wang, Y.S., Sun, C.C., Wang, H., Lou, Z.P., Dong, J.D., 2009a. Identification of water quality by using chemometrics in Daya Bay, China, Oceanologia 51 (2), 217–232.
Wu, M.L., Wang, Y.S., Sun, C.C., Wang, H., Dong, J.D., Han, S.H., 2009b, Identification of anthropogenic effects and seasonality on water quality in Daya Bay, South China Sea, Journal of Environmental Management, 90, 3082-3090.
Wu, M.L., Wang, Y.S., Sun, C.C., Wang, H., Dong, J.D., Yin, J.P., Han, S.H., 2010. Identification of coastal water quality by statistical analysis methods in Daya Bay, South China Sea. Marine Pollution Bulletin, 60, 852-860.
Xue, C., 2002. The impact of human activities on mangrove coast of Kosrae Island, the federated states of Micronesia. Transaction of Oceanology and Limnology (in Chinese), 2, 17-23
Xu, G.Z., 1989. Environments and resources of Daya Bay. Anhui Scienctific and Technical Publishers, HeFei, China, p 8-9, 10-16.
Yanez-Arancibia, A., Lara-Dominguez, A.L., Rojas Galaviz, J.L., Zarate Lomeli, D.J., Villalobos Zapata, G.J, Sanchez-Gil, P., 1999. Integrating science and management on coastal marine protected areas in the Southern Gulf of Mexico. Ocean & Coastal Management, 42,319-344.
Yang, Q.L., 1990. Ecologic characteristics of phytoplankton community in Daya Bay. In: Third Institute of Oceanology, State Oceanic administration (eds), Collections of papers on marine ecology in the Daya Bay (II). China Ocean Press, Beijing, China, p 266-273.
Yin, K., Qian, P.Y., Wu, M.C.S., Chen, J.C., Huang, L., Song, X., Jian, W.J., 2001. Shift from P to N limitation of phytoplankton biomass across the Pearl River Estuarine plume during summer. Marine Ecological Progress Series, 201, 65-79.
Yin K., 2003. Influence of monsoons and oceanographic processes on red tides in Hong Kong waters. Marine Ecology Progress Series, 262, 27-41.
www.intechopen.com
Nuclear Power – Deployment, Operation and Sustainability
290
Yung, Y. K., Wong, C.K., Yau, K., Qian, P.Y., 2001. Long-term Changes in Water Quality and Phytoplankton Characteristics in Port Shelter, Hong Kong, from 1988-1998. Marine Pollution Bulletin, 42(10), 981-992.
Zang, M.C., 1993. Nuclear power programs in China. Atomwirtschaft-Atometechnik (in German), 38(6), 419-420.
Zhao, S.J., Jiao, N.Z., Wu C.W., Liang, B., Zhang, S.Y., 2005. Evolution of nutrient structure and phytoplankton composition in the Jiaozhou Bay ecosystem. Chinese Joumal of Environmental Sciences, 17(1), 95-l02.
Zheng, Q.H., He, Y.Q., Zhang, G.X., 2001. Impacting on the ecological environment and marine organism by waster water discharged to the sea in Daya Bay. In Pian, J.P., Wang, Z.D., Wu, X.Z. (eds), Annual research reports of MBRS (III): Science Press, Beijing, China, p10-15.
Zhang, Q.M., 2001. Status of tropical biological coasts of China: implications on ecosystem restoration and resconstruction. Ocenaologia and Limnologia Sinica (in Chinese), 32(4), 454-464.
Zhang, Y.L., Zhou, R.L., 1987. Community structure of shallow water stony corals in Daya Bay. Chinese Journal of Tropical Oceanography, 6(1), 12-18.
Zhong, Z.X., Huang, Y.Y., Zhang, H.D., 1999. Research on primary productivity quantitative parameters and structure of mangrove community in Daya Bay of Guangdong Province. Scientia Silvae Sinicae, 35(2), 26-30.
Zorini, L.O., Contini, C., Jiddawi, N., Ochiewo, J., Shunula, J., Cannicci, S., 2004. Participatory appraisal for potential community-based mangrove management in East Africa. Wetlands Ecology and Management, 12(2), 8 7-102
Zhou, J.K., 1984. Factor analysis of the distributive relationship of the fish numbers in the Jiaozhou Bay. Marine Science Bulletin (in Chinese), 3(3), 58-67.
www.intechopen.com
Nuclear Power - Deployment, Operation and SustainabilityEdited by Dr. Pavel Tsvetkov
ISBN 978-953-307-474-0Hard cover, 510 pagesPublisher InTechPublished online 09, September, 2011Published in print edition September, 2011
InTech EuropeUniversity Campus STeP Ri Slavka Krautzeka 83/A 51000 Rijeka, Croatia Phone: +385 (51) 770 447 Fax: +385 (51) 686 166www.intechopen.com
InTech ChinaUnit 405, Office Block, Hotel Equatorial Shanghai No.65, Yan An Road (West), Shanghai, 200040, China
Phone: +86-21-62489820 Fax: +86-21-62489821
We are fortunate to live in incredibly exciting and incredibly challenging time. Energy demands due toeconomic growth and increasing population must be satisfied in a sustainable manner assuring inherentsafety, efficiency and no or minimized environmental impact. These considerations are among the reasonsthat lead to serious interest in deploying nuclear power as a sustainable energy source. At the same time,catastrophic earthquake and tsunami events in Japan resulted in the nuclear accident that forced us to rethinkour approach to nuclear safety, design requirements and facilitated growing interests in advanced nuclearenergy systems. This book is one in a series of books on nuclear power published by InTech. It consists of sixmajor sections housing twenty chapters on topics from the key subject areas pertinent to successfuldevelopment, deployment and operation of nuclear power systems worldwide. The book targets everyone asits potential readership groups - students, researchers and practitioners - who are interested to learn aboutnuclear power.
How to referenceIn order to correctly reference this scholarly work, feel free to copy and paste the following:
You-Shao Wang (2011). Effects of the Operating Nuclear Power Plant on Marine Ecology and Environment - ACase Study of Daya Bay in China, Nuclear Power - Deployment, Operation and Sustainability, Dr. PavelTsvetkov (Ed.), ISBN: 978-953-307-474-0, InTech, Available from: http://www.intechopen.com/books/nuclear-power-deployment-operation-and-sustainability/effects-of-the-operating-nuclear-power-plant-on-marine-ecology-and-environment-a-case-study-of-daya-

© 2011 The Author(s). Licensee IntechOpen. This chapter is distributedunder the terms of the Creative Commons Attribution-NonCommercial-ShareAlike-3.0 License, which permits use, distribution and reproduction fornon-commercial purposes, provided the original is properly cited andderivative works building on this content are distributed under the samelicense.


