Effects of temperature on reductions in finger blood flow induced by vibration
9
ORIGINAL ARTICLE Effects of temperature on reductions in finger blood flow induced by vibration Ying Ye • Michael J. Griffin Received: 18 February 2010 / Accepted: 28 June 2010 / Published online: 14 July 2010 Ó Springer-Verlag 2010 Abstract Purpose To investigate how temperature influences changes in finger circulation induced by hand-transmitted vibration in healthy subjects, and the variability in indi- vidual response to both vibration and temperature. Methods With two room temperatures (20 and 28°C), finger blood flow (FBF) and finger skin temperature (FST) were measured on the left middle fingers of 12 subjects at 1-min intervals during three successive 10-min periods. A 5-N static force was applied throughout the 30-min period, and sinusoidal 125-Hz vibration at 44 ms -2 rms. (unweighted) was applied to the right hand during the second of the three 10-min periods. Results Before exposure to vibration, both FBF and FST were greater with the higher room temperature. Finger blood flow in the left hand reduced during vibration of the right hand. The reduction in absolute FBF differed between the two room temperatures, but the percentage reduction in FBF relative to FBF before exposure to vibration was similar. After cessation of vibration, there was continued reduction in FBF with both room temperatures. Before and after vibration exposure, the FST was correlated with FBF and the FBF and FST at 20°C were correlated with the FBF and FST at 28°C. Conclusions Vibration of one hand can reduce finger blood flow and skin temperature on the unexposed hand, with the reduction dependent on temperature. The absolute reduction in FBF was greater with the higher room temperature, but the percentage reduction in FBF relative to FBF before vibration exposure was similar. Those with greater finger blood flow before vibration tend to have greater blood flow during vibration, and those with greater finger blood flow with one temperature tend to have greater blood flow with another temperature. Keywords Hand-transmitted vibration Á Vibration-induced white finger Á Hand-arm vibration syndrome Á Finger blood flow Á Temperature Introduction The prolonged use of hand-held vibratory tools is associ- ated with various disorders in the fingers, hands, and arms known as the hand-arm vibration syndrome. One common symptom is impaired circulation in the fingers, often observed as whitening during or following exposure to cold. The condition, vibration-induced white finger (VWF), is characterised by attacks of blanching that are provoked by cold but arise from damage caused by vibration. Although it is clear that hand-transmitted vibration causes vibration-induced white finger, the mechanisms involved in the heightened sensitivity to cold are not known, and there is uncertainty over methods of evaluating the severity of occupational exposures to vibration (Griffin 1997, 2003; Matikainen et al. 1987; Bovenzi et al. 2008). The current International Standard, ISO 5349-1:2001, assumes that the vascular damage is dependent on the magnitude and fre- quency of vibration and the hours and years of regular daily use of vibrating tools (International Organization for Standardization 2001). Acute exposures to vibration have been used in experi- mental studies of humans and animals to elucidate the Y. Ye Á M. J. Griffin (&) Human Factors Research Unit, Institute of Sound and Vibration Research, University of Southampton, Southampton SO17 1BJ, UK e-mail: M.J.Griffi[email protected] 123 Int Arch Occup Environ Health (2011) 84:315–323 DOI 10.1007/s00420-010-0560-0
Transcript of Effects of temperature on reductions in finger blood flow induced by vibration

ORIGINAL ARTICLE
Effects of temperature on reductions in finger blood flow inducedby vibration
Ying Ye • Michael J. Griffin
Received: 18 February 2010 / Accepted: 28 June 2010 / Published online: 14 July 2010
� Springer-Verlag 2010
Abstract
Purpose To investigate how temperature influences
changes in finger circulation induced by hand-transmitted
vibration in healthy subjects, and the variability in indi-
vidual response to both vibration and temperature.
Methods With two room temperatures (20 and 28�C),
finger blood flow (FBF) and finger skin temperature (FST)
were measured on the left middle fingers of 12 subjects at
1-min intervals during three successive 10-min periods. A
5-N static force was applied throughout the 30-min period,
and sinusoidal 125-Hz vibration at 44 ms-2 rms.
(unweighted) was applied to the right hand during the
second of the three 10-min periods.
Results Before exposure to vibration, both FBF and FST
were greater with the higher room temperature. Finger
blood flow in the left hand reduced during vibration of the
right hand. The reduction in absolute FBF differed between
the two room temperatures, but the percentage reduction in
FBF relative to FBF before exposure to vibration was
similar. After cessation of vibration, there was continued
reduction in FBF with both room temperatures. Before and
after vibration exposure, the FST was correlated with FBF
and the FBF and FST at 20�C were correlated with the FBF
and FST at 28�C.
Conclusions Vibration of one hand can reduce finger
blood flow and skin temperature on the unexposed hand,
with the reduction dependent on temperature. The absolute
reduction in FBF was greater with the higher room
temperature, but the percentage reduction in FBF relative
to FBF before vibration exposure was similar. Those with
greater finger blood flow before vibration tend to have
greater blood flow during vibration, and those with greater
finger blood flow with one temperature tend to have greater
blood flow with another temperature.
Keywords Hand-transmitted vibration �Vibration-induced white finger � Hand-arm
vibration syndrome � Finger blood flow � Temperature
Introduction
The prolonged use of hand-held vibratory tools is associ-
ated with various disorders in the fingers, hands, and arms
known as the hand-arm vibration syndrome. One common
symptom is impaired circulation in the fingers, often
observed as whitening during or following exposure to
cold. The condition, vibration-induced white finger (VWF),
is characterised by attacks of blanching that are provoked
by cold but arise from damage caused by vibration.
Although it is clear that hand-transmitted vibration causes
vibration-induced white finger, the mechanisms involved in
the heightened sensitivity to cold are not known, and there
is uncertainty over methods of evaluating the severity of
occupational exposures to vibration (Griffin 1997, 2003;
Matikainen et al. 1987; Bovenzi et al. 2008). The current
International Standard, ISO 5349-1:2001, assumes that the
vascular damage is dependent on the magnitude and fre-
quency of vibration and the hours and years of regular daily
use of vibrating tools (International Organization for
Standardization 2001).
Acute exposures to vibration have been used in experi-
mental studies of humans and animals to elucidate the
Y. Ye � M. J. Griffin (&)
Human Factors Research Unit,
Institute of Sound and Vibration Research,
University of Southampton, Southampton SO17 1BJ, UK
e-mail: [email protected]
123
Int Arch Occup Environ Health (2011) 84:315–323
DOI 10.1007/s00420-010-0560-0

mechanisms underlying the adverse effects of vibration on
digital blood circulation. Such studies are difficult because
the control of digital circulation is complex and influenced
by various individual and environmental factors. Experi-
mental studies have explored the effects on finger blood
flow of the magnitude of vibration (Bovenzi et al. 1999),
the frequency of vibration (Bovenzi et al. 2000), and the
duration of vibration (Bovenzi et al. 1998) in controlled
room temperatures. Although environmental temperature
influences peripheral circulation (Harada et al. 1998;
Mirbod et al. 1998), the relation between room tempera-
ture, finger circulation and the vasoconstriction caused by
hand-transmitted vibration is not known.
Experimental studies have shown that the normal
response to hand-transmitted vibration is a reduction in
finger blood flow in both vibration-exposed fingers and in
fingers on an unexposed contralateral hand (Bovenzi et al.
1998, 1999, 2000, 2006, Griffin et al. 2006). It has been
hypothesised that the vasoconstriction in an unexposed
finger is due to a central sympathetic vasomotor reflex
(Bovenzi et al. 2000). It can be difficult to measure blood
flow in vibrated fingers, with the potential for artefacts
increasing with increasing magnitude of vibration and
increasing force of contact between the hand and the source
of vibration. Since a similar vasoconstriction pattern is
found in digital vessels of the contralateral hand, in the
study described here the digital hemodynamics during and
after vibration exposure were monitored by measuring
finger blood flow (FBF) and finger skin temperature (FST)
in fingers not exposed to vibration.
Both the chronic and the acute responses to hand-
transmitted vibration depend on the frequency of vibration
(Farkilla and Pyykko 1979; Bovenzi et al. 2000). This
study used vibration at a frequency of 125 Hz, widely
believed to be capable of causing vibration-induced white
finger (e.g. Hyvarinen et al. 1973). Experimental studies
have shown large reductions in finger blood flow during
and after exposure to this frequency of vibration (Farkilla
and Pyykko 1979; Bovenzi and Griffin 1997). The vibra-
tion in this study was presented with an unweighted
acceleration magnitude of 44 ms-2 rms (5.6 ms-2 rms
when frequency-weighted according to ISO 5349-1:2001).
This magnitude is believed to be capable of causing
vibration-induced white finger after prolonged and regular
exposures, and previous studies have found that it provokes
an immediate vasoconstriction in both exposed and unex-
posed hands (Bovenzi et al. 1999, 2004).
This study investigated how room temperature influences
changes in finger circulation induced by hand-transmitted
vibration in healthy subjects. With two temperatures, it was
hypothesised that vibration of one hand would reduce finger
blood flow on the other (unexposed) hand by either the
same absolute amount or by the same percentage of the
pre-exposure finger blood flow. The study also investigated
the manner in which the reduction in finger blood flow
caused by vibration depends on room temperature and finger
temperature in individual subjects. It was hypothesised that
subjects who had greater finger blood flow with one room
temperature would have a greater blood flow with the other
room temperature, both before vibration exposure and when
the vibration stimulus was applied.
Methods
Subjects
Twelve healthy male volunteers with a mean age of 27.8
(SD: 1.2; range: 25–31) years participated in the study. All
subjects were university students or office workers with no
history of significant (regular or prolonged) exposure to
hand-transmitted vibration in occupational or leisure
activities. They completed a health questionnaire, read a
list of medical contraindications, and gave their written
informed consent to the study. No subject reported car-
diovascular or neurological disorders, connective-tissue
diseases, injuries to the upper extremities, or a history of
cold hands. All subjects were non-smokers. The mean
stature of the subjects was 176 (SD: 4.7; range: 170–183)
cm, the mean weight was 75 (SD: 10.2; range: 55–87) kg,
and the mean BMI was 24.1 (SD: 1.8; range: 19.0–26.8).
The length, width, and depth of each phalanx was mea-
sured using vernier callipers and the finger volume was
calculated: the mean volume of the left middle finger was
15.2 (SD: 3.1) cm3.
The study was approved by the Human Experimentation
Safety and Ethics Committee of the Institute of Sound and
Vibration Research at the University of Southampton.
Measurement of finger blood flow
Finger blood flow (FBF) was measured in the left middle
finger by a strain gauge plethysmographic technique. A
mercury-in-silicon strain gauge was placed around the
finger at the base of the finger nail, and a plastic pressure
cuff for air inflation was placed around the proximal pha-
lanx. The pressure cuff and strain gauge were connected to
a plethysmograph (HVLab Multi-channel, University of
Southampton).
The FBF was measured with a venous occlusion
method. The pressure cuffs were inflated to a pressure of
60 mm Hg (8.0 kPa), and the consequent rise in finger tip
volume was detected by means of the strain gauge
according to the criteria given by Greenfield et al. (1963).
The FBF measurements were expressed as millilitres per
100 millilitres per second (ml/100 ml/s).
316 Int Arch Occup Environ Health (2011) 84:315–323
123

Finger skin temperature (FST) was measured using
k-type thermocouples attached by micro pore tape to the
distal phalanx of the left middle finger. The room tem-
perature was measured by a mercury-in-glass thermometer
to an accuracy of ±0.5�C. The thermometer was located
adjacent to the head of the subject.
Vibration
All four fingers of the right hand were exposed to the
vertical vibration of a horizontal wooden platform mounted
to metal plate screwed to a Huntleigh force cell secured to
the table of an electrodynamic vibrator (VP4, Derritron).
The force cell provided visual feedback of the downward
force applied by the hand of the subject. The vibration was
monitored by an Entran 233E accelerometer attached to the
metal plate supported on the force cell. The arrangement
for controlling contact force and for generating and moni-
toring the vibration is shown in Fig. 1.
Sinusoidal 125-Hz vertical vibration was produced at an
acceleration magnitude of 44 ms-2 rms (unweighted)
during a 10-min vibration exposure period. This corre-
sponds to a frequency-weighted vibration magnitude of
5.6 ms-2 rms when using the frequency weighting Wh in
current standards (ISO 5349-1: 2001).
Experimental protocol
The experiment was performed in a small laboratory with
two different room temperatures (20 ± 1�C and 28 ± 1�C)
on two separate days, with the order of conditions balanced
over the 12 subjects. The subjects were requested to avoid
consuming caffeine for 2 h and alcohol for 12 h prior to
testing.
Each of the 12 subjects attended the laboratory on two
occasions. In each session, they experienced three succes-
sive experimental periods of 10 min: (1) pre-exposure
period (with a 5-N downward force and no vibration); (2)
vibration period (with 5-N force and 125-Hz vibration at
44 ms-2 rms); (3) recovery period (with 5-N force and no
vibration).
Throughout each session, subjects lay supine with both
hands resting on platforms alongside their body at heart
level. Initially, subjects acclimatised to the environment for
15–20 min. Subsequently, the FBF and FST of the middle
left finger were measured at 1-min intervals during the
30-min experiment session, with the room temperature also
recorded every minute.
Statistical methods
Data analysis was performed using the software package
SPSS (version 15.0). The data were summarised with the
median as a measure of central tendency and the inter-
quartile range (IQR) as a measure of dispersion. Non-
parametric tests (Friedman test for k-related samples, the
Wilcoxon matched-pairs signed ranks test for two-related
samples and the Spearman rank correlation) were
employed in the statistical analysis.
The Friedman test was used to test for differences within
and between the sets of finger blood flow measurements
during the 10-min pre-exposure period, the 10-min vibra-
tion period, and the 10-min recovery period. The Wilcoxon
matched-pairs signed ranks test was used to investigate
differences in the median finger blood flow between the
three 10-min periods. The criterion for statistical signifi-
cance was p \ 0.05.
Results
Room temperature
In the two sessions, the temperature in the laboratory was
either in the range 19.8–20.7�C or in the range 27.6–
28.9�C. Within the two conditions, the room temperature
did not change significantly during the 30-min sessions (at
20�C, p = 0.321; at 28�C, p = 0.156; Friedman).
Finger skin temperature
Throughout the 30-min experimental period, the median
finger skin temperature was lower with the 20�C room
temperature than with the 28�C room temperature (Fig. 2).
Before exposure to vibration, finger skin temperature
varied between subjects and was in the range 27.2–33.6�C
with the room temperature at 20�C, and in the range 29.4–
35.2�C with the room temperature at 28�C. The sets of ten
measures of finger skin temperature did not differ during
the pre-exposure period (20�C, p = 0.286; 28�C,
p = 0.604; Friedman) or during the recovery period (20�C,
p = 0.552; 28�C, p = 0.336; Friedman). There was aFig. 1 Arrangement for generation of vibration and control of
contact force
Int Arch Occup Environ Health (2011) 84:315–323 317
123

significant reduction in finger skin temperature over the 10
measures of finger skin temperature obtained during the
vibration exposure period (20�C, p = 0.003; 28�C,
p \ 0.001). At both room temperatures, the median finger
skin temperature differed between the three 10-min periods
(pre-exposure, vibration, and recovery). The median finger
skin temperatures during the pre-exposure periods were
significantly higher than during the vibration exposure
periods (20�C, p = 0.011; 28�C, p = 0.002; Wilcoxon)
and higher than during the recovery periods (20�C,
p = 0.008; 28�C, p = 0.003; Wilcoxon). The vibration of
the right hand therefore induced a significant reduction in
FST in the middle finger on the unexposed left hand,
although less pronounced than the reductions in FBF (see
below).
Finger blood flow
The median FBF measured every minute before, during,
and after vibration exposure with the two room tempera-
tures is shown in absolute units (ml/100 ml/s) in Fig. 3 and
as the %FBF (where 100% is the median FBF of each
subject during the pre-exposure period) in Fig. 4.
The median FBF and the inter-quartile ranges (IQR) of
the FBF in the two room temperatures are shown in Fig. 5.
With both room temperatures, vibration of the right
hand provoked an immediate reduction in finger blood flow
in the non-vibrated left finger compared with FBF during
the pre-exposure period (p \ 0.001; Wilcoxon). The
median reduction in absolute FBF was strongly dependent
on the room temperature: at 20�C the reduction was
0.40 ml/100 ml/s (a reduction of 57%) whereas with 28�C
the reduction was 0.76 ml/100 ml/s (a reduction of 52%).
Here, the percentage reduction is expressed relative to the
median FBF prior to vibration exposure in each session (at
20�C or 28�C) considered separately. There was a signifi-
cant difference in the reduction in absolute FBF between
the two room temperatures (p \ 0.001; Wilcoxon), but no
significant difference in the percentage reduction in FBF
relative to the median pre-exposure FBF (p = 0.436;
Wilcoxon).
With both room temperatures, the median absolute FBF
over the 10-min recovery period was significantly less than
the median FBF during the pre-exposure period
(p \ 0.001; Wilcoxon). With both room temperatures, the
median absolute FBF during the recovery period was also
significantly less than the median FBF during exposure to
vibration (20�C, p = 0.002; 28�C, p = 0.033; Wilcoxon).
30
31
32
33
34
35
36
0 2 4 6 8 10 12 14 16 18 20 22 24 26 28 30
Time (minutes)
FS
T (
ºC)
28ºC
20ºC
Before Vibration After
Fig. 2 Median finger skin temperature (FST) on an unexposed finger
on the left hand before, during, and after 10-min exposures of the
right hand to 125-Hz vibration at 44 ms-2 rms (unweighted)
00.20.40.60.8
11.21.41.61.8
2
0 2 4 6 8 10 12 14 16 18 20 22 24 26 28 30
Time (minutes)
FB
F (
ml/1
00m
l/s)
28ºC
20ºC
Before Vibration After
Fig. 3 Median finger blood flow (FBF) in an unexposed finger of the
left hand in room temperatures of 20 and 28�C before, during, and
after 10-min exposures of the right hand to 125-Hz vibration at
44 ms-2 rms (unweighted)
0%
20%
40%
60%
80%
100%
120%
140%
Time (minutes)
%F
BF
28ºC
20ºC
0 2 4 6 8 10 12 14 16 18 20 22 24 26 28 30
Before Vibration After
Fig. 4 Median percentage change in finger blood flow (%FBF) in an
unexposed finger of the left hand with room temperatures of 20 and
28�C before, during, and after 10-min exposures of the right hand to
125-Hz vibration at 44 ms-2 rms (unweighted). The percentage
change in FBF is shown relative to median FBF prior to exposure to
vibration
00.20.4
0.60.8
11.21.4
1.61.8
2
FB
F (
ml/1
00m
l/s)
28ºC20ºC
Before Vibration After
Fig. 5 Median and inter-quartile range of finger blood flow (FBF) in
the unexposed finger before, during, and after exposure to vibration
with room temperatures of 20 and 28�C
318 Int Arch Occup Environ Health (2011) 84:315–323
123

The reduction in %FBF during the recovery period did not
show a significant difference between the two room tem-
peratures (p = 0.363, Wilcoxon). The results indicate that
with both room temperatures the 10 min of vibration of the
right hand caused vasoconstriction in the non-vibrated left
finger after the cessation of vibration, and that the FBF was
less after the cessation of vibration than during exposure to
vibration.
Individual and environmental factors
During the pre-exposure period, the median FBF varied
between subjects from 0.94 to 2.07 ml/100 ml/s with the
28�C room temperature and from 0.62 to 1.83 ml/100 ml/s
with the 20�C room temperature. During exposure to
vibration, the median FBF varied between subjects from
0.43 to 1.25 ml/100 ml/s at 28�C and from 0.27 to 0.98 ml/
100 ml/s at 20�C (Fig. 6).
With both room temperatures, the variability in indi-
vidual finger blood flow (standard deviation over the 10
measurements at 1-min intervals) during the vibration
exposure period was correlated with the mean individual
FBF (p \ 0.001, Spearman). Although the coefficient of
variation in FBF within individuals was greater at 28�C
than at 20�C (p = 0.014, Wilcoxon), there was no corre-
lation between the individual coefficients of variation at the
two temperatures (p = 0.796, Spearman).
Before exposure to vibration, the individual FBF was
positively correlated with finger volume (20�C p = 0.013;
28�C p = 0.028, Spearman) and body mass index (BMI)
(20�C p = 0.031; 28�C p = 0.038, Spearman). The cor-
relations between FBF and age were negative, but not
statistically significant (20�C p = 0.061; 28�C p = 0.078,
Spearman). The relationships between FST and finger
volume, BMI and age were similar to those found for FBF.
During exposure to vibration, the absolute reduction in
FBF was positively correlated with finger volume (20�C
p = 0.017; 28�C p = 0.019, Spearman) and BMI (20�C
p = 0.041; 28�C p = 0.022, Spearman). Furthermore, the
percentage reduction in FBF was positively correlated with
finger volume (20�C p = 0.073; 28�C p = 0.038, Spear-
man) and BMI (20�C p = 0.064; 28�C p = 0.047, Spear-
man). The results show that the inter-subject variability in
finger blood flow before and during exposure to vibration,
and the percentage fall in finger blood flow caused by
vibration, were both related to individual characteristics:
the larger subjects had greater finger blood flow prior to
vibration exposure but showed greater reductions in FBF
and %FBF as a result of vibration exposure.
With both room temperatures, the individual FBF during
the pre-exposure period was correlated with individual FST
(p \ 0.001). During the pre-exposure period, both the
individual FBFs and the individual FSTs were correlated
between the two room temperatures 28 and 20�C (FBF:
p \ 0.001; FST: p = 0.006; Spearman; Fig. 7). During
vibration exposure, individual FST was not significantly
correlated with individual FBF at either room temperature
(20�C p = 0.093; 28�C p = 0.067, Spearman). The indi-
vidual FBFs and individual FSTs measured during the
vibration exposure period at one temperature were corre-
lated with the corresponding measure at the other room
temperature (FBF: p = 0.046; FST: p = 0.037, Spearman;
Fig. 7).
The individual FBFs during the pre-exposure period
were correlated with the individual FBFs during vibration
exposure (20�C, p = 0.043; 28�C, p = 0.017, Spearman),
with similar correlations in FST (20�C p = 0.021; 28�C
p = 0.041, Spearman), showing that subjects with high
0
0.5
1
1.5
2
2.5
1 2 3 4 5 6 7 8 9 10 11 12
Subject
FB
F(m
l/100
ml/s
)
Fig. 6 Individual median FBF during 10-min periods in the unex-
posed left finger before and during vibration of the right hand with
room temperatures of 20 and 28�C; open diamond before vibration
(20�C), filled diamond during vibration (20�C), open triangle before
vibration (28�C), filled triangle during vibration (28�)
0
0.5
1
1.5
2
2.5
0 0.5 1 1.5 2 2.5
FBF at 20ºC (ml/100ml/s)
FB
F a
t 28º
C (
ml/1
00m
l/s)
FBF before vibration exposure
FBF during vibration exposure
Fig. 7 Individual median FBF with two room temperatures 20 and
28�C before and during vibration exposure
Int Arch Occup Environ Health (2011) 84:315–323 319
123

FBF or FST before vibration exposure tended to have high
FBF or FST during exposure to vibration (Fig. 8).
The range of inter-subject variability in FBF (from 0.37
to 2.28 ml/100 ml/s at 20�C and from 0.45 to 2.78 ml/
100 ml/s at 28�C) was greater than the mean change in
FBF caused by the 8�C change of temperature (about 30%)
and greater than the 55% reduction in FBF caused by
44 ms-2 rms of 125-Hz vibration. In general, subjects with
greater finger blood flow before vibration had greater FBF
during vibration. Similarly, subjects with greater FBF at
one temperature tended to have greater FBF at the other
temperature.
Discussion
Finger skin temperature
Finger skin temperature in the unexposed finger was
reduced during exposure to vibration at both room tem-
peratures. The FST is often measured when investigating
FBF but previous studies have not always revealed changes
induced by vibration. Bovenzi et al. (1995) reported that
after 30-min exposures to vibration with a frequency of
125 Hz and an acceleration of 87.5 ms-2 rms (unweigh-
ted), FST was significantly reduced during the recovery
period, although the same magnitude of vibration did
not produce significant changes in FST in a later study
(Bovenzi and Griffin 1997).
The present findings show that finger skin temperature is
dependent on the room temperature, consistent with
expectations and with previous studies (e.g., Mirbod et al.
1998). The pre-exposure finger skin temperature was
greater with the higher room temperature. The human body
controls the body core temperature partly by regulating
skin temperature according to the environmental tempera-
ture. When the external environment is cold, dermal blood
vessels constrict causing the warm blood to bypass the skin
and allow the skin temperature to drop towards the tem-
perature of the environment. During exposure to vibration,
reduced blood flow would lead to reduced finger skin
temperature. After the cessation of vibration, the finger
skin temperature remained reduced, consistent with the
continued reduction in finger blood flow.
Finger blood flow
Acute exposure of one hand to vibration at a frequency of
125 Hz and a magnitude of 44 ms-2 rms (a frequency-
weighted acceleration magnitude of 5.6 ms-2 rms) reduced
finger blood flow in the middle finger of the hand not
exposed to vibration. This is consistent with previous
studies: finger blood flow in exposed and unexposed fingers
has been reduced by 125-Hz vibration at magnitudes in the
range of 0.69–7.75 ms-2 rms (weighted) (Bovenzi et al.
1999), and with the 5.6 ms-2 rms vibration used here
(Bovenzi et al., 2004). In the previous studies, the digital
circulatory response to vibration has been measured at
various locations, using a variety of methods and indicated
varying patterns of responses. Some studies have found
that vibration decreases finger blood flow during vibration
exposure (e.g. Bovenzi et al. 2000; Egan et al. 1996; Furuta
et al. 1991; McKenna et al. 1994). In these studies, the
whole FBF has been measured using venous occlusion
plethysmography. In contrast, studies of isolated prepara-
tions of arteries and veins have found that vibration can
depress the contractile force of smooth muscle (e.g. Ljung
and Sivertsson 1975; Lindblad et al. 1986), suggesting
vibration could inhibit the smooth muscle activity in
arteries and thereby increase their diameter and cause
vasodilation. Animal experiments by Liedtke and Schmid
(1969) and Ohhashi and Ikomi (1990) found a decrease in
total vascular resistance in vibrated intact limbs of dogs,
which also implies the vasodilation during vibration
exposure. Some experimental studies in humans have
found vasodilation in blood vessel during vibration expo-
sure (e.g. Mahbub et al. 2006; Nakamura et al. 1996). In
these studies, finger blood flow was obtained using a blood
flow meter that measured blood flow from the dorsal skin.
Mahbub and Harada (2008) has reported that vibration can
produce a different response in palmar and dorsal skin,
causing vasoconstriction on the palmar side and vasodila-
tion on the dorsal side of hand.
Reflex control of digital blood flow is considered to be
mediated through sympathetic vasoconstriction and vaso-
dilation (Fox and Edholm 1963; Roddie 1983). The finding
0
0.5
1
1.5
2
2.5
0 0.5 1 1.5 2 2.5
FBF before vibration (ml/100ml/s)
FB
F d
urin
g vi
brat
ion
(ml/1
00m
l/s)
28ºC
20ºC
Fig. 8 Individual median FBF before and during vibration with room
temperatures of 20 and 28�C
320 Int Arch Occup Environ Health (2011) 84:315–323
123
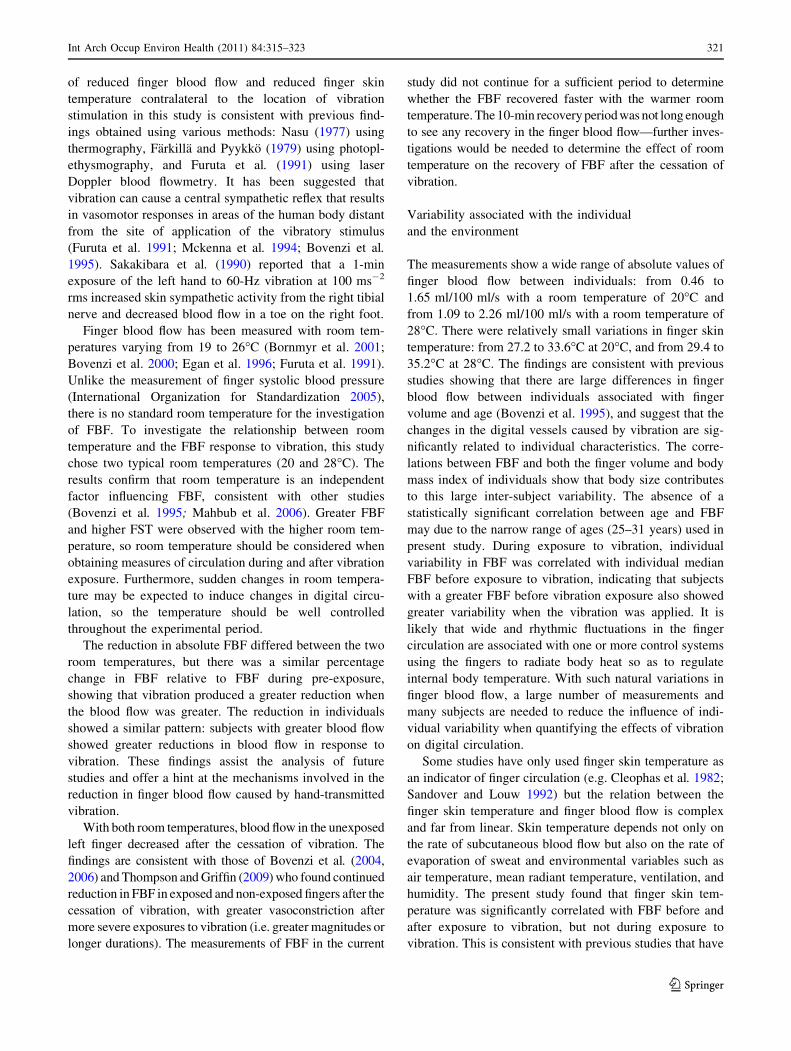
of reduced finger blood flow and reduced finger skin
temperature contralateral to the location of vibration
stimulation in this study is consistent with previous find-
ings obtained using various methods: Nasu (1977) using
thermography, Farkilla and Pyykko (1979) using photopl-
ethysmography, and Furuta et al. (1991) using laser
Doppler blood flowmetry. It has been suggested that
vibration can cause a central sympathetic reflex that results
in vasomotor responses in areas of the human body distant
from the site of application of the vibratory stimulus
(Furuta et al. 1991; Mckenna et al. 1994; Bovenzi et al.
1995). Sakakibara et al. (1990) reported that a 1-min
exposure of the left hand to 60-Hz vibration at 100 ms-2
rms increased skin sympathetic activity from the right tibial
nerve and decreased blood flow in a toe on the right foot.
Finger blood flow has been measured with room tem-
peratures varying from 19 to 26�C (Bornmyr et al. 2001;
Bovenzi et al. 2000; Egan et al. 1996; Furuta et al. 1991).
Unlike the measurement of finger systolic blood pressure
(International Organization for Standardization 2005),
there is no standard room temperature for the investigation
of FBF. To investigate the relationship between room
temperature and the FBF response to vibration, this study
chose two typical room temperatures (20 and 28�C). The
results confirm that room temperature is an independent
factor influencing FBF, consistent with other studies
(Bovenzi et al. 1995; Mahbub et al. 2006). Greater FBF
and higher FST were observed with the higher room tem-
perature, so room temperature should be considered when
obtaining measures of circulation during and after vibration
exposure. Furthermore, sudden changes in room tempera-
ture may be expected to induce changes in digital circu-
lation, so the temperature should be well controlled
throughout the experimental period.
The reduction in absolute FBF differed between the two
room temperatures, but there was a similar percentage
change in FBF relative to FBF during pre-exposure,
showing that vibration produced a greater reduction when
the blood flow was greater. The reduction in individuals
showed a similar pattern: subjects with greater blood flow
showed greater reductions in blood flow in response to
vibration. These findings assist the analysis of future
studies and offer a hint at the mechanisms involved in the
reduction in finger blood flow caused by hand-transmitted
vibration.
With both room temperatures, blood flow in the unexposed
left finger decreased after the cessation of vibration. The
findings are consistent with those of Bovenzi et al. (2004,
2006) and Thompson and Griffin (2009) who found continued
reduction in FBF in exposed and non-exposed fingers after the
cessation of vibration, with greater vasoconstriction after
more severe exposures to vibration (i.e. greater magnitudes or
longer durations). The measurements of FBF in the current
study did not continue for a sufficient period to determine
whether the FBF recovered faster with the warmer room
temperature. The 10-min recovery period was not long enough
to see any recovery in the finger blood flow—further inves-
tigations would be needed to determine the effect of room
temperature on the recovery of FBF after the cessation of
vibration.
Variability associated with the individual
and the environment
The measurements show a wide range of absolute values of
finger blood flow between individuals: from 0.46 to
1.65 ml/100 ml/s with a room temperature of 20�C and
from 1.09 to 2.26 ml/100 ml/s with a room temperature of
28�C. There were relatively small variations in finger skin
temperature: from 27.2 to 33.6�C at 20�C, and from 29.4 to
35.2�C at 28�C. The findings are consistent with previous
studies showing that there are large differences in finger
blood flow between individuals associated with finger
volume and age (Bovenzi et al. 1995), and suggest that the
changes in the digital vessels caused by vibration are sig-
nificantly related to individual characteristics. The corre-
lations between FBF and both the finger volume and body
mass index of individuals show that body size contributes
to this large inter-subject variability. The absence of a
statistically significant correlation between age and FBF
may due to the narrow range of ages (25–31 years) used in
present study. During exposure to vibration, individual
variability in FBF was correlated with individual median
FBF before exposure to vibration, indicating that subjects
with a greater FBF before vibration exposure also showed
greater variability when the vibration was applied. It is
likely that wide and rhythmic fluctuations in the finger
circulation are associated with one or more control systems
using the fingers to radiate body heat so as to regulate
internal body temperature. With such natural variations in
finger blood flow, a large number of measurements and
many subjects are needed to reduce the influence of indi-
vidual variability when quantifying the effects of vibration
on digital circulation.
Some studies have only used finger skin temperature as
an indicator of finger circulation (e.g. Cleophas et al. 1982;
Sandover and Louw 1992) but the relation between the
finger skin temperature and finger blood flow is complex
and far from linear. Skin temperature depends not only on
the rate of subcutaneous blood flow but also on the rate of
evaporation of sweat and environmental variables such as
air temperature, mean radiant temperature, ventilation, and
humidity. The present study found that finger skin tem-
perature was significantly correlated with FBF before and
after exposure to vibration, but not during exposure to
vibration. This is consistent with previous studies that have
Int Arch Occup Environ Health (2011) 84:315–323 321
123

found finger skin temperature is unable to follow rapid
changes in finger circulation (Greenfield et al. 1963).
The study shows that an increase in temperature can
off-set some of the reduction in blood flow caused by
hand-transmitted vibration. Although there was a greater
reduction in absolute blood flow with the higher tempera-
ture, the percentage reduction was the same, so blood flow
during vibration was greater with the higher temperature. It
is not known to what extent reductions in blood flow during
vibration are a cause of the hand-arm vibration syndrome,
but it seems reasonable to conclude that increased blood
flow may be beneficial.
Conclusions
Skin temperature and blood flow in a finger on a hand not
exposed to vibration reduce during and after the exposure
of the other hand to vibration. Those with greater finger
blood flow before vibration tend to have greater blood flow
during vibration, and those with greater finger blood flow
with one temperature tend to have greater blood flow with
another temperature. There is greater absolute reduction in
finger blood flow when there is greater vasodilation in a
higher room temperature, but the percentage reduction in
finger blood flow caused by vibration is similar with room
temperatures of 20 and 28�C. The environmental condi-
tions should be carefully controlled during studies of the
vascular response to acute vibration.
Conflict of Interest The authors declare that they have no conflict
of interest.
References
Bornmyr S, Castenfors J, Evander E, Olsson G, Hjortsberg U,
Wollmer P (2001) Effect of local cold provocation on systolic
blood pressure and skin blood flow in the finger. Clin Physiol
21:570–575
Bovenzi M, Griffin MJ (1997) Haemodynamic changes in ipsilateral
and contralateral fingers caused by acute exposures to hand
transmitted vibration. Occup Environ Med 54:566–576
Bovenzi M, Griffin MJ, Ruffell CM (1995) Acute effects of vibration
on digital circulatory function in healthy men. Occup Environ
Med 52:834–841
Bovenzi M, Lindsell CJ, Griffin MJ (1998) Duration of acute
exposure to vibration and finger circulation. Scand J Work
Environ Health 24(2):130–137
Bovenzi M, Lindsell CJ, Griffin MJ (1999) Magnitude of acute
exposure to vibration and finger circulation. Scand J Work
Environ Health 25(3):278–284
Bovenzi M, Lindsell CJ, Griffin MJ (2000) Acute vascular responses
to the frequency of vibration transmitted to the hand. Occup
Environ Med 57(6):422–430
Bovenzi M, Welsh AJL, Griffin MJ (2004) Acute effects of
continuous and intermittent vibration on finger circulation. Int
Arch Occup Environ Health 77(4):255–263
Bovenzi M, Welsh AJL, Della Vedova A, Griffin MJ (2006) Acute
effects of force and vibration on FBF. Occup Environ Med
63:84–91
Bovenzi M, D’Agostin F, Rui F, Negro C (2008) A longitudinal study
of finger systolic blood pressure and exposure to hand-transmit-
ted vibration. Int Arch Occup Environ Health 81(5):613–623
Cleophas TJM, Fennis JFN, van’t Laar A (1982) Finger skin
temperature after finger-cooling test: influence of air temperature
and smoking. J Appl Physiol 52:1167–1171
Egan CE, Espie BH, McGrann S, McKenna KM, Allen JA (1996)
Acute effects of vibration on peripheral blood flow in healthy
subjects. Occup Environ Med 53:663–669
Farkilla M, Pyykko I (1979) Blood flow in the contralateral hand
during vibration and hand grip contractions of lumberjacks.
Scand J Work Environ Health 5:368–374
Fox RH, Edholm OE (1963) Nervous control of the cutaneous
circulation. Br Med Bull 19:110–114
Furuta M, Sakakibara H, Miyao M, Kondo T, Yamada S (1991) Effect
of vibration frequency on finger blood flow. Int Arch Occup
Environ Health 63:221–224
Greenfield ADM, Whitney RJ, Mowbray JF (1963) Methods for the
investigation of peripheral blood flow. Br Med Bull 19:101–109
Griffin MJ (1997) Measurement, evaluation, and assessment of
occupational exposure to hand-transmitted vibration. Occup
Environ Med 54:73–89
Griffin MJ, Bovenzi M, Nelson CM (2003) Dose-response patterns for
vibration-induced white finger. Occup Environ Med 60(1):16–26
Griffin MJ, Welsh AJL, Bovenzi M (2006) Acute response of finger
circulation to force, vibration applied at the palm of the hand.
Scand J Work Environ Health 32(5):383–391
Harada N, Iwamoto M, Laskar MS, Hirosawa I, Nakamoto M,
Shirono S, Wakui T (1998) Effects of room temperature,
seasonal condition and food intake on finger skin temperature
during cold exposure test for diagnosing hand-arm vibration
syndrome. Ind Health 36:166–170
Hyvarinen J, Pyykko I, Sundberg S (1973) Vibration frequencies and
amplitudes in the aetiology of traumatic vasospastic disease.
Lancet Issue 7807:791–794
International Organization for Standardization (2001) Mechanical
vibration: guidelines for the measurement and the assessment of
human response to hand-transmitted vibration. International
Standard, ISO 5349-1
International Organization for Standardization (2005) Mechanical
vibration and shock: cold provocation tests for the assessment of
peripheral vascular function. Part 2: Measurement and evalua-
tion of finger systolic blood pressure. International Standard, ISO
14835-2
Liedtke AJ, Schmid PG (1969) Effect of vibration on total vascular
resistance in the forelimb of the dog. J Appl Physiol 26:95–100
Lindblad LE, Lorenz RR, Sherpherd JT, Vanhoutte PM (1986)
Effects of vibration on a canine cutaneous artery. Am J Physiol
250:H519–H523
Ljung B, Sivertsson R (1975) Vibration-induced inhibition of
vascular smooth muscle contraction. Blood Vessels 12:38–52
Mahbub MH, Harada N (2008) Digital blood flow and temperature
response in palmar and dorsal skin induced by short-term
vibration exposure while grasping a vibratory handle. Int Arch
Occup Environ Health 81:889–897
Mahbub MH, Inoue M, Yokoyama K, Laskar MS, Ohnari H, Suizu K,
Inagaki J, Takahashi Y, Harada N (2006) Assessment of room
temperature influence on finger blood flow response induced by
short-term grasping of vibrating handle. Int Arch Occup Environ
Health 79:22–26
Matikainen E, Leinonen H, Juntunen J, Seppalainen AM (1987) The
effect of exposure to high and low frequency hand-arm vibration
on finger systolic pressure. Eur J Appl Physiol 56:440–443
322 Int Arch Occup Environ Health (2011) 84:315–323
123

Mckenna KM, Blann AD, Allen JA (1994) Vascular responses in
chain saw operators. Occup Environ Med 51:366–370
Mirbod SM, Yoshida H, Jamali M, Miyashita K, Takada H, Inaba R,
Iwata H (1998) Finger skin temperature and laser-doppler finger
blood flow in subjects exposed to hand-arm vibration. Ind Health
36:171–178
Nakamura H, Okazawa T, Nagase H, Yoshida M, Ariizumi M, Okada
A (1996) Change in digital blood flow simultaneous reduction in
plasma endothelin induced by hand-arm vibration. Int Arch
Occup Environ Health 68:115–119
Nasu T (1977) Changes of the skin temperature caused by local
vibratory stimulation in normals and patients with vibration
syndrome. Yonago Acta Medica 21:83–99
Ohhashi T, Ikomi F (1990) Vibration-induced increase of the lymph
flow rate in canine hindlimb with special reference to Raynaund’s
phenomenon in vibration disease. In: Okada A, Taylor W, Dupuis
H (eds) Hand-arm vibration. Kyoei Press, Kanazawa, pp 19–22
Roddie IC (1983) Circulation to skin and adipose tissue. In:
Handbook of physiology. The Cardiovascular system. Peripheral
circulation and organ blood flow, sec 2, vol 3, chapter 10.
American Physiological Society, Bethesda, pp 285–317
Sakakibara H, Iwase S, Mano T, Watanabe T, Kobayashi F, Furuta M
(1990) Skin sympathetic activity in the tibial nerve triggered by
vibration applied to the hand. Int Arch Occup Environ Health
62:455–458
Sandover J, Louw J (1992) Acute effects of grip force and vibration
on finger temperature. In: Presented at the 6th international
conference on hand-arm vibration, Sankt Augustin, pp 211–218
Thompson AJL, Griffin MJ (2009) Effect of the magnitude and
frequency of hand-transmitted vibration on finger blood flow
during and after exposure to vibration. Int Arch Occup Environ
Health 82:1151–1162
Int Arch Occup Environ Health (2011) 84:315–323 323
123