Effects of Regulation on Drug Launch and Pricing in ...
61
NBER WORKING PAPER SERIES EFFECTS OF REGULATION ON DRUG LAUNCH AND PRICING IN INTERDEPENDENT MARKETS Patricia M. Danzon Andrew J. Epstein Working Paper 14041 http://www.nber.org/papers/w14041 NATIONAL BUREAU OF ECONOMIC RESEARCH 1050 Massachusetts Avenue Cambridge, MA 02138 May 2008 We appreciate comments from attendees at the 2008 Chicago Health Economics Conference and the 2008 Toulouse Economics of the Health Care and the Pharmaceutical Industry conference. An earlier version of this paper was presented at the 2005 International Health Economics Association meeting. This research was supported in part by a grant from Wyeth Pharmaceuticals and by support from the Merck Foundation to the University of Pennsylvania. The opinions expressed are those of the authors and do not necessarily reflect the opinions of the research sponsors or the National Bureau of Economic Research. NBER working papers are circulated for discussion and comment purposes. They have not been peer- reviewed or been subject to the review by the NBER Board of Directors that accompanies official NBER publications. © 2008 by Patricia M. Danzon and Andrew J. Epstein. All rights reserved. Short sections of text, not to exceed two paragraphs, may be quoted without explicit permission provided that full credit, including © notice, is given to the source.
Transcript of Effects of Regulation on Drug Launch and Pricing in ...
NBER WORKING PAPER SERIES
EFFECTS OF REGULATION ON DRUG LAUNCH AND PRICING IN INTERDEPENDENTMARKETS
Patricia M. DanzonAndrew J. Epstein
Working Paper 14041http://www.nber.org/papers/w14041
NATIONAL BUREAU OF ECONOMIC RESEARCH1050 Massachusetts Avenue
Cambridge, MA 02138May 2008
We appreciate comments from attendees at the 2008 Chicago Health Economics Conference and the2008 Toulouse Economics of the Health Care and the Pharmaceutical Industry conference. An earlierversion of this paper was presented at the 2005 International Health Economics Association meeting.This research was supported in part by a grant from Wyeth Pharmaceuticals and by support from theMerck Foundation to the University of Pennsylvania. The opinions expressed are those of the authorsand do not necessarily reflect the opinions of the research sponsors or the National Bureau of EconomicResearch.
NBER working papers are circulated for discussion and comment purposes. They have not been peer-reviewed or been subject to the review by the NBER Board of Directors that accompanies officialNBER publications.
© 2008 by Patricia M. Danzon and Andrew J. Epstein. All rights reserved. Short sections of text, notto exceed two paragraphs, may be quoted without explicit permission provided that full credit, including© notice, is given to the source.

Effects of Regulation on Drug Launch and Pricing in Interdependent MarketsPatricia M. Danzon and Andrew J. EpsteinNBER Working Paper No. 14041May 2008, Revised March 2009JEL No. I11,I18,K2,L5,L65
ABSTRACT
This study examines the effect of price regulation and competition on launch timing and pricing ofnew drugs. Our data cover launch experience in 15 countries for drugs in 12 therapeutic classes thatexperienced significant innovation over the decade 1992-2003. We use prices of established productsas a measure of the direct effect of a country's own regulatory system, and find that launch timingand prices of innovative drugs are influenced by prices of established products. Thus, if price regulationreduces drug prices, it contributes to launch delay in the home country. New drug launch hazards andlaunch prices in low-price countries are also affected by referencing by other, high-price countries,especially within the EU, as expected if manufacturers delay launch in low-price markets to avoidundermining higher prices in other countries. Thus, referencing policies adopted in high-price countriescan impose welfare loss on low-price countries. Prices of new drugs are influenced mainly by pricesof other drugs within the same subclass; however, dynamic competition from new subclasses underminesnew drug launch in older subclasses. Association with a local firm accelerates launch only in certainregulated markets. These findings have implications for US proposals to constrain pharmaceuticalprices in the US through external referencing and drug importation.
Patricia M. DanzonHealth Care Systems DepartmentThe Wharton SchoolUniversity of Pennsylvania204 Colonial Penn Center3641 Locust WalkPhiladelphia, PA 19104and [email protected]
Andrew J. EpsteinSchool of Public HealthYale University60 College St, Room 301New Haven, CT [email protected]

1
I. Introduction
New drugs are potentially global products and can contribute importantly to health
outcomes for consumers and expenditures for payers. Prompt launch is also critical for drug
manufacturers, given the fixed patent life over which to recoup the high costs of R&D.1 In fact,
in a study of the 1990s launch experience of 85 drugs in 25 industrialized countries, only roughly
half of the potential country-compound launches occurred, and many of the eventual launches
involved months or years of delay (Danzon, Wang and Wang, 2005). Launch lags in the US in
the 1960s and 1970s were attributed to increased regulatory requirements for proof of safety and
efficacy (e.g. Peltzman, 1973; Grabowski and Vernon, 1978). However, in the 1990s the US and
the EU harmonized and accelerated new drug review, such that remaining differences in
registration requirements cannot fully explain observed launch lags, especially between EU
countries.
By contrast, price regulation has become more complex and potentially contributes both
direct (domestic) effects on launch lags in the regulating country and indirect (spillover) effects
on launch in other countries. Price regulation may delay launch directly through three
mechanisms. First, regulation that reduces the manufacturer’s expected price and NPV reduces
incentives for launch, especially in small countries and for drugs with low expected sales
volume, assuming some fixed costs of launch. Second, negotiation strategies may lead to
strategic delay by firms or regulators to influence the ultimate price.2 Third, regulatory processes
may entail pure bureaucratic delay. The welfare consequences of these direct/domestic effects of
a country’s regulation on its citizens are ambiguous a priori, because any foregone health benefit
1 Pharmaceutical R&D takes on average 8-12 years and costs roughly $802m. (in 2001 US dollars) per new compound approved in the US (DiMasi, Hansen and Grabowski, 2003). 2 Delay could also reflect launch budget constraints faced by firms, in which case a rational strategy may be to launch first in the most profitable markets and use the revenues generated to cover launch in less profitable markets.

2
due to fewer/later launches may be offset by savings from lower drug prices and better pre-
launch information about a drug’s relative safety and effectiveness.3
More problematic from a social welfare perspective are the indirect/spillover effects that
arise when one country regulates its drug price by reference to the price of the same drug in other
countries (“external referencing”). For example, Canada caps the price of innovative new drugs
at the median price in seven countries, and some EU countries use the mean or minimum price in
a group of referenced countries. By undermining market segmentation and price discrimination,
external referencing by high-price countries creates spillover incentives for a firm to not launch
in lower-price referenced countries or delay until a higher price is achieved. The welfare
consequences in the referenced low-price countries are clearly negative, since they suffer
reduced access to new drugs and possibly higher prices due to external referencing by other
countries, with no offsetting benefits. Parallel importation by high-price EU countries from
lower-price EU countries is a second spillover mechanism that may also contribute to non-launch
and higher prices, and hence negative welfare consequences for the exporting countries.4
Understanding these indirect effects of one country’s regulation on launch in other countries is
particularly important as existing regulatory regimes seek new ways to constrain drug prices and
the US debates both referencing foreign drug prices and/or legalizing parallel trade (“drug
importation”).
Previous studies of launch experience for new drugs (Danzon, Wang and Wang, 2005;
Lanjouw, 2005; Kyle, 2006, 2007) have generally concluded that price regulation contributes to
3 Negative external effects may accrue to other countries if the regulated prices result in suboptimal contribution to joint costs of R&D (Danzon and Towse, 2003). 4 Parallel trade is expected to have less effect on launch delay in low-price countries than external referencing because (a) parallel trade only reduces prices for the traded fraction of sales, (b) manufacturers may be able to limit parallel trade supply restrictions to exporting countries, two-tier price structures etc., and (c) launch delay would simply delay the onset of trade with no lasting effect on post-launch price differentials.
3
launch delay. As detailed below, however, these prior estimates are inconclusive because: their
proxy measures of regulation were at best rough and sometimes inaccurate, leading to possible
measurement error and some contradictory results; they lacked product-specific data on prices of
competitor products, a critical benchmark for regulation and hence expected launch prices; they
estimated launch equations that presupposed regulatory effects on launch prices, but were unable
to corroborate with evidence on launch prices; and none clearly distinguished the indirect
spillover effects of regulation from benign determinants of launch sequencing.
This paper provides robust estimates of the effects of regulation on both launch delay and
launch prices. We distinguish clearly between the direct/domestic effects of a country’s own
regulatory system and the indirect/spillover effects on other countries, and clarify the negative
welfare consequences of the spillover effects. We use the average price (lagged one quarter) of
established products in the same subclass as the most accurate available measure of the effect of
regulation on expected prices and hence the direct effect of regulation on launch.5 We distinguish
the influence of products in the same vs. older subclasses, to provide evidence on whether the
availability of older, cheaper products constrains launch prices for new drugs in innovative
5 We treat the lagged average price of competitor products as exogenous because prices are regulated in all but three countries in our sample; the exceptions are the US, Germany (except classes under reference pricing and time periods with price freezes) and the UK (except price increases are not permitted). Although firms could in theory cut price below the regulated price, this would not be a rational entry deterrence strategy in pharmaceutical markets for two reasons. First, subsequent price increases would be barred by regulation, and, second, patients have little incentive to be price-sensitive in most markets, because co-payments are generally independent of drug price. To check the assumption that prices are sticky and are unrelated to anticipated launch of competitors, we compared several measures of price change (all measured as percents) prior to launch with price change in other periods. Median price change within subclasses is zero, whether measured quarterly or annually, and the 5th and 95th percentiles are -6.2 and 6.3 respectively. For superior drugs, a launch occurred in roughly 10 percent of quarters. The 10th percentile of annual price changes was -7.2 for years prior to a superior launch vs. -8.6 for periods with no superior launch; patterns are similar for all other percentiles and for inferior drugs. Focusing on superior subclasses where preemptive price cutting is most plausible, the 10th percentile of the overall 4-quarter change is -10.4 for subclasses with 3 or fewer competitors vs. 7.7% for subclasses with more than 3 competitors. In subclasses with 3 or fewer competitors, the 10th percentile of the 4-quarter price change for years prior to entry is -7.5 vs. other years is -10.9. Because lagged competitor prices are set by regulation and do not plausibly reflect strategic entry deterrence, these prices provide a much more accurate, composite measure of the net effect of complex regulatory regimes on the expected price for a new drug than the alternative of including binary indicators for regulatory regime structural type, which cannot capture the complex and multidimensional details of regulatory implementation, including unobserved processes that vary widely within structural type.

4
subclasses and hence the extent of static vs. dynamic competition. We also provide evidence on
(lack of) first-mover advantage and differential country-specific influence of local corporations.
We analyze quarterly sales data, by drug, from IMS Health from 1992-2003 for 15 major
countries and 12 major therapeutic classes, all of which experienced entry of a new subclass
during our study period (e.g., in the anti-ulcerant class, the proton pump inhibitors [PPIs]
displaced the H2-antagonists). We refer to new and old subclasses as “superior” and “inferior,”
but intend no judgment about their relative value.
We estimate a two-equation model of launch hazard and launch price for molecules in
superior and inferior subclasses separately, to permit comparison between them. The launch
hazard equation is estimated using a complementary log-log (hereafter “clog-log”) model with
time-varying covariates. We also estimate a random effects clog-log model and a split population
clog-log model (Schmidt and Witte, 1989) to test for various forms of molecule-level
heterogeneity. The launch hazard results are robust to specification, although both the split
population and the random effects hypotheses are confirmed. For the launch price equation, we
report estimates of price conditional on launch from OLS and GLS random effects models. We
test for selection bias, using a two-step Heckman selection estimator (Heckman, 1979). Although
the inverse Mills’ ratio is sometimes significant, the launch price results are also robust to
specification.
We find that launch hazards and prices of new drugs are positively associated with prices
of established products in the same subclass, but find no evidence of effects of old subclasses on
new subclasses. Thus, to the extent that regulation reduces drug prices, it directly contributes to
launch delay/non-launch, but availability of older, cheaper drugs does not constrain new drug
prices. Regulatory referencing by high-price EU countries contributes to launch delay/non-

5
launch in low-price EU countries. We find no evidence that manufacturers use delay as a strategy
to obtain a higher price within a given country. Launch by local corporations accelerates launch
timing but does not affect launch prices; these effects are confined to a few, regulated countries,
however, suggesting local firms benefit from political influence rather than real experience
advantages. Late-launching drugs in older subclasses have more limited launch success than new
drugs in new subclasses, confirming the importance of non-price dynamic competition.
The evidence here shows that indirect regulatory strategies that rely on referencing to
foreign prices or importing from foreign countries can impose significant welfare loss on these
foreign countries due to launch lags, non-launch and higher prices.6 The model implies that such
effects will be greater, the larger the referencing country relative to the referenced country and
the greater the potential price difference. Thus, this evidence is particularly relevant as the US
considers external referencing and/or legalizing drug importation/parallel trade, given the huge
size of the US market (45 percent of global pharmaceutical sales) relative to potential referenced
countries.7 It is also relevant to the growing concern over high prices of drugs in developing
countries, which are plausibly attributable in part to the risk of referencing or importation by
higher-priced countries, as well as other factors.
6 Estimating the magnitude of welfare consequences of regulation is beyond the scope of this paper. Philipson et al. (2008) estimate the welfare effects of launch delay due to registration regulation in the US. In their model, registration regulation is assumed to reduce drug risk but delay consumer access to drug benefits, which are measured by actual drug prices. By contrast, our focus is on launch delay due to price regulation. The presumption of price regulation is that unregulated consumer demand is not a valid measure of consumers’ marginal benefits from drugs when consumers face minimal or zero out-of-pocket payment, as in most countries. If consumer demand for a drug is highly inelastic due to low/zero co-payment, but consumers ultimately must pay the full price through taxes or insurance premiums, then regulation that constrains prices to reflect the “true” value of drugs can increase consumer welfare in that country. Of course, if regulators set prices below the true value of new drugs to consumers, there may be long-run negative consequences due to reduced R&D. 7 As of February 2009, regulating US prices based on external referencing to foreign prices has been proposed but so far not enacted. Drug importation has been approved but so far is not implemented, because the Secretary of Health and Human Services has been unwilling to certify that safety and cost reduction requirements would be met. Several new bills would relax these constraints and expand the set of exporting countries.

6
The remainder of the paper is organized as follows. Section II reviews the relevant
literature, Section III outlines regulatory regimes and expected effects, and Section IV describes
the theoretical model. Section V details the data and empirical methods, Sections VI-VIII
describe the results, and Section IX concludes.
II. Literature
Several recent studies have examined effects of price regulation on lags in new drug
launch. Danzon, Wang and Wang (2005) studied the launch experience of 85 new drugs in the 25
leading markets in the 1990s, focusing on drugs that had met registration requirements of one of
the two strictest agencies (the US Food and Drug Administration [FDA] and the UK Medicines
Agency) and hence could potentially meet registration requirements in other countries. This
analysis used as a proxy for the direct regulatory effect on a new drug’s expected price the
average price of all competitor products in the class, measured at the time of the new drug’s
global launch. This class-wide average price at global launch may be an imprecise measure of
expected price for launches in a new subclass. For example, consider the launch of the third
proton pump inhibitor (PPI), a subclass within the broad anti-ulcerant class. The Danzon et al.
(2005) analysis used the class-wide average price of all anti-ulcerants, including many older, off-
patent products with modest efficacy, measured at global launch which may be many months
before actual launch. By contrast, our present study estimates separate effects of (a) the average
price of other brand PPIs (“superior” brands) vs. (b) the average price of older brands in other
anti-ulcerant subclasses (“inferior” brands), and (c) the average price of generics, all measured
contemporaneously (one quarter prior to launch). We find that launch of new brands is affected
only by prices of brands in the same subclass. That prices of new drugs are not constrained by

7
prices of older, cheaper originator or generic substitutes has important implications for
regulatory policy.
Kyle (2007) used a more heterogeneous sample of compounds and countries, a longer
time period (1980-1999), and measured regulation with a vector of regulatory structure
indicators and a price rank indicator.8 She concluded that price controls reduced launch
probability in countries that impose them. However, this conclusion is unreliable given the many
limitations of her measures of regulation. The regulatory indicators from 2000/2002 postdate the
1980-1999 analysis period and do not reflect significant changes in several countries within the
analysis period. The indicators incorrectly classify some countries and are missing for others.9
More fundamentally, within each measured regulatory type, there are major unmeasured
differences across countries and over time that affect prices. Kyle’s only measure of expected
price is an indicator for a country’s price rank in 2002, which is invariant across classes and
years. This was negatively related to launch probability prior to 1995, contrary to predictions,
and insignificant after 1995.10 Kyle’s (2006) analysis of launch in the G7 countries uses a single
8 The large and heterogeneous sample probably includes some drugs that could not meet requirements of the strictest agencies, such as the US FDA, the UK Medicines Agency and the EMEA. A count of Medline citations is included as a control for product quality; however, this US-centric measure may be a biased proxy for quality as perceived by non-US countries, especially for drugs not launched in the US. 9 Several examples illustrate the measurement error that results from applying the 2000/2002 listing of regulatory indicators to the 1980-1999 data. In the paper, “price controls refer to a cap on either the ex-manufacturer price or the amount a national health service pays for a pharmaceutical product.” By this definition, therapeutic reference pricing should count as a form of price control, because the reference price is a cap on reimbursement for all drugs in a class. In fact, therapeutic reference pricing is included as a separate dummy variable and has a coefficient that is positive and sufficiently large (0.854) to dominate the negative price control coefficient (-0.418). But, this effect appears to be spurious due to measurement error: although 7 countries are classified as having therapeutic reference pricing, in fact only the Netherlands had comprehensive therapeutic referencing, and this was only introduced in 1991. Similarly, 6 countries are categorized as “Pharmacoeconomic evidence recommended,” but in fact pharmacoeconomic evidence was used informally to support price negotiations in many countries from the early 1990s. In the late 1990s, both the UK and Canada required pharmacoeconomic evidence, but neither of these countries are categorized recommending use of pharmacoeconomic evidence. Given this measurement error, the large negative coefficient on this variable is unlikely to provide an accurate measure of the effect of requiring pharmacoeconomic evidence. Germany is listed as having a Prescribing budget, but in fact it was only in place from 1993-2000, and never enforced. 10 The post-1995 interaction alone is significant but when combined with the main effect, the net effect appears to be insignificant. High (1%) significance levels for most explanatory variables are surprising and may be upward biased

8
binary indicator for drug price controls. This is negatively associated with launch probability in
some specifications, but is insignificant in others. Thus this evidence for the direct effects of
regulation on launch probabilities from these analyses using regulatory indicators is
inconclusive.
With respect to spillover effects of regulation, all prior papers use indicator variables for
prior launch in a high-price vs. low-price country. However, none tests for differential effects
between countries that are closely linked vs. those that are not, which is necessary to distinguish
regulatory spillovers from other unobserved factors that may lead to sequenced launches, such as
coordinated regulatory filings. Finally, all prior papers show that launch by a local corporation
increases launch probabilities on average, but there is no analysis of differential effects across
countries and no compelling evidence on whether this reflects a true experience advantage or
simply political bias towards local firms.
Lanjouw (2005) examined first launch in a large, heterogeneous sample of new drugs in
68 countries between 1982 and 2002, using covariates measured at first global launch. She also
lacked data on competitor prices and measured regulatory stringency with binary indicator
variables that are invariant across classes and over the 20-year study period. Given the imprecise
measure of regulation, the conclusions on direct effects of price regulation are inconclusive.11
Lanjouw did not address spillover effects.
None of the previous papers examine effects of regulation on launch prices. Kanavos and
Costa-Font (2005) argue that parallel trade has led regulators in the lower-price EU countries,
such as Italy, France and Portugal, to accept higher prices, but they do not directly test this.
by including multiple indications for the same compound. Follow-on indications are usually not subject to price regulation and simply receive the same price as previous indications, with minimal price-related regulatory delay. Including follow-on indications could also bias coefficients and standard errors. 11 Lanjouw concluded that price controls in high-income countries reduced the long-run likelihood of drug launch, while price controls in less wealthy countries reduced launch probability in the short-run but not the long-run.

9
Similarly, Grossman and Lai (2006) present a theoretical model in which regulators in parallel
export markets accept higher regulated prices under regimes of international patent exhaustion,
in which their low prices undermine R&D, but no empirical evidence is presented. Our paper is
the first to provide evidence of effects of regulatory spillovers on launch prices.
III. Pharmaceutical Regulation: Registration and Price/ Reimbursement
New drugs face two possible regulatory hurdles: registration and price approval.
Registration
In all countries, drug registration requires proof of safety, efficacy and manufacturing
quality as a condition of market access. In the 1990s, the US FDA and counterpart agencies in
Europe harmonized some data requirements and adopted measures to accelerate review while
retaining autonomy in decision-making. Since 1995, the newly-created European Medicines
Agency has offered both centralized and mutual recognition procedures that can lead to
simultaneous registration of new drugs in all EU countries, as an alternative to the traditional
country-by-country review through national drug approval agencies.12 Thus cross-national
differences in drug registration regulation cannot explain large systematic differences in launch
lags among EU countries or between the US and EU. Japan is an exception in retaining special
requirements, including clinical trials on Japanese citizens.
Price/Reimbursement Regulation
Once a new drug clears registration hurdles, most countries with national health
insurance systems require price approval as a condition of reimbursement.13 Countries use one or
12 Under the mutual recognition procedure, a manufacturer selects one rapporteur country to review the application; other countries have 90 days in which to challenge the approval, otherwise it takes effect automatically. 13 Price approval is generally not required if the drug is launched without reimbursement, but such unreimbursed launch is rare, except for “lifestyle” drugs.

10
both of two criteria to set launch prices: (a) “internal referencing” to prices of one or more
competitor products in the same therapeutic class, with potential for mark-ups for superior
efficacy or other factors,14 or (b) “external referencing” to the minimum, median or mean of
prices of the same drug in specified comparator countries. Most price regulatory regimes
disallow post-launch price increases, and price cuts are sometimes mandated; hence the launch
price is critical to a drug’s life-cycle price profile. Internal referencing may entail bureaucratic
delay and possibly strategic delay if firms (regulators) hold out to achieve a higher (lower) price.
However, regulators should have incentives to weigh any costs associated with launch delay
against the benefits in lower prices, with no significant spillover to other countries.
By contrast, because external referencing regimes benchmark their price to the price of
the same drug in other countries, they create incentives for firms to delay launch in referenced
lower-price countries until prices have been established in other potentially higher-price
countries and/or regulators in low-price countries accept higher prices. Thus, higher-price
countries that reference lower-price countries can impose launch delay and possibly contribute to
higher prices in the referenced countries.15
Identifying the contribution of these regulatory regimes to drug launch experience in
specific countries is complex because most countries use multiple forms of regulation, including
both internal and external referencing, and the details of each regulation type differ across 14 Internal referencing may involve informal negotiations between the manufacturer and the regulator, as in France, or a more mechanistic reference price (RP) reimbursement system as in the Netherlands. Under therapeutic RP, drugs are classified based on mechanism of action and indication; generic RP groups drugs only with the same molecule, hence mainly off-patent drugs with generic equivalents. All drugs in a group receive the same reimbursement or reference price. A manufacturer may in theory charge a higher price, but the patient must pay any excess over the RP. 15 For example, suppose that in the absence of referencing, drug prices would be roughly proportional to GDP per capita. If high-income countries reference the mean price in a group of lower-income countries, the low-income countries are likely to experience spillover launch delay and welfare loss. But if a low-income country references the minimum price in other middle and low-income countries, any launch delay and welfare loss experienced by the referring low-income country would be internalized. Thus, referencing is predicted to lead to delays in lower-price countries, regardless of who does the referencing, but effects are external to the regulator’s calculus when higher-price countries reference lower-price countries.

11
countries. The effects of internal referencing depend on country-specific details, in particular, the
choice of comparator products and criteria for and size of mark-ups, if any. External referencing
effects depend on countries referenced, whether minimum, median or mean price is used, and the
other countries that the referenced countries reference. The complexity of these regulatory details
makes it impossible to accurately categorize countries by regulatory indicators or derive a firm’s
optimal launch sequence and minimum reservation price for each drug-country pair. However, a
clear prediction is that referencing of low-price countries by high-price countries will exacerbate
launch delay and possibly raise prices in the low-price countries.
Of the countries in our data during our study period, France, Japan, Canada, the
Netherlands, Italy, Mexico and Brazil nominally used both internal and external referencing for
some drugs and/or time periods.16 Greece and Portugal also used externally referenced price
controls for most of the period.17
In the US, Germany and the UK, a new drug could be launched and reimbursed without
regulatory approval of price, although other control mechanisms applied. In the US, multiple
private health plans negotiate discounts in return for preferred formulary status, and Medicaid
requires discounts off the price charged to private payers. These mechanisms may influence
launch prices but should not delay launch. Germany adopted an internal reference price
reimbursement system in 1989 but excluded new on-patent drugs, which could be launched and
16 Many other countries, including the UK, Sweden, Italy, Germany and Spain, and most US health plans used RP reimbursement for generically equivalent, off-patent compounds for at least part of our period. However, because these generic RP systems apply to off-patent drugs only, they are unlikely to affect launch decisions for new drugs, unless inter-brand effects are significant due to either competition or informal referencing. 17 The EU countries that used external reference pricing include Denmark (since April 1997, up to 10 EU countries excluding Greece and Italy), Greece (lowest in the EU), Ireland (lower of UK or the average in Denmark, France, Germany, the Netherlands, and the UK), Italy (average of up to 12 EU countries, must be on market for 4 countries and at least 2 with direct price controls), the Netherlands (since June 1996, average price in Belgium, France, Germany, and the UK), and Portugal (lowest in France, Italy, and Spain) (Burstall, 1998).

12
reimbursed without price approval, until 2005.18 The UK permits free pricing of individual
drugs, subject to a rate of return constraint on each firm’s portfolio of drugs. The renegotiation of
this profit-control scheme every five years usually involves international price comparisons and
required cuts in UK prices. Since 1999, the National Institute of Clinical Excellence (NICE) has
reviewed cost-effectiveness as a condition of reimbursement for most new drugs, which could
slow or prevent new drug launch.
The inability of regulatory indicator variables to accurately measure these complex
regulatory systems is evidenced by results from international price comparisons. For example,
although France, Japan and Canada all use both internal and external referencing, weighted price
indexes for 1999 show Canadian and French prices roughly 30 percent lower than the US,
whereas Japan’s prices were over 20 percent higher than the US (Danzon and Furukawa, 2003).
Rather than use regulatory type indicators, we therefore use average prices of competitor
products as the most accurate measure of the net direct effect of each country’s regulatory
system on expected prices for new drugs. These lagged prices can be treated as exogenous,
because prices are constrained by regulation in most countries and incentives for competitors to
cut price as an entry deterrence strategy are weak or nonexistent (see footnote 5). We also
categorize countries as high-price EU countries (UK, Germany, Netherlands, Sweden), low-price
EU countries (France, Spain, Portugal, Italy, Greece), and high-price non-EU countries (US,
Canada, Japan, Switzerland), based on average prices in our dataset and evidence from earlier
price comparisons (Danzon and Furukawa, 2003).
Parallel Trade
18 From 1993-2000 Germany had a national drug budget with physicians nominally at risk for budget overruns, although paybacks were not enforced. In 2005 on-patent drugs were added to the reference pricing system for reimbursement.
13
Parallel trade between EU states is legal under the Treaty of Rome. In our data, parallel
imports are reported only in the high-price EU countries. Parallel exporting countries are mainly
the low-price EU countries (France, Spain, Italy, Greece, and Portugal) (Burstall, 1998). Parallel
export risk may raise a firm’s reservation price for launch in low-price countries within the EU.
Measurement of parallel trade risk is described below.
IV. Theoretical Model
If markets were separable and prices were unregulated, profit-maximizing firms would
set prices independently for each country and would launch promptly after registration in all
markets where the expected net present value of revenues exceeds country-specific fixed launch
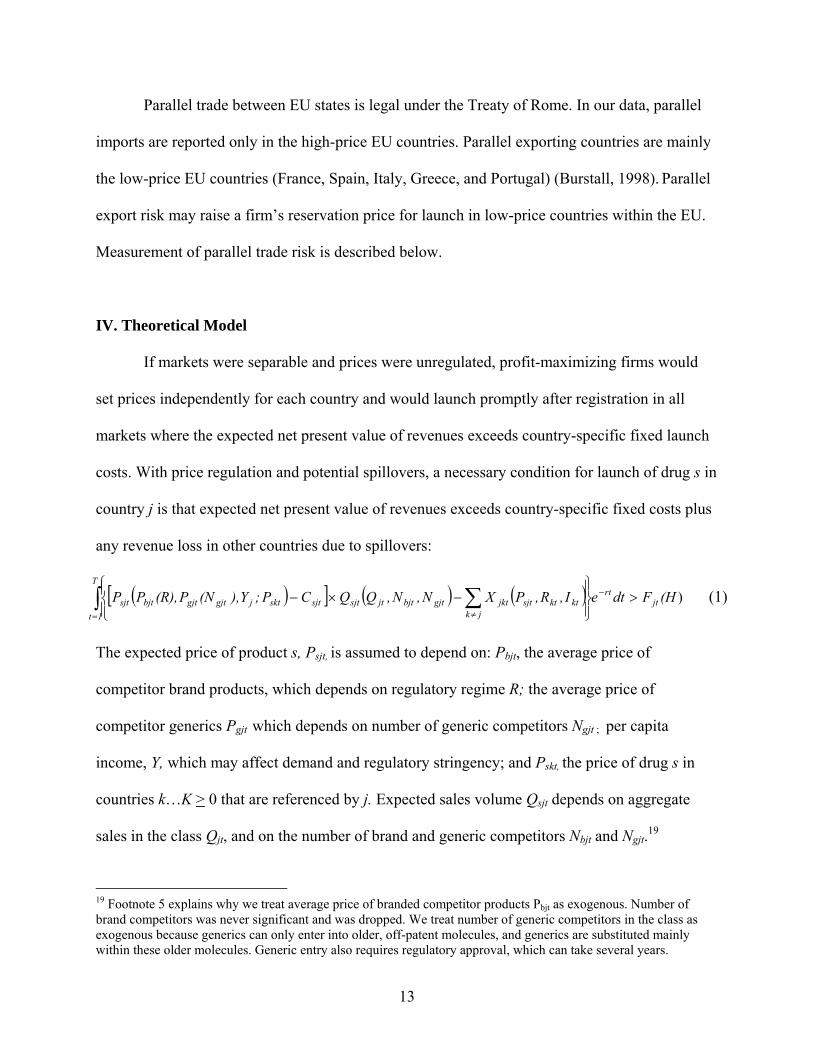
costs. With price regulation and potential spillovers, a necessary condition for launch of drug s in
country j is that expected net present value of revenues exceeds country-specific fixed costs plus
any revenue loss in other countries due to spillovers:
)(HFdteI,R,PXN,N,QQCP;Y),(NP(R),PP jtrt
T
1t jkktktsjtjktgjtbjtjtsjtsjtsktjgjtgjtbjtsjt
(1)
The expected price of product s, Psjt, is assumed to depend on: Pbjt, the average price of
competitor brand products, which depends on regulatory regime R; the average price of
competitor generics Pgjt which depends on number of generic competitors Ngjt ; per capita
income, Y, which may affect demand and regulatory stringency; and Pskt, the price of drug s in
countries k…K > 0 that are referenced by j. Expected sales volume Qsjt depends on aggregate
sales in the class Qjt, and on the number of brand and generic competitors Nbjt and Ngjt.19
19 Footnote 5 explains why we treat average price of branded competitor products Pbjt as exogenous. Number of brand competitors was never significant and was dropped. We treat number of generic competitors in the class as exogenous because generics can only enter into older, off-patent molecules, and generics are substituted mainly within these older molecules. Generic entry also requires regulatory approval, which can take several years.

14
Expected net revenue from launch is decreasing in Xjk = ∂(PkQk)/ ∂Psj , the spillover effect of Psj
on revenues in country k, which either references to j or derives parallel imports I from j. Fj = FR
+ FP is total fixed cost of drug launch, including registration cost FR and price approval cost FP ,
which may be lower if the launching corporation is home-based H; T is the duration of the
economic life of the drug indexed by t; and r is the discount factor.
Equation 1 yields the firm’s reservation price for launch in country j. It is increasing in
Xjk if launch in j may reduce revenue loss in country k due to spillovers from country j (∂PsjAsk
/∂Xjk > 0). If F is invariant across countries and drugs, reservation price is decreasing in expected
market size (∂PsjAsk
/∂Qsj < 0). More generally, firms are less likely to launch drugs in countries
with low expected sales, due to low volume or because price regulation reduces expected prices.
The regulator’s reservation or maximum offer price depends on the regulatory regime.
Under internal referencing, the regulator’s offer depends directly on prices of substitute products
(∂PsjOffer
/∂Pbj > 0). Under external referencing, although the regulatory formula is based on
prices in comparator countries, prices of existing products provide an empirical proxy for
achievable price levels under the referencing formula. Regulatory offers may be related to per
capita income (∂PsjOffer
/∂Yj > 0), given the political pressures on regulators to constrain health
spending within budgets that are related to per capita income levels. Budget impact may lead
regulators to offer lower prices for drugs with relatively large potential volume, Qsj, other things
equal (∂PsjOffer
/∂Qsj < 0). If local corporations are favored, ∂PsjOffer
/∂Hj > 0.
If PsjOffer - Psj
Ask > 0 and a launch price can be agreed within this range, launch occurs. If
not, negotiations may continue and launch may ultimately occur if either PsjOffer increases, Psj
Ask
falls, or some mechanism is negotiated to bridge the difference, such as a price-volume offset.20
20 For example, France applies spending limits that result in price cuts if volume sold exceeds target levels.

15
In our data, we observe only the launch date and launch price conditional on launch, not
the dates of registration approval or negotiation details. We therefore estimate reduced form
equations for the launch hazard and launch price as a function of the determinants of the firm’s
ask price and the regulator’s offer price. The reduced form launch hazard equation is:
H;P;Y,I,N,N,X,Q,P,Phh 1-sKtj1-jt1-gjt1-bjt1-jt1-jt1-gjt1-bjtsjt (2)
Measurement and predicted signs of variables are discussed below.
Because the bargaining range POffer - PAsk > 0 also defines the range of launch price, the
reduced form launch price equation includes the same variables as the launch hazard equation:
H;P;Y,I,X,Q,P,PfP 1-sKtjjjjgjbjsj (3)
In theory, expected price and market size at global launch t0 influence the decision to seek
registration and hence the launch hazard, and hence could identify the launch hazard equation,
whereas launch price depends on competitor price values only at launch. In practice, both pre-
launch values and change over time of the expected price and quantity variables were
insignificant in the launch equation, after controlling for contemporaneous values. Identification
in the two-stage selection models therefore relies mainly on functional form, as discussed below.
We estimate separate models for new drugs launching in superior vs. inferior subclasses.
Coefficient differences between these equations are expected due to dynamic competition and
related factors. For example, a drug that is a late entrant in an old subclass with declining sales
may not be worth launching unless it offers significant advantages over established products in
the subclass or expects favorable treatment by local regulators or markets.
V. Data and Methods
Data
16
We use data from IMS Health’s Midas database on drugs in 15 countries for 12
therapeutic classes, all of which experienced the launch of a new subclass shortly before or
during our study period, 1992-2003.21 The data for each molecule include active ingredient,
originator corporation(s) and marketing companies, pack description, launch date, therapeutic
class, and quarterly data on outpatient sales at manufacturer prices (revenue in local currency)
and unit volume (IMS standard units)22 from 1Q 1992 through 4Q 2003. After the data were
screened for internal consistency, revenue was adjusted for inflation using country-quarter-
specific Producer Price Indexes available from the International Monetary Fund, with 2003 as
the base year, and converted to US dollars using the average 2003 country-specific exchange
rate. Price per dose for each drug was calculated on a quarterly basis as the ratio of total revenues
to standard units sold.23
Of the 375 molecules in the dataset, 116 are classified as superior and 221 of their
potential 1,740 drug-country launches had occurred prior to our study period; 259 are classified
as inferior and 1,276 of their potential 3,885 drug-country launches had occurred prior to our
period.24 During our 12-year study period, we observe 885 of the 1,519 potential superior drug-
21 Our 15 countries include all 5 large EU markets (UK, Germany, France, Spain and Italy) and both high and low price smaller EU countries (Sweden, Netherlands, Portugal and Greece). Omitting the other 6 small EU countries (Austria, Belgium, Denmark, Finland, Ireland and Luxembourg) would lead to biased estimates only if they were systematically different from the included countries. Country-specific spillover effects depend on the relative size and prices of referring and referenced countries (see eq. 1). 22 The IMS standard unit is a proxy for a dose for each formulation e.g. one tablet or capsule, 5ml. for liquids. The IMS price data for the US do not reflect off-invoice discounts given by manufacturers to health plans and hence are upward biased for manufacturer net revenues. 23 We combined multiple form-3 level formulations (e.g. tablets and capsules, possibly of different strength) in a given country and quarter into a single observation and defined the price as the volume-weighted average price per unit. Identical forms that were launched by different co-marketing companies were also averaged. 24 Classification of molecules as superior or inferior was based mainly on mechanism of action, with input from several physicians and review of articles in PubMed (see Berndt, Danzon and Kruse, 2007). Our analysis includes only the first launch of each compound. We exclude follow-on indications or formulations because they typically face fewer registration requirements and pricing would be based on the price of existing formulations. We also focus on launch by an originator or licensee corporation, excluding the few cases of prior launch by copycat products. Five superior molecules and 20 inferior molecules were diffused to all our countries prior to our period. These are included as competitor products but are not in the sample of potential launches.

17
country launches and 390 of the 2,609 potential inferior drug-country launches. We observe
1,367 country-molecule-product launches (946 superior and 421 inferior) in our study period.25
Launch Estimation
We estimate the launch hazard using a maximum likelihood discrete time implementation
of a proportional hazards model based on complementary log-log regression.26 In the clog-log
analysis, each drug was eligible for launch in all countries starting from its quarter of first launch
in any country in our sample (“global launch”), and remained eligible until it launched. Thus
each drug s in each country j contributes tsj observations, the number of quarters from product s’s
global launch through either first launch in country j or 4Q 2003, the end of our study period.27
To account for the intra-molecule clustering across countries, we used robust standard errors or
molecule random effects.
The hazard of launch is hsjt, the probability that drug s launches in country j in period t
conditional on not having previously launched. Using a clog-log specification implies that
sjtsjt th expexp1 (4)
where Γsjt is a vector of explanatory variables as outlined above. To facilitate interpretation, we
present marginal effects calculated at the regressors’ mean values. The standard errors of the
marginal effects were calculated using the delta method; see Bartus (2005) for more details.28
One potential limitation of this specification is the assumption that the probability of
launch goes to unity as time goes to infinity. Some of the molecules in our sample might not
25 For 91 country-molecule pairs, two distinct formulations (form 2-level, such as an oral solid and a liquid) of a molecule launched simultaneously, and in four country-molecule pairs three distinct formulations launched simultaneously. 26 Clog-log is preferred to logit because the former assumes a continuous launch decision process (Allison, 1995). 27 Thus, although the first-stage results report thousands more observations than the second-stage results, the number of drug-country launches is the same in the first and second stages. 28 We calculated marginal effects for interactions of dummy variables X1 and X2 as {[F(Xβ|X1=1,X2=1) - F(Xβ|X1=0,X2=1)] - [F(Xβ|X1=1,X2=0) - F(Xβ|X1=0,X2=0)]}, where F is the inverse of the clog-log function, 1 – exp[-exp(Xβ)]. Other regressors were held at their means or at zero if they were related to X1 or X2. Standard errors were calculated using the delta method.

18
meet drug approval requirements or would have limited market potential in some countries. We
therefore also estimate a discrete-time split-population model with time-varying covariates
(Schmidt and Witte, 1989; Jenkins, 1995), which allows for some empirically-estimated sample-
wide proportion of drugs never to launch.29
A second limitation of the clog-log specification is failure to account for possible time-
invariant unobserved characteristics common to a molecule across countries that influence
launch. Unobserved heterogeneity may lead to coefficient attenuation and biased estimates of
duration dependence (Heckman and Singer, 1984; Lancaster, 1990). We address this issue by
adding a Normally-distributed term for the drug-level heterogeneity νs:
ssjtsjt th expexp1 (5)
Launch Price
We use ordinary least squares with molecule-clustered standard errors to model the log of
launch price of drug s in country j, conditional on launching. To account for unobserved
molecule characteristics we also report results from a GLS random effects estimator. To account
for possible selection bias produced by the correlation between the propensity to launch and the
launch price, we also estimate a Heckman selection model with a first-stage clog-log regression,
which, as described above, is equivalent to a proportional hazards model of new drug launch.30
Variable Definitions 29 This feature is especially relevant for analysis of molecules in inferior subclasses, in which 116 of the 259 molecules did not experience a new launch during the study period (compared with two of the 116 molecules in superior subclasses). 30 The clog-log-based Heckman model is estimated following a two-step procedure that ensures consistent standard errors (Heckman, 1979). Following Lee (1983) and Greene (1992), the inverse Mills’ ratio for drug s in country j and time t, Msjt, is calculated using the predicted probability of launch sjtp̂ from a clog-log regression as
sjt
sjtsjt p
pM
ˆ
ˆ1
where is the standard Normal density function and is the standard Normal distribution function. We also
estimated a FIML Heckman model based on first stage probit that offers robust, clustered standard errors.

19
Regulation/Expected Price: We use the (log lagged) unweighted average price of
competitor brand (originator and licensed, including parallel imports) products in the same
therapeutic class as a comprehensive measure of the direct effect of price regulation on expected
price for a new drug. The price of one or more competitor products is the explicit regulatory
benchmark in internal referencing regimes; it should also be a rough proxy for the net effect of
external referencing formulae. In free-pricing countries, the average price of established products
provides an estimate of the expected price of a new drug, assuming competition constrains
similar products to have similar prices. Average prices for superior and inferior subclasses are
distinguished, to test for differential effects within vs. between subclasses, as proxies for static
vs. dynamic price competition in free pricing countries; in regulated markets, analogous effects
operate via the regulator’s choice of comparator products.
Expected Sales Volume: The (log lagged) total number of doses sold in the same
therapeutic class as the new drug is included as a measure of expected volume.31 The expected
effect on launch hazard and price is uncertain a priori, depending on whether the firm’s
opportunity cost of delay dominates the regulator’s concern over budget impact. It was
insignificant and was dropped from the price equation to conserve degrees of freedom.
Spillovers: To test for indirect effects in low-price countries of regulatory referencing by
high-price countries, we included three count variables that measure the number of countries a
molecule has already launched in, categorized by low-price EU countries (France, Italy, Spain,
Portugal, Greece), high-price EU countries (Germany, the Netherlands, Sweden and the UK) and
high-priced non-EU countries (the US, Japan and Canada). Our categorization of low- and high-
price EU countries is supported by actual average prices (see below). These variables are also
interacted with indicators for whether the potential launch is in a low- vs. high-price EU country. 31 Measures of volume by subclass and number of competitors were not significant and were dropped.

20
These interactions test whether spillover effects are greater for launches in low-price EU
countries, which are referenced by and are the main sources of parallel trade to higher-price EU
countries, and whether spillovers are greater within the EU than from non-EU to EU countries,
as expected.
In the price equation, we include similar interactions, except that we use the Minimum
Own Price in high-price EU, low-price EU and high-price non-EU countries, defined as the
lowest price received for the molecule in any country where launch has already occurred, for
each country group, rather than simple count variables for number of prior launches. Estimates
using Maximum Own Price were similar to those reported here using Minimum Own Price. Both
variables could not be included together due to collinearity.32
We also include a dummy variable Any PI Share in Subclass, to test whether risk of
competition from parallel import reduces the propensity to launch or reduces launch prices.33
Because the IMS data do not identify the country from which PIs originate, we cannot test
directly whether volume of parallel exports reduces launch hazards in exporting countries.
Rather, the propensity to parallel export is subsumed in the country fixed effects.
First Mover Advantage and Timing: To test for first mover effects, the launch equation
includes an indicator variable for quarters in which there are no molecules in the country-
subclass. The price equation includes indicator variables for whether a launch was the first,
second or third entrant in country-subclass.34
A quadratic in years since global launch is included to control for the decline in
incentives for launch with time lapsed since global launch, because patents run regardless of
32 We estimated specifications of the launch and price models that measured spillovers with either the number of countries previously launched in or minimum/maximum own prices. The specifications reported here yielded the better model fit and conceptual fit with the dependent variables. 33 We estimated a model specification that included the average price of parallel imports, and it was not significant. 34 The first mover advantage variables are based on the number of branded competitors by subclass, Nbjt.

21
launch and compounds may undergo obsolescence due to entry of newer compounds. An
indicator for molecules launched before 1990 controls for their relatively old age. An indicator
for molecules launched since 1996 tests for effects of the EMEA regime. It is expected to be
positive if the cost-reducing effects of the EMEA coordinated registration process outweighed
the increased risk of spillovers. Molecules launched during 1990-1995 are the referent category.
Country of Domicile: Previous studies have found that new drugs launch more quickly in
the home country of the originator firm (Danzon, Wang and Wang, 2005; Kyle, 2006, 2007);
however, differences across countries, by type of local firm, and effects on launch prices have
not been examined. We include dummy variables to test for differential effects of three
categories of local corporations: Local Originator identifies a molecule’s originator corporation
launching in its country of domicile; Solo Licensee identifies a locally-domiciled, licensed
corporation that launched the molecule in at least one country by itself; and Local Co-marketer
identifies a locally-domiciled, licensee corporation that launched together with another firm in its
home country and did not launch alone in any country. The Solo Licensees are firms that have
demonstrated ability to obtain drug registration on their own; thus their local expertise should be
positively associated with launch hazard, and possibly also with price. The Local Co-marketers
have not demonstrated registration expertise, hence they are predicted to have less effect on
launch hazard than for either Originator or Solo Licensee firms; however, Local Co-marketers
may affect price. These categories are not mutually exclusive; for example, a molecule with a
small Local Originator could also have a Solo Licensee or a Local Co-marketer as a marketing
partner, all from the same country.
Country and Year Effects: We include country fixed effects to capture other country-
specific factors that may affect launch delay and launch prices (controlling for expected price,
22
volume and per capita income), in particular, pure bureaucratic delay and parallel export risk.
Germany is excluded as the referent country.
The dollar-euro/ECU exchange rate and the PPI are included in the price equation to
control for exchange rate and indexing trends that could bias our dollar-denominated estimates of
competitor prices and launch prices. Year effects were included in some specifications, but were
generally insignificant and are not reported here.
Product Characteristics: The price equation includes product characteristics that affect
price per dose, including pack size, pill strength (grams per unit), and indicator variables for
specialized formulations (oral delayed and non-oral solids), with oral solids (basic tablets and
capsules) as the referent formulation.
VI. Descriptives
There are substantial differences in the number and timing of molecule launches by
country and subclass (Table 1). For the superior subclasses, Germany and the US (two free
pricing countries) have the most molecules ever launched (88 and 86). Sweden, the US, the
Netherlands, Germany, and the UK (all higher price, less-strictly regulated) also have the
shortest median launch delay (17.4-18.7 months). Japan, Portugal and France (all strict price-
regulated countries) have the fewest superior molecules (53, 62 and 69 respectively) and the
longest mean launch lags (41, 31, and 37).
For the inferior subclasses, Japan leads in number of inferior molecules (158) ever
launched, followed by Germany (131), and even Portugal (113) has more than the US (97). The
number of inferior molecule launches during our period is highest in three regulated markets
(Japan [43], Brazil [40] and Greece [47]) whereas most other countries have fewer than 27.

23
Mean launch lags are generally much longer for inferior than for superior molecules. These
differences in launch experience in the superior vs. inferior subclasses confirms that the older
subclasses may be more heterogeneous, including some molecules that could not meet strict
regulatory requirements and/or have limited sales potential in some markets.
Table 2 reports the mean number of manufacturers per molecule in 2003 by country, subclass
and license type, to illustrate differences in market structure. The expected number of
originator/licensee firms per molecule is 1-2, assuming that an originator’s profit-maximizing
strategy is usually to launch alone or with at most one co-marketing partner. Consistent with this,
the mean number of originator/licensee firms per superior molecule is 1.0 in the US, the UK, and
the Netherlands, and only slightly higher in most other countries. Licensees are more common in
Italy (1.8), Spain (1.7) and Japan (1.3), suggesting that having a local co-marketing partner may
be particularly valuable in these countries. Parallel imports are found only in the four higher
priced EU countries—Germany, the Netherlands, Sweden and the UK—and the majority of
molecules in these countries have some PI presence by 2003. This concentration of PIs in a few
countries may provide insufficient variation to estimate PI effects accurately, as noted below.
Table 3 reports unweighted mean prices by country-subclass-license type, to provide a
rough measure of benchmark competitor prices used by regulators and firms in forming price
expectations. Note that these means reflect differences in molecules and formulations, in addition
to price differences for identical products, and hence are not valid indexes of cross-national price
differences for a standardized basket of drugs.35
These unweighted mean prices show that, for originator/licensee superior products in the
EU, the strictly price-regulated regimes (France, Spain, Portugal, Greece, Italy) have relative low
35 Danzon and Furukawa (2003, 2008) report weighted price indexes, based on standardized market baskets, for originator and generic products in 1999 and 2005

24
prices. Thus, we classify them as “low-price EU markets.” The countries with freer pricing,
reimbursement regulation and/or late adoption of price regulation (Germany, the UK, the
Netherlands, Sweden) have higher mean prices, and we classify them as “high-price EU
markets.” The US has the highest prices, followed closely by Canada; we also classify
Switzerland and Japan as “non-EU high-price markets” based on other price index comparisons
(Danzon and Furukawa, 2003), although Japan’s unweighted mean prices are quite low in Table
3. Originator prices are lower in inferior than superior subclasses, and country rankings are
similar but with smaller differentials. Other Brand prices are generally higher than for
Unbranded Generics, as expected.36 PI prices generally fall between generic and originator
prices, as expected; however, these differentials are not based on a standardized product mix and
do not provide an accurate measure of originator/PI price differentials.
Table 4 shows, for each country, the number of molecules launched by a Local
Originator, a Solo Licensee or a Local Co-marketer corporation, and the average number of
countries in which each country’s originated molecules were launched. Using launch by a Local
Originator as a proxy to identify molecules originated in each country, for superior drugs, the US
originated the largest number (30), followed by Japan (17), and the UK, France and Switzerland
(11 each). All other countries had 0 to 4 launches. Drugs originating in Japan and Spain diffused
to dramatically fewer countries on average (4) than drugs originating in other countries (10.6-
12.8). Japan originated the largest number of inferior molecules (45), compared to the US (29),
Germany and Switzerland (25-26). All countries other than the US originated more inferior
molecules than superior molecules. In general, inferior molecules diffuse to fewer countries than
superior molecules.
36 Some of the PI, Unbranded Generic and Other Brand means include very few products. For unbranded generics, the relatively high mean US price is surprising and reflects its product mix, whereas volume-weighted price indexes for standardized products show low generic prices in the US (Danzon and Furukawa, 2003).

25
Means and standard deviations for variables in the launch and price equations are
reported in Appendix Tables A1 and A2.
VII. Determinants of Launch
Table 5 reports coefficients and marginal effects from our basic launch specification,
using clog-log estimates with either robust, clustered standard errors or molecule-level Normal
random effects to control for unobserved molecule characteristics.37 Country and class fixed
effects are included. Our discussion focuses on estimates for the superior subclasses, noting
differences for the inferior subclasses where relevant.
Direct Effect of Price Regulation
Launch hazards are significantly related to mean prices of competitor brands in the same
subclass: for superior products a 10 percent increase in competitor prices is associated with a
0.054 percentage point increase in the launch hazard, which implies an elasticity of 0.14 at the
3.8% mean launch hazard for superiors molecules per quarter. Thus to the extent that regulation
reduces prices, it reduces incentives to launch. These estimates may underestimate the magnitude
of regulatory effects, if our measure of mean price, based on all originator and licensed products
in the subclass, includes some that are not used as comparators by regulators. For the inferior
subclass, the own subclass price effect is positive but only marginally significant. Cross-class
price effects are insignificant, indicating that regulatory benchmarking and/or competitive
constraints operate primarily within rather than between subclasses, and that dynamic
competition is driven by product characteristics other than price. Similarly, the effects of
number of generic competitors are negative but statistically insignificant, providing further
evidence that availability of older, cheaper generic substitutes is not a significant deterrent to the 37 Parallel specifications using a split population clog-log model were generally consistent with those reported here.

26
launch of new brand products, even in older subclasses where generics are more numerous,
possibly because generic substitution is mostly within rather than between molecules.
Unit volume for the therapeutic class—whether measured contemporaneously, at global
launch, as a growth rate or by subclass—was not significant. This may reflect offsetting
incentives for regulators to constrain prices more stringently for compounds with large potential
sales, whereas firms prefer to launch these drugs more promptly.38
Launch Timing and Sequence
For both superior and inferior products, launch hazards appear first to decrease then
increase with time since global launch, reaching a minimum at 13.5 yrs from global launch for
superior drugs and 49.0 years for inferiors.39 These average quadratic specifications reflect the
diverse launch patterns in Table 1, which shows median launch lags for superior drugs of less
than one year in the high-price EU countries and the US, followed by launch within the second
year for all other countries except France, Portugal and Japan, where launch typically occurs
later. For inferior drugs, median launch lags are much longer.
Inferior drugs launched before 1990 are more likely to launch than later entrants in the
same subclass, possibly due to accumulated global brand capital of these earlier entrants and
despite their presumably shorter remaining patent life.40 The poor launch performance of late
entrants in older subclasses further confirms that dynamic competition from newer subclasses
disadvantages late entrants to older subclasses.
38 The insignificant effects of volume on launch of new products found here contrasts with significant positive effects in Danzon, Wang and Wang (2005). These different findings may reflect differences in sample countries and drugs, in addition to our use here of more detailed measures of country-class prices and other characteristics. 39 The minimums from the split population estimates are 10.9 years for superior and 50.3 years for inferiors. 40 Patent expiry is less critical to expected sales in countries with few generics or primarily branded generics that do not compete aggressively on price. This includes all the low-price EU countries during our time period.

27
The coefficient on the post-1996 global launch indicator is negative but insignificant for
superior drugs. Taken at face value this suggests that on average the EMEA process has not
reduced launch lags, possibly because price approval is the rate-limiting regulatory hurdle and
any cost-reducing effect of accelerated approval is offset by increased risk of spillovers. Such
inferences are tentative, however, because our analysis period is too early to observe the full
effects of the EMEA, which focused initially on biologics and truly innovative drugs.
Indirect Regulatory Effects: Cross-National Spillovers
The evidence strongly supports the hypothesis that launch in low-priced EU countries is
adversely affected by the risk of spillover to higher-price EU countries through external
referencing and possibly PI risk. For superior drugs, the coefficients on number of countries in
which launch has already occurred are positive and significant, with the exception of prior
launch in the three lowest price EU countries, Spain, Portugal and Greece. The marginal effect is
largest for prior launch in the UK or Germany, at 0.030, and is 0.025 for prior launch in Sweden
or the Netherlands. By contrast the marginal effect of prior launch in Italy or France is 0.013, and
for high price non-EU countries the marginal effect is only 0.009.41 This pattern confirms that
firms delay launch in low-price EU countries until launch has occurred in higher-price EU
countries. Moreover, because Spain, Portugal and Greece reference the lowest prices in a group
of relatively low-price countries, including France and Italy, a firm’s optimal launch strategy
plausibly leads to launching last in these three countries, after higher prices have been
established in the countries that they reference. For inferior drugs, marginal effects are much
smaller and generally insignificant, consistent with other evidence that these late launching drugs
in older subclasses have atypical launch potential.
41 The p-values for Wald tests comparing these marginal effects are as follows: UK/Germany vs. Italy/France, p=0.019; UK/Germany vs. high-price non-EU countries, p=0.009; Sweden/Netherlands vs. Italy/France, p=0.062; Sweden/Netherlands vs. high-price non-EU countries, p=0.003.

28
To explore further the spillover effects for superior drugs, we estimated a specification
that includes counts of prior launches in high-price EU, low-price EU and other high-price
countries (Canada, Japan, Switzerland and the US), together with interactions between these
launch counts and indicators for whether the current observation is a low- or a high-price EU
country. Marginal effects of these interactions are reported in Table 6. The marginal effect of a
prior launch (from zero to one) in a high-price EU country on launch in a low-price EU country
is 0.0018, whereas the effect of a prior launch in another low-price EU country is only 0.0005,
and the difference is statistically significant. Similarly, the marginal effect on launch in a low-
price EU country is greater from a prior launch in a high-price EU country than from a launch in
a high-price non-EU country, as expected, because referencing and parallel trade within the EU
is only to EU countries. This evidence is thus consistent with the hypothesis that the observed
pattern reflects spillovers, not simply some unobserved factor that leads to correlation in launch
timing across countries.
Parallel import presence in the class is not associated with launch hazard in the importing
country, after controlling for country fixed effects. This may simply reflect the high correlation
between the PI indicator and the country indicators for the four importing countries—Germany,
Sweden, the Netherlands and the UK—and the high PIs presence across classes in those
countries. It is also more likely that parallel trade risk leads primarily to non-launch or launch
delay in the parallel export countries, not in the importing countries. We cannot measure this
effect in the exporting countries because our data do not report PI country of origin; hence it is
subsumed in country effects.42
Launch by a Local Corporation
42 We tried including the average price of PIs, but this was not significant.

29
Launch is more likely for both superior and inferior molecules from firms that are
domiciled domestically. For superior drugs, the marginal effect of launch by a Local Originator
is 0.13-0.18, compared with 0.03-0.04 for Solo Licensees and 0.02-0.03 for Local Co-marketers.
This ranking confirms that compounds that are originated by local firms have significantly
greater local advantage than compounds that are simply represented by local licensee firms,43
although even the latter accelerate launch somewhat relative to having no local connection.
Firms that are local originators by definition have local R&D activities and hence are likely to be
larger, have greater regulatory expertise and be viewed as more valuable to the local economy
than firms that are just co-marketers, with Solo Licensees in the middle. To test whether these
local corporation effects differed across countries, we combined the three indicators into a single
Any Local Corporation indicator and estimated a specification with interactions between Any
Local Corporation and country fixed effects.44 Marginal effects of these interactions are reported
in Table 7. The effect of the Any Local Corporation indicator is insignificant for the referent,
Germany, and for most other countries. The exceptions are France, Italy, Spain, Switzerland and
Japan, where launch by a local corporation has a significant positive effect for superior drugs.
Overall, this evidence indicates that the large positive mean local corporation effect on launch
hazard, observed in our baseline specifications and in previous studies, is confined to a few
countries, with no significant domestic advantage in most countries. This suggests that the local
corporation advantage reflects primarily industrial policy to support local firms in certain
countries, not that local firms in general have greater expertise in dealing with local regulatory
systems in all countries.
43 P < 0.05 for comparisons of marginal effects between Local Originators and either Solo Licensees or Local Co-marketers. 44 We tried to estimate a specification with interactions between each of the three local corporation indicators and country fixed effects. The clog-log coefficients could not be estimated due to small sample sizes for several countries.

30
To shed further light on cross-national differences, Appendix Table 3 reports the number
of launches and mean and median launch lags for launches by Local Originators, Solo Licensees
and Local Co-Marketers compared with launches by non-local corporations, by country. For
Japan, the mean launch delay for superior drugs is 1.8 months with a Local Originator, compared
with 53.0 months with no local firm, and 59 months with a Solo Licensee and 49 months with a
Local Co-marketer. The Local Originator advantage could partially reflect the fact that clinical
trials for these drugs were probably done on Japanese subjects, as required for registration in
Japan. However, the fact that these Japan-originated drugs on average diffused to only 4
countries besides Japan indicates that their home advantage is not just speed due to local trials;
rather, it reflects a tendency for Japan to approve locally-originated drugs that have limited
potential in other countries. In France, Italy and Spain, there is some evidence that launch lags
are shorter if a Local Co-marketer is present than if the drug is launched by a Solo Licensee. This
is consistent with the hypothesis that Local Co-marketers are added only where they are expected
to bring advantage to foreign originators in dealing with regulators; it is also consistent with
anecdotal evidence that regulators in these countries traditionally encouraged such co-marketing
as industrial policy to support local firms.
Country Fixed Effects
For superior drugs, compared to Germany, the referent country, other country effects are
all negative. Marginal effects are smallest for the UK (-0.011) and other relatively free pricing
countries; marginal effects are largest for Japan (-0.044), reflecting its unique registration
requirements; and the major EU parallel export countries (Spain, France, Greece, Portugal and
Italy) are all significantly negative, as are several other countries. For inferior drugs, none of the
country marginal effects is significant in the basic clog-log estimation, possibly due to within-

31
class heterogeneity. However, for the US, the clog-log coefficient, the RE marginal effect and
the split population estimates are all negative, implying that late-launching inferior drugs are less
likely to launch in the US than in other countries.
Split Population and Random Effects Estimators
The split population and random effects estimates are generally consistent with the clog-
log estimates. However, the split population estimates (available from the authors) imply that the
probability of never launching is highly significant for 27.7 percent of inferior molecule-country
pairs, compared with only 4.9 percent of the superior molecules. This provides further evidence
that certain molecules, especially late entrants in inferior classes, are not marketable in certain
countries.45 Whether this reflects inability to meet regulatory or market requirements cannot be
determined with our data.
VIII. Determinants of Launch Price
Table 8 reports the determinants of (log) launch price using OLS with robust, clustered
standard errors, and GLS random effects to control for unobserved molecule heterogeneity. Our
discussion focuses on estimates that include GDP per capita; excluding GDP changes primarily
the country fixed effects, as reported below.46 Year fixed effects were also included, to control
for any bias in our inflation and exchange rate adjusters, but these coefficients were generally
45 The estimated percent never launching is significantly higher once we control for Local Originator Corporation, suggesting that some countries approve locally-originated drugs that have limited diffusion potential elsewhere. 46 Because our observed launch prices are conditional on launch, we estimated both a two-stage Heckman selection correction model that includes as a regressor the inverse Mills’ ratio from a clog-log first-stage hazard equation and a traditional FIML Heckman model based on a probit first-stage equation. The coefficients on the inverse Mills’ ratios are larger for the inferior drugs, but are significant only for the superior drugs (and only in the two-stage models); otherwise results are generally similar to the conditional estimates. These results are broadly consistent with the finding from the split population estimates that at least some molecules do not have global launch potential. Because the first-stage launch equation is identified primarily off functional form, we focus our discussion on the conditional estimates in Table 8 and do not attempt to draw inferences about differences between conditional and unconditional estimates.

32
insignificant and are not reported. Therapeutic class effects were omitted because they are highly
collinear with competitor prices and order of entry within class.
Competitor Prices
For both superior and inferior products, launch prices are significantly positively related
to prices of competitor products in the same subclass (elasticity of 0.12 for superiors and 0.17 for
inferiors). The cross-subclass elasticity of inferior drug prices on launch price of new superior
drugs is also positive but smaller (0.08). This confirms the earlier evidence, that launch hazards
are influenced mainly by prices of established products within subclass, implying that dynamic
competition between subclasses is based on non-price product attributes. Generic prices have no
significant effect on launch prices of new superior brands, suggesting weak price competition
between new brands and old generics. Launch prices of new inferior products are affected
negatively by generic prices in the class (elasticity -0.09), which may reflect a selection effect:
late entrants in inferior subclasses launch only if they expect to receive high prices relative to
competing generics.
Launch Timing and Sequence
Controlling for inflation and exchange rates, launch prices for superior products decline
with time elapsed since global launch, at an estimated rate (from the random effects model) of
-3.8% (p=0.05) per year.47 This suggests that manufacturers cannot obtain a higher price simply
by holding out.
For superior products, there is no evidence of first-mover advantage in prices, although
second and third entrants do receive higher prices relative to later entrants in a class. For inferior
products, the first or second entrants in the subclass appear to receive a price premium relative to
47 The net impact of time since global launch (a quadratic) was calculated as t
tsgltsgl 22 , where the mean
value of time is 2.16 years.

33
other inferior drugs. This conclusion is tentative, however, because it is based on a very small
number of inferior subclasses for which first and second launches occur in our time period.
Cross-national Spillovers
For both superior and inferior products, launch prices increase with the lowest price
previously received in other high-price EU countries, whereas effects of launch in low-price EU
countries is insignificant. The minimum own price received in non-EU countries is significantly
positive for superior molecules, but insignificant for inferior molecules, which launch less
frequently in high-price non-EU countries such as the US and Canada.
We also estimated equations with interactions to test the hypothesis that spillovers to
low-price EU countries are largest from high-price EU countries. Marginal effects of the
interactions are reported in Table 9, which parallels Table 6 for the launch model in structure and
results. We find that the effect on launch price in a low-price EU country is larger for a 10%
increase in a drug’s minimum own price in high-price EU countries than from a 10% increase in
minimum own price in other low-price EU countries. Specifically, the difference in the marginal
effects in the minimum own price elasticity based on the OLS model is 0.39, and based on the
RE model is 0.26. Similarly, the effect on launch price in a low-price EU country is substantially
larger for a 10% increase in a drug’s minimum own price in high-price EU countries than it is for
a 10% increase in minimum own price in high-price non-EU countries. The differences in the
own price elasticity are 0.37 from the OLS model and 0.24 for the RE model, consistent with the
hypothesis that launching first in high-price EU markets can influence prices in low-price EU
markets. This evidence from launch prices thus validates that launch delay in low-price markets
may ultimately yield higher prices in these markets through spillovers from higher-price markets,
in addition to avoiding contamination of those high-price markets.

34
The indicator for PI presence is insignificant for superior drugs, but significant and
negative for inferior drugs, indicating that PI presence reduces launch prices mainly for late
entrants in older subclasses.
Local Corporations
For superior drugs, launch by a Local Originator is positively associated with launch
price, but the effect is not significant. Estimated effects of both types of licensees are negative
but insignificant. For inferior drugs, the average effect of launch by a Local Originator is
significantly negative, which may reflect the fact that these late-launching inferior drugs have
relatively weak characteristics, relative to established drugs in the subclass. The fact that the RE
effects are smaller than the OLS effects is consistent with this. Launch by a Local Licensee is
negative but insignificant. Tests for country-specific differences in local corporation effects
(results not shown) are generally insignificant. This lack of evidence of a price premium for
drugs launched by local firms, despite a significant advantage in the launch equation for a subset
of countries, suggests that the launch advantage reflects favoring by the registration authorities
rather than by pricing authorities. However, conclusions are tentative due to small sample sizes.
Macroeconomic Controls
The US dollar per euro/ECU exchange rate, which declined from a high of 1.38 in 1992
to a low of 0.83 in 2000, is insignificant for superior products but large and significant for
inferior products. This suggests that our exchange rate adjustments accurately tracked
manufacturers pricing adjustments for the more broadly diffused superior products, which are at
higher risk of referencing and parallel trade. By contrast, our exchange rate adjustment
apparently over-adjusted for launch pricing for inferior products, which were less likely to
launch in the US and therefore plausibly, were priced independently of the USD/Euro exchange

35
rate.48 For superior drugs, the country-specific Producer Price Index (our price deflator) is
significantly negative in the OLS specification, suggesting that launch prices of drugs on average
have not kept pace with economy-wide inflation, but this conclusion is tentative because the RE
estimate is insignificant.
Product Characteristics
Product characteristics have expected effects. Price per unit is significantly negatively
related to pack size, particularly for pack size over 100 units, possibly indicating economies of
scale in packaging and/or the competitive use of large packs to give discounts to pharmacies in
countries such as the US, that permit pharmacists to dispense from large packs. Price is unrelated
to strength (grams of active ingredient per unit) in the RE estimates, suggesting that the positive
coefficient in the OLS results for superiors reflects between- rather than within-molecule effects.
Compared to the oral solid formulations (the omitted category), price per dose is significantly
higher for injectable and non-oral forms (liquids, creams etc).
Country Fixed Effects
The country fixed effects in Table 8 are dramatically different depending on whether
GDP per capita is included. Based on the RE estimates, without GDP controls, prices for
superior molecules in the US and Japan are significantly higher than in Germany; prices in
Switzerland and Canada are higher but insignificant, whereas prices in Brazil, Mexico and all
other EU countries are lower, except the Netherlands and Sweden which are similar to Germany.
However, after controlling for GDP per capita, Brazil, Mexico, Spain, Portugal and Greece have
prices significantly higher, and Switzerland, the UK and Sweden have prices significantly lower
than Germany.
48 If manufacturers priced inferior drugs based on local prices that were flat or falling in ECUs, the prices would be rising over time in USD, due to USD devaluation, thus explaining the positive and significant coefficient on the exchange rate variable.

36
Although these are not pure hedonic country effects, taken at face value they imply that
the prevailing spread in drug prices across EU countries is compressed relative to the
counterfactual of differentials based on per capita income. This may explain at least in part why
Spain, Portugal and Greece, the lowest-price EU countries in our sample, adopt more stringent
price controls than the higher-price northern countries. However, these low-price EU countries
appear to be constrained in their ability to keep price differentials in line with income
differentials, in part due to external referencing by and parallel importing to higher-income
countries. The evidence here confirms that the resulting interconnectedness across countries
contributes to delay or non-launch of new drugs in these low-price EU countries, as firms seek to
avoid spillovers to prices in higher-price EU countries.
IX. Conclusions
Our findings demonstrate that launch timing and launch prices of new drugs are
significantly related to prices of established products in the same subclass. Thus, to the extent
price regulation reduces price levels, it contributes directly to the longer average launch delays
observed in low-price countries. Our estimates suggest that the magnitude of these direct effects
is quite small, although downward bias due to measurement error is possible. Welfare
conclusions are ambiguous, assuming that regulators weigh the benefits of lower prices against
any welfare loss from reduced access to new drugs for their citizens.
We also find significant evidence that regulatory referencing by high-price countries to
lower-price countries within the EU creates incentives for manufacturers to delay launch in low-
price countries until higher prices have been established in other countries. Consistent with such
strategies, launch in higher-price EU countries is associated with increased launch hazard in

37
lower-price EU countries, and launch prices in low-price EU countries are directly related to
prior launch prices in high-price EU markets. This evidence, that spillover effects are greater
from high-price EU countries to low-price EU countries, than from high-price non-EU countries,
in both launch and price models, supports the hypothesis that they are attributable to referencing
and possibly parallel trade, not to other unmeasured factors that may lead to closely sequenced
launches across countries. To the extent that referencing or parallel importation by higher-price
countries leads to longer launch delay or higher prices in lower-price countries than would
otherwise occur, a welfare loss is imposed on low-priced countries by the higher-price countries
that adopt these regulatory strategies. We find no evidence of first mover pricing advantage, and
no evidence that manufacturers can raise prices simply by delaying launch.
Although the lower-income EU countries regulate their drug prices, Spain, Portugal and
Greece nevertheless had relatively high drug prices given their income, whereas high-price EU
countries had lower drug prices relative to their per capita GDP. Both the theory and evidence
presented here suggest that external referencing has contributed to this convergence of
pharmaceutical prices relative to GDP among EU countries. Parallel trade effects are expected to
be smaller, and empirical estimation is limited because our data do not identify exported
volumes. With that caveat, the evidence suggests that parallel import threat reduces launch prices
of late-launching inferior products, and that country fixed effects are negative for countries that
are significant parallel exporters.
Although prices of new drugs are constrained by prices of established drugs, due to either
regulation or competition, such effects occur primarily within subclasses, with weaker
constraints from older, cheaper drugs. Late entrants in older subclasses diffuse less broadly than
new drugs in newer subclasses, and these late inferior launches are at lower prices, linked to the

38
lower prices in these older subclasses. This evidence suggests significant dynamic competition
on non-price product attributes in pharmaceutical markets, even though price competition and
regulatory referencing are mainly within subclasses.
The positive effects of launch by a local corporation found in previous studies are
confined in our sample to a few countries—France, Italy, Spain, Switzerland and Japan—and
appear to reflect primarily local registration advantage for drugs originated by local companies.
We find weaker evidence of benefits from use of local licensees as co-marketing partners,
particularly in France, Italy and Spain. The fact that these local corporation advantages are
confined to specific countries suggests that they reflect industrial policy strategies favoring local
firms in these countries, rather than a more general local firm advantage based on experience in
dealing with local regulation.
This evidence, that policies of external referencing (and, with weaker evidence, parallel
importing) impose an external cost on the referenced or exporting countries, is based on the EU,
where such policies already exist. However, it has important implications for the US debate over
drug price controls through external referencing and drug importation. The theory above
indicates that the launch lag externality will be greater if referenced countries are small and low
price, compared to a much larger, higher-price referencing or importing country. Because the US
has both higher brand prices and much higher total volume than most potential reference or
exporting countries, the impact on these countries if the US were to adopt referencing or
importing would potentially be much larger than the EU effects documented here.

39
References
Allison PD (1995). Survival Analysis Using the SAS System: A Practical Guide. Cary, NC: SAS Institute.
Bartus T (2005). “Estimation of Marginal Effects Using Margeff.” The Stata Journal, 5(3):309-
329. Berndt E, PM Danzon and GB Kruse (2007). “Dynamic Competition in Pharmaceuticals: Cross-
National Evidence from New Drug Diffusion.” Managerial and Decision Economics. 28(4-5):231-250.
Burstall, ML (1998). “Pricing and Reimbursement in Western Europe 1998: A Concise Guide.”
A Pharma Pricing Review Report. PPR Communications Ltd, Dorking, Surrey, UK. Danzon PM and A Towse (2003). "Differential Pricing for Pharmaceuticals: Reconciling Access,
R&D, and Patents." International Journal of Health Care Finance and Economics, 3:183-205.
Danzon PM and MF Furukawa (2003). “Prices and Availability of Pharmaceuticals: Evidence
from Nine Countries.” Health Affairs Web Exclusive, October 2003. http://content.healthaffairs.org/cgi/content/full/hlthaff.w3.521v1/DC1.
Danzon PM and MF Furukawa (2008). ““International Prices and Availability of
Pharmaceuticals in 2005.” Health Affairs 27(1) 221-233. Danzon PM, YR Wang and L Wang (2005). “The Impact of Price Regulation on the Launch
Delay of New Drugs: A Study of Twenty-Five Major Markets in 1990s.” Health Economics, 14(3):269-292.
DiMasi JA, RW Hansen and HG Grabowski (2003). “The Price of Innovation: New Estimates of
Drug Development Costs.” Journal of Health Economics, 22(2):151-185. Grabowski, HG, JM Vernon, et al. (1978)."Estimating Effects of Regulation on Innovation -
International Comparative Analysis of Pharmaceutical Industry." Journal of Law & Economics, 21(1):133-163.
Greene WH. (1992). Limdep Version 6.0: User’s Manual and Reference Guide. Bellport, NY:
Econometric Software, Inc. Grossman G. and E Lai (2006). “Parallel Imports and Price Controls.” NBER Working Paper
12423. Heckman J (1979). “Sample Selection Bias as a Specification Error.” Econometrica, 47:153-161.

40
Heckman J and B Singer (1984). “A Method for Minimizing the Impact of Distributional Assumptions in Econometric Models of Duration.” Econometrica, 52:271-320.
Jenkins SP (1995). “Easy Estimation Methods for Discrete-Time Duration Models.” Oxford
Bulletin of Economics and Statistics, 57(1):129-138. Kanavos P. and J. Costa-Font (2005). “Pharmaceutical Parallel Trade in Europe: Stakeholder and
Competition Effects.” Economic Policy, 44:751-798. Kyle MK (2006). “The Role of Firm Characteristics in Pharmaceutical Product Launches.”
RAND Journal of Economics, 37(3):602-618. Kyle MK (2007). “Pharmaceutical Price Controls and Entry Strategies.” Review of Economics
and Statistics, 89(1):88-99. Lancaster T (1990). The Econometric Analysis of Transition Data. Cambridge, England:
Cambridge University Press. Lanjouw JO (2005). “Patents, Price Controls and Access to New Drugs: How Policy Affects
Global Market Entry.” NBER working paper #11321. Lee LF (1983). “Generalized Econometric Models with Selectivity.” Econometrica, 51(2):507-
512. Peltzman, S (1973). "Evaluation of Consumer Protection Legislation - 1962 Drug Amendments."
Journal of Political Economy, 81(5):1049-1091. Schmidt P and AD Witte (1989). “Predicting Criminal Recidivism Using ‘Split Population’
Survival Time Models.” Journal of Econometrics, 40:141-159.

41
Table 1. Launch and Molecule Count and Mean and Median Launch Delay by Country and Subclass
Superior Subclasses Inferior Subclasses
Country Molecules Launches
Mean Launch Delay
Median Launch Delay Molecules Launches
Mean Launch Delay
Median Launch Delay
High-Price EU Countries Germany 88 72 18.5 9.5 131 18 30.4 17.5
UK 80 58 18.7 6.5 116 24 69.2 41.5 Netherlands 73 56 18.1 10 112 21 43.7 15
Sweden 77 62 17.4 7 82 19 49.9 18 Low-Price EU Countries
France 69 53 30.9 29 105 19 87.6 59 Greece 72 55 30.1 22 107 37 116.8 54
Italy 76 61 24.8 21 127 26 74.7 48.5 Portugal 62 48 37.0 33.5 113 26 85.8 67
Spain 76 62 28.1 21 112 23 43.9 31 High-Price non-EU Countries
Canada 73 62 25.6 16 98 22 91.9 66.5 Japan 53 42 41.0 40 158 43 63.3 28
Switzerland 78 63 23.9 18 111 21 55.5 47 USA 86 72 17.9 8 97 23 86.4 62
Low-Price non-EU Countries Brazil 71 60 31.2 20.5 92 40 107.1 90.5
Mexico 72 59 28.6 17 105 28 84.0 55 Note: Launch delays measured in months Note: Sample includes all molecules present and new launches occurring in our data during 1992-2003
Note: Launch delays are calculated only for country launches that occurred during 1992-2003 (regardless of when the global launch occurred)

42
Table 2. Mean Number of Manufacturers per Molecule by Country, Subclass and License Type in 2003
Superior Subclasses Inferior Subclasses
Country
Originator /
Licensee Unbranded
Generic Parallel Import
Other Brand Molecules
Originator /
Licensee Unbranded
Generic Parallel Import
Other Brand Molecules
High-Price EU Countries Germany 1.2 1.6 4.2 1.3 86 1.3 3.0 3.0 3.3 114
UK 1.0 0.3 0.1 0.0 79 1.1 1.0 0.3 1.1 103 Netherlands 1.0 0.0 5.5 0.0 68 1.1 0.0 6.1 0.1 97
Sweden 1.1 0.6 1.2 0.1 73 1.1 0.5 1.4 0.2 74 Low-Price EU Countries
France 1.2 0.6 N/A 0.0 66 1.2 2.0 N/A 0.4 98 Greece 1.1 0.1 N/A 1.4 70 1.0 0.1 N/A 2.1 93
Italy 1.8 0.5 N/A 0.6 74 1.4 1.0 N/A 2.0 105 Portugal 1.3 1.1 N/A 1.1 61 1.1 0.4 N/A 0.8 101
Spain 1.7 2.2 N/A 1.1 73 1.4 0.9 N/A 1.3 100 High-Price non-EU Countries
Canada 1.1 0.4 N/A 0.8 69 1.1 2.0 N/A 1.7 85 Japan 1.3 0.4 N/A 1.5 52 1.5 0.3 N/A 3.3 153
Switzerland 1.1 0.1 N/A 0.2 77 1.1 0.2 N/A 0.5 93 USA 1.0 1.4 N/A 0.0 85 1.2 7.0 N/A 0.3 91
Low-Price non-EU Countries Brazil 1.2 1.2 N/A 2.1 68 1.1 1.4 N/A 3.0 84
Mexico 1.1 0.3 N/A 0.9 70 1.1 0.7 N/A 1.9 90 Note: Sample includes all molecules present in IMS dataset in 2003

43
Table 3. Mean Price per Molecule by Country, Subclass and License Type in 2003
Superior Subclasses Inferior Subclasses
Country
Originator /
Licensee Unbranded
Generic Parallel Import
Other Brand
Originator /
Licensee Unbranded
Generic Parallel Import
Other Brand
High-Price EU Countries Germany 30.31 0.49 9.23 0.94 2.56 0.32 0.33 0.75
UK 13.26 0.64 1.36 0.61 6.18 0.93 0.46 1.27 Netherlands 35.53 0.05 2.22 7.75 10.79 0.45 0.61 0.72
Sweden 24.41 0.34 1.79 0.45 13.08 0.26 0.42 0.98 Low-Price EU Countries
France 6.52 0.41 N/A 0.89 0.28 0.39 N/A 0.75 Greece 12.84 1.11 N/A 0.56 6.26 0.45 N/A 0.80
Italy 2.24 0.41 N/A 0.77 0.30 0.31 N/A 0.61 Portugal 1.83 0.44 N/A 0.78 0.33 0.20 N/A 0.34
Spain 6.13 0.33 N/A 1.06 0.28 0.63 N/A 0.69 High-Price non-EU Countries
Canada 49.30 0.57 N/A 0.60 1.03 0.93 N/A 0.57 Japan 12.27 0.44 N/A 0.73 2.62 1.26 N/A 0.59
Switzerland 34.64 0.81 N/A 0.76 5.81 0.37 N/A 1.43 USA 52.70 0.90 N/A 14.22 11.05 1.43 N/A 12.72
Low-Price non-EU Countries Brazil 2.34 0.39 N/A 0.95 4.21 0.21 N/A 0.35
Mexico 18.34 0.69 N/A 1.65 5.84 0.26 N/A 0.53 Note: All prices are ex manufacturer prices per standard unit in 2003 US Dollars Note: Sample includes all molecules present in our dataset in 2003

44
Table 4. Number of Launches and Mean Number of Other Country Launches by Country, Subclass and Domestic Status of Corporations Molecules in Superior Subclasses Molecules in Inferior Subclasses
Local Originator
Corporations Solo
Licensees Local Co-marketers
Local Originator Corporations
Solo Licensees
Local Co-marketers
Country Total
Launches Launches
Mean # Other
Country Launches Launches Launches
Total Launches Launches
Mean # Other
Country Launches Launches Launches
High-Price EU Countries Germany 88 4 12.8 10 3 131 26 7.7 22 4
UK 80 11 12.7 7 0 116 18 11.1 11 1 Netherlands 73 0 N/A 0 0 112 2 12.5 3 0
Sweden 77 3 13.3 1 0 82 0 N/A 3 0 Low-Price EU Countries
France 69 11 10.5 5 3 105 19 7.3 16 2 Greece 72 0 N/A 0 0 107 0 N/A 2 0
Italy 76 1 0.0 13 14 127 11 5.0 25 13 Portugal 62 0 N/A 2 2 113 0 N/A 5 2
Spain 76 2 4.0 5 7 112 8 5.1 11 4 High-Price non-EU Countries
Canada 73 0 N/A 3 0 98 1 1.0 10 0 Japan 53 17 4.0 6 11 158 45 1.9 36 24
Switzerland 78 11 10.6 4 0 111 25 11.2 10 0 USA 86 30 10.6 20 0 97 29 9.6 33 1
Low-Price non-EU Countries Brazil 71 0 N/A 2 0 92 3 0.7 4 1
Mexico 72 0 N/A 0 0 105 1 0.0 2 0 Note: Sample includes all molecules present and all country launches occurring in IMS dataset through 2003 Note: Molecules with multiple local corporations in a country were assigned to a single one in the order of Local Originator, Solo Licensee or Local Co-marketer

45
Table 5. Coefficients and Marginal Effects for Launch Model (Standard Errors in Brackets) Coefficients Marginal Effects
Clog-log with Robust
Clustered SEs Clog-log with Normal
REs Clog-log with Robust
Clustered SEs Clog-log with Normal
REs Subclass Subclass
Variables Superior Inferior Superior Inferior Superior Inferior Superior Inferior 0.1138** -0.1089 0.1442*** -0.1202* 0.0053* -0.0001 0.0086*** -0.0003 Log Avg Price of Superior Brands (Lag
1Q) [0.0552] [0.0683] [0.0476] [0.0616] [0.0027] [0.0001] [0.0032] [0.0002] 0.0658 0.1247* 0.0894* 0.0928 0.0031 0.0001 0.0053* 0.0002 Log Avg Price of Inferior Brands (Lag
1Q) [0.0612] [0.0697] [0.0506] [0.0609] [0.0029] [0.0001] [0.0031] [0.0002] -0.0738 0.0829 -0.0202 0.1386 -0.0034 0.0001 -0.0012 0.0004 Log Total Volume of All Drugs in Class
(Lag 1Q) [0.0527] [0.1058] [0.0581] [0.0889] [0.0027] [0.0001] [0.0035] [0.0002] -0.0040 0.0035 -0.0079 0.0103 -0.0002 0.0000 -0.0005 0.0000 Num Generic Manufs per Molc in
Superior Subclass (Lag 1Q) [0.0045] [0.0081] [0.0059] [0.0083] [0.0002] [0.0000] [0.0004] [0.0000] -0.0016 -0.0030 -0.0014 -0.0023 -0.0001 0.0000 -0.0001 0.0000 Num Generic Manufs per Molc in
Inferior Subclass (Lag 1Q) [0.0021] [0.0031] [0.0017] [0.0025] [0.0001] [0.0000] [0.0001] [0.0000] 0.2585 -0.2298 0.1416 -0.2018 0.0135 -0.0002 0.0089 -0.0005 No Molecules in Superior Subclass
D.V. [0.1848] [0.2583] [0.1947] [0.2353] [0.0105] [0.0002] [0.0129] [0.0006] No Molecules in Inferior Subclass D.V. -0.5880*** -0.3552 -0.5529 -0.3155 -0.0210*** -0.0002 -0.0264 -0.0007 [0.2181] [0.8341] [0.4677] [0.5482] [0.0074] [0.0005] [0.0181] [0.0011] Time Since Global Launch (Yrs) -0.6240*** -0.2767*** -0.4540*** -0.2772*** -0.0291*** -0.0002** -0.0271*** -0.0007*** [0.0578] [0.0323] [0.0536] [0.0288] [0.0046] [0.0001] [0.0049] [0.0002]
0.0231*** 0.0028*** 0.0158*** 0.0029*** 0.0011*** 0.0000** 0.0009*** 0.0000*** Time Since Global Launch Squared (Yrs) [0.0027] [0.0004] [0.0030] [0.0004] [0.0002] [0.0000] [0.0002] [0.0000] First Global Launch Before 1990 D.V. -0.0034 0.5749** -0.2426 0.7042** -0.0002 0.0006* -0.0131 0.0023** [0.1931] [0.2743] [0.2860] [0.3089] [0.0090] [0.0003] [0.0149] [0.0011] First Global Launch in [1996-end] D.V. -0.0497 -0.0329 -0.1018 -0.0383 -0.0023 0.0000 -0.0058 -0.0001 [0.1479] [0.2194] [0.1907] [0.3420] [0.0066] [0.0002] [0.0108] [0.0009] Num Already Launched (UK, Germany) 0.5935*** 0.5632*** 0.4902*** 0.4131*** 0.0290*** 0.0004 0.0301*** 0.0011** [0.0920] [0.1848] [0.0785] [0.1466] [0.0071] [0.0003] [0.0072] [0.0005]
0.5079*** 0.6167*** 0.3935*** 0.3492** 0.0245*** 0.0005* 0.0239*** 0.0009* Num Already Launched (Sweden, Netherlands) [0.0705] [0.1548] [0.0749] [0.1436] [0.0052] [0.0003] [0.0059] [0.0005] Num Already Launched (Italy, France) 0.2688*** 0.0334 0.3057*** 0.0945 0.0126** 0.0000 0.0185*** 0.0002 [0.0986] [0.1192] [0.0840] [0.1364] [0.0055] [0.0001] [0.0058] [0.0004] Num Already Launched (Spain, 0.0670 0.2820*** -0.0409 0.1621* 0.0031 0.0002** -0.0024 0.0004

46
Portugal, Greece) [0.0661] [0.1038] [0.0654] [0.0950] [0.0030] [0.0001] [0.0040] [0.0003] 0.1907*** 0.0034 0.1321** -0.0844 0.0089*** 0.0000 0.0079** -0.0002 Num Already Launched (Canada,
Japan, Switzerland, USA) [0.0637] [0.1011] [0.0560] [0.1048] [0.0030] [0.0001] [0.0035] [0.0003] Any PI Share in Subclass D.V. 0.0161 -0.1603 0.0670 -0.1269 0.0008 -0.0001 0.0041 -0.0003 [0.1536] [0.4589] [0.1510] [0.3596] [0.0072] [0.0003] [0.0092] [0.0009]
1.3954*** 2.5515*** 1.5681*** 3.0584*** 0.1286*** 0.0080* 0.1822*** 0.0274*** Launch by Local Originator Corporation D.V. [0.2676] [0.2759] [0.1626] [0.2261] [0.0458] [0.0042] [0.0420] [0.0104]
0.5481*** 1.3352*** 0.5646*** 1.1030*** 0.0328** 0.0020* 0.0424*** 0.0042** Launch by Solo Licensee Corporation D.V. [0.1765] [0.2071] [0.1551] [0.1928] [0.0130] [0.0011] [0.0157] [0.0018]
0.5592*** 1.6151*** 0.3463* 1.1864*** 0.0340** 0.0029 0.0239 0.0048* Launch by Local Co-marketer Corporation D.V. [0.1786] [0.5425] [0.1984] [0.3468] [0.0145] [0.0026] [0.0160] [0.0028] USD to (ECU or Euro) Exchange Rate 0.0945 -0.1796 -0.1920 -0.9665* 0.0044 -0.0001 -0.0115 -0.0025 [0.4523] [0.5755] [0.4216] [0.5723] [0.0209] [0.0004] [0.0255] [0.0017] UK D.V. -0.2430 0.1925 -0.1616 0.2704 -0.0101 0.0002 -0.0090 0.0008 [0.2096] [0.3408] [0.2000] [0.3605] [0.0085] [0.0003] [0.0111] [0.0010] Netherlands D.V. -0.8790*** 0.6443* -0.7894*** 0.7236* -0.0276*** 0.0007 -0.0343*** 0.0024* [0.2465] [0.3618] [0.2194] [0.3934] [0.0082] [0.0005] [0.0106] [0.0015] Sweden D.V. -0.7520** -0.0208 -0.5688** 0.1684 -0.0249** 0.0000 -0.0269** 0.0005 [0.2968] [0.4805] [0.2307] [0.4521] [0.0099] [0.0003] [0.0116] [0.0012] France D.V. -1.2645*** -0.7394 -1.2202*** -0.5880 -0.0340*** -0.0004 -0.0452*** -0.0012 [0.2103] [0.5553] [0.2304] [0.5148] [0.0078] [0.0004] [0.0110] [0.0012] Greece D.V. -1.2725*** 0.8260 -1.0673*** 1.0116* -0.0341*** 0.0009 -0.0418*** 0.0038* [0.2637] [0.5778] [0.2496] [0.5260] [0.0086] [0.0006] [0.0116] [0.0020] Italy D.V. -0.9829*** 0.0104 -0.8500*** 0.1479 -0.0296*** 0.0000 -0.0361*** 0.0004 [0.2439] [0.5519] [0.2173] [0.4900] [0.0084] [0.0004] [0.0109] [0.0013] Portugal D.V. -1.9128*** 0.0829 -1.7246*** 0.2123 -0.0405*** 0.0001 -0.0536*** 0.0006 [0.2319] [0.6012] [0.2522] [0.5390] [0.0084] [0.0004] [0.0115] [0.0015] Spain D.V. -0.8052*** 0.1745 -0.6327*** 0.2515 -0.0261*** 0.0001 -0.0292*** 0.0007 [0.2007] [0.5481] [0.2181] [0.5054] [0.0079] [0.0004] [0.0112] [0.0014] Canada D.V. -1.0640*** -0.5232 -0.9515*** -0.3179 -0.0310*** -0.0003 -0.0389*** -0.0007 [0.2341] [0.5649] [0.2103] [0.4931] [0.0084] [0.0004] [0.0108] [0.0012] Japan D.V. -2.4793*** -0.0753 -2.5477*** -0.0787 -0.0436*** -0.0001 -0.0613*** -0.0002 [0.2353] [0.6375] [0.2339] [0.4660] [0.0083] [0.0004] [0.0114] [0.0012] Switzerland D.V. -1.0800*** -0.3521 -0.9100*** -0.2888 -0.0313*** -0.0002 -0.0378*** -0.0007 [0.2644] [0.5853] [0.2540] [0.5726] [0.0089] [0.0004] [0.0119] [0.0014] USA D.V. -0.9119*** -1.2651** -0.9440*** -1.3975*** -0.0283*** -0.0005 -0.0387*** -0.0022**

47
[0.2876] [0.6150] [0.2336] [0.4889] [0.0085] [0.0003] [0.0104] [0.0011] Brazil D.V. -1.1626*** 0.3617 -0.9768*** 0.5353 -0.0326*** 0.0003 -0.0395*** 0.0017 [0.2411] [0.5740] [0.2211] [0.4874] [0.0084] [0.0005] [0.0111] [0.0014] Mexico D.V. -1.3041*** 0.1336 -1.1008*** 0.4037 -0.0345*** 0.0001 -0.0426*** 0.0012 [0.2765] [0.6370] [0.2448] [0.5370] [0.0086] [0.0005] [0.0115] [0.0015] Constant -1.1015 -5.6436*** -1.6217 -5.7109*** [0.9652] [1.7327] [1.0217] [1.6644] Therapeutic Class Fixed Effects Included? Yes Yes Yes Yes Yes Yes Yes Yes Num Observations 23,400 96,041 23,400 96,041 23,400 96,041 23,400 96,041 Number of Molecule-level Clusters 111 239 111 239 111 239 111 239 Model Log-Likelihood -3071.2 -2007.6 -3045.7 -1963.4 Mean of Dependent Variable 0.0378 0.0041 0.0378 0.0041 0.0378 0.0041 0.0378 0.0041 Standard errors in brackets * significant at 10%; ** significant at 5%; *** significant at 1% Note: All prices are ex manufacturer prices per standard unit in 2003 US Dollars

48
Table 6. Marginal Effects of Prior Foreign Launch on Launch Hazard in Low-Price EU Countries for Superior Subclasses (Standard Errors in Brackets)
Marginal Effects of Prior Foreign Launch in Low-Price EU Countries
Clog-log with Robust Clustered SEs
0.0018*** Net effect of a Single Prior Launch in a High-Price EU Country [0.0004]
0.0005*** Net effect of a Single Prior Launch in a Low-Price EU Country [0.0002]
0.0013*** Difference
[0.0003]
0.0018*** Net effect of a Single Prior Launch in a High-Price EU Country [0.0004]
0.0006*** Net effect of a Single Prior Launch in a High-Price non-EU Country [0.0002]
0.0012*** Difference
[0.0004] Standard errors in brackets * significant at 10%; ** significant at 5%; *** significant at 1%

49
Table 7. Marginal Effects of Launch by a Local Corporation (Standard Errors in Brackets)
Superior Subclasses Inferior Subclasses
Country
Country-specific
Net Effect
# Launches by Any Local
Corporation
Mean Quarterly Hazard
Country-specific
Net Effect
# Launches by Any Local
Corporation
Mean Quarterly Hazard
Germany 0.0121 11 6.3% 0.0030 6 0.3% [0.0162] [0.0024]
UK 0.0446 10 4.4% 0.0029* 7 0.4% [0.0346] [0.0017]
Netherlands N/A 0 4.4% 0.0140 1 0.2% [0.0222]
Sweden -0.0107 3 3.7% 0.0054 1 0.3% [0.0070] [0.0042]
France 0.0316*** 11 3.2% 0.0009 6 0.3% [0.0111] [0.0008]
Greece N/A 0 3.4% 0.0031 1 0.5% [0.0057]
Italy 0.0145** 21 4.5% 0.0040* 9 0.5% [0.0069] [0.0023]
Spain 0.0110** 4 4.3% 0.0026 5 0.4% [0.0056] [0.0023]
Portugal -0.0001 13 2.4% N/A 0 0.4% [0.0010]
Canada 0.0058 2 3.9% 0.0008 3 0.3% [0.0078] [0.0006]
Japan 0.0092*** 25 1.8% 0.0096* 31 1.0% [0.0029] [0.0057]
Switzerland 0.0448*** 12 4.4% 0.0013 5 0.3% [0.0155] [0.0013]
USA 0.0097 41 5.4% 0.0008 12 0.3% [0.0091] [0.0005]
Brazil 0.0042 2 3.7% 0.0046 6 0.5% [0.0049] [0.0036]
Mexico N/A 0 3.5% 0.0176 3 0.4% [0.0137]
Standard errors in brackets * significant at 10%; ** significant at 5%; *** significant at 1%
Note: Effects for some countries were not estimable due to an absence of launches by local corporations in those countries

50
Table 8. Determinants of Launch Prices, OLS and Normal Random Effects Regressions (Standard Errors in Brackets)
OLS w/ Robust Clustered SEs Normal Random Effects
Variables Superior
SubclassesInferior
SubclassesSuperior
SubclassesInferior
Subclasses Superior
SubclassesInferior
SubclassesSuperior
SubclassesInferior
SubclassesSuperior Brands' Price Missing D.V. -0.0615 0.0172 -0.0636 0.0252 -0.0644 0.0324 -0.0685 0.0362 [0.1879] [0.1199] [0.1886] [0.1205] [0.1134] [0.1114] [0.1138] [0.1125]
0.1574*** -0.004 0.1586*** 0.0018 0.1244*** -0.0085 0.1283*** 0.0032Log Avg Price of Superior Brands (Lag 1Q) [0.0394] [0.0467] [0.0395] [0.0480] [0.0201] [0.0336] [0.0201] [0.0336]Inferior Brands' Price Missing D.V. 0.1093 -0.7439 0.114 -0.8025 0.004 -1.2424** 0.0157 -1.2936*** [0.1523] [0.7108] [0.1541] [0.7423] [0.1118] [0.4849] [0.1121] [0.4878]
0.0393 0.2154*** 0.0387 0.2134*** 0.0844*** 0.1681*** 0.0830*** 0.1669***Log Avg Price of Inferior Brands (Lag 1Q) [0.0398] [0.0490] [0.0397] [0.0488] [0.0206] [0.0294] [0.0206] [0.0297]Generics' Price Missing D.V. 0.0674 0.3731* 0.0689 0.3779* 0.0095 0.2412* 0.0115 0.2416* [0.1168] [0.2001] [0.1165] [0.2011] [0.0758] [0.1236] [0.0761] [0.1251]
0.0292 -0.1194*** 0.0294 -0.1206*** 0.0169 -0.0857** 0.0162 -0.0834**Log Avg Price of Generics in Class (Lag 1Q) [0.0295] [0.0441] [0.0296] [0.0439] [0.0194] [0.0340] [0.0195] [0.0345]Time Since Global Launch (Yrs) -0.0427 -0.0245 -0.0413 -0.0264 -0.0391 -0.0077 -0.0367 -0.0114 [0.0265] [0.0214] [0.0265] [0.0215] [0.0260] [0.0212] [0.0261] [0.0212]
0.0028 -0.0006 0.0027 -0.0005 0.0005 -0.0012* 0.0003 -0.0011Time Since Global Launch Squared (Yrs) [0.0018] [0.0006] [0.0018] [0.0006] [0.0018] [0.0007] [0.0018] [0.0007]
0.1998 0.8668** 0.2034 0.8990** 0.2132 1.1729*** 0.2164* 1.2199***First Brand Launch in Ctry-Subclass D.V. [0.1656] [0.4080] [0.1656] [0.4390] [0.1307] [0.3525] [0.1312] [0.3562]
0.3496*** 0.6166* 0.3486*** 0.6076* 0.2819*** 0.6197*** 0.2770*** 0.6406***Second Brand Launch in Ctry-Subclass D.V. [0.0824] [0.3115] [0.0824] [0.3244] [0.0749] [0.2309] [0.0751] [0.2321]
0.2412*** 0.3085* 0.2399*** 0.3039* 0.1859*** 0.2007 0.1816*** 0.2066Third or Fourth Brand Launch in Ctry-Subclass D.V. [0.0611] [0.1615] [0.0613] [0.1631] [0.0555] [0.1465] [0.0557] [0.1471]
0.2170*** -0.0523 0.2138** -0.043 0.0649 -0.0451 0.0631 -0.0526High-price EU Min Own Price Missing D.V. [0.0821] [0.1372] [0.0821] [0.1379] [0.0575] [0.0956] [0.0578] [0.0966]
0.2179*** 0.3905*** 0.2174*** 0.3960*** 0.1000*** 0.2746*** 0.1012*** 0.2847***Log Min Own Price in Hi-Price EU (Lag 1Q) [0.0623] [0.0885] [0.0622] [0.0890] [0.0261] [0.0586] [0.0262] [0.0590]
-0.0185 -0.0755 -0.0161 -0.0733 0.0251 0.0545 0.03 0.051Low-price EU Min Own Price Missing D.V. [0.0524] [0.1262] [0.0527] [0.1259] [0.0483] [0.1028] [0.0485] [0.1039]
-0.0243 -0.1086 -0.0234 -0.101 -0.0221 -0.1095 -0.0188 -0.1113Log Min Own Price in Low-Price EU (Lag 1Q) [0.0394] [0.1196] [0.0390] [0.1184] [0.0279] [0.0790] [0.0280] [0.0797]

51
0.1054 -0.3101*** 0.1076 -0.3195*** 0.1019* -0.1126 0.1049* -0.1244High-price non-EU Min Own Price Missing D.V. [0.0649] [0.1100] [0.0651] [0.1112] [0.0554] [0.0926] [0.0556] [0.0936]
0.2682*** 0.0482 0.2677*** 0.0532 0.1433*** -0.0278 0.1425*** -0.0197Log Min Own Price in Hi-Price non-EU (Lag 1Q) [0.0522] [0.0661] [0.0519] [0.0640] [0.0251] [0.0564] [0.0252] [0.0570]Any PI Share in Subclass D.V. 0.022 -0.5218** 0.0232 -0.4815** 0.0207 -0.4798*** 0.0236 -0.4662*** [0.0795] [0.2029] [0.0786] [0.2134] [0.0650] [0.1710] [0.0653] [0.1732]Log GDP per Capita 0.862 2.8591* 1.8350** 3.1564*** [0.9232] [1.5889] [0.7426] [1.1628]
0.0311 -0.2572* 0.0332 -0.2823* 0.0693 -0.1825 0.0739 -0.2207*Launch by Local Originator Corporation D.V. [0.1009] [0.1541] [0.1011] [0.1551] [0.0694] [0.1146] [0.0696] [0.1148]
-0.0742 -0.1455 -0.0708 -0.1377 -0.0543 -0.0178 -0.0452 -0.0126Launch by Solo Licensee Corporation D.V. [0.0770] [0.1246] [0.0768] [0.1238] [0.0623] [0.0940] [0.0625] [0.0951]
0.0031 -0.1025 0.0038 -0.1282 0.0265 -0.1417 0.0288 -0.1679Launch by Local Co-marketer Corporation D.V. [0.0971] [0.1908] [0.0980] [0.1937] [0.0782] [0.1457] [0.0785] [0.1470]USD to (ECU or Euro) Exchange Rate -0.1475 2.4535** -0.1373 2.2873** -0.0265 1.7490** 0.0042 1.5484* [0.6339] [1.0738] [0.6234] [1.0742] [0.4524] [0.8151] [0.4542] [0.8220]
-0.0089** 0.002 -0.0065 0.0101 -0.0088** -0.0122* -0.0038 -0.0021Country-Specific Quarterly Producer Price Index [0.0044] [0.0083] [0.0039] [0.0064] [0.0044] [0.0067] [0.0039] [0.0056]Avg Pack Size (Up to 100) -0.0118*** -0.0102*** -0.0118*** -0.0100*** -0.0094*** -0.0093*** -0.0093*** -0.0093*** [0.0017] [0.0025] [0.0017] [0.0025] [0.0010] [0.0017] [0.0010] [0.0017]Pack Size > 100 D.V. -1.1996*** -1.6199*** -1.2014*** -1.5868*** -0.9891*** -1.4086*** -0.9930*** -1.4137*** [0.1880] [0.2118] [0.1888] [0.2062] [0.1114] [0.1754] [0.1118] [0.1773]Avg Pill Strength (g) 0.4791* 0.0507 0.4928** 0.045 0.0577 0.1877 0.0766 0.1844 [0.2452] [0.0701] [0.2457] [0.0704] [0.2737] [0.1440] [0.2738] [0.1437]Form: Oral Solid Delayed D.V. -0.1014 -0.191 -0.1092 -0.1573 0.1059 0.0933 0.0926 0.0949 [0.1994] [0.1444] [0.1988] [0.1452] [0.1823] [0.1567] [0.1829] [0.1582]Form: Injectable D.V. 2.0793*** 1.7450*** 2.0865*** 1.7304*** 1.7654*** 1.9669*** 1.7827*** 1.9652*** [0.3009] [0.3579] [0.3025] [0.3570] [0.0885] [0.2165] [0.0887] [0.2185]Form: Other -0.0523 0.3387*** -0.0551 0.3414*** 0.0793 0.0856 0.0734 0.0754 [0.1683] [0.1087] [0.1663] [0.1101] [0.1702] [0.1270] [0.1708] [0.1278]UK D.V. -0.3218*** -0.1577 -0.2751*** -0.0316 -0.2829*** -0.1225 -0.1861** 0.0103 [0.0957] [0.1238] [0.0827] [0.1202] [0.0875] [0.1532] [0.0784] [0.1472]Netherlands D.V. -0.0707 0.0041 -0.0734 -0.0454 -0.0669 -0.0277 -0.0711 -0.0781 [0.1034] [0.1372] [0.1022] [0.1291] [0.0798] [0.1557] [0.0802] [0.1568]Sweden D.V. -0.1746 -0.1626 -0.0541 0.2208 -0.3307** -0.3624 -0.0743 0.0489 [0.1684] [0.2808] [0.0859] [0.2142] [0.1335] [0.2211] [0.0844] [0.1645]

52
France D.V. -0.2055* -0.7264*** -0.2382** -0.8051*** -0.1272 -0.6820*** -0.1956** -0.8015*** [0.1117] [0.2689] [0.1098] [0.2668] [0.1003] [0.2275] [0.0969] [0.2264]Greece D.V. 0.2805 1.2931 -0.3932*** -0.8704*** 1.1945** 1.6279* -0.2393** -0.7916*** [0.7187] [1.2267] [0.1198] [0.2541] [0.5893] [0.9173] [0.1050] [0.2231]Italy D.V. -0.19 -0.286 -0.3485*** -0.7525*** 0.0835 -0.0639 -0.2521*** -0.6007*** [0.1922] [0.3790] [0.1031] [0.2579] [0.1664] [0.2958] [0.0970] [0.2237]Portugal D.V. 0.373 1.4824 -0.3098*** -0.7693*** 1.2153** 1.8910** -0.2341** -0.6161*** [0.7279] [1.2936] [0.1107] [0.2566] [0.5961] [0.9494] [0.1077] [0.2260]Spain D.V. 0.1941 0.8328 -0.2498** -0.6269*** 0.7733** 0.9693 -0.1710* -0.6661*** [0.4840] [0.8717] [0.0992] [0.2389] [0.3931] [0.6412] [0.0928] [0.2222]Canada D.V. 0.0439 -0.2773 0.0363 -0.2971 0.0338 -0.2256 0.0197 -0.2684 [0.1078] [0.2963] [0.1054] [0.3000] [0.0923] [0.2247] [0.0925] [0.2273]Japan D.V. 0.1482 -0.965 0.5852*** 0.5110* -0.3752 -1.0523 0.5573*** 0.5585** [0.5017] [0.8135] [0.2021] [0.2901] [0.3967] [0.6419] [0.1221] [0.2475]Switzerland D.V. -0.1417 -1.6358** 0.2091** -0.4370* -0.6109* -1.5100*** 0.1389 -0.2329 [0.4039] [0.6852] [0.0911] [0.2507] [0.3162] [0.5209] [0.0888] [0.2234]United States D.V. 0.1838 -0.8207 0.5272*** 0.3319 -0.35 -1.0079** 0.3833*** 0.2312 [0.4014] [0.6421] [0.1347] [0.2545] [0.3125] [0.5095] [0.0987] [0.2295]Brazil D.V. 1.2852 4.733 -0.3136*** -0.5128** 3.1815** 5.3703** -0.2182** -0.4591** [1.6940] [2.9427] [0.1111] [0.2464] [1.3787] [2.1576] [0.0940] [0.2198]Mexico D.V. 0.9276 2.9574 -0.2477** -0.9032*** 2.3375** 3.4723** -0.1610* -0.8161*** [1.2631] [2.1732] [0.1215] [0.2317] [1.0153] [1.5948] [0.0960] [0.2294]
Constant -7.0696 -30.4859* 1.2244 -2.7327* -16.8192**-
31.7366*** 0.8265 -1.0996 [8.7738] [15.4844] [0.8798] [1.5754] [7.1791] [11.3552] [0.7247] [1.1956] Log GDP per Capita Included? Yes Yes No No Yes Yes No No Year Fixed Effects Included? Yes Yes Yes Yes Yes Yes Yes Yes Observations 950 423 950 423 950 423 950 423 Number of Molecule-level Clusters 109 123 109 123 109 123 109 123 R-squared 0.89 0.79 0.89 0.79 0.87 0.76 0.87 0.76 Mean of Dependent Variable 0.74 -0.39 0.74 -0.39 0.74 -0.39 0.74 -0.39 Standard errors in brackets * significant at 10%; ** significant at 5%; *** significant at 1% Note: All prices are ex manufacturer prices per standard unit in 2003 US Dollars

53
Table 9. Spillover Effects of Own Price on Launch Price in Low-Price EU Countries for Superior Subclasses
Marginal Effects of Log Min Own Price on Launch Price in Low-Price EU Countries
OLS w/ Robust
Clustered SEs
Normal Random Effects
0.4236*** 0.2508*** Net effect of Log Min Own Price in High-Price EU Countries (Lag 1Q) [0.0861] [0.0845]
0.0366 -0.0096 Net effect of Log Min Own Price in Low-Price EU Countries (Lag 1Q) [0.0591] [0.0432]
0.3870*** 0.2604** Difference
[0.1103] [0.1055]
0.4236*** 0.2508*** Net effect of Log Min Own Price in High-
Price EU Countries (Lag 1Q) [0.0861] [0.0845]
0.0551 0.0096 Net effect of Log Min Own Price in High-Price non-EU Countries (Lag 1Q) [0.0837] [0.0778]
0.3684** 0.2411 Difference
[0.1641] [0.1580] Standard errors in brackets * significant at 10%; ** significant at 5%; *** significant at 1% Note: All prices are ex manufacturer prices per standard unit in 2003 US dollars
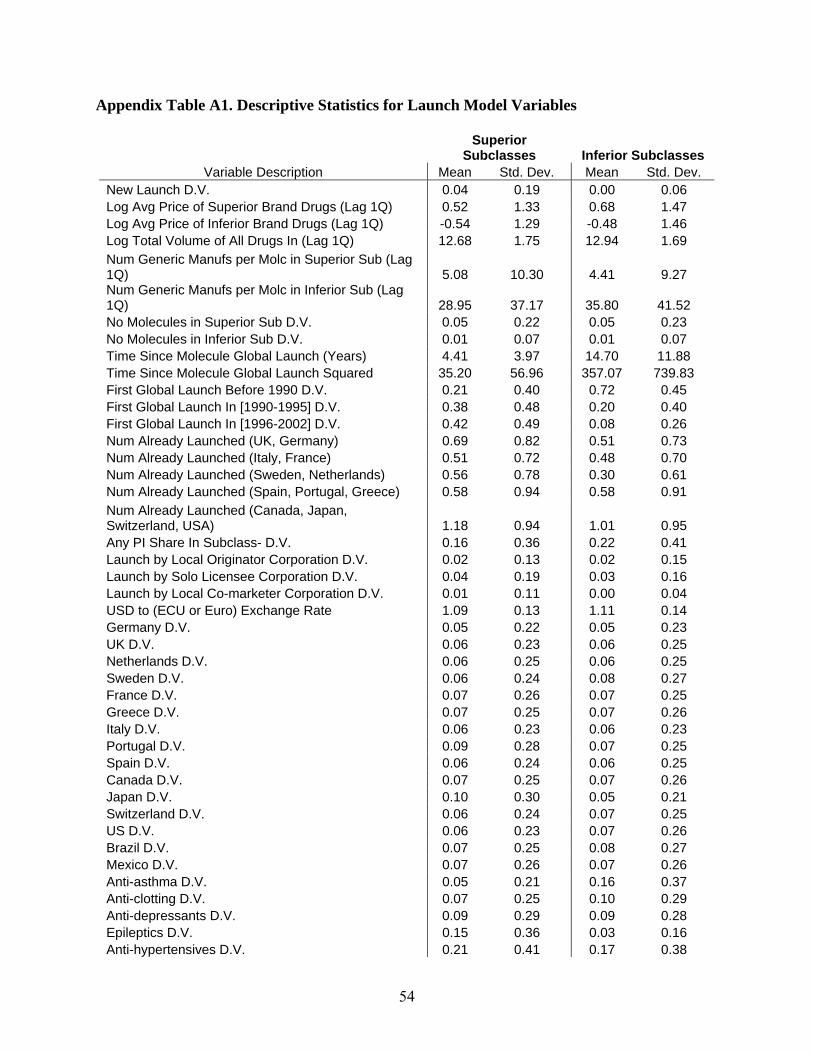
54
Appendix Table A1. Descriptive Statistics for Launch Model Variables
Superior
Subclasses Inferior Subclasses Variable Description Mean Std. Dev. Mean Std. Dev.
New Launch D.V. 0.04 0.19 0.00 0.06 Log Avg Price of Superior Brand Drugs (Lag 1Q) 0.52 1.33 0.68 1.47 Log Avg Price of Inferior Brand Drugs (Lag 1Q) -0.54 1.29 -0.48 1.46 Log Total Volume of All Drugs In (Lag 1Q) 12.68 1.75 12.94 1.69
Num Generic Manufs per Molc in Superior Sub (Lag 1Q) 5.08 10.30 4.41 9.27 Num Generic Manufs per Molc in Inferior Sub (Lag 1Q) 28.95 37.17 35.80 41.52 No Molecules in Superior Sub D.V. 0.05 0.22 0.05 0.23 No Molecules in Inferior Sub D.V. 0.01 0.07 0.01 0.07 Time Since Molecule Global Launch (Years) 4.41 3.97 14.70 11.88 Time Since Molecule Global Launch Squared 35.20 56.96 357.07 739.83 First Global Launch Before 1990 D.V. 0.21 0.40 0.72 0.45 First Global Launch In [1990-1995] D.V. 0.38 0.48 0.20 0.40 First Global Launch In [1996-2002] D.V. 0.42 0.49 0.08 0.26 Num Already Launched (UK, Germany) 0.69 0.82 0.51 0.73 Num Already Launched (Italy, France) 0.51 0.72 0.48 0.70 Num Already Launched (Sweden, Netherlands) 0.56 0.78 0.30 0.61 Num Already Launched (Spain, Portugal, Greece) 0.58 0.94 0.58 0.91
Num Already Launched (Canada, Japan, Switzerland, USA) 1.18 0.94 1.01 0.95 Any PI Share In Subclass- D.V. 0.16 0.36 0.22 0.41 Launch by Local Originator Corporation D.V. 0.02 0.13 0.02 0.15 Launch by Solo Licensee Corporation D.V. 0.04 0.19 0.03 0.16 Launch by Local Co-marketer Corporation D.V. 0.01 0.11 0.00 0.04 USD to (ECU or Euro) Exchange Rate 1.09 0.13 1.11 0.14 Germany D.V. 0.05 0.22 0.05 0.23 UK D.V. 0.06 0.23 0.06 0.25 Netherlands D.V. 0.06 0.25 0.06 0.25 Sweden D.V. 0.06 0.24 0.08 0.27 France D.V. 0.07 0.26 0.07 0.25 Greece D.V. 0.07 0.25 0.07 0.26 Italy D.V. 0.06 0.23 0.06 0.23 Portugal D.V. 0.09 0.28 0.07 0.25 Spain D.V. 0.06 0.24 0.06 0.25 Canada D.V. 0.07 0.25 0.07 0.26 Japan D.V. 0.10 0.30 0.05 0.21 Switzerland D.V. 0.06 0.24 0.07 0.25 US D.V. 0.06 0.23 0.07 0.26 Brazil D.V. 0.07 0.25 0.08 0.27 Mexico D.V. 0.07 0.26 0.07 0.26 Anti-asthma D.V. 0.05 0.21 0.16 0.37 Anti-clotting D.V. 0.07 0.25 0.10 0.29 Anti-depressants D.V. 0.09 0.29 0.09 0.28 Epileptics D.V. 0.15 0.36 0.03 0.16 Anti-hypertensives D.V. 0.21 0.41 0.17 0.38
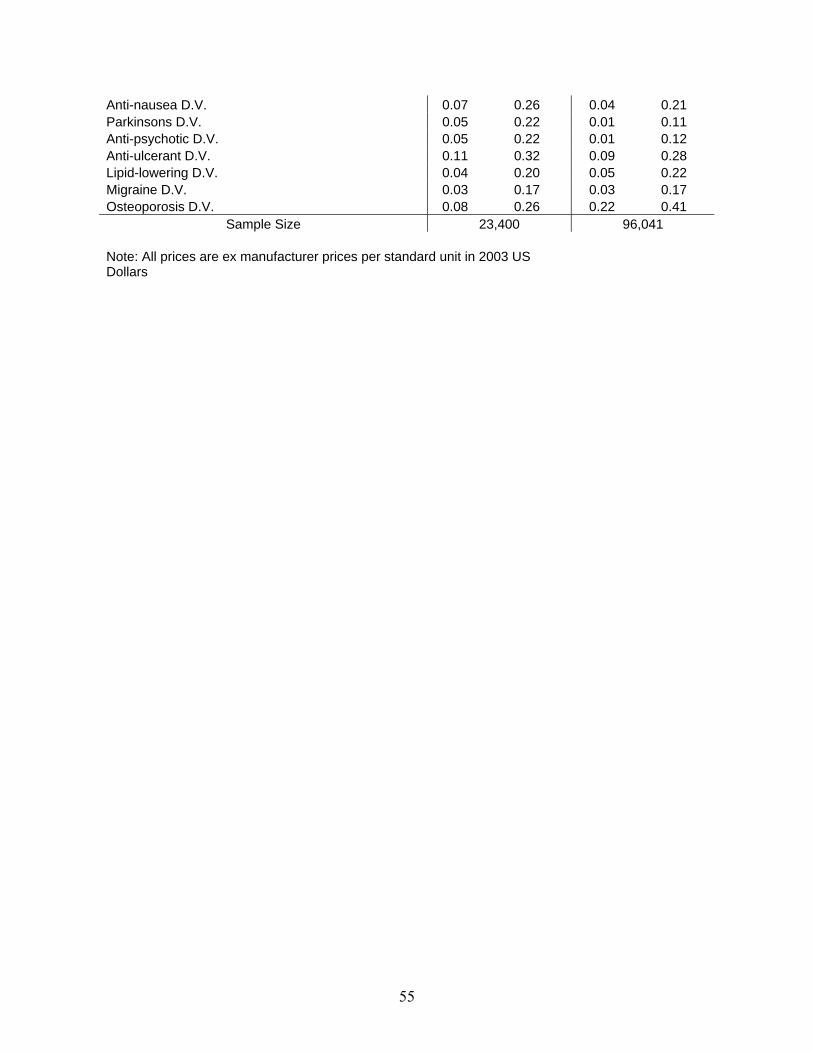
55
Anti-nausea D.V. 0.07 0.26 0.04 0.21 Parkinsons D.V. 0.05 0.22 0.01 0.11 Anti-psychotic D.V. 0.05 0.22 0.01 0.12 Anti-ulcerant D.V. 0.11 0.32 0.09 0.28 Lipid-lowering D.V. 0.04 0.20 0.05 0.22 Migraine D.V. 0.03 0.17 0.03 0.17 Osteoporosis D.V. 0.08 0.26 0.22 0.41
Sample Size 23,400 96,041 Note: All prices are ex manufacturer prices per standard unit in 2003 US Dollars

56
Appendix Table A2. Descriptive Statistics for Price Model Variables
Superior
Subclasses Inferior SubclassesVariable Description Mean Std. Dev. Mean Std. Dev.
Log of Price in 2003 USD per SU 0.74 1.65 -0.39 1.31 Price in 2003 USD per SU 27.95 150.13 7.10 46.63 Superior Brands' Price Missing D.V. 0.08 0.28 0.13 0.33 Log Avg Price of Superior Brands (Lag 1Q) 0.66 1.39 0.29 1.27 Inferior Brands' Price Missing D.V. 0.02 0.14 0.01 0.11 Log Avg Price of Inferior Brands (Lag 1Q) -0.53 1.41 -0.55 1.40 Generics' Price Missing D.V. 0.11 0.32 0.12 0.33 Log Avg Price of Generics In Class (Lag 1Q) -1.23 1.05 -1.06 1.11 Time Since Global Launch (Years) 2.16 2.49 6.54 7.32 Time Since Global Launch Squared 10.87 30.65 96.22 211.51 First Brand Launch in Ctry-Subclass D.V. 0.11 0.31 0.01 0.12 Second Brand Launch in Ctry-Subclass D.V. 0.15 0.36 0.03 0.17 Third or Fourth Brand Launch in Ctry-Subclass D.V. 0.30 0.46 0.11 0.31 Fifth or Later Brand Launch in Ctry-Subclass D.V. 0.44 0.50 0.85 0.36 High-price EU Min Own Price Missing D.V. 0.24 0.43 0.37 0.48 Log Min Own Price in Hi-Price EU (Lag 1Q) 0.41 1.33 -0.31 1.02 Low-price EU Min Own Price Missing D.V. 0.47 0.50 0.43 0.50 Log Min Own Price in Low-Price EU (Lag 1Q) 0.12 0.90 -0.55 0.72 High-price non-EU Min Own Price Missing D.V. 0.29 0.45 0.50 0.50 Log Min Own Price in Hi-Price non-EU (Lag 1Q) 0.60 1.45 -0.31 0.89 Any PI Share In Ctry-Subclass D.V. 0.16 0.36 0.18 0.38 Log GDP per Capita (in 2000 USD 000s) 9.71 0.66 9.60 0.73 Launch by Local Originator Corporation D.V. 0.07 0.26 0.11 0.32 Launch by Solo Licensee Corporation D.V. 0.07 0.26 0.11 0.31 Launch by Local Co-marketer Corporation D.V. 0.05 0.21 0.05 0.22 USD to (ECU or Euro) Exchange Rate 1.12 0.13 1.15 0.13 Country-Specific Quarterly Producer Price Index 95.14 6.84 93.52 9.46 Avg Pack Size (Up to 100) 33.01 28.15 31.42 27.18 Avg Pack Size > 100 D.V. 0.05 0.23 0.15 0.36 Avg Pill Strength 0.08 0.13 0.09 0.29 Form Oral Instant D.V. 0.85 0.35 0.67 0.47 Form Oral Delayed D.V. 0.01 0.09 0.06 0.24 Form Injectable D.V. 0.11 0.31 0.05 0.23 Form Other D.V. 0.03 0.17 0.21 0.41 Germany D.V. 0.08 0.27 0.05 0.21 UK D.V. 0.07 0.25 0.10 0.31 Netherlands D.V. 0.06 0.24 0.05 0.22 Sweden D.V. 0.07 0.26 0.05 0.22 France D.V. 0.06 0.24 0.06 0.24 Greece D.V. 0.06 0.24 0.10 0.30 Italy D.V. 0.07 0.26 0.07 0.26 Portugal D.V. 0.05 0.22 0.07 0.25 Spain D.V. 0.06 0.23 0.05 0.22 Canada D.V. 0.07 0.25 0.05 0.22 Japan D.V. 0.05 0.21 0.11 0.31

57
Switzerland D.V. 0.07 0.26 0.06 0.24 USA D.V. 0.08 0.27 0.05 0.23 Brazil D.V. 0.07 0.25 0.05 0.23 Mexico D.V. 0.07 0.25 0.07 0.25 Year 1992 D.V. 0.07 0.25 0.13 0.33 Year 1993 D.V. 0.07 0.25 0.14 0.34 Year 1994 D.V. 0.07 0.25 0.09 0.29 Year 1995 D.V. 0.08 0.27 0.07 0.26 Year 1996 D.V. 0.08 0.28 0.11 0.32 Year 1997 D.V. 0.13 0.34 0.15 0.35 Year 1998 D.V. 0.15 0.36 0.07 0.25 Year 1999 D.V. 0.10 0.30 0.04 0.21 Year 2000 D.V. 0.09 0.28 0.07 0.25 Year 2001 D.V. 0.07 0.25 0.06 0.23 Year 2002 D.V. 0.05 0.22 0.05 0.23 Year 2003 D.V. 0.05 0.21 0.03 0.16
Sample Size 950 423 Note: All prices are ex manufacturer prices per standard unit in 2003 US Dollars
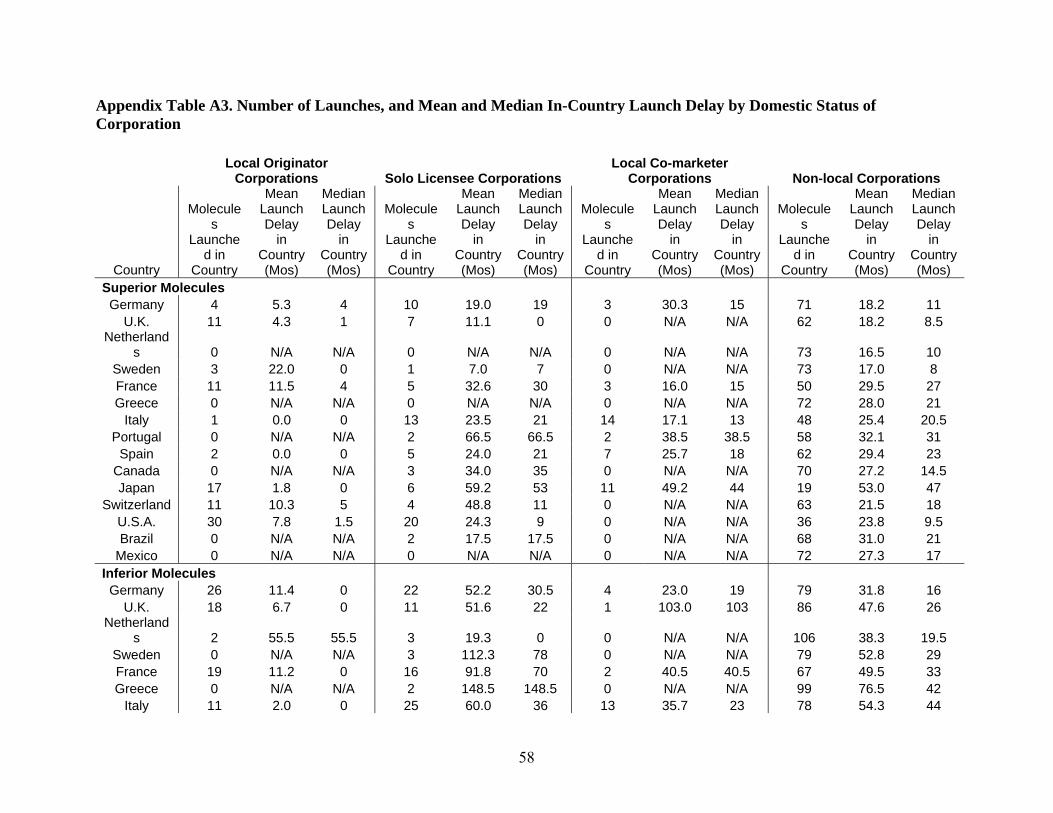
58
Appendix Table A3. Number of Launches, and Mean and Median In-Country Launch Delay by Domestic Status of Corporation
Local Originator
Corporations Solo Licensee Corporations Local Co-marketer
Corporations Non-local Corporations
Country
Molecules
Launched in
Country
Mean Launch Delay
in Country (Mos)
Median Launch Delay
in Country (Mos)
Molecules
Launched in
Country
Mean Launch Delay
in Country (Mos)
Median Launch Delay
in Country (Mos)
Molecules
Launched in
Country
Mean Launch Delay
in Country (Mos)
Median Launch Delay
in Country (Mos)
Molecules
Launched in
Country
Mean Launch Delay
in Country (Mos)
Median Launch Delay
in Country (Mos)
Superior Molecules Germany 4 5.3 4 10 19.0 19 3 30.3 15 71 18.2 11
U.K. 11 4.3 1 7 11.1 0 0 N/A N/A 62 18.2 8.5 Netherland
s 0 N/A N/A 0 N/A N/A 0 N/A N/A 73 16.5 10 Sweden 3 22.0 0 1 7.0 7 0 N/A N/A 73 17.0 8 France 11 11.5 4 5 32.6 30 3 16.0 15 50 29.5 27 Greece 0 N/A N/A 0 N/A N/A 0 N/A N/A 72 28.0 21
Italy 1 0.0 0 13 23.5 21 14 17.1 13 48 25.4 20.5 Portugal 0 N/A N/A 2 66.5 66.5 2 38.5 38.5 58 32.1 31
Spain 2 0.0 0 5 24.0 21 7 25.7 18 62 29.4 23 Canada 0 N/A N/A 3 34.0 35 0 N/A N/A 70 27.2 14.5 Japan 17 1.8 0 6 59.2 53 11 49.2 44 19 53.0 47
Switzerland 11 10.3 5 4 48.8 11 0 N/A N/A 63 21.5 18 U.S.A. 30 7.8 1.5 20 24.3 9 0 N/A N/A 36 23.8 9.5 Brazil 0 N/A N/A 2 17.5 17.5 0 N/A N/A 68 31.0 21
Mexico 0 N/A N/A 0 N/A N/A 0 N/A N/A 72 27.3 17 Inferior Molecules Germany 26 11.4 0 22 52.2 30.5 4 23.0 19 79 31.8 16
U.K. 18 6.7 0 11 51.6 22 1 103.0 103 86 47.6 26 Netherland
s 2 55.5 55.5 3 19.3 0 0 N/A N/A 106 38.3 19.5 Sweden 0 N/A N/A 3 112.3 78 0 N/A N/A 79 52.8 29 France 19 11.2 0 16 91.8 70 2 40.5 40.5 67 49.5 33 Greece 0 N/A N/A 2 148.5 148.5 0 N/A N/A 99 76.5 42
Italy 11 2.0 0 25 60.0 36 13 35.7 23 78 54.3 44

59
Portugal 0 N/A N/A 5 49.0 51 2 7.0 7 104 61.6 41 Spain 8 5.8 0 11 47.0 24 4 35.0 29 87 48.4 40
Canada 1 17.0 17 10 99.1 124.5 0 N/A N/A 87 71.5 52 Japan 45 0.7 0 36 64.6 56 24 68.8 54.5 53 65.5 54
Switzerland 25 6.5 0 10 69.4 43.5 0 N/A N/A 76 38.2 21 U.S.A. 29 74.4 31 33 109.9 85 1 89.0 89 34 76.9 41 Brazil 3 36.0 0 4 67.5 68 1 40.0 40 82 87.4 54
Mexico 1 0.0 0 2 122.0 122 0 N/A N/A 98 54.6 34
Note: Sample includes all molecules present and all country launches occurring in IMS dataset through 2003
Note: Molecules with multiple local corporations in a country were assigned to a single one in the order of Local Originator, Solo Licensee or Local Co-marketer