Air Quality Impacts from Prescribed Burning: Fort Benning Case Study
Prepared in cooperation with the US Fish and Wildlife Service
Effects of Prescribed Burning on Marsh-Elevation Change and the Risk of Wetland Loss
Open-File Report 2012-1031 US Department of the Interior US Geological Survey
i
US Department of the Interior KEN SALAZAR Secretary
US Geological Survey Marcia K McNutt Director
US Geological Survey Reston Virginia 2012
For product and ordering information World Wide Web httpwwwusgsgovpubprod Telephone 1-888-ASK-USGS
For more information on the USGSmdashthe Federal source for science about the Earth its natural and living resources natural hazards and the environment World Wide Web httpwwwusgsgov Telephone 1-888-ASK-USGS
Suggested citation McKee KL and Grace JB 2012 Effects of prescribed burning on marsh-elevation change and the risk of wetland loss US Geological Survey Open-File Report 2012-1031 51 p
Any use of trade product or firm names is for descriptive purposes only and does not imply endorsement by the US Government
Although this report is in the public domain permission must be secured from the individual copyright owners to reproduce any copyrighted material contained within this report
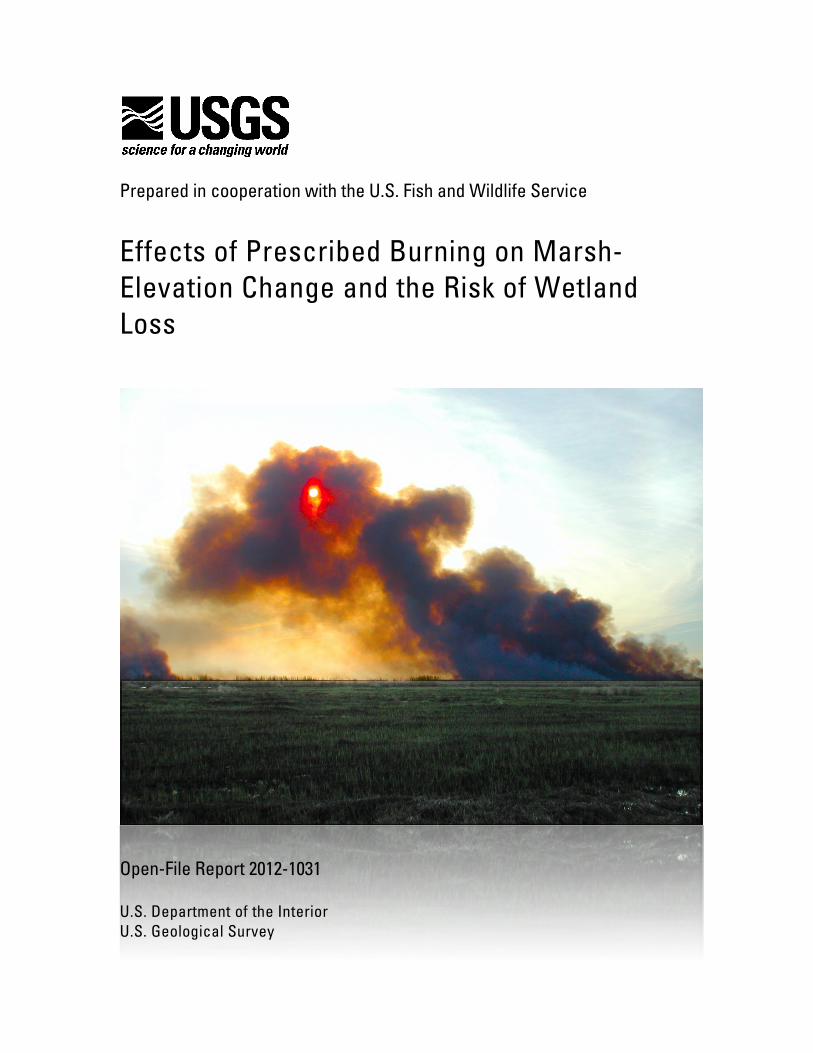
Cover The McFaddin National Wildlife Refuge marsh during a prescribed burn photograph by Tommy McGinnis
ii
Acknowledgments
This project was funded in part by the US Geological Survey-Fish and Wildlife Service
(USGS-FWS) Science Support Partnership (Project Number 05-R2-02) We acknowledge
associate USGS investigators Don Cahoon and Glenn Guntenspergen (Patuxent Wildlife
Research Center) and FWS partners Andy Loranger and Patrick Walther (Texas Chenier
Plain National Wildlife Refuge Complex) We greatly appreciate the cooperation and
support provided by the personnel at the McFaddin National Wildlife Refuge including
Craig Crenshaw Doug Head and Mike Nance Several people assisted in installation of
plots and SETs or in data collection Heather Baldwin Julia Cherry Wes Cochran Kari
Cretini Ada Diz Andy From Amber Hanna Philippe Hensel Jim Lynch Tommy
McGinnis Amy Trahan Ellen Travis and William Vervaeke We also appreciate the
comments and suggestions of Connie Herndon Beth Middleton and Chris Swarzenski on
earlier versions of this report
iii
Contents
Abstract 1
Introduction 4
Scope of Research 6
Study Area 7
Experimental Design 10
Methods 15
Measuring Elevation Dynamics 15
Measuring Aboveground and Belowground Plant Responses 18
Measuring Decomposition 19
Assessing Physicochemical Conditions 20
Performing Statistical Analyses 21
Results and Discussion 22
Conclusions 42
General Implications for Resource Management 42
Research Implications 44
References Cited 47
iv
Figures
Figure 1 Map of the study site at McFaddin National Wildlife Refuge (top panel) and views
(lower panels) of an experimental plot through four seasons prior to the prescribed burn 8
Figure 2 Setup of experimental plots Clockwise from top left (1) construction of platforms (2)
study plot demarcated by access platform (3) driving benchmark rods for installation of surface
elevation tables (SET) (4) SET receiver cemented to deep benchmark rod 11
Figure 3 Schematic diagram of experimental plot showing positions of various measurements
made during the study 12
Figure 4 Views of study area during and after burn treatment (December 2006) Clockwise from
top left (1) prescribed burn (2) initial plant regrowth after burn (3) elevation measurement after
burn treatment (4) plant regrowth in spring 2007 13
Figure 5 Surface temperatures recorded by data loggers during the prescribed burn on
December 3 2006 The upper panel shows data for experimental plots M13-16 (black lines) and
M1-4 (gray lines) The lower panel shows data for the surrounding marsh to the northwest (NW)
southwest (SW) and northeast (NE) of the plots 14
Figure 6 Diagram showing the rod surface elevation table (SET) in relation to deep and shallow
benchmarks and marker horizon which demarcate three strata in the soil profile to allow vertical
delineation of processes controlling elevation change 16
Figure 7 Methods used to measure elevation change accretion subsidence and root zone
movement Clockwise from top left (1) Adding feldspar clay to soil surface to create a marker
horizon (2) Measuring thickness of accreted sediment above the marker horizon (3) measuring
arm of the surface elevation table being attached to the deep benchmark rod (4) Fiberglass pins
being lowered to the soil surface and to the shallow benchmark (white cap) 17
v
Figure 8 Methods used to measure response to treatments Clockwise from top left (1) Clipping
of aboveground biomass and litter collection (2) Collection of porewater for measurement of
salinity pH sulfide and nutrients (3) Installation of in-growth bags to measure rates of
belowground accumulation of root matter (4) Installation of a standardized cellulose material to
measure decomposition rates 19
Figure 9 Time-course of elevation change (σ) and accretion above marker horizon (θ) in
nonburned and burned plots (mean plusmn standard error n = 8 averaged over nutrient treatment)
Note different scales for Y-axis before (left) and after (right) Hurricanes Gustav and Ike25
Figure 10 Variation in elevation-change rate (Y-axis) in relation to vertical movement (X-axis) in
three strata including accretion (top panels) root zone (middle panels) and subroot zone (bottom
panels) Rates of change measured before and after Hurricane Ike (September 9 2008) are plotted
in left or right panels respectively Treatment plots are indicated by closed (burned) or open
(nonburned) symbols Inset values are correlation coefficients 27
Figure 11 Standing live and dead biomass and fallen litter in burned and unburned plots
(averaged over nutrient treatments mean value plusmn standard error n = 8) The prescribed burn
occurred on December 3 2006 31
Figure 12 Variation in live and dead stem density in burned and nonburned plots (averaged
over nutrient treatment mean value plusmn standard error n = 8) The prescribed burn occurred on
December 3 2006 32
Figure 13 Aboveground and belowground production of biomass (averaged over burn and
nutrient treatments mean value plusmn standard error n =8) The prescribed burn occurred on
December 3 2006 34
vi
Figure 14 Depth variation in decomposition of standard cellulose material in burned and
nonburned plots (summer of 2007) (averaged over nutrient treatment mean value plusmn standard
error n = 8) 36
Figure 15 Soil redox potential (Eh) at soil depth (in centimeters) and porewater salinity pH
sulfide ammonium (NH4) and phosphate (PO4) measured seasonally in experimental plots
(averaged over treatments mean value plusmn standard error n = 16) 38
Figure 16 Conceptual model illustrating internal processes and external drivers influencing
vertical movement in three soil strata in a brackish marsh dominated by Spartina patens including
accretion above a marker horizon root zone and subroot zone Observed effects of burning
nutrient addition and hurricanes are indicated as follows + (positive) - (negative) and 0 (none) 46
Tables
Table 1 Summary of area (hectares) burned in McFaddin National Wildlife Refuge during the
study period 9
Table 2 Summary of relative sea-level rise (SLR) and elevation dynamics in burned and
nonburned plots at McFaddin National Wildlife Refuge prior to Hurricanes Gustav and Ike
(September 2008) Values (in millimeters per year) are the mean value plusmn standard error 40
vii
Conversion Factors
SI to InchPound Multiply By To obtain
Length centimeter (cm) 03937 inch (in)
millimeter (mm) 003937 inch (in)
meter (m) 1094 yard (yd)
Area square meter (m2) 00002471 acre
hectare (ha) 2471 acre
square millimeter (mm2) 0001550 square inch (in2)
square meter (m2) 1076 square foot (ft2)
Mass gram (g) 003527 ounce avoirdupois (oz)
Energy millivolt (mV) 0001 volt
-Temperature in degrees Celsius (degC) may be converted to degrees Fahrenheit (degF) as follows
degF=(18timesdegC)+32
-Vertical coordinate information is referenced to North American Vertical Datum of 1988 (NAVD 88)
-Salinity is expressed in permille (permil) units which is approximately equal to the grams of salt per kilogram of
solution In this study salinity was determined based on the refractive index of the solution and converted to
permille units by the instrument (refractometer)
1
Effects of Prescribed Burning on Marsh-Elevation Change and the Risk of Wetland Loss By Karen L McKee and James B Grace
Abstract
Marsh-elevation change is the net effect of biophysical processes controlling
inputs versus losses of soil volume In many marshes accumulation of organic matter is
an important contributor to soil volume and vertical land building In this study we
examined how prescribed burning a common marsh-management practice may affect
elevation dynamics in the McFaddin National Wildlife Refuge Texas by altering
organic-matter accumulation Experimental plots were established in a brackish marsh
dominated by Spartina patens a grass found throughout the Gulf of Mexico and Atlantic
marshes Experimental plots were subjected to burning and nutrient-addition treatments
and monitored for 35 years (April 2005 ndash November 2008) Half of the plots were
burned once in 2006 half of the plots were fertilized seasonally with nitrogen
phosphorus and potassium Before and after the burns seasonal measurements were
made of soil physicochemistry vegetation structure standing and fallen plant biomass
aboveground and belowground production decomposition and accretion and elevation
change (measured with Surface Elevation Tables (SET)) Movements in different soil
strata (surface root zone subroot zone) were evaluated to identify which processes were
contributing to elevation change Because several hurricanes occurred during the study
period we also assessed how these storms affected elevation change rates The main
findings of this study were as follows
2
1 The main drivers of elevation change were accretion on the marsh surface and
subsurface movement below the root zone but the relative influence of these
processes varied temporally Prior to Hurricanes Gustav and Ike (September
2008) the main driver was subsurface movement after the hurricane both
accretion and subsurface movement were important
2 Prior to Hurricanes Gustav and Ike rates of elevation gain and accretion above a
marker horizon were higher in burned plots compared to nonburned plots
whereas nutrient addition had no detectable influence on elevation dynamics
3 Burning decreased standing and fallen plant litter reducing fuel load Hurricanes
Gustav and Ike also removed fallen litter from all plots
4 Aboveground and belowground production rates varied annually but were
unaffected by burning and nutrient treatments
5 Decomposition (of a standard cellulose material) in upper soil layers was
increased in burned plots but was unaffected by nutrient treatments
6 Soil physicochemistry was unaffected by burning or nutrient treatments
7 The elevation deficit (difference between rate of submergence and vertical land
development) prior to hurricanes was less in burned plots (62 millimeters per
year [mm yr-1]) compared to nonburned plots (72 mm yr-1)
8 Storm sediments delivered by Hurricane Ike raised elevations an average of 74
centimeters (cm) which countered an elevation deficit that had accrued over 11
years
Our findings provide preliminary insights into elevation dynamics occurring in
brackish marshes of the Texas Chenier Plain under prescribed fire management The
3
results of this study indicate that prescribed burning conducted at 3- to 5-year intervals is
not likely to negatively impact the long-term sustainability of S patens-dominated
brackish marshes at McFaddin National Wildlife Refuge and may offset existing
elevation deficits by asymp 1 mm yr-1 The primary drivers of elevation change varied in time
and space leading to a more complex situation in terms of predicting how disturbances
may alter elevation trajectories The potential effect of burning on elevation change in
other marshes will depend on several site-specific factors including geomorphic
sedimentary setting tide range local rate of relative sea level rise plant species
composition additional management practices (for example for flood control) and
disturbance types and frequency (for example hurricanes or herbivore grazing)
Increasing the scope of inference would require installation of SETs in replicate marshes
undergoing different prescribed fire intervals and in different geomorphic settings (with
different hurricane frequencies andor different sedimentary settings) Multiple locations
along the Gulf and Atlantic coasts where prescribed fire is used as a management tool
could provide the appropriate setting for these installations
4
Introduction
Global mean sea level has been increasing at a rate of 32 millimeters per year
(mm yr-1) since 1992 (based on satellite altimetry Colorado Center for Astrodynamics
Research 2011) with predicted future rates due to global warming being at 6 mm yr-1 or
more (Parry and others 2007) Coastal marshes must keep pace with rising water levels
or become submerged Local subsidence rates may combine with eustatic rates of sea-
level rise to cause even faster rates of inundation locally Emergent vegetation not only
accelerates mineral sediment deposition and vertical accretion (through baffling of
sediment-laden water by plant shoots) (Morris and others 2002) but also directly
contributes organic matter to soil formation (Nyman and others 1993 Nyman and others
2006 McKee and others 2007 Neubauer 2008 McKee 2011) In fact habitat stability
of many coastal wetlands in relation to sea level rise may be the result of a feedback
relationship between environmental conditions and plant matter accumulation (Nyman
and others 2006 Mudd and others 2009 McKee 2011) In some cases the decaying
plant shoots and other organic detritus accumulate on the marsh surface contributing to
vertical accretion but in many marshes and swamps plant roots and shoot bases
contribute to subsurface soil expansion (McKee and others 2007 Cherry and others
2009 Langley and others 2009 McKee and Cherry 2009 McKee 2011)
Any factor that influences plant production or organic matter decomposition will
alter the net amount of biomass that accumulates in the soil From a few studies
scientists have inferred organic contributions to vertical accretion and soil expansion
based on analysis of sediment cores (Turner and others 2006 Sanders and others 2008)
Direct measurements of changes in accretion and elevation in relation to accumulation of
5
organic matter (and processes that control it) are necessary however to understand and
predict habitat stability (Neubauer 2008 Mudd and others 2009) For example
manipulation of nutrient availability in an oligotrophic mangrove ecosystem altered root
production which in turn caused a change in direction and magnitude of elevation change
(McKee and others 2007) Two additional studies have shown experimentally that
increases in atmospheric CO2 can accelerate elevation gain in some coastal marshes by
stimulating belowground production and upward expansion of the soil surface (Cherry
and others 2009 Langley and others 2009)
On the other hand disturbance processes may cause negative effects on
accumulation of organic matter Biological agents that damage or remove vegetation
include grazers such as geese nutria muskrat and snails (Gauthier and others 1995
Ford and Grace 1998 Silliman and others 2005) Physical processes include sediment or
wrack burial erosion or scouring and fire (Guntenspergen and others 1995 Nyman and
Chabreck 1995) Of particular concern are marsh management practices that may alter
accumulation of soil organic matter and vulnerability to submergence Prescribed burning
is a common management practice used in coastal marshes to reduce hazardous buildup
of fuel enhance wildlife habitat or food sources and promote rare or endangered species
(Nyman and Chabreck 1995) Burning may stimulate marsh productivity through release
of nutrients or may alternatively cause a net loss of organic matter through direct
combustion of peat andor a change in the species composition or plant tissue chemistry
which affects community production or decomposition rates (Hackney and De La Cruz
1977 Schmalzer and others 1991 Nyman and Chabreck 1995 Ford and Grace 1998
Gabrey and Afton 2001 Smith and others 2001 Ponzio and others 2004) Burning not
6
only removes aboveground biomass but may also remove upper layers of peat that may
have accumulated over long periods of time (Nyman and Chabreck 1995) Depending on
burn frequency and intensity however plant biomass production could be stimulated
without substantial loss of accumulated organic material (Nyman and Chabreck 1995)
Scope of Research
The goal of this cooperative research was to address an information need
identified by managers at McFaddin National Wildlife Refuge (NWR) Does the
prescribed fire regime currently in use adversely affect marsh elevations and increase the
risk of wetland loss This study experimentally investigated how fire management and
nutrient addition (with and without fire) affected elevation dynamics in a brackish marsh
dominated by Spartina patens (Ait) Muhl (marshhay cordgrass) a grass found
throughout Gulf of Mexico and Atlantic marshes A prescribed burn was applied once
during the study after one year of preburn measurements We hypothesized that burning
andor nutrient addition would alter the net accumulation of organic matter which would
affect the rate of soil elevation change Because several hurricanes occurred during the
study we also assessed the relative impact of these storms in relation to experimental
treatment effects Thus our research was aimed at addressing the following questions
1 What are the main drivers of elevation change and do they vary over time
2 Does burning or nutrient enrichment have a positive or negative effect on
elevation change
3 To what extent do biotic processes (shoot or root production decomposition)
contribute to elevation change in the experimental marsh and how are they affected by
burning and nutrient enrichment
7
The information gained in this study will be useful in designing and planning
future fire regimes and will provide insight into controls on accretion and elevation
change in brackish marshes Together with other studies of fire effects on marsh elevation
(Cahoon and others 2010) this work will lead to better management strategies for
coastal wetlands nationwide
Study Area
The study was conducted at the McFaddin NWR a 23843 ha area which is part
of the Texas Chenier Plain National Wildlife Refuge Complex Chenier plain marshes are
typically more stable than those in more rapidly subsiding areas such as in deltaic areas
but are still subject to rising sea level The current rate of relative sea level rise at
Galveston Pier 21 TX (tide gauge ID 8771450 1908-2010) is 63 mm yr-1 (NOAA
2011) The McFaddin NWR contains extensive expanses of freshwater brackish and salt
marsh To maintain plant diversity in this system several management techniques are
used including prescribed burns grazing water level management and exotic species
control The site selected for this study was a brackish marsh located along a bayou
within the McFaddin NWR (29ordm 41rsquo4147rdquoN 94ordm 04rsquo0485rdquoW) (fig 1) The dominant
plant species was S patens with minor occurrence of Bolboschoenus robustus (Pursh)
Sojaacutek At this site a thin organic mat (lt 1 m thick) overlies deeper sediments composed
of compacted silt and clay Brackish marshes including the area used in this study are
burned at about 3-year intervals usually at the end of the growing season
8
Figure 1 Map of the study site at McFaddin National Wildlife Refuge (top panel) and views (lower panels) of an experimental plot through four
seasons prior to the prescribed burn
9
Experimental plots were established in April 2005 and measurements were made
seasonally through November 2008 During the study period a total of 18653 ha in the
Refuge were treated by prescribed fire and another 12701 ha were burned by wildfire
(table 1) The marsh encompassing the experimental plots was burned once in 2006 (see
below for details) Also four major hurricanes occurred during the study including
Hurricanes Katrina (August 29 2005) Rita (September 24 2005) Gustav (September 1
2008) and Ike (September 13 2008)
Table 1 Summary of area (in hectares) burned in McFaddin National Wildlife Refuge during the
study period
Year Wild Prescribed
2005 7998 6359
2006 509 1917
2007 2613 10369
2008 1581 8
Total 12701 18653
Combined 31354
10
Experimental Design
The experimental design was completely randomized with a 2 x 2 factorial
treatment arrangement Two rows of eight plots each were established in the interior
marsh asymp 120 m from the bayou The plots were positioned several meters apart to isolate
treatment effects The perimeter of each plot (52 m x 32 m) was defined by a wooden
platform that facilitated access and minimized disturbance (fig 2) An extendible plank
was laid across the platform to provide access to the plot interior The plots were each
divided into a section for nondestructive measurements and another section for
destructive sampling (fig 3)
Within the nondestructive segment of the plots a rod surface elevation table
(hereafter SET) along with deep and shallow benchmarks and marker horizons were
installed (see below for details) (fig 3) Destructive measurements including
aboveground and belowground production decomposition and physicochemistry were
made in the other half of the plot (see below for details) (fig 3)
Plots were randomly assigned to a nutrient treatment (none nutrient addition) and
a fire treatment protocol (burned nonburned) Each nutrient-fire treatment combination
was replicated four times for a total of 16 experimental plots (M1-16) Fertilized plots
received a slow-release fertilizer (Vigoro Tree Shrub and Evergreen Food Spectrum
Brands Madison WI USA containing a 1648 ratio of nitrogen phosphorus and
potassium) which was broadcast onto the marsh surface during low water levels 3 times
per year The fertilizer treatment was initiated in April 2005 and continued until the end
of the study in 2008
11
The prescribed burn occurred on December 3 2006 (fig 4) Fire crews burned the
surrounding marsh and allowed the fire to move across the study area In preparation for
the burn platforms in burn plots were partially disassembled and lumber was stored in
adjacent (nonburned) plots Deep and shallow benchmarks were protected by fire
blankets Half of the plots were prevented from burning by operation of a sprinkler
system installed prior to the fire The sprinkler system protected all but one nonburned
plot where the sprinklers failed this plot was partially burned Temperature loggers were
deployed in all burn plots and at three points in the surrounding marsh and retrieved after
the burn Surface temperatures reached a peak of 274ordm C in the marsh just northwest of
the site the maximum temperature in burn plots ranged from 32 to 185 ordm C (fig 5)
Figure 2 Setup of experimental plots Clockwise from top left (1) construction of platforms (2)
study plot demarcated by access platform (3) driving benchmark rods for installation of surface
elevation tables (SET) (4) SET receiver cemented to deep benchmark rod
Figure 3 Schematic diagram of experimental plot showing positions of various measurements made during the study
13
Figure 4 Views of study area during and after burn treatment (December 2006) Clockwise from top left (1) prescribed burn (2) initial plant
regrowth after burn (3) elevation measurement after burn treatment (4) plant regrowth in spring 2007
Figure 5 Surface temperatures recorded by data loggers during the prescribed burn on
December 3 2006The upper panel shows data for experimental plots M13-16 (black lines)
and M1-4 (gray lines) The lower panel shows data for the surrounding marsh to the northwest
(NW) southwest (SW) and northeast (NE) of the plots
15
Methods
Measuring Elevation Dynamics
Surface elevation change in each plot was determined to the nearest millimeter
with SETs (Cahoon and others 2002) Change in the elevation of the soil surface relative
to the base of a benchmark reflects expansion or contraction over different portions of the
sediment profile (fig 6) The rod SET setup consisted of a benchmark rod driven to the
point of refusal four shallow benchmarks (30 cm deep) and a portable measuring arm
Deep benchmark rods were driven with a slide-hammer to depths of 15 to 16 m Shallow
benchmarks which were constructed of 5-cm diameter x 40-cm long aluminum pipe
capped at the top with an acrylic disc were inserted into the soil to a 30-cm depth
During measurements the portable arm was attached to the deep benchmark in one of
four fixed directions and leveled in both horizontal and vertical planes On each sampling
date seven fiberglass pins were lowered to the soil surface and the extension distances
above the arm were recorded Changes in pin extension distance corresponded to changes
in soil elevation relative to the baseline measurement Two pins were lowered to the top
of the shallow benchmark which allowed movement in the root zone to be isolated from
movement in the sub-root zone by partitioning change in the upper 30 cm from the total
elevation change over the entire soil profile (figs 6-7) Accretion of sediment on the soil
surface was determined by using marker horizons (3 per plot) of white feldspar clay sown
onto the soil surface (fig 7) Marker horizons were asymp 1 cm thick and covered an area of
025 m2 Accumulation of sediment was determined at 4-month intervals by collecting
cryogenic cores through each marker horizon (fig 7) (Cahoon and others 1996)
16
Figure 6 Diagram showing the rod surface elevation table (SET) in relation to deep and shallow
benchmarks and marker horizon which demarcate three strata in the soil profile to allow
vertical delineation of processes controlling elevation change
The marker horizon depth was measured at four positions around the core to the nearest
millimeter and averaged For each SET a total of 28 deep-benchmark 8 shallow-
benchmark and 3 marker-horizon measurements were recorded
The elevations of the marsh surface in each SET plot were determined by using
real-time kinematic (RTK) Global Positioning System measurements with a minimum of
15-second (s) observations at four points within each plot RTK elevations were
expressed with respect to the North American Vertical Datum of 1988 (NAVD88)
17
Figure 7 Methods used to measure elevation change accretion subsidence and root zone
movement Clockwise from top left (1) Adding feldspar clay to soil surface to create a marker
horizon (2) Measuring thickness of accreted sediment above the marker horizon (3)
measuring arm of the surface elevation table being attached to the deep benchmark rod (4)
Fiberglass pins being lowered to the soil surface and to the shallow benchmark (white cap)
Measuring Aboveground and Belowground Plant Responses
Standing plant biomass was harvested at 4-month intervals by clipping all shoots
at the soil surface within a 01-square meter (m2) circular quadrat (fig 8) All fallen litter
was collected within the quadrat and bagged separately Clipped plots were randomly
selected from a gridded area and marked to avoid resampling Standing and fallen
material was later sorted by species and condition (live dead) oven-dried (60ordm C) and
weighed Annual aboveground production was estimated by summing end-of-growing
season standing live and dead biomass (Morris 2007)
Belowground accumulation of roots and rhizomes was determined by using the
in-growth method (McKee and others 2007) Duplicate in-growth bags (5-cm diameter x
30-cm length) containing a root-free standardized organic substrate (milled sphagnum
peat) were installed in all plots at the beginning of the study (fig 8) The bags were
constructed of a flexible large-mesh material (3 square millimeters (mm2) JampM
Industries Ponchatoula LA USA) which allowed in-growth of both fine and coarse
roots A core of soil was removed initially and a prefilled bag was inserted into the hole
the top of the bag was secured with twine to a stake Bags were retrieved after one year
by recoring new bags were installed in the same location Bags with ingrown material
were divided into 10-cm segments placed into ziplock bags and kept cool until
processing All ingrown material was washed over a 1-mm sieve separated into size
classes (fine roots [lt2 mm] coarse roots [gt2 mm rhizomes]) and condition [live or dead
based on appearance and flotation] dried at 60 ordmC and weighed Rates of belowground
production (to a 30-cm depth) were calculated by dividing the mass per unit area by the
time interval to give an annual value (grams per square meter per year [g m-2 yr-1])
19
Figure 8 Methods used to measure response to treatmentsClockwise from top left (1) clipping
of aboveground biomass and litter collection (2) collection of porewater for measurement of
salinity pH sulfide and nutrients (3) installation of in-growth bags to measure rates of
belowground accumulation of root matter (4) installation of a standardized cellulose material to
measure decomposition rates
Measuring Decomposition
Decomposition rates in each experimental plot were measured by using the
ldquocotton-strip techniquerdquo (Slocum and others 2009) Canvas material (100 percent undyed
20
cotton style number 568 Tara Materials Inc Lawrenceville Ga
wwwtaramaterialscom) was cut into strips (10 cm x 30 cm) and inserted vertically into
the soil with a spade so that about 4 cm extended above the soil surface (fig 8) The exact
position of the soil surface was marked by clipping a notch in the strip Samples remained
in the ground for 10 days and then were retrieved at the time of sample retrieval
reference strips were inserted and immediately removed At the laboratory all strips were
washed with deionized water air-dried and stored away from sunlight Sampling depths
were marked with a pencil on each strip and then sub-strips were cut by using a rotary
blade Tensile strength of each sub-strip was measured with a tensometer (Slocum and
others 2009) Rates of loss of cotton tensile strength were calculated as CTSL () = [1-
(NC)D] x 100 where N is the strength of the experimental sub-strip in Newtons C is
the mean tensile strength of the reference sub-strips and D is the number of days in the
ground
Assessing Physicochemical Conditions
Duplicate samples of pore water were collected at a 25-cm depth in the
undisturbed section of the plot and analyzed for salinity pH sulfide and nutrients as
described previously (McKee and others 1988 McKee and McGinnis 2002) (fig 8)
Soil samples were collected with a piston corer for measurement of bulk density (dry
mass per volume) and percent organic matter (loss on ignition) according to standard
methods (Parent and Caron 1993) Soil redox potentials at 1- 15- and 30-cm depths
were measured with bright platinum electrodes equilibrated in situ for 30 min (McKee
and others 1988) Each electrode was checked before use with quinhydrone in pH 4 and
7 buffers (millivolt [mV] reading for quinhydrone is 218 and 408 respectively at 25 C)
21
The potential of the calomel reference electrode (+244 mV) was added to each reading to
calculate redox potential (Eh)
Performing Statistical Analyses
The elevation data (total change and vertical movement of each depth interval)
were divided into the period prior to and after Hurricanes Gustav and Ike (September
2008) and analyzed separately The total vertical departure (cumulative) from the
baseline for each fiberglass pin (36 per SET) was calculated for each sampling date The
cumulative changes for the 28 pins lowered to the soil surface were averaged to provide
an overall rate of mean elevation change (relative to the base of the deep benchmark) per
SET per date Similarly the cumulative changes for the 8 pins lowered to the shallow
benchmarks (4 directions per SET) were averaged and represented the movement
between the base of the shallow benchmarks to the depth of the deep benchmark The
depths of sediment accreted above the three marker horizons per SET were also averaged
to provide a single mean value for each SET per sampling date Movement within the
root zone was calculated by subtracting the shallow benchmark movement and accretion
from total elevation change Total subsurface change (subsidence or expansion) was
calculated by subtracting accretion (above the marker horizon) from total elevation
change (soil surface movement relative to the base of the deep benchmark) Thus each
SET plot provided five linear trajectories representing total elevation change shallow
subsidence and movement in three strata including surface accretion root zone and
subroot zone The slopes of these linear relationships were determined to provide a rate
of change for each SET which was considered to be the experimental unit
22
Rates of change for elevation variables were analyzed by analysis of covariance
(ANCOVA) using the NAVD88 elevation of the SET plots as a covariate and burn and
fertilizer treatments as categorical grouping factors Other variables (biomass and
production) were analyzed by using a repeated-measures analysis of variance (ANOVA)
with burn and nutrient treatments as grouping factors and time as the repeated measure
Decomposition data were assessed with repeated measures ANOVA by using burn and
nutrient treatments as the grouping factors and depth as the repeated measure If
necessary data were log-transformed to meet assumptions of ANOVA Statistical
analyses were performed with JMPreg Version 900 (SAS Institute Inc Cary NC)
Results and Discussion
Several considerations must be kept in mind when interpreting the results of this
study First the study was conducted in one location within the McFaddin NWR and in
one marsh habitat Thus the results may not be applicable to other locations or marsh
types within the refuge or in other geographic locations especially where conditions (for
example subsidence) are considerably different Nevertheless the natural mechanisms
involved in controlling elevation dynamics in the experimental plots and the effects of
burning and nutrient treatments on these mechanisms are generally relevant to other
coastal marshes Second the responses to treatments do not necessarily indicate long-
term responses to burning or nutrient treatments and therefore cannot be extrapolated
beyond the time interval of the study Third these results reflect the effect of a single
prescribed burn (simulating a 3- to 5-year burn interval) more frequent (annual) burning
may produce different results Fourth several hurricanes occurred during the study and
23
apparently influenced some of the response variables including biomass accumulation
soil chemistry and elevation dynamics
With these caveats in mind we describe the key results and their implications in
the following sections
1 Result The main drivers of elevation change in the brackish marsh studied at
McFaddin NWR were accretion on the marsh surface and subsurface movement
below the root zone but the relative influence of these processes varied
temporally (with hurricane occurrence)
Movements in different soil strata contribute to elevation change of the marsh
surface (Cherry and others 2009 McKee and Cherry 2009 McKee 2011) Several
biological and physical processes control these movements by promoting vertical
expansion or contraction of these soil strata Mineral andor organic detritus is deposited
on the soil surface and can undergo subsequent compaction or erosion or microbial
decomposition (organic) Root-zone movement is driven by belowground production of
roots rhizomes and shoot bases decomposition of organic matter and physical
compaction Below the root zone subsidence and shrink-swell of the substrate (due to
changing water content) predominate The relative contribution of these processes in each
soil strata varies among marshes and over time This study quantified the rate and
direction of movement in each of these soil strata which allowed identification of the
main processes controlling elevation change in the study site at McFaddin NWR
24
Elevation and accretion in burned and nonburned plots varied over time relative to
the initial baseline (fig 9) Prior to Hurricanes Gustav and Ike the rate of elevation
change varied across all experimental plots from -91 to 79 mm yr-1 with an overall
average of -04 mm yr-1 Elevation change was positively correlated with plot elevation
which varied from 0235 to 0301 m (NAVD88) (r = 071 P = 00021) This correlation
likely reflects a feedback relationship between elevation and flooding-related factors
influencing sedimentation and production-decomposition processes (Neubauer 2008
Mudd and others 2009 McKee 2011) Accretion above marker horizons varied from 04
to 7 mm yr-1 with an overall average of 32 mm yr-1 Accretion exceeded elevation
change throughout the 35 year observation period indicating that subsidence was
contributing to vertical movement of all plots regardless of treatment The rate of average
shallow subsidence across the study site was -36 mm yr-1 The rate of shallow subsidence
plus relative sea level rise (SLR) (63 mm yr-1) yields a total submergence rate of 99 mm
yr-1 Vertical change in the root zone varied from -06 to 09 mm yr-1 (average = 02 mm
yr-1) indicating a slight but overall expansion Total elevation gain (accretion plus root
zone) was 34 mm yr-1 Thus there was an overall elevation deficit (submergence minus
elevation gain) of 65 mm yr-1 at this site prior to the 2008 hurricanes
25
Figure 9 Time-course of elevation change (σ) and accretion above marker horizon (θ) in
nonburned and burned plots (mean plusmn standard error n = 8 averaged over nutrient treatment)
Note different scales for Y-axis before (left) and after (right) Hurricanes Gustav and Ike
26
To determine which processes were driving vertical movement of the marsh
surface elevation change rates across plots were assessed in relation to movement in the
three main strata (surface root zone subroot zone) (fig 10) Prior to Hurricanes Gustav
and Ike the primary driver of change was sub-root zone movement (r = 092 P lt00001)
Movement below the root zone thus explained 85 percent of the variation in elevation
change before this hurricane whereas accretion and root zone expansion together
explained only 15 percent The storm surge associated with Hurricane Ike (East and
others 2008) delivered substantial sediment to experimental plots which strongly
influenced elevations (fig 9) After this hurricane accretion explained 53 percent and
subroot zone movement explained 46 percent of the variation in elevation change (fig
10) In Louisiana brackish marshes impacted by Hurricane Katrina storm sediments also
increased elevations by several centimeters but post-hurricane elevation movement in
upper soil layers was determined by the texture (for example particle size and organic
matter content) of the deposited sediment (McKee and Cherry 2009)
Authors of a companion fire study conducted at Blackwater NWR (on the eastern
shore of Maryland) found that marsh-elevation change averaging 4 mm yr-1 across
treatment plots was driven by three main factors including accretion root-zone
subsidence and shrink-swell of sediments below the root zone (Cahoon et al 2010) At
Blackwater NWR surface accretion was higher (59 ndash 97 mm yr-1) and caused by litter
accumulation rather than mineral sedimentation but there was root-zone collapse (lt-1 to
-6 mm yr-1) Overall shallow subsidence varied from -17 to 59 mm yr-1
27
Figure 10 Variation in elevation-change rate (Y-axis) in relation to vertical movement (X-axis) in
three strata including accretion (top panels) root zone (middle panels) and subroot zone
(bottom panels) Rates of change measured before and after Hurricane Ike (September 9
2008) are plotted in left or right panels respectively Treatment plots are indicated by closed
(burned) or open (nonburned) symbols Inset values are correlation coefficients
28
These results illustrate how relative movement in different soil strata (and associated
processes) can vary substantially within and among marshes over time Consequently it
is important to avoid viewing such controlling factors as static either in time or space
2 Result Burn treatment increased rates of elevation gain and accretion compared
to those in nonburned plots whereas nutrient treatment had no detectable
influence on elevation dynamics
Because of the overriding effect of storm sediment on elevation dynamics effects
of fire and nutrient treatments were assessed by using data collected prior to the 2008
hurricanes (earlier hurricanes had no detectable effect) Before the 2008 hurricanes
nutrient addition did not significantly affect elevation-change rates but burning had a
significant effect on both accretion and elevation change The burned plots gained
elevation (+014 mm yr-1) whereas nonburned plots lost elevation (-087 mm yr-1) (main
effect of fire F = 534 P = 00496) (fig 9) Thus burning not only affected the
magnitude of elevation change but also the direction and the difference caused by
burning was approximately 1 mm yr-1 Accretion above feldspar marker horizons also
was higher in burned (45 mm yr-1) compared to nonburned (19 mm yr-1) plots Sub-
surface change indicated that some plots were subsiding whereas others were undergoing
expansion but there was no effect of burning or nutrient treatments on root zone or
subroot zone movement These findings indicate that the effect of burning on soil
expansion occurred in the surface layers (above the marker horizon) This effect may
result from deposition of residual ash from the burned plant material that was deposited
29
on the soil surface The lack of a nutrient effect on elevation further suggests that burning
mainly acted by causing a physical contribution to vertical accretion rather than through
stimulation of plant growth such as roots on the marsh surface
Similarly a previous study conducted at McFaddin NWR found that marsh
burning slowed the rate of elevation loss compared to a nonburned marsh after hurricane-
induced flooding killed S patens (the dominant vegetation) causing root zone collapse
(Cahoon and others 2004) The positive effect of burning appeared to be related to
increased root growth resulting in an increase in organic matter volume but effects on
decomposition could not be ruled out Results of the study at Blackwater NWR indicated
no effect of burning on elevation change (Cahoon et al 2010) Although not significantly
different there was a trend for faster accretion with decreasing burn frequency Rates of
accretion in marshes with different fire (frequency) regimes were 59 mm yr-1 (annual)
69 mm yr-1 (3ndash5 year) 84 mm yr-1 (7ndash10-year) and 97 mm yr-1 (control) Shallow
subsidence tended to be slower in annually burned marshes (17 mm yr-1) compared to
control marshes (59 mm yr-1) or plots undergoing burn frequencies of 3ndash5 year (34 mm
yr-1) and 7ndash10 year (33 mm yr-1) Lower litter and accretion on the marsh surface may
have offset root-zone subsidence leading to similar rates of elevation change in annually
burned marshes (40 mm yr-1) in marshes burned at other frequencies (39 mm yr-1 [3ndash5
year] 50 mm yr-1 [7ndash10 year]) and in control marshes (38 mm yr-1)
3 Result Burning decreased standing and fallen plant litter reducing fuel load
Hurricanes Gustav and Ike also removed fallen litter from all plots
30
Aboveground biomass (live and dead standing and fallen litter) varied over time
and in response to burn and nutrient treatments and to hurricane impact (fig 11)
Aboveground live biomass was increased by nutrient addition before the prescribed burn
(479 vs 715 grams per square meter [g m-2] in control and fertilized plots) but it did not
differ among treatment and control plots after the burn and averaged 516 g m-2 (time by
nutrient interaction F = 68 P = 0012) Prior to the prescribed burn standing dead
biomass averaged 703 g m-2 in subsequently burned and 841 g m-2 in nonburned plots
litter averaged 181 g m-2 in subsequently burned and 164 g m-2 in nonburned plots After
the burn dead biomass was significantly lower in burned (326 g m-2 standing dead 112
g m-2 litter) compared to nonburned (736 g m-2 standing dead 365 g m-2 litter) plots
After Hurricanes Gustav and Ike litter in all plots was decreased to approximately 51 g
m-2 and did not differ among burn and nutrient treatments At Blackwater NWR annual
burning led to lower standing dead biomass (38 g m-2 yr-1) compared to less frequently
burned marshes (175ndash216 g m-2 yr-1 (Cahoon et al 2010)
Live and dead stem densities also varied over time and in response to burning
(fig 12) Prior to the burn live stem density was similar in subsequently burned (1021
stems m-2) and nonburned (964 stems m-2) plots after the burn density was two times
higher in burned (2309 stems m-2) than in nonburned (1054 stems m-2) plots (fire by time
interaction F = 538 P = 00235) Live density decreased to zero after Hurricanes Gustav
and Ike Dead stem density varied over time but differences between burned and
nonburned plots were not significant
31
Figure 11 Standing live and dead biomass and fallen litter in burned and unburned plots
(averaged over nutrient treatments mean value plusmn standard error n = 8) The prescribed burn
occurred on December 3 2006
32
Figure 12 Variation in live and dead stem density in burned and nonburned plots (averaged over
nutrient treatment mean value plusmn standard error n = 8) The prescribed burn occurred on
December 3 2006
33
These findings support one goal of prescribed burning which is to reduce fuel
loads but the findings also show that standing stocks of dead material rapidly return to
pre-burn levels (within 1ndash2 years) Consequently more frequent burning may be
necessary to maintain low amounts of litter Storm surge from hurricanes may also reduce
fuel loads by physically flushing out litter
4 Result Burning had no effect on aboveground or belowground production
Burning may stimulate plant growth by rapidly mineralizing organic matter and
adding nutrients or by removing standing and fallen dead litter and increasing light
penetration to support new shoot growth Although aboveground and belowground
production rates varied annually they were unaffected by the experimental treatments
and averaged 1256 and 155 g m-2 yr-1 respectively across all plots and years (fig 13)
Belowground production varied significantly with depth most root matter accumulated in
the upper 10 cm (121 g m-2 yr-1) compared to the deeper layers (16 ndash 19 g m-2 yr-1)
At Blackwater NWR annual burning increased both aboveground and
belowground production (Cahoon et al 2010) The lack of response at McFaddin NWR
may be due to the lesser frequency of burn treatment compared to that at Blackwater
NWR Another difference between the two studies is that the plant community at
Blackwater NWR contained Schoenoplectus americanus in addition to S patens whereas
the marsh at McFaddin NWR was dominated by a near-monoculture of S patens The
two species differ in their responses to disturbance and growth of S patens may not be as
responsive to burning as S americanus Another possibility is that annual burning
34
removed more dead standing and fallen litter at Blackwater NWR which promoted
greater production of new shoots in spring
Figure 13 Aboveground and belowground production of biomass (averaged over burn and
nutrient treatments mean value plusmn standard error n =8) The prescribed burn occurred on
December 3 2006
35
5 Result Decomposition in upper soil layers was increased by burning
Accumulation of organic matter requires slower rates of decomposition than
production Burning may accelerate decomposition of soil organic matter by stimulating
the activity of the soil microbial community via changes in nutrients or other
environmental conditions Burial of a standard cellulose material in the experimental
plots allowed assessment of the decomposition potentialmdashessentially the activity of the
microbial community--at different soil depths within the root zone where most of the
belowground production occurred
Decomposition of the standard cellulose material (summer 2007) varied by soil
depth (main effect P lt 0001) and was faster in upper soil layers in burned plots
(interaction of depth by fire P = 005) (fig 14) There was no effect of nutrient addition
on tensile strength loss suggesting that the effect of burning on decomposition was not
related to changes in availability of nitrogen phosphorus and potassium Although
decomposition appeared to be stimulated in burned plots the greater accretion above the
marker horizon counterbalanced any losses in organic matter so that the net effect was a
greater gain in elevation If there had been lower surface accretion at this site or higher
subsidence rates however the increased rate of decomposition could have had a greater
influence on elevation
36
Figure 14 Depth variation in decomposition of standard cellulose material in burned and
nonburned plots (summer of 2007) (averaged over nutrient treatment mean value plusmn standard
error n = 8)
37
6 Result Soil physicochemistry was unaffected by burning or nutrient addition
Soil bulk density across all plots averaged 01 plusmn 001 grams per cubic centimeter
(g cm-3) and percent organic matter averaged 56 plusmn 2 There were no differences in these
variables attributable to burning nutrient addition or season Also there were no
substantial effects of either burning or nutrient treatments on soil or porewater chemistry
although these parameters varied significantly over time (fig 15) Soil redox potential
and sulfide concentration indicate flooding-related conditions and typically vary
seasonally with soil flushing and plant growth The levels measured during this study
suggested low to moderate flooding stress at the study site which increased over the
period of observation Salinity increased after Hurricane Ike but values remained within
the tolerance range of S patens Salinity was significantly higher in burned (11 parts per
thousand [ppt]) versus nonburned (10 ppt) plots but this difference was slight and not
biologically significant Porewater concentrations of nutrients (ammonium [NH4] and
phosphate [PO4]) fluctuated seasonally and annually but did not show a significant
response to treatments Plant uptake andor chemical transformations likely explain why
porewater concentrations of these nutrients were not elevated in nutrient-amended plots
38
Figure 15 Soil redox potential (Eh) at soil depth (in centimeters) and porewater salinity pH
sulfide ammonium (NH4) and phosphate (PO4) measured seasonally in experimental plots
(averaged over treatments mean value plusmn standard error n = 16)
39
7 Result The elevation deficit was lower in burned plots (62 mm yr-1) compared to
nonburned plots (72 mm yr-1)
The vulnerability of marshes to sea-level rise is determined by the rate of vertical
marsh building relative to the rate of submergence that is relative SLR (table 2) The
relative SLR for the region is based on measurements from local tide gages In this case
mean sea level rise was estimated at 63 mm yr-1 (NOAA 2011) This value reflects
changes in water level as well as land movement below the base of the tide gage To
determine the true relative SLR however the rate of shallow subsidence (between the
base of the tide gage and the land surface) must be added to the rate of relative SLR
based on the tide gage This value is provided by the SET measurements
The subroot-zone movements were -46 mm yr-1 (burned plots) and -31 mm yr-1
(nonburned plots) giving a total submergence rate of 109 mm yr-1 and 94 mm yr-1
respectively To maintain soil elevations relative to submergence land building must
occur at equivalent rates The rate of land building is the combination of root zone
expansion plus accretion on the soil surface The combined rates of gain prior to
Hurricanes Gustav and Ike were 47 mm yr-1 (burned plots) and 22 mm yr-1 (nonburned
plots) Thus the elevation deficit was lower in the burned plots (62 mm yr-1) compared
to nonburned plots (72 mm yr-1) prior to these hurricanes (main effect of fire F = 541 P
= 00484) Because storm sediments subsequently altered elevation dynamics at this site
it was not possible to determine how much longer this difference in elevation deficit
would have been maintained
40
Table 2 Summary of relative sea-level rise (SLR) and elevation dynamics in burned and
nonburned plots at McFaddin National Wildlife Refuge prior to Hurricanes Gustav and Ike
(September 2008) Values (in millimeters per year) are the mean value plusmn standard error
Burned Nonburned
Relative SLR1 63 63 Sub-root zone subsidence 46 plusmn 22 31 plusmn 13 Total Submergence 109 plusmn 22 94 plusmn 13 Root zone expansion 02 plusmn 02 03 plusmn 01 Surface accretion 45 plusmn 05 19 plusmn 06 Total Land Building 47 plusmn 05 22 plusmn 06 Elevation Deficit2 62 plusmn 20 72 plusmn 10 1Relative SLR equals the change in mean sea level plus deep land movement (from tide
gauge records) (NOAA 2011)
2 Elevation deficit equals total submergence minus total land building
8 Result Storm sediments delivered by Hurricanes Gustav and Ike raised elevations
an average of 74 cm which countered an elevation deficit accrued over the
course of 11 years
The study site exhibited an overall elevation deficit of 67 mm yr-1 from April
2005 to April 2008 In September 2008 3 to 9 cm of sediment were deposited in plots
which raised elevations an average of 74 plusmn 09 cm (fig 9) The bulk of this sediment was
likely delivered by Hurricane Ike based on storm surge heights for the area (East and
others 2008) This single event countered an elevation deficit accrued over the course of
41
11 years (estimated by dividing storm-induced elevation gain by an annual average
deficit of 67 mm yr-1) This finding was in contrast to Hurricane Rita which did not
deliver measurable sediment to study plots (fig 9) A similar effect on elevation due to
sediment input by Hurricane Katrina was found in subsiding brackish marshes in
Louisiana (McKee and Cherry 2009) Between 3 and 8 cm of sediment were added to the
soil surface at Big Branch Marsh NWR and Pearl River Wildlife Management Area
(WMA) during the storm surge At those sites where the submergence rate (mean
relative SLR + subsidence) was 21 mm yr-1 the hurricane sediment was important in
countering elevation loss Although the elevations measured after Hurricane Katrina
continued to decline (because of continuing subsidence root-zone collapse andor
compaction of deposited sediment) net elevation gain was still positive two years later
In addition belowground accumulation of root matter was stimulated 10-fold at Big
Branch Marsh NWR which further contributed to upward expansion of the soil surface
In contrast to the above effects marsh flooding caused by Tropical Storm Charley
(August 1998) and Tropical Storm Frances (September 1998) led to plant dieback and
soil collapse at McFaddin NWR (Cahoon and others 2004) In that instance floodwaters
from the storm surge covered the marsh surface to a maximum depth of 15 m and
marshes remained flooded for about two months Since the study by Cahoon et al (2004)
was initiated after floodwaters had receded it is unknown how much sediment may have
been deposited The rate of accretion measured during the year following the storms
however was 4 to 5 mm yr-1 which was insufficient to counterbalance the rate of
collapse (37 to 68 mm yr-1)
42
The results of studies in Texas and Louisiana illustrate the potentially positive
effects of storm sediment on elevation dynamics in coastal marshes Although some
coastal marshes may suffer collapse erosion or other negative impacts from hurricane
disturbance subsiding areas that receive sufficient sediment to alter elevation trajectories
may benefit in the long-run However not all hurricanes will deliver sediment sufficient
to alter accretion and elevation trajectories as suggested by the differences between
Hurricanes Ike and Rita Additional monitoring of elevations at McFaddin NWR will be
required to assess if sediments deposited by 2008 hurricanes might influence future
elevation gain via stimulation of belowground production
Conclusions
General Implications for Resource Management
1 Prescribed burning conducted at 3- to 5-year intervals does not seem to pose
an additional risk to long-term sustainability of S patens-dominated brackish
marshes at McFaddin NWR
The results of this cooperative study indicate that the current prescribed fire
regime (3ndash5 year frequency) at McFaddin NWR seems to pose no additional threat to
marsh sustainability and may offset existing elevation deficits by approximately 1 mm yr-
1 Although this specific offset cannot be extrapolated beyond the study period or to other
coastal refuges the findings at McFaddin NWR and Blackwater NWR together suggest
that prescribed fire may provide benefits to future sustainability of some brackish
marshes The potential effect of burning on elevation change will depend on several site-
specific factors including geomorphicsedimentary setting tide range local rate of
43
relative SLR plant species composition additional management practices (eg for flood
control) and disturbance types and frequency (for example hurricanes and herbivore
grazing) Sites undergoing high rates of subsidence andor intense herbivory for
example might be negatively affected by burning Further studies conducted in different
marsh types and hydroedaphic settings and at different burn intervals will be required for
further understanding
2 The primary drivers of elevation change vary in time and space leading to a
more complex situation in terms of predicting how disturbances may alter
elevation trajectories
A growing body of information suggests that various processes both physical and
biological contribute to vertical movement in different soil layers In this study we
partitioned movement in three main zones including the soil surface (above a marker
horizon) root zone and subroot zone Besides this study two other studies have
examined effects of movement in discrete strata on total elevation change in brackish
marshes (McKee and Cherry 2009 Cahoon and others 2010) Movement in each of
these strata is controlled by a different suite of processes and consequently may be
influenced by different physical and biological drivers (fig 16) Mineral sedimentation
on the soil surface is influenced by tides and currents by proximity to rivers creeks and
open ocean by the composition of the sediment (particle-size distribution) by barriers to
water movement and by plant type and stem density (which baffles water movement)
Expansion or contraction of the root zone is influenced by the growth cycle of the rooted
vegetation by factors influencing plant growth (nutrients climate) and by factors
influencing decomposition of organic matter Subroot-zone movement is due to physical
44
processes such as compaction (reduction in pore space) and by shrink-swell movement
caused by surface and groundwater influx and steric changes in adjacent bays and oceans
Because these biophysical drivers may vary seasonally andor annually and in response to
stochastic events such as hurricanes their relative influence also varies temporally Also
the influence of seasonal or annual processes may obscure finer movements responsible
for directional trends making quantification of effects of burning and other management
practices difficult to determine without long-term records (gt5 years)
Research Implications
Long-term monitoring of elevation changes will provide additional insights into
how processes controlling marsh elevations may change over time and how long
elevation trajectories in burned plots will persist The study sites at McFaddin NWR in
Texas and Blackwater NWR in Maryland are the only two known locations where effects
of prescribed fire on marsh-elevation dynamics have been evaluated These two locations
are very similar in that they are characterized by microtidal to nontidal astronomical
ranges are in subsiding geomorphic settings and have low sediment supplies (during
nonhurricane years) The McFaddin NWR site also provides a unique opportunity to
follow long-term impacts of hurricane sedimentation on elevation dynamics Together
with sites such as those at the Big Branch Marsh NWR and the Pearl River WMA the
SET-instrumented plots represent a valuable resource that can continue to produce
information in the future about hurricane effects on coastal marshes To increase the
scope of inference SETs could be installed in replicate marshes undergoing different
prescribed fire intervals and in different geomorphic settings (with different hurricane
frequencies andor different sedimentary settings) Multiple locations along the Gulf and
45
Atlantic coasts in which prescribed fire is used as a management tool would provide the
ideal setting for such installations
Figure 16 Conceptual model illustrating internal processes and external drivers influencing vertical movement in three soil strata in a brackish
marsh dominated by Spartina patens including accretion above a marker horizon root zone and subroot zone Observed effects of burning
nutrient addition and hurricanes are indicated as follows + (positive) - (negative) and 0 (none)
References Cited
Cahoon DR Ford MA and Hensel PF 2004 Ecogeomorphology of Spartina
patens-dominated tidal marshes soil organic matter accumulation marsh
elevation dynamics and disturbance in Fagherazzi Sergio Marani Marco
Blum LK eds The Ecogeomorphology of Tidal Marshes Washington DC
American Geophysical Union p 247-266
Cahoon DR Guntenspergen GR Baird Suzanne Nagel Jessica Hensel P F
Lynch JC Bishara Dana Brennand Patrick Jones Joshua and Otto Clint
2010 Do annual prescribed fires enhance or slow the loss of coastal marsh habitat
at Blackwater National Wildlife Refuge Final Project Report (JFSP Number 06-
2-1-35) Final Project Report (JFSP Number 06-2-1-35) Beltsville MD p 19
[httpwwwfiresciencegovJFSP_Search_Results_Detailcfmjdbid=2426
275V020200A]
Cahoon DR Lynch JC and Knaus RM 1996 Improved cryogenic coring device
for sampling wetland soils Journal of Sedimentary Research v 66 p 1025-1027
Cahoon DR Lynch JC Perez BC Segura Bradley Holland RD Stelly Carroll
Stephenson Gary and Hensel PF 2002 High-precision measurements of
wetland sediment elevation II the rod surface elevation table Journal of
Sedimentary Research v 72 p 734-739
Cherry JA McKee KL and Grace JB 2009 Elevated CO2 enhances biological
contributions to elevation change in coastal wetlands by offsetting stressors
associated with sea-level rise Journal of Ecology v 97 p 67-77
48
East JW Turco MJ and Mason Jr RR 2008 Monitoring inland storm surge and
flooding from Hurricane Ike in Texas and Louisiana September 2008 US
Geological Survey Open-File Report 2008-1365 US Geological Survey
[httppubsusgsgovof20081365]
Ford MA and Grace JB 1998 The interactive effects of fire and herbivory on a
coastal marsh in Louisiana Wetlands v 18 p 1-8
Gabrey SW and Afton AD 2001 Plant community composition and biomass in Gulf
Coast chenier plain marshes responses to winter burning and structural marsh
management Environmental Management v 27 p 281-293
Gauthier Gilles Hughes RJ Reed Austin Beaulieu Julien and Rochefort Line 1995
Effect of grazing by greater snow geese on the production of graminoids at an
arctic site (Bylot Island NWT Canada ) Journal of Ecology v 83 p 653-664
Guntenspergen GR Cahoon DR Grace JB Steyer GD Fournet Stephen
Townson MA and Foote AL 1995 Disturbance and recovery of the
Louisiana coastal marsh landscape from the impacts of Hurricane Andrew
Journal of Coastal Research v SI 21 p 324-339
Hackney CT and De La Cruz AA 1977 The ecology of a Mississippi tidal marsh
The effects of fire on the vegetation of a tidal marsh in St Louis Bay Mississippi
Mississippi Marine Resources Council p 23
Langley JA McKee KL Cahoon DR Cherry JA and Megonigal JP 2009
Elevated CO2 stimulates marsh elevation gain counterbalancing sea-level rise
Proceedings of the National Academy of Sciences v 106 p 6182-6186
49
McKee KL 2011 Biophysical controls on accretion and elevation change in Caribbean
mangrove ecosystems Estuarine Coastal and Shelf Science v 91 p 475-483
McKee KL Cahoon DR and Feller IC 2007 Caribbean mangroves adjust to rising
sea level through biotic controls on change in soil elevation Global Ecology and
Biogeography v 16 p 545-556
McKee KL and Cherry JA 2009 Hurricane Katrina sediment slowed elevation loss
in subsiding brackish marshes of the Mississippi River Delta Wetlands v 29 p
2-15
McKee KL and McGinnis TE 2002 Hurricane Mitch Effects on mangrove soil
characteristics and root contributions to soil stabilization US Geological Survey
Open-File Report OFR-02-178 64 p
McKee KL Mendelssohn IA and Hester MW 1988 Reexamination of pore water
sulfide concentrations and redox potentials near the aerial roots of Rhizophora
mangle and Avicennia germinans American Journal of Botany v 75 p 1352-
1359
Morris JT 2007 Estimating net primary production of salt marsh macrophytes in
Fahey TJ Knapp AK eds Principles and standards for measuring primary
production New York Oxford University Press p 106-119
Morris JT Sundareshwar PV Nietch CT Kjerfve Bjorn and Cahoon DR 2002
Response of coastal wetlands to rising sea level Ecology v 83 p 2869-2877
Mudd SM Howell SM and Morris JT 2009 Impact of dynamic feedbacks
between sedimentation sea-level rise and biomass production on near-surface
50
marsh stratigraphy and carbon accumulation Estuarine Coastal and Shelf
Science v 82 p 377-389
Neubauer SC 2008 Contributions of mineral and organic components to tidal
freshwater marsh accretion Estuarine Coastal and Shelf Science v 78 p 78-88
NOAA nd Tides amp Currents [httpwwwtidesandcurrentsnoaagov] National Oceanic
and Atmospheric Administrations National Ocean Service accessed August 10
2010 at httpwwwtidesandcurrentsnoaagov
Nyman JA and Chabreck RH 1995 Fire in coastal marshes history and recent
concerns in Cerulean SI Engstrom RT eds Fire in wetlands a management
perspective Proceedings of the tall timbers fire ecology conference No 19
Tallahassee Fl Tall Timbers Research Station p 134-141
Nyman JA DeLaune RD Roberts HH and Patrick Jr WH 1993 Relationship
between vegetation and soil formation in a rapidly submerging coastal marsh
Marine Ecology Progress Series v 96 p 269-279
Nyman JA Walters RJ DeLaune RD and Patrick Jr WH 2006 Marsh vertical
accretion via vegetative growth Estuarine Coastal and Shelf Science v 69 p
370-380
Parent LE and Caron Jean 1993 Physical properties of organic soils in Carter MR
ed Soil Sampling and Methods of Analysis Boca Raton Lewis Publishers p
441-458
Parry ML Canziani OF and Palutikof JP 2007 Technical Summary in Parry
ML Canziani OF Palutikof JP van der Linden PJ Hanson CE eds
Climate Change 2007 Impacts Adaptation and Vulnerability Contribution of
51
Working Group II to the Fourth Assessment Report of the Intergovernmental
Panel on Climate Change Cambridge UK Cambridge University Press p 23-78
Ponzio KJ Miller SJ and Lee MA 2004 Long-term effects of prescribed fire on
Cladium jamaicense Crantz and Typha domingensis Pers densities Wetlands
Ecology and Management v 12 p 123-133
Sanders CJ Smoak JM Naidu AS and Patchineelamt SR 2008 Recent sediment
accumulation in a mangrove forest and its relevance to local sea-level rise (Ilha
Grande Brazil) Journal of Coastal Research v 24 p 533-536
Schmalzer PA Hinkle CR and Mailander JL 1991 Changes in community
composition and biomass in Juncus roemerianus Scheele and Spartina bakeri
Merr marshes one year after a fire Wetlands v 11 p 67-86
Silliman BR van de Koppel Johan Bertness MD Stanton LE and Mendelssohn
IA 2005 Drought snails and large-scale die-off of southern US salt marshes
Science v 310 p 1803-1806
Slocum MG Roberts Joshua and Mendelssohn IA 2009 Artist canvas as a new
standard for the cotton-strip assay Journal of Plant Nutrition and Soil Science v
172 p 71-74
Smith SM Newman Sue Garrett PB and Leeds JA 2001 Differential effects of
surface and peat fire on soil constituents in a degraded wetland of the Northern
Florida Everglades Journal of Environmental Quality v 30 p 1998-2005
Turner RE Milan CS and Swenson EM 2006 Recent volumetric changes in salt
marsh soils Estuarine Coastal and Shelf Science v 69 p 352-359

i
US Department of the Interior KEN SALAZAR Secretary
US Geological Survey Marcia K McNutt Director
US Geological Survey Reston Virginia 2012
For product and ordering information World Wide Web httpwwwusgsgovpubprod Telephone 1-888-ASK-USGS
For more information on the USGSmdashthe Federal source for science about the Earth its natural and living resources natural hazards and the environment World Wide Web httpwwwusgsgov Telephone 1-888-ASK-USGS
Suggested citation McKee KL and Grace JB 2012 Effects of prescribed burning on marsh-elevation change and the risk of wetland loss US Geological Survey Open-File Report 2012-1031 51 p
Any use of trade product or firm names is for descriptive purposes only and does not imply endorsement by the US Government
Although this report is in the public domain permission must be secured from the individual copyright owners to reproduce any copyrighted material contained within this report
Cover The McFaddin National Wildlife Refuge marsh during a prescribed burn photograph by Tommy McGinnis
ii
Acknowledgments
This project was funded in part by the US Geological Survey-Fish and Wildlife Service
(USGS-FWS) Science Support Partnership (Project Number 05-R2-02) We acknowledge
associate USGS investigators Don Cahoon and Glenn Guntenspergen (Patuxent Wildlife
Research Center) and FWS partners Andy Loranger and Patrick Walther (Texas Chenier
Plain National Wildlife Refuge Complex) We greatly appreciate the cooperation and
support provided by the personnel at the McFaddin National Wildlife Refuge including
Craig Crenshaw Doug Head and Mike Nance Several people assisted in installation of
plots and SETs or in data collection Heather Baldwin Julia Cherry Wes Cochran Kari
Cretini Ada Diz Andy From Amber Hanna Philippe Hensel Jim Lynch Tommy
McGinnis Amy Trahan Ellen Travis and William Vervaeke We also appreciate the
comments and suggestions of Connie Herndon Beth Middleton and Chris Swarzenski on
earlier versions of this report
iii
Contents
Abstract 1
Introduction 4
Scope of Research 6
Study Area 7
Experimental Design 10
Methods 15
Measuring Elevation Dynamics 15
Measuring Aboveground and Belowground Plant Responses 18
Measuring Decomposition 19
Assessing Physicochemical Conditions 20
Performing Statistical Analyses 21
Results and Discussion 22
Conclusions 42
General Implications for Resource Management 42
Research Implications 44
References Cited 47
iv
Figures
Figure 1 Map of the study site at McFaddin National Wildlife Refuge (top panel) and views
(lower panels) of an experimental plot through four seasons prior to the prescribed burn 8
Figure 2 Setup of experimental plots Clockwise from top left (1) construction of platforms (2)
study plot demarcated by access platform (3) driving benchmark rods for installation of surface
elevation tables (SET) (4) SET receiver cemented to deep benchmark rod 11
Figure 3 Schematic diagram of experimental plot showing positions of various measurements
made during the study 12
Figure 4 Views of study area during and after burn treatment (December 2006) Clockwise from
top left (1) prescribed burn (2) initial plant regrowth after burn (3) elevation measurement after
burn treatment (4) plant regrowth in spring 2007 13
Figure 5 Surface temperatures recorded by data loggers during the prescribed burn on
December 3 2006 The upper panel shows data for experimental plots M13-16 (black lines) and
M1-4 (gray lines) The lower panel shows data for the surrounding marsh to the northwest (NW)
southwest (SW) and northeast (NE) of the plots 14
Figure 6 Diagram showing the rod surface elevation table (SET) in relation to deep and shallow
benchmarks and marker horizon which demarcate three strata in the soil profile to allow vertical
delineation of processes controlling elevation change 16
Figure 7 Methods used to measure elevation change accretion subsidence and root zone
movement Clockwise from top left (1) Adding feldspar clay to soil surface to create a marker
horizon (2) Measuring thickness of accreted sediment above the marker horizon (3) measuring
arm of the surface elevation table being attached to the deep benchmark rod (4) Fiberglass pins
being lowered to the soil surface and to the shallow benchmark (white cap) 17
v
Figure 8 Methods used to measure response to treatments Clockwise from top left (1) Clipping
of aboveground biomass and litter collection (2) Collection of porewater for measurement of
salinity pH sulfide and nutrients (3) Installation of in-growth bags to measure rates of
belowground accumulation of root matter (4) Installation of a standardized cellulose material to
measure decomposition rates 19
Figure 9 Time-course of elevation change (σ) and accretion above marker horizon (θ) in
nonburned and burned plots (mean plusmn standard error n = 8 averaged over nutrient treatment)
Note different scales for Y-axis before (left) and after (right) Hurricanes Gustav and Ike25
Figure 10 Variation in elevation-change rate (Y-axis) in relation to vertical movement (X-axis) in
three strata including accretion (top panels) root zone (middle panels) and subroot zone (bottom
panels) Rates of change measured before and after Hurricane Ike (September 9 2008) are plotted
in left or right panels respectively Treatment plots are indicated by closed (burned) or open
(nonburned) symbols Inset values are correlation coefficients 27
Figure 11 Standing live and dead biomass and fallen litter in burned and unburned plots
(averaged over nutrient treatments mean value plusmn standard error n = 8) The prescribed burn
occurred on December 3 2006 31
Figure 12 Variation in live and dead stem density in burned and nonburned plots (averaged
over nutrient treatment mean value plusmn standard error n = 8) The prescribed burn occurred on
December 3 2006 32
Figure 13 Aboveground and belowground production of biomass (averaged over burn and
nutrient treatments mean value plusmn standard error n =8) The prescribed burn occurred on
December 3 2006 34
vi
Figure 14 Depth variation in decomposition of standard cellulose material in burned and
nonburned plots (summer of 2007) (averaged over nutrient treatment mean value plusmn standard
error n = 8) 36
Figure 15 Soil redox potential (Eh) at soil depth (in centimeters) and porewater salinity pH
sulfide ammonium (NH4) and phosphate (PO4) measured seasonally in experimental plots
(averaged over treatments mean value plusmn standard error n = 16) 38
Figure 16 Conceptual model illustrating internal processes and external drivers influencing
vertical movement in three soil strata in a brackish marsh dominated by Spartina patens including
accretion above a marker horizon root zone and subroot zone Observed effects of burning
nutrient addition and hurricanes are indicated as follows + (positive) - (negative) and 0 (none) 46
Tables
Table 1 Summary of area (hectares) burned in McFaddin National Wildlife Refuge during the
study period 9
Table 2 Summary of relative sea-level rise (SLR) and elevation dynamics in burned and
nonburned plots at McFaddin National Wildlife Refuge prior to Hurricanes Gustav and Ike
(September 2008) Values (in millimeters per year) are the mean value plusmn standard error 40
vii
Conversion Factors
SI to InchPound Multiply By To obtain
Length centimeter (cm) 03937 inch (in)
millimeter (mm) 003937 inch (in)
meter (m) 1094 yard (yd)
Area square meter (m2) 00002471 acre
hectare (ha) 2471 acre
square millimeter (mm2) 0001550 square inch (in2)
square meter (m2) 1076 square foot (ft2)
Mass gram (g) 003527 ounce avoirdupois (oz)
Energy millivolt (mV) 0001 volt
-Temperature in degrees Celsius (degC) may be converted to degrees Fahrenheit (degF) as follows
degF=(18timesdegC)+32
-Vertical coordinate information is referenced to North American Vertical Datum of 1988 (NAVD 88)
-Salinity is expressed in permille (permil) units which is approximately equal to the grams of salt per kilogram of
solution In this study salinity was determined based on the refractive index of the solution and converted to
permille units by the instrument (refractometer)
1
Effects of Prescribed Burning on Marsh-Elevation Change and the Risk of Wetland Loss By Karen L McKee and James B Grace
Abstract
Marsh-elevation change is the net effect of biophysical processes controlling
inputs versus losses of soil volume In many marshes accumulation of organic matter is
an important contributor to soil volume and vertical land building In this study we
examined how prescribed burning a common marsh-management practice may affect
elevation dynamics in the McFaddin National Wildlife Refuge Texas by altering
organic-matter accumulation Experimental plots were established in a brackish marsh
dominated by Spartina patens a grass found throughout the Gulf of Mexico and Atlantic
marshes Experimental plots were subjected to burning and nutrient-addition treatments
and monitored for 35 years (April 2005 ndash November 2008) Half of the plots were
burned once in 2006 half of the plots were fertilized seasonally with nitrogen
phosphorus and potassium Before and after the burns seasonal measurements were
made of soil physicochemistry vegetation structure standing and fallen plant biomass
aboveground and belowground production decomposition and accretion and elevation
change (measured with Surface Elevation Tables (SET)) Movements in different soil
strata (surface root zone subroot zone) were evaluated to identify which processes were
contributing to elevation change Because several hurricanes occurred during the study
period we also assessed how these storms affected elevation change rates The main
findings of this study were as follows
2
1 The main drivers of elevation change were accretion on the marsh surface and
subsurface movement below the root zone but the relative influence of these
processes varied temporally Prior to Hurricanes Gustav and Ike (September
2008) the main driver was subsurface movement after the hurricane both
accretion and subsurface movement were important
2 Prior to Hurricanes Gustav and Ike rates of elevation gain and accretion above a
marker horizon were higher in burned plots compared to nonburned plots
whereas nutrient addition had no detectable influence on elevation dynamics
3 Burning decreased standing and fallen plant litter reducing fuel load Hurricanes
Gustav and Ike also removed fallen litter from all plots
4 Aboveground and belowground production rates varied annually but were
unaffected by burning and nutrient treatments
5 Decomposition (of a standard cellulose material) in upper soil layers was
increased in burned plots but was unaffected by nutrient treatments
6 Soil physicochemistry was unaffected by burning or nutrient treatments
7 The elevation deficit (difference between rate of submergence and vertical land
development) prior to hurricanes was less in burned plots (62 millimeters per
year [mm yr-1]) compared to nonburned plots (72 mm yr-1)
8 Storm sediments delivered by Hurricane Ike raised elevations an average of 74
centimeters (cm) which countered an elevation deficit that had accrued over 11
years
Our findings provide preliminary insights into elevation dynamics occurring in
brackish marshes of the Texas Chenier Plain under prescribed fire management The
3
results of this study indicate that prescribed burning conducted at 3- to 5-year intervals is
not likely to negatively impact the long-term sustainability of S patens-dominated
brackish marshes at McFaddin National Wildlife Refuge and may offset existing
elevation deficits by asymp 1 mm yr-1 The primary drivers of elevation change varied in time
and space leading to a more complex situation in terms of predicting how disturbances
may alter elevation trajectories The potential effect of burning on elevation change in
other marshes will depend on several site-specific factors including geomorphic
sedimentary setting tide range local rate of relative sea level rise plant species
composition additional management practices (for example for flood control) and
disturbance types and frequency (for example hurricanes or herbivore grazing)
Increasing the scope of inference would require installation of SETs in replicate marshes
undergoing different prescribed fire intervals and in different geomorphic settings (with
different hurricane frequencies andor different sedimentary settings) Multiple locations
along the Gulf and Atlantic coasts where prescribed fire is used as a management tool
could provide the appropriate setting for these installations
4
Introduction
Global mean sea level has been increasing at a rate of 32 millimeters per year
(mm yr-1) since 1992 (based on satellite altimetry Colorado Center for Astrodynamics
Research 2011) with predicted future rates due to global warming being at 6 mm yr-1 or
more (Parry and others 2007) Coastal marshes must keep pace with rising water levels
or become submerged Local subsidence rates may combine with eustatic rates of sea-
level rise to cause even faster rates of inundation locally Emergent vegetation not only
accelerates mineral sediment deposition and vertical accretion (through baffling of
sediment-laden water by plant shoots) (Morris and others 2002) but also directly
contributes organic matter to soil formation (Nyman and others 1993 Nyman and others
2006 McKee and others 2007 Neubauer 2008 McKee 2011) In fact habitat stability
of many coastal wetlands in relation to sea level rise may be the result of a feedback
relationship between environmental conditions and plant matter accumulation (Nyman
and others 2006 Mudd and others 2009 McKee 2011) In some cases the decaying
plant shoots and other organic detritus accumulate on the marsh surface contributing to
vertical accretion but in many marshes and swamps plant roots and shoot bases
contribute to subsurface soil expansion (McKee and others 2007 Cherry and others
2009 Langley and others 2009 McKee and Cherry 2009 McKee 2011)
Any factor that influences plant production or organic matter decomposition will
alter the net amount of biomass that accumulates in the soil From a few studies
scientists have inferred organic contributions to vertical accretion and soil expansion
based on analysis of sediment cores (Turner and others 2006 Sanders and others 2008)
Direct measurements of changes in accretion and elevation in relation to accumulation of
5
organic matter (and processes that control it) are necessary however to understand and
predict habitat stability (Neubauer 2008 Mudd and others 2009) For example
manipulation of nutrient availability in an oligotrophic mangrove ecosystem altered root
production which in turn caused a change in direction and magnitude of elevation change
(McKee and others 2007) Two additional studies have shown experimentally that
increases in atmospheric CO2 can accelerate elevation gain in some coastal marshes by
stimulating belowground production and upward expansion of the soil surface (Cherry
and others 2009 Langley and others 2009)
On the other hand disturbance processes may cause negative effects on
accumulation of organic matter Biological agents that damage or remove vegetation
include grazers such as geese nutria muskrat and snails (Gauthier and others 1995
Ford and Grace 1998 Silliman and others 2005) Physical processes include sediment or
wrack burial erosion or scouring and fire (Guntenspergen and others 1995 Nyman and
Chabreck 1995) Of particular concern are marsh management practices that may alter
accumulation of soil organic matter and vulnerability to submergence Prescribed burning
is a common management practice used in coastal marshes to reduce hazardous buildup
of fuel enhance wildlife habitat or food sources and promote rare or endangered species
(Nyman and Chabreck 1995) Burning may stimulate marsh productivity through release
of nutrients or may alternatively cause a net loss of organic matter through direct
combustion of peat andor a change in the species composition or plant tissue chemistry
which affects community production or decomposition rates (Hackney and De La Cruz
1977 Schmalzer and others 1991 Nyman and Chabreck 1995 Ford and Grace 1998
Gabrey and Afton 2001 Smith and others 2001 Ponzio and others 2004) Burning not
6
only removes aboveground biomass but may also remove upper layers of peat that may
have accumulated over long periods of time (Nyman and Chabreck 1995) Depending on
burn frequency and intensity however plant biomass production could be stimulated
without substantial loss of accumulated organic material (Nyman and Chabreck 1995)
Scope of Research
The goal of this cooperative research was to address an information need
identified by managers at McFaddin National Wildlife Refuge (NWR) Does the
prescribed fire regime currently in use adversely affect marsh elevations and increase the
risk of wetland loss This study experimentally investigated how fire management and
nutrient addition (with and without fire) affected elevation dynamics in a brackish marsh
dominated by Spartina patens (Ait) Muhl (marshhay cordgrass) a grass found
throughout Gulf of Mexico and Atlantic marshes A prescribed burn was applied once
during the study after one year of preburn measurements We hypothesized that burning
andor nutrient addition would alter the net accumulation of organic matter which would
affect the rate of soil elevation change Because several hurricanes occurred during the
study we also assessed the relative impact of these storms in relation to experimental
treatment effects Thus our research was aimed at addressing the following questions
1 What are the main drivers of elevation change and do they vary over time
2 Does burning or nutrient enrichment have a positive or negative effect on
elevation change
3 To what extent do biotic processes (shoot or root production decomposition)
contribute to elevation change in the experimental marsh and how are they affected by
burning and nutrient enrichment
7
The information gained in this study will be useful in designing and planning
future fire regimes and will provide insight into controls on accretion and elevation
change in brackish marshes Together with other studies of fire effects on marsh elevation
(Cahoon and others 2010) this work will lead to better management strategies for
coastal wetlands nationwide
Study Area
The study was conducted at the McFaddin NWR a 23843 ha area which is part
of the Texas Chenier Plain National Wildlife Refuge Complex Chenier plain marshes are
typically more stable than those in more rapidly subsiding areas such as in deltaic areas
but are still subject to rising sea level The current rate of relative sea level rise at
Galveston Pier 21 TX (tide gauge ID 8771450 1908-2010) is 63 mm yr-1 (NOAA
2011) The McFaddin NWR contains extensive expanses of freshwater brackish and salt
marsh To maintain plant diversity in this system several management techniques are
used including prescribed burns grazing water level management and exotic species
control The site selected for this study was a brackish marsh located along a bayou
within the McFaddin NWR (29ordm 41rsquo4147rdquoN 94ordm 04rsquo0485rdquoW) (fig 1) The dominant
plant species was S patens with minor occurrence of Bolboschoenus robustus (Pursh)
Sojaacutek At this site a thin organic mat (lt 1 m thick) overlies deeper sediments composed
of compacted silt and clay Brackish marshes including the area used in this study are
burned at about 3-year intervals usually at the end of the growing season
8
Figure 1 Map of the study site at McFaddin National Wildlife Refuge (top panel) and views (lower panels) of an experimental plot through four
seasons prior to the prescribed burn
9
Experimental plots were established in April 2005 and measurements were made
seasonally through November 2008 During the study period a total of 18653 ha in the
Refuge were treated by prescribed fire and another 12701 ha were burned by wildfire
(table 1) The marsh encompassing the experimental plots was burned once in 2006 (see
below for details) Also four major hurricanes occurred during the study including
Hurricanes Katrina (August 29 2005) Rita (September 24 2005) Gustav (September 1
2008) and Ike (September 13 2008)
Table 1 Summary of area (in hectares) burned in McFaddin National Wildlife Refuge during the
study period
Year Wild Prescribed
2005 7998 6359
2006 509 1917
2007 2613 10369
2008 1581 8
Total 12701 18653
Combined 31354
10
Experimental Design
The experimental design was completely randomized with a 2 x 2 factorial
treatment arrangement Two rows of eight plots each were established in the interior
marsh asymp 120 m from the bayou The plots were positioned several meters apart to isolate
treatment effects The perimeter of each plot (52 m x 32 m) was defined by a wooden
platform that facilitated access and minimized disturbance (fig 2) An extendible plank
was laid across the platform to provide access to the plot interior The plots were each
divided into a section for nondestructive measurements and another section for
destructive sampling (fig 3)
Within the nondestructive segment of the plots a rod surface elevation table
(hereafter SET) along with deep and shallow benchmarks and marker horizons were
installed (see below for details) (fig 3) Destructive measurements including
aboveground and belowground production decomposition and physicochemistry were
made in the other half of the plot (see below for details) (fig 3)
Plots were randomly assigned to a nutrient treatment (none nutrient addition) and
a fire treatment protocol (burned nonburned) Each nutrient-fire treatment combination
was replicated four times for a total of 16 experimental plots (M1-16) Fertilized plots
received a slow-release fertilizer (Vigoro Tree Shrub and Evergreen Food Spectrum
Brands Madison WI USA containing a 1648 ratio of nitrogen phosphorus and
potassium) which was broadcast onto the marsh surface during low water levels 3 times
per year The fertilizer treatment was initiated in April 2005 and continued until the end
of the study in 2008
11
The prescribed burn occurred on December 3 2006 (fig 4) Fire crews burned the
surrounding marsh and allowed the fire to move across the study area In preparation for
the burn platforms in burn plots were partially disassembled and lumber was stored in
adjacent (nonburned) plots Deep and shallow benchmarks were protected by fire
blankets Half of the plots were prevented from burning by operation of a sprinkler
system installed prior to the fire The sprinkler system protected all but one nonburned
plot where the sprinklers failed this plot was partially burned Temperature loggers were
deployed in all burn plots and at three points in the surrounding marsh and retrieved after
the burn Surface temperatures reached a peak of 274ordm C in the marsh just northwest of
the site the maximum temperature in burn plots ranged from 32 to 185 ordm C (fig 5)
Figure 2 Setup of experimental plots Clockwise from top left (1) construction of platforms (2)
study plot demarcated by access platform (3) driving benchmark rods for installation of surface
elevation tables (SET) (4) SET receiver cemented to deep benchmark rod
Figure 3 Schematic diagram of experimental plot showing positions of various measurements made during the study
13
Figure 4 Views of study area during and after burn treatment (December 2006) Clockwise from top left (1) prescribed burn (2) initial plant
regrowth after burn (3) elevation measurement after burn treatment (4) plant regrowth in spring 2007
Figure 5 Surface temperatures recorded by data loggers during the prescribed burn on
December 3 2006The upper panel shows data for experimental plots M13-16 (black lines)
and M1-4 (gray lines) The lower panel shows data for the surrounding marsh to the northwest
(NW) southwest (SW) and northeast (NE) of the plots
15
Methods
Measuring Elevation Dynamics
Surface elevation change in each plot was determined to the nearest millimeter
with SETs (Cahoon and others 2002) Change in the elevation of the soil surface relative
to the base of a benchmark reflects expansion or contraction over different portions of the
sediment profile (fig 6) The rod SET setup consisted of a benchmark rod driven to the
point of refusal four shallow benchmarks (30 cm deep) and a portable measuring arm
Deep benchmark rods were driven with a slide-hammer to depths of 15 to 16 m Shallow
benchmarks which were constructed of 5-cm diameter x 40-cm long aluminum pipe
capped at the top with an acrylic disc were inserted into the soil to a 30-cm depth
During measurements the portable arm was attached to the deep benchmark in one of
four fixed directions and leveled in both horizontal and vertical planes On each sampling
date seven fiberglass pins were lowered to the soil surface and the extension distances
above the arm were recorded Changes in pin extension distance corresponded to changes
in soil elevation relative to the baseline measurement Two pins were lowered to the top
of the shallow benchmark which allowed movement in the root zone to be isolated from
movement in the sub-root zone by partitioning change in the upper 30 cm from the total
elevation change over the entire soil profile (figs 6-7) Accretion of sediment on the soil
surface was determined by using marker horizons (3 per plot) of white feldspar clay sown
onto the soil surface (fig 7) Marker horizons were asymp 1 cm thick and covered an area of
025 m2 Accumulation of sediment was determined at 4-month intervals by collecting
cryogenic cores through each marker horizon (fig 7) (Cahoon and others 1996)
16
Figure 6 Diagram showing the rod surface elevation table (SET) in relation to deep and shallow
benchmarks and marker horizon which demarcate three strata in the soil profile to allow
vertical delineation of processes controlling elevation change
The marker horizon depth was measured at four positions around the core to the nearest
millimeter and averaged For each SET a total of 28 deep-benchmark 8 shallow-
benchmark and 3 marker-horizon measurements were recorded
The elevations of the marsh surface in each SET plot were determined by using
real-time kinematic (RTK) Global Positioning System measurements with a minimum of
15-second (s) observations at four points within each plot RTK elevations were
expressed with respect to the North American Vertical Datum of 1988 (NAVD88)
17
Figure 7 Methods used to measure elevation change accretion subsidence and root zone
movement Clockwise from top left (1) Adding feldspar clay to soil surface to create a marker
horizon (2) Measuring thickness of accreted sediment above the marker horizon (3)
measuring arm of the surface elevation table being attached to the deep benchmark rod (4)
Fiberglass pins being lowered to the soil surface and to the shallow benchmark (white cap)
Measuring Aboveground and Belowground Plant Responses
Standing plant biomass was harvested at 4-month intervals by clipping all shoots
at the soil surface within a 01-square meter (m2) circular quadrat (fig 8) All fallen litter
was collected within the quadrat and bagged separately Clipped plots were randomly
selected from a gridded area and marked to avoid resampling Standing and fallen
material was later sorted by species and condition (live dead) oven-dried (60ordm C) and
weighed Annual aboveground production was estimated by summing end-of-growing
season standing live and dead biomass (Morris 2007)
Belowground accumulation of roots and rhizomes was determined by using the
in-growth method (McKee and others 2007) Duplicate in-growth bags (5-cm diameter x
30-cm length) containing a root-free standardized organic substrate (milled sphagnum
peat) were installed in all plots at the beginning of the study (fig 8) The bags were
constructed of a flexible large-mesh material (3 square millimeters (mm2) JampM
Industries Ponchatoula LA USA) which allowed in-growth of both fine and coarse
roots A core of soil was removed initially and a prefilled bag was inserted into the hole
the top of the bag was secured with twine to a stake Bags were retrieved after one year
by recoring new bags were installed in the same location Bags with ingrown material
were divided into 10-cm segments placed into ziplock bags and kept cool until
processing All ingrown material was washed over a 1-mm sieve separated into size
classes (fine roots [lt2 mm] coarse roots [gt2 mm rhizomes]) and condition [live or dead
based on appearance and flotation] dried at 60 ordmC and weighed Rates of belowground
production (to a 30-cm depth) were calculated by dividing the mass per unit area by the
time interval to give an annual value (grams per square meter per year [g m-2 yr-1])
19
Figure 8 Methods used to measure response to treatmentsClockwise from top left (1) clipping
of aboveground biomass and litter collection (2) collection of porewater for measurement of
salinity pH sulfide and nutrients (3) installation of in-growth bags to measure rates of
belowground accumulation of root matter (4) installation of a standardized cellulose material to
measure decomposition rates
Measuring Decomposition
Decomposition rates in each experimental plot were measured by using the
ldquocotton-strip techniquerdquo (Slocum and others 2009) Canvas material (100 percent undyed
20
cotton style number 568 Tara Materials Inc Lawrenceville Ga
wwwtaramaterialscom) was cut into strips (10 cm x 30 cm) and inserted vertically into
the soil with a spade so that about 4 cm extended above the soil surface (fig 8) The exact
position of the soil surface was marked by clipping a notch in the strip Samples remained
in the ground for 10 days and then were retrieved at the time of sample retrieval
reference strips were inserted and immediately removed At the laboratory all strips were
washed with deionized water air-dried and stored away from sunlight Sampling depths
were marked with a pencil on each strip and then sub-strips were cut by using a rotary
blade Tensile strength of each sub-strip was measured with a tensometer (Slocum and
others 2009) Rates of loss of cotton tensile strength were calculated as CTSL () = [1-
(NC)D] x 100 where N is the strength of the experimental sub-strip in Newtons C is
the mean tensile strength of the reference sub-strips and D is the number of days in the
ground
Assessing Physicochemical Conditions
Duplicate samples of pore water were collected at a 25-cm depth in the
undisturbed section of the plot and analyzed for salinity pH sulfide and nutrients as
described previously (McKee and others 1988 McKee and McGinnis 2002) (fig 8)
Soil samples were collected with a piston corer for measurement of bulk density (dry
mass per volume) and percent organic matter (loss on ignition) according to standard
methods (Parent and Caron 1993) Soil redox potentials at 1- 15- and 30-cm depths
were measured with bright platinum electrodes equilibrated in situ for 30 min (McKee
and others 1988) Each electrode was checked before use with quinhydrone in pH 4 and
7 buffers (millivolt [mV] reading for quinhydrone is 218 and 408 respectively at 25 C)
21
The potential of the calomel reference electrode (+244 mV) was added to each reading to
calculate redox potential (Eh)
Performing Statistical Analyses
The elevation data (total change and vertical movement of each depth interval)
were divided into the period prior to and after Hurricanes Gustav and Ike (September
2008) and analyzed separately The total vertical departure (cumulative) from the
baseline for each fiberglass pin (36 per SET) was calculated for each sampling date The
cumulative changes for the 28 pins lowered to the soil surface were averaged to provide
an overall rate of mean elevation change (relative to the base of the deep benchmark) per
SET per date Similarly the cumulative changes for the 8 pins lowered to the shallow
benchmarks (4 directions per SET) were averaged and represented the movement
between the base of the shallow benchmarks to the depth of the deep benchmark The
depths of sediment accreted above the three marker horizons per SET were also averaged
to provide a single mean value for each SET per sampling date Movement within the
root zone was calculated by subtracting the shallow benchmark movement and accretion
from total elevation change Total subsurface change (subsidence or expansion) was
calculated by subtracting accretion (above the marker horizon) from total elevation
change (soil surface movement relative to the base of the deep benchmark) Thus each
SET plot provided five linear trajectories representing total elevation change shallow
subsidence and movement in three strata including surface accretion root zone and
subroot zone The slopes of these linear relationships were determined to provide a rate
of change for each SET which was considered to be the experimental unit
22
Rates of change for elevation variables were analyzed by analysis of covariance
(ANCOVA) using the NAVD88 elevation of the SET plots as a covariate and burn and
fertilizer treatments as categorical grouping factors Other variables (biomass and
production) were analyzed by using a repeated-measures analysis of variance (ANOVA)
with burn and nutrient treatments as grouping factors and time as the repeated measure
Decomposition data were assessed with repeated measures ANOVA by using burn and
nutrient treatments as the grouping factors and depth as the repeated measure If
necessary data were log-transformed to meet assumptions of ANOVA Statistical
analyses were performed with JMPreg Version 900 (SAS Institute Inc Cary NC)
Results and Discussion
Several considerations must be kept in mind when interpreting the results of this
study First the study was conducted in one location within the McFaddin NWR and in
one marsh habitat Thus the results may not be applicable to other locations or marsh
types within the refuge or in other geographic locations especially where conditions (for
example subsidence) are considerably different Nevertheless the natural mechanisms
involved in controlling elevation dynamics in the experimental plots and the effects of
burning and nutrient treatments on these mechanisms are generally relevant to other
coastal marshes Second the responses to treatments do not necessarily indicate long-
term responses to burning or nutrient treatments and therefore cannot be extrapolated
beyond the time interval of the study Third these results reflect the effect of a single
prescribed burn (simulating a 3- to 5-year burn interval) more frequent (annual) burning
may produce different results Fourth several hurricanes occurred during the study and
23
apparently influenced some of the response variables including biomass accumulation
soil chemistry and elevation dynamics
With these caveats in mind we describe the key results and their implications in
the following sections
1 Result The main drivers of elevation change in the brackish marsh studied at
McFaddin NWR were accretion on the marsh surface and subsurface movement
below the root zone but the relative influence of these processes varied
temporally (with hurricane occurrence)
Movements in different soil strata contribute to elevation change of the marsh
surface (Cherry and others 2009 McKee and Cherry 2009 McKee 2011) Several
biological and physical processes control these movements by promoting vertical
expansion or contraction of these soil strata Mineral andor organic detritus is deposited
on the soil surface and can undergo subsequent compaction or erosion or microbial
decomposition (organic) Root-zone movement is driven by belowground production of
roots rhizomes and shoot bases decomposition of organic matter and physical
compaction Below the root zone subsidence and shrink-swell of the substrate (due to
changing water content) predominate The relative contribution of these processes in each
soil strata varies among marshes and over time This study quantified the rate and
direction of movement in each of these soil strata which allowed identification of the
main processes controlling elevation change in the study site at McFaddin NWR
24
Elevation and accretion in burned and nonburned plots varied over time relative to
the initial baseline (fig 9) Prior to Hurricanes Gustav and Ike the rate of elevation
change varied across all experimental plots from -91 to 79 mm yr-1 with an overall
average of -04 mm yr-1 Elevation change was positively correlated with plot elevation
which varied from 0235 to 0301 m (NAVD88) (r = 071 P = 00021) This correlation
likely reflects a feedback relationship between elevation and flooding-related factors
influencing sedimentation and production-decomposition processes (Neubauer 2008
Mudd and others 2009 McKee 2011) Accretion above marker horizons varied from 04
to 7 mm yr-1 with an overall average of 32 mm yr-1 Accretion exceeded elevation
change throughout the 35 year observation period indicating that subsidence was
contributing to vertical movement of all plots regardless of treatment The rate of average
shallow subsidence across the study site was -36 mm yr-1 The rate of shallow subsidence
plus relative sea level rise (SLR) (63 mm yr-1) yields a total submergence rate of 99 mm
yr-1 Vertical change in the root zone varied from -06 to 09 mm yr-1 (average = 02 mm
yr-1) indicating a slight but overall expansion Total elevation gain (accretion plus root
zone) was 34 mm yr-1 Thus there was an overall elevation deficit (submergence minus
elevation gain) of 65 mm yr-1 at this site prior to the 2008 hurricanes
25
Figure 9 Time-course of elevation change (σ) and accretion above marker horizon (θ) in
nonburned and burned plots (mean plusmn standard error n = 8 averaged over nutrient treatment)
Note different scales for Y-axis before (left) and after (right) Hurricanes Gustav and Ike
26
To determine which processes were driving vertical movement of the marsh
surface elevation change rates across plots were assessed in relation to movement in the
three main strata (surface root zone subroot zone) (fig 10) Prior to Hurricanes Gustav
and Ike the primary driver of change was sub-root zone movement (r = 092 P lt00001)
Movement below the root zone thus explained 85 percent of the variation in elevation
change before this hurricane whereas accretion and root zone expansion together
explained only 15 percent The storm surge associated with Hurricane Ike (East and
others 2008) delivered substantial sediment to experimental plots which strongly
influenced elevations (fig 9) After this hurricane accretion explained 53 percent and
subroot zone movement explained 46 percent of the variation in elevation change (fig
10) In Louisiana brackish marshes impacted by Hurricane Katrina storm sediments also
increased elevations by several centimeters but post-hurricane elevation movement in
upper soil layers was determined by the texture (for example particle size and organic
matter content) of the deposited sediment (McKee and Cherry 2009)
Authors of a companion fire study conducted at Blackwater NWR (on the eastern
shore of Maryland) found that marsh-elevation change averaging 4 mm yr-1 across
treatment plots was driven by three main factors including accretion root-zone
subsidence and shrink-swell of sediments below the root zone (Cahoon et al 2010) At
Blackwater NWR surface accretion was higher (59 ndash 97 mm yr-1) and caused by litter
accumulation rather than mineral sedimentation but there was root-zone collapse (lt-1 to
-6 mm yr-1) Overall shallow subsidence varied from -17 to 59 mm yr-1
27
Figure 10 Variation in elevation-change rate (Y-axis) in relation to vertical movement (X-axis) in
three strata including accretion (top panels) root zone (middle panels) and subroot zone
(bottom panels) Rates of change measured before and after Hurricane Ike (September 9
2008) are plotted in left or right panels respectively Treatment plots are indicated by closed
(burned) or open (nonburned) symbols Inset values are correlation coefficients
28
These results illustrate how relative movement in different soil strata (and associated
processes) can vary substantially within and among marshes over time Consequently it
is important to avoid viewing such controlling factors as static either in time or space
2 Result Burn treatment increased rates of elevation gain and accretion compared
to those in nonburned plots whereas nutrient treatment had no detectable
influence on elevation dynamics
Because of the overriding effect of storm sediment on elevation dynamics effects
of fire and nutrient treatments were assessed by using data collected prior to the 2008
hurricanes (earlier hurricanes had no detectable effect) Before the 2008 hurricanes
nutrient addition did not significantly affect elevation-change rates but burning had a
significant effect on both accretion and elevation change The burned plots gained
elevation (+014 mm yr-1) whereas nonburned plots lost elevation (-087 mm yr-1) (main
effect of fire F = 534 P = 00496) (fig 9) Thus burning not only affected the
magnitude of elevation change but also the direction and the difference caused by
burning was approximately 1 mm yr-1 Accretion above feldspar marker horizons also
was higher in burned (45 mm yr-1) compared to nonburned (19 mm yr-1) plots Sub-
surface change indicated that some plots were subsiding whereas others were undergoing
expansion but there was no effect of burning or nutrient treatments on root zone or
subroot zone movement These findings indicate that the effect of burning on soil
expansion occurred in the surface layers (above the marker horizon) This effect may
result from deposition of residual ash from the burned plant material that was deposited
29
on the soil surface The lack of a nutrient effect on elevation further suggests that burning
mainly acted by causing a physical contribution to vertical accretion rather than through
stimulation of plant growth such as roots on the marsh surface
Similarly a previous study conducted at McFaddin NWR found that marsh
burning slowed the rate of elevation loss compared to a nonburned marsh after hurricane-
induced flooding killed S patens (the dominant vegetation) causing root zone collapse
(Cahoon and others 2004) The positive effect of burning appeared to be related to
increased root growth resulting in an increase in organic matter volume but effects on
decomposition could not be ruled out Results of the study at Blackwater NWR indicated
no effect of burning on elevation change (Cahoon et al 2010) Although not significantly
different there was a trend for faster accretion with decreasing burn frequency Rates of
accretion in marshes with different fire (frequency) regimes were 59 mm yr-1 (annual)
69 mm yr-1 (3ndash5 year) 84 mm yr-1 (7ndash10-year) and 97 mm yr-1 (control) Shallow
subsidence tended to be slower in annually burned marshes (17 mm yr-1) compared to
control marshes (59 mm yr-1) or plots undergoing burn frequencies of 3ndash5 year (34 mm
yr-1) and 7ndash10 year (33 mm yr-1) Lower litter and accretion on the marsh surface may
have offset root-zone subsidence leading to similar rates of elevation change in annually
burned marshes (40 mm yr-1) in marshes burned at other frequencies (39 mm yr-1 [3ndash5
year] 50 mm yr-1 [7ndash10 year]) and in control marshes (38 mm yr-1)
3 Result Burning decreased standing and fallen plant litter reducing fuel load
Hurricanes Gustav and Ike also removed fallen litter from all plots
30
Aboveground biomass (live and dead standing and fallen litter) varied over time
and in response to burn and nutrient treatments and to hurricane impact (fig 11)
Aboveground live biomass was increased by nutrient addition before the prescribed burn
(479 vs 715 grams per square meter [g m-2] in control and fertilized plots) but it did not
differ among treatment and control plots after the burn and averaged 516 g m-2 (time by
nutrient interaction F = 68 P = 0012) Prior to the prescribed burn standing dead
biomass averaged 703 g m-2 in subsequently burned and 841 g m-2 in nonburned plots
litter averaged 181 g m-2 in subsequently burned and 164 g m-2 in nonburned plots After
the burn dead biomass was significantly lower in burned (326 g m-2 standing dead 112
g m-2 litter) compared to nonburned (736 g m-2 standing dead 365 g m-2 litter) plots
After Hurricanes Gustav and Ike litter in all plots was decreased to approximately 51 g
m-2 and did not differ among burn and nutrient treatments At Blackwater NWR annual
burning led to lower standing dead biomass (38 g m-2 yr-1) compared to less frequently
burned marshes (175ndash216 g m-2 yr-1 (Cahoon et al 2010)
Live and dead stem densities also varied over time and in response to burning
(fig 12) Prior to the burn live stem density was similar in subsequently burned (1021
stems m-2) and nonburned (964 stems m-2) plots after the burn density was two times
higher in burned (2309 stems m-2) than in nonburned (1054 stems m-2) plots (fire by time
interaction F = 538 P = 00235) Live density decreased to zero after Hurricanes Gustav
and Ike Dead stem density varied over time but differences between burned and
nonburned plots were not significant
31
Figure 11 Standing live and dead biomass and fallen litter in burned and unburned plots
(averaged over nutrient treatments mean value plusmn standard error n = 8) The prescribed burn
occurred on December 3 2006
32
Figure 12 Variation in live and dead stem density in burned and nonburned plots (averaged over
nutrient treatment mean value plusmn standard error n = 8) The prescribed burn occurred on
December 3 2006
33
These findings support one goal of prescribed burning which is to reduce fuel
loads but the findings also show that standing stocks of dead material rapidly return to
pre-burn levels (within 1ndash2 years) Consequently more frequent burning may be
necessary to maintain low amounts of litter Storm surge from hurricanes may also reduce
fuel loads by physically flushing out litter
4 Result Burning had no effect on aboveground or belowground production
Burning may stimulate plant growth by rapidly mineralizing organic matter and
adding nutrients or by removing standing and fallen dead litter and increasing light
penetration to support new shoot growth Although aboveground and belowground
production rates varied annually they were unaffected by the experimental treatments
and averaged 1256 and 155 g m-2 yr-1 respectively across all plots and years (fig 13)
Belowground production varied significantly with depth most root matter accumulated in
the upper 10 cm (121 g m-2 yr-1) compared to the deeper layers (16 ndash 19 g m-2 yr-1)
At Blackwater NWR annual burning increased both aboveground and
belowground production (Cahoon et al 2010) The lack of response at McFaddin NWR
may be due to the lesser frequency of burn treatment compared to that at Blackwater
NWR Another difference between the two studies is that the plant community at
Blackwater NWR contained Schoenoplectus americanus in addition to S patens whereas
the marsh at McFaddin NWR was dominated by a near-monoculture of S patens The
two species differ in their responses to disturbance and growth of S patens may not be as
responsive to burning as S americanus Another possibility is that annual burning
34
removed more dead standing and fallen litter at Blackwater NWR which promoted
greater production of new shoots in spring
Figure 13 Aboveground and belowground production of biomass (averaged over burn and
nutrient treatments mean value plusmn standard error n =8) The prescribed burn occurred on
December 3 2006
35
5 Result Decomposition in upper soil layers was increased by burning
Accumulation of organic matter requires slower rates of decomposition than
production Burning may accelerate decomposition of soil organic matter by stimulating
the activity of the soil microbial community via changes in nutrients or other
environmental conditions Burial of a standard cellulose material in the experimental
plots allowed assessment of the decomposition potentialmdashessentially the activity of the
microbial community--at different soil depths within the root zone where most of the
belowground production occurred
Decomposition of the standard cellulose material (summer 2007) varied by soil
depth (main effect P lt 0001) and was faster in upper soil layers in burned plots
(interaction of depth by fire P = 005) (fig 14) There was no effect of nutrient addition
on tensile strength loss suggesting that the effect of burning on decomposition was not
related to changes in availability of nitrogen phosphorus and potassium Although
decomposition appeared to be stimulated in burned plots the greater accretion above the
marker horizon counterbalanced any losses in organic matter so that the net effect was a
greater gain in elevation If there had been lower surface accretion at this site or higher
subsidence rates however the increased rate of decomposition could have had a greater
influence on elevation
36
Figure 14 Depth variation in decomposition of standard cellulose material in burned and
nonburned plots (summer of 2007) (averaged over nutrient treatment mean value plusmn standard
error n = 8)
37
6 Result Soil physicochemistry was unaffected by burning or nutrient addition
Soil bulk density across all plots averaged 01 plusmn 001 grams per cubic centimeter
(g cm-3) and percent organic matter averaged 56 plusmn 2 There were no differences in these
variables attributable to burning nutrient addition or season Also there were no
substantial effects of either burning or nutrient treatments on soil or porewater chemistry
although these parameters varied significantly over time (fig 15) Soil redox potential
and sulfide concentration indicate flooding-related conditions and typically vary
seasonally with soil flushing and plant growth The levels measured during this study
suggested low to moderate flooding stress at the study site which increased over the
period of observation Salinity increased after Hurricane Ike but values remained within
the tolerance range of S patens Salinity was significantly higher in burned (11 parts per
thousand [ppt]) versus nonburned (10 ppt) plots but this difference was slight and not
biologically significant Porewater concentrations of nutrients (ammonium [NH4] and
phosphate [PO4]) fluctuated seasonally and annually but did not show a significant
response to treatments Plant uptake andor chemical transformations likely explain why
porewater concentrations of these nutrients were not elevated in nutrient-amended plots
38
Figure 15 Soil redox potential (Eh) at soil depth (in centimeters) and porewater salinity pH
sulfide ammonium (NH4) and phosphate (PO4) measured seasonally in experimental plots
(averaged over treatments mean value plusmn standard error n = 16)
39
7 Result The elevation deficit was lower in burned plots (62 mm yr-1) compared to
nonburned plots (72 mm yr-1)
The vulnerability of marshes to sea-level rise is determined by the rate of vertical
marsh building relative to the rate of submergence that is relative SLR (table 2) The
relative SLR for the region is based on measurements from local tide gages In this case
mean sea level rise was estimated at 63 mm yr-1 (NOAA 2011) This value reflects
changes in water level as well as land movement below the base of the tide gage To
determine the true relative SLR however the rate of shallow subsidence (between the
base of the tide gage and the land surface) must be added to the rate of relative SLR
based on the tide gage This value is provided by the SET measurements
The subroot-zone movements were -46 mm yr-1 (burned plots) and -31 mm yr-1
(nonburned plots) giving a total submergence rate of 109 mm yr-1 and 94 mm yr-1
respectively To maintain soil elevations relative to submergence land building must
occur at equivalent rates The rate of land building is the combination of root zone
expansion plus accretion on the soil surface The combined rates of gain prior to
Hurricanes Gustav and Ike were 47 mm yr-1 (burned plots) and 22 mm yr-1 (nonburned
plots) Thus the elevation deficit was lower in the burned plots (62 mm yr-1) compared
to nonburned plots (72 mm yr-1) prior to these hurricanes (main effect of fire F = 541 P
= 00484) Because storm sediments subsequently altered elevation dynamics at this site
it was not possible to determine how much longer this difference in elevation deficit
would have been maintained
40
Table 2 Summary of relative sea-level rise (SLR) and elevation dynamics in burned and
nonburned plots at McFaddin National Wildlife Refuge prior to Hurricanes Gustav and Ike
(September 2008) Values (in millimeters per year) are the mean value plusmn standard error
Burned Nonburned
Relative SLR1 63 63 Sub-root zone subsidence 46 plusmn 22 31 plusmn 13 Total Submergence 109 plusmn 22 94 plusmn 13 Root zone expansion 02 plusmn 02 03 plusmn 01 Surface accretion 45 plusmn 05 19 plusmn 06 Total Land Building 47 plusmn 05 22 plusmn 06 Elevation Deficit2 62 plusmn 20 72 plusmn 10 1Relative SLR equals the change in mean sea level plus deep land movement (from tide
gauge records) (NOAA 2011)
2 Elevation deficit equals total submergence minus total land building
8 Result Storm sediments delivered by Hurricanes Gustav and Ike raised elevations
an average of 74 cm which countered an elevation deficit accrued over the
course of 11 years
The study site exhibited an overall elevation deficit of 67 mm yr-1 from April
2005 to April 2008 In September 2008 3 to 9 cm of sediment were deposited in plots
which raised elevations an average of 74 plusmn 09 cm (fig 9) The bulk of this sediment was
likely delivered by Hurricane Ike based on storm surge heights for the area (East and
others 2008) This single event countered an elevation deficit accrued over the course of
41
11 years (estimated by dividing storm-induced elevation gain by an annual average
deficit of 67 mm yr-1) This finding was in contrast to Hurricane Rita which did not
deliver measurable sediment to study plots (fig 9) A similar effect on elevation due to
sediment input by Hurricane Katrina was found in subsiding brackish marshes in
Louisiana (McKee and Cherry 2009) Between 3 and 8 cm of sediment were added to the
soil surface at Big Branch Marsh NWR and Pearl River Wildlife Management Area
(WMA) during the storm surge At those sites where the submergence rate (mean
relative SLR + subsidence) was 21 mm yr-1 the hurricane sediment was important in
countering elevation loss Although the elevations measured after Hurricane Katrina
continued to decline (because of continuing subsidence root-zone collapse andor
compaction of deposited sediment) net elevation gain was still positive two years later
In addition belowground accumulation of root matter was stimulated 10-fold at Big
Branch Marsh NWR which further contributed to upward expansion of the soil surface
In contrast to the above effects marsh flooding caused by Tropical Storm Charley
(August 1998) and Tropical Storm Frances (September 1998) led to plant dieback and
soil collapse at McFaddin NWR (Cahoon and others 2004) In that instance floodwaters
from the storm surge covered the marsh surface to a maximum depth of 15 m and
marshes remained flooded for about two months Since the study by Cahoon et al (2004)
was initiated after floodwaters had receded it is unknown how much sediment may have
been deposited The rate of accretion measured during the year following the storms
however was 4 to 5 mm yr-1 which was insufficient to counterbalance the rate of
collapse (37 to 68 mm yr-1)
42
The results of studies in Texas and Louisiana illustrate the potentially positive
effects of storm sediment on elevation dynamics in coastal marshes Although some
coastal marshes may suffer collapse erosion or other negative impacts from hurricane
disturbance subsiding areas that receive sufficient sediment to alter elevation trajectories
may benefit in the long-run However not all hurricanes will deliver sediment sufficient
to alter accretion and elevation trajectories as suggested by the differences between
Hurricanes Ike and Rita Additional monitoring of elevations at McFaddin NWR will be
required to assess if sediments deposited by 2008 hurricanes might influence future
elevation gain via stimulation of belowground production
Conclusions
General Implications for Resource Management
1 Prescribed burning conducted at 3- to 5-year intervals does not seem to pose
an additional risk to long-term sustainability of S patens-dominated brackish
marshes at McFaddin NWR
The results of this cooperative study indicate that the current prescribed fire
regime (3ndash5 year frequency) at McFaddin NWR seems to pose no additional threat to
marsh sustainability and may offset existing elevation deficits by approximately 1 mm yr-
1 Although this specific offset cannot be extrapolated beyond the study period or to other
coastal refuges the findings at McFaddin NWR and Blackwater NWR together suggest
that prescribed fire may provide benefits to future sustainability of some brackish
marshes The potential effect of burning on elevation change will depend on several site-
specific factors including geomorphicsedimentary setting tide range local rate of
43
relative SLR plant species composition additional management practices (eg for flood
control) and disturbance types and frequency (for example hurricanes and herbivore
grazing) Sites undergoing high rates of subsidence andor intense herbivory for
example might be negatively affected by burning Further studies conducted in different
marsh types and hydroedaphic settings and at different burn intervals will be required for
further understanding
2 The primary drivers of elevation change vary in time and space leading to a
more complex situation in terms of predicting how disturbances may alter
elevation trajectories
A growing body of information suggests that various processes both physical and
biological contribute to vertical movement in different soil layers In this study we
partitioned movement in three main zones including the soil surface (above a marker
horizon) root zone and subroot zone Besides this study two other studies have
examined effects of movement in discrete strata on total elevation change in brackish
marshes (McKee and Cherry 2009 Cahoon and others 2010) Movement in each of
these strata is controlled by a different suite of processes and consequently may be
influenced by different physical and biological drivers (fig 16) Mineral sedimentation
on the soil surface is influenced by tides and currents by proximity to rivers creeks and
open ocean by the composition of the sediment (particle-size distribution) by barriers to
water movement and by plant type and stem density (which baffles water movement)
Expansion or contraction of the root zone is influenced by the growth cycle of the rooted
vegetation by factors influencing plant growth (nutrients climate) and by factors
influencing decomposition of organic matter Subroot-zone movement is due to physical
44
processes such as compaction (reduction in pore space) and by shrink-swell movement
caused by surface and groundwater influx and steric changes in adjacent bays and oceans
Because these biophysical drivers may vary seasonally andor annually and in response to
stochastic events such as hurricanes their relative influence also varies temporally Also
the influence of seasonal or annual processes may obscure finer movements responsible
for directional trends making quantification of effects of burning and other management
practices difficult to determine without long-term records (gt5 years)
Research Implications
Long-term monitoring of elevation changes will provide additional insights into
how processes controlling marsh elevations may change over time and how long
elevation trajectories in burned plots will persist The study sites at McFaddin NWR in
Texas and Blackwater NWR in Maryland are the only two known locations where effects
of prescribed fire on marsh-elevation dynamics have been evaluated These two locations
are very similar in that they are characterized by microtidal to nontidal astronomical
ranges are in subsiding geomorphic settings and have low sediment supplies (during
nonhurricane years) The McFaddin NWR site also provides a unique opportunity to
follow long-term impacts of hurricane sedimentation on elevation dynamics Together
with sites such as those at the Big Branch Marsh NWR and the Pearl River WMA the
SET-instrumented plots represent a valuable resource that can continue to produce
information in the future about hurricane effects on coastal marshes To increase the
scope of inference SETs could be installed in replicate marshes undergoing different
prescribed fire intervals and in different geomorphic settings (with different hurricane
frequencies andor different sedimentary settings) Multiple locations along the Gulf and
45
Atlantic coasts in which prescribed fire is used as a management tool would provide the
ideal setting for such installations
Figure 16 Conceptual model illustrating internal processes and external drivers influencing vertical movement in three soil strata in a brackish
marsh dominated by Spartina patens including accretion above a marker horizon root zone and subroot zone Observed effects of burning
nutrient addition and hurricanes are indicated as follows + (positive) - (negative) and 0 (none)
References Cited
Cahoon DR Ford MA and Hensel PF 2004 Ecogeomorphology of Spartina
patens-dominated tidal marshes soil organic matter accumulation marsh
elevation dynamics and disturbance in Fagherazzi Sergio Marani Marco
Blum LK eds The Ecogeomorphology of Tidal Marshes Washington DC
American Geophysical Union p 247-266
Cahoon DR Guntenspergen GR Baird Suzanne Nagel Jessica Hensel P F
Lynch JC Bishara Dana Brennand Patrick Jones Joshua and Otto Clint
2010 Do annual prescribed fires enhance or slow the loss of coastal marsh habitat
at Blackwater National Wildlife Refuge Final Project Report (JFSP Number 06-
2-1-35) Final Project Report (JFSP Number 06-2-1-35) Beltsville MD p 19
[httpwwwfiresciencegovJFSP_Search_Results_Detailcfmjdbid=2426
275V020200A]
Cahoon DR Lynch JC and Knaus RM 1996 Improved cryogenic coring device
for sampling wetland soils Journal of Sedimentary Research v 66 p 1025-1027
Cahoon DR Lynch JC Perez BC Segura Bradley Holland RD Stelly Carroll
Stephenson Gary and Hensel PF 2002 High-precision measurements of
wetland sediment elevation II the rod surface elevation table Journal of
Sedimentary Research v 72 p 734-739
Cherry JA McKee KL and Grace JB 2009 Elevated CO2 enhances biological
contributions to elevation change in coastal wetlands by offsetting stressors
associated with sea-level rise Journal of Ecology v 97 p 67-77
48
East JW Turco MJ and Mason Jr RR 2008 Monitoring inland storm surge and
flooding from Hurricane Ike in Texas and Louisiana September 2008 US
Geological Survey Open-File Report 2008-1365 US Geological Survey
[httppubsusgsgovof20081365]
Ford MA and Grace JB 1998 The interactive effects of fire and herbivory on a
coastal marsh in Louisiana Wetlands v 18 p 1-8
Gabrey SW and Afton AD 2001 Plant community composition and biomass in Gulf
Coast chenier plain marshes responses to winter burning and structural marsh
management Environmental Management v 27 p 281-293
Gauthier Gilles Hughes RJ Reed Austin Beaulieu Julien and Rochefort Line 1995
Effect of grazing by greater snow geese on the production of graminoids at an
arctic site (Bylot Island NWT Canada ) Journal of Ecology v 83 p 653-664
Guntenspergen GR Cahoon DR Grace JB Steyer GD Fournet Stephen
Townson MA and Foote AL 1995 Disturbance and recovery of the
Louisiana coastal marsh landscape from the impacts of Hurricane Andrew
Journal of Coastal Research v SI 21 p 324-339
Hackney CT and De La Cruz AA 1977 The ecology of a Mississippi tidal marsh
The effects of fire on the vegetation of a tidal marsh in St Louis Bay Mississippi
Mississippi Marine Resources Council p 23
Langley JA McKee KL Cahoon DR Cherry JA and Megonigal JP 2009
Elevated CO2 stimulates marsh elevation gain counterbalancing sea-level rise
Proceedings of the National Academy of Sciences v 106 p 6182-6186
49
McKee KL 2011 Biophysical controls on accretion and elevation change in Caribbean
mangrove ecosystems Estuarine Coastal and Shelf Science v 91 p 475-483
McKee KL Cahoon DR and Feller IC 2007 Caribbean mangroves adjust to rising
sea level through biotic controls on change in soil elevation Global Ecology and
Biogeography v 16 p 545-556
McKee KL and Cherry JA 2009 Hurricane Katrina sediment slowed elevation loss
in subsiding brackish marshes of the Mississippi River Delta Wetlands v 29 p
2-15
McKee KL and McGinnis TE 2002 Hurricane Mitch Effects on mangrove soil
characteristics and root contributions to soil stabilization US Geological Survey
Open-File Report OFR-02-178 64 p
McKee KL Mendelssohn IA and Hester MW 1988 Reexamination of pore water
sulfide concentrations and redox potentials near the aerial roots of Rhizophora
mangle and Avicennia germinans American Journal of Botany v 75 p 1352-
1359
Morris JT 2007 Estimating net primary production of salt marsh macrophytes in
Fahey TJ Knapp AK eds Principles and standards for measuring primary
production New York Oxford University Press p 106-119
Morris JT Sundareshwar PV Nietch CT Kjerfve Bjorn and Cahoon DR 2002
Response of coastal wetlands to rising sea level Ecology v 83 p 2869-2877
Mudd SM Howell SM and Morris JT 2009 Impact of dynamic feedbacks
between sedimentation sea-level rise and biomass production on near-surface
50
marsh stratigraphy and carbon accumulation Estuarine Coastal and Shelf
Science v 82 p 377-389
Neubauer SC 2008 Contributions of mineral and organic components to tidal
freshwater marsh accretion Estuarine Coastal and Shelf Science v 78 p 78-88
NOAA nd Tides amp Currents [httpwwwtidesandcurrentsnoaagov] National Oceanic
and Atmospheric Administrations National Ocean Service accessed August 10
2010 at httpwwwtidesandcurrentsnoaagov
Nyman JA and Chabreck RH 1995 Fire in coastal marshes history and recent
concerns in Cerulean SI Engstrom RT eds Fire in wetlands a management
perspective Proceedings of the tall timbers fire ecology conference No 19
Tallahassee Fl Tall Timbers Research Station p 134-141
Nyman JA DeLaune RD Roberts HH and Patrick Jr WH 1993 Relationship
between vegetation and soil formation in a rapidly submerging coastal marsh
Marine Ecology Progress Series v 96 p 269-279
Nyman JA Walters RJ DeLaune RD and Patrick Jr WH 2006 Marsh vertical
accretion via vegetative growth Estuarine Coastal and Shelf Science v 69 p
370-380
Parent LE and Caron Jean 1993 Physical properties of organic soils in Carter MR
ed Soil Sampling and Methods of Analysis Boca Raton Lewis Publishers p
441-458
Parry ML Canziani OF and Palutikof JP 2007 Technical Summary in Parry
ML Canziani OF Palutikof JP van der Linden PJ Hanson CE eds
Climate Change 2007 Impacts Adaptation and Vulnerability Contribution of
51
Working Group II to the Fourth Assessment Report of the Intergovernmental
Panel on Climate Change Cambridge UK Cambridge University Press p 23-78
Ponzio KJ Miller SJ and Lee MA 2004 Long-term effects of prescribed fire on
Cladium jamaicense Crantz and Typha domingensis Pers densities Wetlands
Ecology and Management v 12 p 123-133
Sanders CJ Smoak JM Naidu AS and Patchineelamt SR 2008 Recent sediment
accumulation in a mangrove forest and its relevance to local sea-level rise (Ilha
Grande Brazil) Journal of Coastal Research v 24 p 533-536
Schmalzer PA Hinkle CR and Mailander JL 1991 Changes in community
composition and biomass in Juncus roemerianus Scheele and Spartina bakeri
Merr marshes one year after a fire Wetlands v 11 p 67-86
Silliman BR van de Koppel Johan Bertness MD Stanton LE and Mendelssohn
IA 2005 Drought snails and large-scale die-off of southern US salt marshes
Science v 310 p 1803-1806
Slocum MG Roberts Joshua and Mendelssohn IA 2009 Artist canvas as a new
standard for the cotton-strip assay Journal of Plant Nutrition and Soil Science v
172 p 71-74
Smith SM Newman Sue Garrett PB and Leeds JA 2001 Differential effects of
surface and peat fire on soil constituents in a degraded wetland of the Northern
Florida Everglades Journal of Environmental Quality v 30 p 1998-2005
Turner RE Milan CS and Swenson EM 2006 Recent volumetric changes in salt
marsh soils Estuarine Coastal and Shelf Science v 69 p 352-359
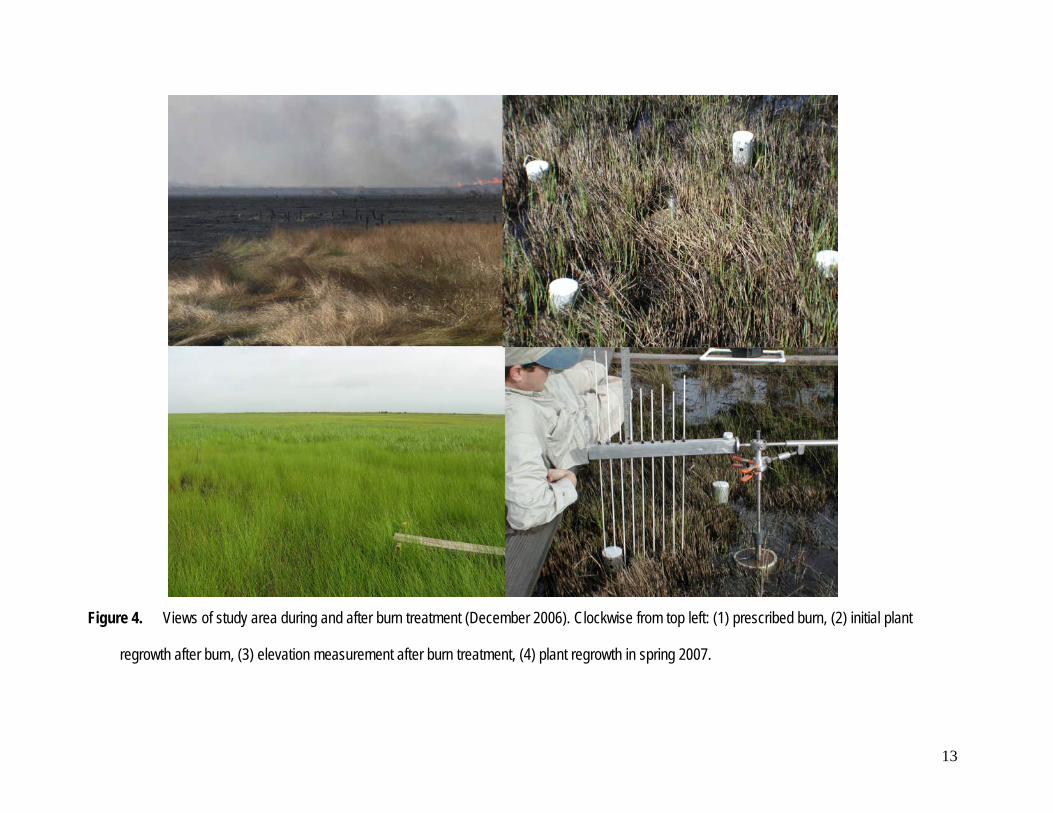