Effects of Pitch and Timing Expectancy on Musical...
23
Effects of Pitch and Timing Expectancy on Musical Emotion Sarah A. Sauvé and Aminah Sayed Queen Mary University of London Roger T. Dean Western Sydney University Marcus T. Pearce Queen Mary University of London Pitch and timing information work hand in hand to create a coherent piece of music, but what happens when this information goes against the norm? Relationships between musical expectancy and emotional responses were investigated in a study conducted with 40 participants: 20 musicians and 20 nonmusi- cians. Participants took part in one of two behavioral paradigms measuring continuous expectancy or emotional responses (arousal and valence) while listening to folk melodies that exhibited either high or low pitch predictability and high- or low- onset predictability. The causal influence of pitch predictability was investigated in an additional condition in which pitch was artificially manipulated and a comparison was conducted between original and manipulated forms; the dynamic correlative influence of pitch and timing information and its perception on emotional change during listening was evaluated using cross-sectional time series analysis. The results indicate that pitch and onset predictability are consistent predictors of perceived expectancy and emotional response, with onset carrying more weight than pitch. In addition, musicians and nonmusicians do not differ in their responses possibly due to shared cultural background and knowledge. The results demonstrate in a controlled lab-based setting a precise, quan- titative relationship between the predictability of musical structure, expectation, and emotional response. Keywords: emotion, expectation, time series, information content, IDyOM Music is capable of inducing powerful physiological and psy- chological emotional states (Bittman et al., 2013; Castillo-Pérez, Gómez-Pérez, Velasco, Pérez-Campos, & Mayoral, 2010; Habibi & Damasio, 2014). For example, the practice of music therapy stemmed from the observation that music can have a positive emotional effect (Khalfa, Bella, Roy, Peretz, & Lupien, 2003; Pelletier, 2004). However, many studies of emotion induction by music have simply investigated which emotions are induced rather than the psychological mechanisms that account for why these emotions occur (Juslin & Västfjäll, 2008). The present research aims to address this omission by examining a theorized psycho- logical mechanism of musical emotion induction in isolation. Although factors such as personality, age, and gender have an influence (Rentfrow & Gosling, 2003), we focus here on the properties of music that are involved in emotion induction. Although there is general consensus that music can elicit emo- tional responses (see Juslin & Sloboda, 2011 for an extensive review), why and how it does so is less clear. Juslin and colleagues (Juslin, Liljeström, Västfjäll, & Lundqvist, 2011) described eight potential psychological mechanisms that might explain how emo- tions are induced through music: (a) brain stem reflexes, (b) evaluative conditioning, (c) emotional contagion, (d) visual imag- ery, (e) episodic memory, (f) musical expectancy, (g) rhythmic entrainment, and (h) cognitive appraisal. Hearing a sudden loud or dissonant event causes a change in arousal (brain stem reflex), whereas a piece repetitively paired with a positive, or negative, This article was published Online First May 17, 2018. Sarah A. Sauvé and Aminah Sayed, School of Electronic Engineering and Computer Science, Queen Mary University of London; Roger T. Dean, The MARCS Institute, Western Sydney University; Marcus T. Pearce, School of Electronic Engineering and Computer Science, Queen Mary University of London. SARAH A. SAUVÉ Originally a pianist, Sarah is now a PhD candidate in the Electronic Engineering and Computer Science department at Queen Mary University of London, studying expectancy and stream segregation, supported by a college studentship. AMINAH SAYED completed her MSc in Computer Science at Queen Mary University of London, specializing in multimedia. ROGER T. DEAN is a composer/improviser and a research professor at the MARCS Institute for Brain, Behaviour and Development, Western Sydney University. His work focuses on music cognition and music com- putation, both analytic and generative. MARCUS T. PEARCE is Senior Lecturer at Queen Mary University of London, director of the Music Cognition and EEG Labs, and codirector of the Centre for Mind in Society. His research interests cover computational, psychological, and neuroscientific aspects of music cognition, with a particular focus on dynamic, predictive processing of melodic, rhythmic, and harmonic structure, and its effect on emotional and aesthetic experi- ence. He is the author of the IDyOM model of auditory expectation based on statistical learning and probabilistic prediction. An earlier analysis of this data was presented at the International Conference for Music Perception and Cognition (ICMPC14) in San Fran- cisco in July 2016 in poster format. A copy of the initially submitted manuscript can also be found on ArXiv. Correspondence concerning this article should be addressed to Sarah A. Sauvé, School of Electronic Engineering and Computer Science, Queen Mary University of London, Mile End Road, London E1 4NS, United Kingdom. E-mail: [email protected] This document is copyrighted by the American Psychological Association or one of its allied publishers. This article is intended solely for the personal use of the individual user and is not to be disseminated broadly. Psychomusicology: Music, Mind, and Brain © 2018 American Psychological Association 2018, Vol. 28, No. 1, 17–39 0275-3987/18/$12.00 http://dx.doi.org/10.1037/pmu0000203 17
Transcript of Effects of Pitch and Timing Expectancy on Musical...

Effects of Pitch and Timing Expectancy on Musical Emotion
Sarah A. Sauvé and Aminah SayedQueen Mary University of London
Roger T. DeanWestern Sydney University
Marcus T. PearceQueen Mary University of London
Pitch and timing information work hand in hand to create a coherent piece of music, but what happenswhen this information goes against the norm? Relationships between musical expectancy and emotionalresponses were investigated in a study conducted with 40 participants: 20 musicians and 20 nonmusi-cians. Participants took part in one of two behavioral paradigms measuring continuous expectancy oremotional responses (arousal and valence) while listening to folk melodies that exhibited either high orlow pitch predictability and high- or low- onset predictability. The causal influence of pitch predictabilitywas investigated in an additional condition in which pitch was artificially manipulated and a comparisonwas conducted between original and manipulated forms; the dynamic correlative influence of pitch andtiming information and its perception on emotional change during listening was evaluated usingcross-sectional time series analysis. The results indicate that pitch and onset predictability are consistentpredictors of perceived expectancy and emotional response, with onset carrying more weight than pitch.In addition, musicians and nonmusicians do not differ in their responses possibly due to shared culturalbackground and knowledge. The results demonstrate in a controlled lab-based setting a precise, quan-titative relationship between the predictability of musical structure, expectation, and emotional response.
Keywords: emotion, expectation, time series, information content, IDyOM
Music is capable of inducing powerful physiological and psy-chological emotional states (Bittman et al., 2013; Castillo-Pérez,Gómez-Pérez, Velasco, Pérez-Campos, & Mayoral, 2010; Habibi& Damasio, 2014). For example, the practice of music therapystemmed from the observation that music can have a positiveemotional effect (Khalfa, Bella, Roy, Peretz, & Lupien, 2003;Pelletier, 2004). However, many studies of emotion induction bymusic have simply investigated which emotions are induced ratherthan the psychological mechanisms that account for why theseemotions occur (Juslin & Västfjäll, 2008). The present researchaims to address this omission by examining a theorized psycho-logical mechanism of musical emotion induction in isolation.Although factors such as personality, age, and gender have an
influence (Rentfrow & Gosling, 2003), we focus here on theproperties of music that are involved in emotion induction.
Although there is general consensus that music can elicit emo-tional responses (see Juslin & Sloboda, 2011 for an extensivereview), why and how it does so is less clear. Juslin and colleagues(Juslin, Liljeström, Västfjäll, & Lundqvist, 2011) described eightpotential psychological mechanisms that might explain how emo-tions are induced through music: (a) brain stem reflexes, (b)evaluative conditioning, (c) emotional contagion, (d) visual imag-ery, (e) episodic memory, (f) musical expectancy, (g) rhythmicentrainment, and (h) cognitive appraisal. Hearing a sudden loud ordissonant event causes a change in arousal (brain stem reflex),whereas a piece repetitively paired with a positive, or negative,
This article was published Online First May 17, 2018.Sarah A. Sauvé and Aminah Sayed, School of Electronic Engineering
and Computer Science, Queen Mary University of London; Roger T. Dean,The MARCS Institute, Western Sydney University; Marcus T. Pearce,School of Electronic Engineering and Computer Science, Queen MaryUniversity of London.
SARAH A. SAUVÉ Originally a pianist, Sarah is now a PhD candidatein the Electronic Engineering and Computer Science department at QueenMary University of London, studying expectancy and stream segregation,supported by a college studentship.
AMINAH SAYED completed her MSc in Computer Science at QueenMary University of London, specializing in multimedia.
ROGER T. DEAN is a composer/improviser and a research professor atthe MARCS Institute for Brain, Behaviour and Development, WesternSydney University. His work focuses on music cognition and music com-putation, both analytic and generative.
MARCUS T. PEARCE is Senior Lecturer at Queen Mary University ofLondon, director of the Music Cognition and EEG Labs, and codirector ofthe Centre for Mind in Society. His research interests cover computational,psychological, and neuroscientific aspects of music cognition, with aparticular focus on dynamic, predictive processing of melodic, rhythmic,and harmonic structure, and its effect on emotional and aesthetic experi-ence. He is the author of the IDyOM model of auditory expectation basedon statistical learning and probabilistic prediction.
An earlier analysis of this data was presented at the InternationalConference for Music Perception and Cognition (ICMPC14) in San Fran-cisco in July 2016 in poster format. A copy of the initially submittedmanuscript can also be found on ArXiv.
Correspondence concerning this article should be addressed to Sarah A.Sauvé, School of Electronic Engineering and Computer Science, QueenMary University of London, Mile End Road, London E1 4NS, UnitedKingdom. E-mail: [email protected]
Thi
sdo
cum
ent
isco
pyri
ghte
dby
the
Am
eric
anPs
ycho
logi
cal
Ass
ocia
tion
oron
eof
itsal
lied
publ
ishe
rs.
Thi
sar
ticle
isin
tend
edso
lely
for
the
pers
onal
use
ofth
ein
divi
dual
user
and
isno
tto
bedi
ssem
inat
edbr
oadl
y.
Psychomusicology: Music, Mind, and Brain © 2018 American Psychological Association2018, Vol. 28, No. 1, 17–39 0275-3987/18/$12.00 http://dx.doi.org/10.1037/pmu0000203
17

situation will create a positive, or negative, emotional reaction(evaluative conditioning). Emotional contagion is the induction ofemotion through the mimicry of behavioral or vocal expression ofemotion and is reflected in musical structure; for example, shorterdurations and ascending pitch contours tend to reflect happiness,whereas longer durations and descending pitch contours commu-nicate sadness. Visual imagery refers to the mental imageryevoked by the music, which can have positive or negative affect.The pairing between a sound and a past event can trigger theemotion related to that event when the sound is subsequently heard(episodic memory). Rhythmic entrainment refers to the inductionof emotion through the proprioceptive feedback of internal bodyentrainment (i.e., heart rate) to the music and, finally, cognitiveappraisal refers to the evaluation of music in the context of goalsor plans of the listener. The present study focuses on musicalexpectancy while controlling for all other potential mechanismsproposed in the abovementioned text.
Meyer (1956) argued that emotion is generated through musicallistening because listeners actively generate predictions reflectingwhat they expect to hear next (Huron, 2006). Unexpected events aresurprising and are associated with an increase in tension, whereasexpected events are associated with the resolution of tension (Gingraset al., 2016). According to this account, surprising events generallyevoke high arousal and low valence (Egermann, Pearce, Wiggins, &McAdams, 2013; Koelsch, Fritz, & Schlaug, 2008; Russell, 2003;Steinbeis, Koelsch, & Sloboda, 2006). Although the arousal responseto increased tension is fairly consistent, listeners familiar with a pieceof music can come to appreciate an event that has low expectancythrough an appraisal mechanism, resulting in a high valence response(Huron, 2006). This apparent contradiction highlights the importanceof isolating the psychological mechanisms behind musical emotionalinduction.
There are also different influences on musical expectation (Huron,2006). Schematic influences reflect general stylistic patterns acquiredthrough extensive musical listening to many pieces of music, whereasveridical influences reflect specific knowledge of a familiar piece ofmusic. Dynamic influences reflect dynamic learning of structurewithin an unfamiliar piece of music (e.g., recognizing a repeatedmotif). Listening to new, unfamiliar music in a familiar style engagesschematic and dynamic mechanisms, the former reflecting long-termlearning over years of musical exposure and the latter, short-termlearning within an individual piece of music. Both these long- andshort-term mechanisms can be simulated as a process of statisticallearning and probabilistic generation of expectations (Pearce, 2005).Furthermore, these may be different for musicians and nonmusiciansdue to extensive exposure and training in a particular style (Juslin &Västfjäll, 2008).
We now consider the properties of musical events for whichexpectations are generated. Prominent among such properties arethe pitch and timing of notes, and we consider each in turn. Musictheorists have described musical styles as structurally organized,reflecting well-formalized rules that constitute a kind of grammat-ical syntax (Lerdahl & Jackendoff, 1983). In the tradition ofWestern tonal music, compositions usually follow these rules byadhering to a tonal structure, and enculturated listeners are able toidentify when a piece of music infringes tonal rules based on theirexposure in everyday music listening (Carlsen, 1981; Krumhansl,Louhivuori, Toiviainen, Järvinen, & Eerola, 1999; Trainor &Trehub, 1992). Two kinds of models have been developed to
explain listeners’ pitch expectations: first, models that includestatic rules and, second, models that focus on learning. An influ-ential example of a rule-based model is the implication-realizationmodel, developed by Eugene Narmour (1991), which includesrules defining the expectedness of the final note in a sequence ofthree notes, in which the first pair of notes forms the implicativeinterval and the second pair of notes, the realized interval. The sizeand direction of the implicative interval set up expectations ofvarying strengths for the realized interval. Although the originalimplication-realization model contained five bottom-up rules ofmelodic implication, Schellenberg (1996) reduced the fivebottom-up rules of the implication-realization model to two: pitchproximity and pitch reversal. For example, according to the rulesof pitch reversal, a small interval implies another small interval inthe same direction, whereas a large interval implies a subsequentsmall interval in the opposite direction. Such patterns reflect actualpatterns in existing Western music (Huron, 2006), suggesting thepossibility that listeners might learn these patterns through expe-rience.
Statistical learning is a powerful tool for explaining the acqui-sition of pitch expectations in music, in which common sequentialpatterns are learned through incidental exposure (Huron, 2006;Pearce, 2005; Saffran, Johnson, Aslin, & Newport, 1999), makingthem more predictable to the exposed listener. For example, aperfect cadence is found at the end of the vast majority of Westernclassical music, in which movement from dominant to tonic is thestrongest form of closure possible in this style. Through repeatedexposure to this pattern, a dominant penultimate chord stronglyimplies a tonic chord for an enculturated listener (Huron, 2006).Information Dynamics of Music (IDyOM; Pearce, 2005) is acomputational model of auditory expectation that harnesses thepower of statistical learning. It learns the frequencies of variable-order musical patterns from a large corpus of music (via thelong-term model) and from the current piece of music beingprocessed (via the short-term model or short-term memory) in anunsupervised manner and generates probabilistic predictions aboutthe properties of the next note in a melody, given the precedingmelodic context. IDyOM is a multiple-viewpoint model capable oflearning patterns from pitch- and time-derived note properties(source viewpoints) to predict relevant note properties (targetviewpoints). These viewpoints can be use-defined or selectedthrough optimization. The information content (negative log prob-ability; IC) of an event, given the model, reflects the unexpected-ness of the event in context. Low IC corresponds to high expect-edness, whereas high IC corresponds to low expectedness.
Temporal regularities are also learned through exposure (Ci-relli, Spinelli, Nozaradan, & Trainor, 2016; Hannon, Soley, &Ullal, 2012; Hannon & Trehub, 2005a, 2005b). Western musicis dominated by beat patterns in divisions of two, and to a lesserextent, divisions of three, and compositional devices much assyncopation and hemiola (three beats in the time of two) areused to manipulate the listener’s temporal expectations. Thedynamic attending theory (Jones & Boltz, 1989) posits thatentrainment to a beat results in attentional focus being directedat time intervals in which a beat is expected to occur, such thatlonger entrainment times result in stronger predictions and morefocused attention. This was supported using a pitch discrimi-nation task in which participants performed better on pitchdiscrimination when target pitches fell on expected time points
Thi
sdo
cum
ent
isco
pyri
ghte
dby
the
Am
eric
anPs
ycho
logi
cal
Ass
ocia
tion
oron
eof
itsal
lied
publ
ishe
rs.
Thi
sar
ticle
isin
tend
edso
lely
for
the
pers
onal
use
ofth
ein
divi
dual
user
and
isno
tto
bedi
ssem
inat
edbr
oadl
y.
18 SAUVÉ, SAYED, DEAN, AND PEARCE

as a result of entrainment to a series of isochronous distractortones (Jones, Moynihan, MacKenzie, & Puente, 2002; thoughsee Bauer, Jaeger, Thorne, Bendixen, & Debener, 2015 forconflicting evidence). We propose that temporal rules can alsobe explained by statistical learning as implemented in IDyOM(Pearce, 2005). In the same way as pitch, and various othermusical surface structures, onset and interonset interval (IOI)can be predicted by IDyOM, as it learns from a given corpusand a given piece. This is equivalent to estimating a distributionover possible future onset times, given the preceding sequencesof events. Because pitch and temporal structures generate dis-tinct expectancies (Prince, Thompson, & Schmuckler, 2009),we explore the influence of each as a potential emotionalinducer using both correlational and causal methods (whileallowing for the possibility of interactions between pitch andtiming).
Musical expectancy as a mechanism for the induction ofemotion in listeners has been studied in an ecological setting:Egermann et al. (2013) asked 50 participants to attend a liveconcert during which six flute pieces were played. These piecesspanned various musical styles and levels of pitch expectancy.Three kinds of measurement were made: subjective responses(i.e., the arousal levels or the ratings of musical expectancy thatchanged continuously throughout the piece), expressive re-sponses (using video and facial electromyography), and periph-eral arousal measured by skin conductance, heart rate, respira-tion, and blood volume pulse. IDyOM (Pearce, 2005) was usedto analyze pitch patterns of the music and predict where listen-ers would experience low expectancy. Results suggested thatexpectancy had a modest influence on emotional responses, inwhich high IC segments led to higher arousal and lower valenceratings, as well as increases in skin conductance and decreasesin heart rate, as compared with low IC segments, whereas noevent-related changes were found in respiration rate or facialelectromyography measures; however, this study was con-ducted in an ecologically valid, thus noncontrolled environmentwhere participants could have focused on something other thanthe music. For example, visual aspects of performance arehighly important to emotional engagement in live music set-tings (Thompson, Graham, & Russo, 2005; Vines, Krumhansl,Wanderley, & Levitin, 2006). Furthermore, other potentialemotion-inducing mechanisms, as proposed by Juslin and Väst-fjäll (2008), were not explicitly controlled for, and effects oftemporal expectancy on emotional responses were not consid-ered.
The current study is designed to investigate pitch and tem-poral musical expectancy in a restricted environment that con-trolled for many other potential emotional mechanisms (Juslin& Västfjäll, 2008). Brain stem reflexes are controlled for bymaintaining equal tempo, intensity, and timbre across all mu-sical excerpts. Evaluative conditioning and episodic memoryare controlled for by presenting unfamiliar musical excerpts, sothat expectation ratings and emotional reactions are not con-founded by previous experience with the music. Potential ef-fects of emotional contagion are analyzed in the analysis byincluding pitch and IOI as predictors of subjective ratings andpitch and IOI predictability (i.e., higher mean pitch and shorterIOI could result in higher arousal and valence ratings regardlessof expectancy). Irrelevant visual imagery cannot be categori-
cally avoided but the rating tasks are expected to require enoughcognitive load to render it unlikely. Furthermore, to the extentthat visual imagery is variable between individuals, averagingacross participants should remove its influence. The absence ofa strong, driving beat and the relatively short duration of themusical excerpts makes deep, emotion-inducing rhythmic en-trainment highly unlikely. Finally, all participants are listeningto these musical excerpts in the context of an experiment, withany other goal or motive being highly unlikely, thus minimizingthe relevance of the cognitive appraisal mechanism.
This research aims to address three questions. First, does thepredictability of pitch and timing (as simulated by IDyOM)have an effect on listeners’ expectations and emotional state,and canwe causally influence this effect with explicit manipulation ofthe stimuli? We hypothesize that the degree of musical expec-tancy for pitch (based on pitch interval) and temporal (based onIOI) structures, as predicted objectively by the informationcontent provided by IDyOM, will have an effect on emotion asmeasured by the arousal-valence model (Russell, 2003). Ac-cording to Russell (2003), unexpected events will invoke neg-ative valence and cause an increase in arousal, and expectedevents will invoke positive valence and decreased arousal. Wedo not expect appraisal to affect this initial reaction, as we arecollecting ratings in real time. We also hypothesize that whenboth pitch and timing are either expected or unexpected, theemotional response will be more extreme than in conditions ofmixed expectedness. Furthermore, direct manipulation of pitchexpectancy while keeping temporal expectancy and all othermusical features constant is expected to produce the predictedchanges in ratings (i.e., transforming unexpected pitches toexpected pitches will decrease unexpectedness and arousal, andincrease valence ratings).
Second, how does pitch and timing predictability combine toinfluence expectation and emotion? Though the combination ofpitch and timing in music perception has been a researchinterest for decades (Boltz, 1999; Duane, 2013; Jones, Boltz, &Kidd, 1982; Palmer & Krumhansl, 1987a; Prince et al., 2009),no clear conclusions can be drawn, as findings regarding thisquestion have low agreement and seem highly dependent on thechoice of stimuli, participants, and paradigm. For example,although Prince et al. (2009) suggest that pitch is more salient,results from Duane’s (2013) corpus analysis suggest that timingis the most reliable predictor of streaming. Although the presentstudy uses monophonic melodies, it could be argued that ifsalience is linked to complexity (Prince et al., 2009), for mel-odies in which pitch or timing are highly predictable (lowcomplexity), the predictable feature will be less salient than itsunpredictable counterpart because it requires less “processingpower” and therefore less attention. For melodies in which pitchand timing are relatively equally predictable or unpredictable,their relative importance currently remains unknown.
Finally, is there a difference in the effect of pitch and timingpredictability on expectation and emotional responses betweenmusicians and nonmusicians? The effect of musical training willbe evaluated by comparing the responses of musicians and non-musicians, with the expectation that musicians will have higherexpectation ratings and more extreme emotional responses to pitchand timing violations due to training (Strait, Kraus, Skoe, &
Thi
sdo
cum
ent
isco
pyri
ghte
dby
the
Am
eric
anPs
ycho
logi
cal
Ass
ocia
tion
oron
eof
itsal
lied
publ
ishe
rs.
Thi
sar
ticle
isin
tend
edso
lely
for
the
pers
onal
use
ofth
ein
divi
dual
user
and
isno
tto
bedi
ssem
inat
edbr
oadl
y.
19EXPECTANCY AND MUSICAL EMOTION

Ashley, 2009), in which Western musical patterns are more famil-iar, resulting in violations of these patterns eliciting stronger re-sponses.
Method
Participants
Forty participants (22 female and 18 male; age range 14–54years) were recruited from universities, secondary school, andcolleges for this experiment: 20 were musicians (Mean 3.6 years ofmusical training; range 1–12 years) and 20 were nonmusicians (0years of musical training). Ethical approval was obtained from theQueen Mary Research Ethics Committee, QMREC1078.
Stimuli
The stimuli consisted of 32 pieces of music in Musical InstrumentDigital Interface (MIDI) format rendered to audio using a pianotimbre: 16 original melodies and 16 artificially manipulated melodies.Original melodies were divided into the following four categories ofpredictability: predictable pitch and predictable onset (PP), predict-able pitch and unpredictable onset (PU), unpredictable pitch andpredictable onset (UP) and unpredictable pitch and unpredictableonset (UU). The artificial melodies were created by changing the pitchpredictability of each melody, so that PP became aUP, UU becameaPU, PU became aUU, and UP became aPP, where a denotes artifi-cial. All melodies were presented at the same intensity, which washeld constant for the duration of all melodies.
Original melodies. The 16 original melodies were selectedfrom a group of nine data sets, totaling 1,834 melodies (Table 1;
Figure 1), all from Western musical cultures to avoid potential culturalinfluences on expectancy ratings (Hannon & Trehub, 2005b; Palmer& Krumhansl, 1990). All nine data sets were analyzed by IDyOM fortarget viewpoints pitch and onset with source viewpoints pitch inter-val and scale degree (linked), and IOI, respectively. Both short-termand long-term models were engaged; the long-term l model wastrained on three data sets of Western music, described in Table 2.There was no resampling within the test data sets.
The 1,834 melodies were divided into four categories based onhigh or low pitch or onset IC. Melodies were considered predict-able if they had a lower IC than the mean IC of all samples andunpredictable if the IC was greater than the mean IC of all samples.Four melodies from each category were selected as the most orleast predictable by finding maximum and minimum IC values asappropriate for the category; these are the original 16 melodies.Melodies in the PP, PU, UP, and UU categories had mean pitch ICvalues ranging from 1.37 to 1.85, 2.22 to 2.43, 2.83 to 5.24, and2.61 to 2.78, respectively; mean onset IC values ranging from .80to .92, 2.49 to 4.34, 1.13 to 1.32 and 4.20 to 4.39, respectively;mean MIDI pitch values (i.e., 69 � A � 440 Hz) ranging from 66.85to 70.17, 66.05 to 70.23, 68.67 to 72.76, and 64.40 to 71.63, respec-tively; and mean IOI values ranging from 12.71 to 21.28, 21.41 to
Table 1Details of the Data Sets Used in Stimulus Selection
Data set DescriptionNumber ofmelodies
Mean events/composition
2 Chorale soprano melodiesharmonized by J.S. Bach
100 46.93
3 Alsatian folk songs fromthe Essen Folk SongCollection
91 49.40
4 Yugoslavian folk songsfrom the Essen FolkSong Collection
119 22.61
5 Swiss folk songs from theEssen Folk SongCollection
93 49.31
6 Austrian folk songs fromthe Essen Folk SongCollection
104 51.01
10 German folk songs fromthe Essen Folk SongCollection: ballad
687 40.24
15 German folk songs fromthe Essen Folk SongCollection: kinder
213 39.40
18 British folk song fragmentsused in the experimentsof Schellenberg (1996)
8 18.25
23 Irish folk songs encodedby Daiman Sagrillo
62 78.50
Figure 1. Excerpts from one melody from each of the four different typesof experimental stimuli. Patterns or notes of interest are marked with abracket or an arrow, respectively. Melody PP is predictable in both pitchand time; an exact repetition in both dimensions can be seen, marked by asquare bracket. Melody PU is predictable in pitch but unpredictable intime; long notes in general and the rhythmic switch in the last measurespecifically contribute to low predictability. Melody UP is unpredictable inpitch but predictable in time, with large leaps (marked by arrow) andregular note durations. Melody UU is unpredictable in both pitch and time;a leap is surprising after such repetitive unison, and the bracketed rhythmicexcerpt is a hemiola (here 3 notes in the time of 2).
Table 2Details of the Training Set Used to Train IDyOM
Data set DescriptionNumber ofmelodies
Mean events/composition
0 Songs and ballads fromNova Scotia, Canada
152 56.26
1 Chorale melodiesharmonized by J.S.Bach
185 49.88
7 German folk songs 566 58.46
Thi
sdo
cum
ent
isco
pyri
ghte
dby
the
Am
eric
anPs
ycho
logi
cal
Ass
ocia
tion
oron
eof
itsal
lied
publ
ishe
rs.
Thi
sar
ticle
isin
tend
edso
lely
for
the
pers
onal
use
ofth
ein
divi
dual
user
and
isno
tto
bedi
ssem
inat
edbr
oadl
y.
20 SAUVÉ, SAYED, DEAN, AND PEARCE

69.81, 13.84 to 21.69, and 21.53 to 64.00, respectively, where aquarter note equals 24, an eighth note, 12, a half note, 48, and so forthNotice that categories with unpredictable onset have higher averageIOI values; this potential influence is discussed in the text below(Table A1 in Appendix A).
Artificial melodies. The 16 artificial melodies were createdas follows. For each original melody, the notes with the highest(for PP and PU) or lowest (for UP and UU) IC were selected forreplacement. The notes were replaced with another note fromthe same melody that shares the same preceding note as theoriginal note in that melody. If several instances of such a notepair existed, the associated IC values were averaged. If severalsuch replacement notes existed, the one with the lowest (for UPand UU) or highest (for PP and PU) IC was selected to replacethe original note. Where no such replacement existed, the key ofthe melody was estimated using the Krumhansl–Schmucklerkey-finding algorithm (Krumhansl, 2001) using key profilesupdated by Temperley (1999), and the replacement was selectedas the scale degree with the highest (for UP and UU) or lowest(for PP and PU) tonal stability. All notes labeled as havingextremely high or low IC were replaced by a pitch with a lessextreme IC. An example of a melody from each category can beseen in Figure 1.
Melodies in the aPP, aPU, aUP, and aUU categories had meanpitch IC values ranging from 3.49 to 5.50, 4.20 to 4.56, 4.13 to6.59, and 2.79 to 3.80, respectively, and mean MIDI pitch valuesranging from 64.88 to 69.80, 67.05 to 73.18, 64.05 to 67.76, and66.78 to 72.89, respectively. Mean onset IC and mean raw IOIvalues were unchanged from the corresponding original stimulus-predictability category (e.g., aPP has the same mean IOI IC andIOI values as UP). Figure 2 illustrates the mean informationcontent of all 32 melodies.
Procedure
Participants were semirandomly allocated to one of four(between-subjects) conditions: They were either a musician ora nonmusician and, within these groups, randomly assigned torate either expectancy or emotion (arousal and valence). Theexperiment was run on a software constructed in-house, and ona Samsung Galaxy Ace S5830 (3.5 in. in diameter; runningAndroid 2.3.6). Participants listened through standard Appleheadphones and were tested individually in a closed room. Theinformation sheet was presented and informed consent gath-ered; detailed step-by-step instructions were then presented tothe participants. Regardless of condition, there was a mandatorypractice session: Participants heard two melodies and answeredthe questions appropriate to the condition they were assigned to(either expectancy rating or arousal and valence rating). Partic-ipants could also adjust the volume to a comfortable settingduring the practice session. Once the practice session wascompleted, the experimental app was loaded. Participants en-tered a unique identity (ID) number provided by the experi-menter and responded to a short musical background question-naire. Participants then heard the 32 musical excerpts (meanduration was 18.34 s) presented in a random order withoutpause or repeat and performed the appropriate ratings bycontinuously moving a finger on the screen. Those in theexpectancy rating condition reported expectancy on a 7-point
Figure 2. Mean (a) pitch information content and (b) onset IC of each melodyplotted by stimulus predictability and modification, in which original melodies aresymbolized by empty symbols and artificial melodies by full symbols.
Thi
sdo
cum
ent
isco
pyri
ghte
dby
the
Am
eric
anPs
ycho
logi
cal
Ass
ocia
tion
oron
eof
itsal
lied
publ
ishe
rs.
Thi
sar
ticle
isin
tend
edso
lely
for
the
pers
onal
use
ofth
ein
divi
dual
user
and
isno
tto
bedi
ssem
inat
edbr
oadl
y.
21EXPECTANCY AND MUSICAL EMOTION

integer Likert scale, where 1 was very expected and 7 was veryunexpected. Those in the arousal/valence condition rated in-duced arousal (vertical) and valence (horizontal) on a two-dimensional arousal/valence illustration (Russell, 2003). Re-sponses, in integers, were collected at a 5 Hz sample rate (200ms; Khalfa, Isabelle, Jean-Pierre, & Manon, 2002). The ratingsystems used were Expectancy: 1–7 (expected–unexpected);Arousal: 0–230 (calm–stimulating); Valence: 0–230 (unpleasant–pleasant).
Data Collection
Due to the large number of variables included in this analysis, wedescribe them each here for clarity. First, we describe the dependentvariables: expectancy, arousal, and valence ratings. Ratings, on scalesdescribed previously, were collected at a rate of 5 Hz, or 200 ms,making it the variable with the smallest temporal resolution. Thus, allother variables were interpolated to match this resolution.
We then begin describing the independent variables with thosethat we are not explicitly manipulating: time, pitch, IOI, andmusicianship. Time is measured in steps of 200 ms, the samplingrate of the data acquisition software. For each point in time, foreach melody, and each participant, a data point, a value for pitch,IOI, musical training, stimulus predictability, stimulus modifica-tion, pitch IC and onset IC is assigned, along with Melody ID andParticipant ID. Because pitch (interpreted here in MIDI numbers)does not change every 200 ms and IOI (in ms) is longer than 200ms in these folk songs (or in Western music in general), theirvalues were interpolated to match the participant ratings’ samplingrate of 5 Hz, so that each point in time has a pitch and IOI value,and values were simply duplicated. Finally, the musical trainingvariable had a value of 0 or 1, depending on whether the partici-pant had no musical training or any musical training, respectively.
Next, we describe manipulated variables: stimulus predictabil-ity, stimulus modification, pitch IC, and onset IC. For each datapoint, the variable stimulus predictability was given a value of 1 ifit belonged to the category PP, 2 if it belonged to the category PU,3 for UP, and 4 for UU, regardless of whether these are original orartificial melodies. Similarly, the variable stimulus modificationwas given a value of 0 if the melody was original or 1 if themelody was artificial. Finally, pitch IC and onset IC, as calculatedby IDyOM, were interpolated in the same way as pitch and IOI tomatch the participant ratings’ 5 Hz sampling rate. These are theonly variables whose values are not integers.
Though the duplication of data points due to interpolation istaken into account by modeling discontinuous time in the case ofmelody-level analysis and autoregression in the case of cross-sectional time series analysis (CSTSA), a data set without inter-polation was also created to corroborate any findings using inter-polated data, in which ratings were averaged according to the rateof change of each melody’s events. In other words, each melodyevent was assigned one rating value, with 1 associated MIDI pitch,IOI, pitch IC, and onset IC.
Statistical Analysis
For each type of rating (expectancy, arousal, and valence) twokinds of analysis are performed: first, a melody-level analysis, inwhich the time series for each melody are averaged across partic-
ipants separately for musicians and nonmusicians, leading to ap-proximately 9,600 data points, and temporal position is a discon-tinuous factor and, second, a cross-sectional time-series analysis ofthe continuous ratings given by each participant throughout eachmelody, leading to approximately 96,000 data points. In themelody-level analysis, for each melody, a mean expectancy ratingwas calculated at every time point across the musician and non-musician groups (10 responses per group). Linear multiple regres-sion modeling was used to evaluate the effect of musical training(musician or nonmusician), stimulus modification (original or ar-tificial), and stimulus predictability (predictable/unpredictablepitch/onset) by in turn comparing a model containing each singlepredictor with a model containing only an intercept using a loglikelihood test. Two additional predictors, pitch predictability andonset predictability, were derived from stimulus predictability toexamine the interaction between these two subcomponents: Mel-odies were coded as having either predictable or unpredictablepitch or onset. Although musical training, stimulus modification,pitch predictability, and onset predictability were simple binaryfactors, stimulus predictability contained four levels labeled PP,PU, UP, and UU. Apart from that, between pitch predictability andonset predictability, interactions were not considered due to thedifficulty of interpretation in such a complex model. Followingthese log likelihood comparisons, two global linear multiple re-gression models, containing all the above predictors of interest(one containing stimulus predictability and the other containingpitch predictability and onset predictability) plus time, pitch, andIOI to parse out any potential effects of time and to analyzepotential effects of musical contagion, were evaluated to confirmresults.
For the analysis of continuous ratings throughout each melody,we used CSTSA, similar to Dean, Bailes, and Dunsmuir (2014a),to evaluate the predictive impacts of pitch IC, onset IC, stimuluspredictability (predictable/unpredictable), stimulus modification(none/artificial), musical training, and individual differences mod-eled by random effects on participants’ ratings of expectedness,arousal, and valence. CSTSA takes account of the autoregressivecharacteristic of music and the continuous responses of the partic-ipants. Pitch IC and onset IC predictors were both scaled to valuesbetween 0 and 1, to allow for direct comparison of model coeffi-cients in analysis. A predictor of combined pitch and onset IC wasalso tested, replacing the individual pitch IC and onset IC predic-tors. In practice, CSTSA is a mixed-effects multiple linear regres-sion model, here fitted with maximum design-driven random ef-fects (Barr, Levy, Scheepers, & Tily, 2013) and fixed effects toaccount for autocorrelation (lags of endogenous variables, i.e.,ratings, denoted by P), and exogenous influence (i.e., informationcontent and its lags, denoted by L). Here, each lag windowrepresents 200 ms, so that a predictor named L1ratings denotes theparticipants’ ratings shifted 200 ms later, a predictor namedL2pitchIC denotes Pitch IC shifted by 400 ms, and so on. Onlyoptimal models are presented below, selected based on BayesianInformation Criteria (BIC), confidence intervals on fixed-effectpredictors, log likelihood ratio tests between pairs of models,correlation tests between models and the data, and the proportionof data squares fit. All analyses were performed using RStudio1.0.136, running R 3.1.2.
Thi
sdo
cum
ent
isco
pyri
ghte
dby
the
Am
eric
anPs
ycho
logi
cal
Ass
ocia
tion
oron
eof
itsal
lied
publ
ishe
rs.
Thi
sar
ticle
isin
tend
edso
lely
for
the
pers
onal
use
ofth
ein
divi
dual
user
and
isno
tto
bedi
ssem
inat
edbr
oadl
y.
22 SAUVÉ, SAYED, DEAN, AND PEARCE

Results
Melody-level Analysis
In this section, we describe analyses of the mean ratings melodyby melody; the experiment manipulated the pitch expectancy ofthe original melodies, to provide a causal test of its influence. Timeis treated as a discontinuous variable. Figure 3 shows mean ratingsfor each melody averaged over time, and important comparisonsare highlighted in Figure 4.
Expectancy ratings. There were significant effects of musicaltraining, in which musicians rated melody unexpectedness higher(musicians M � 4.40; nonmusicians M � 4.16; F(1, 8343) �73.12, p � .0001); stimulus modification, in which modifiedmelodies, regardless of direction of manipulation (predictable tounpredictable or vice versa), were rated as more unexpected (orig-inal melodies M � 3.92; modified melodies M � 4.65; F(1,8342) � 569.75, p � .0001); and stimulus predictability, in whichmore predictable melodies were rated with lower unexpectednessthan unpredictable melodies (PP melodies M � 3.48; PU melodiesM � 4.71; UP melodies M � 3.92; UU melodies M � 4.66; F(3,8340) � 251.58, p � .0001) on mean expectancy ratings. Pitchpredictability and onset predictability were both significantpredictors, in which mean ratings for melodies with predictablepitch, unpredictable pitch, predictable onset, and unpredictableonset were 4.09, 4.29, 3.70, and 4.68, respectively (F(1,8342) � 83.05, p � .0001 and F(1, 8342) � 644.31, p �.0001), and the interaction between the two predictors was alsosignificant; there is a more pronounced effect of onset predict-ability on ratings, t(8,340) � �7.36, p � .0001. We alsoinvestigated the effect of stimulus predictability on ratings fororiginal and modified melodies separately; the means for PP, PU,UP, and UU melodies were 1.88, 4.47, 3.58, and 5.19, respec-tively, F(3, 4223) � 1,866.2, p � .0001, and for aPP, aPU, aUP,and aUU melodies were 4.27, 4.16, 5.29, and 4.96, respectively,F(3, 4112) � 264.36, p � .0001. The two global models confirmednearly all the aforementioned results, producing two additionalfindings: Pitch, t(8,336) � �3.76, p � .0001, and IOI,t(8,336) � �3.72, p � .0001, were significant predictors in bothglobal models, and pitch predictability became insignificant in itsmodel, t(2) � 0.24, p � .80. In summary, all predictors of interestwere significant, including the interaction between pitch predict-ability and onset predictability. These results are largely replicatedusing noninterpolated data, in which only pitch is no longer asignificant predictor, t(2,218) � 1.05, p � .29.
Arousal ratings. There were significant effects of musicaltraining in which musicians rate melodies as more arousing overallas compared with nonmusicians (musicians M � 118.16; nonmu-sicians M � 112.90; F(1, 8017) � 25.30, p � .0001), and stimuluspredictability in which more predictable melodies were rated asmore arousing (PP melodies M � 151.73; PU melodies M �109.45; UP melodies M � 128.86; UU melodies M � 95.95; F(3,8015) � 667.31, p � .0001). There was no effect of stimulusmodification in either direction of manipulation (original melodiesM � 115.83; modified melodies M � 115.27; F(1, 8017) � .62,p � .42). Pitch predictability and onset predictability were bothsignificant predictors in which mean ratings for melodies withpredictable pitch, unpredictable pitch, predictable onset, and un-predictable onset were 125.29, 112.40, 135.29, and 102.7, respec-
tively, F(1, 8017) � 208.38, p � .0001 and F(1, 8017) � 1,804.3,p � .0001, and the interaction between the two predictors was notsignificant here, though similarly to expectancy ratings, onsetpredictability still has a larger effect on mean ratings than pitchpredictability, t(8,015) � 1.08, p � .28. Stimulus predictabilitywas also a significant predictor when original and artificial melo-dies’ ratings were investigated separately, with ratings for PP, PU,UP, and UU melodies averaging 138.62, 111.14, 121.07, and100.79, respectively, F(3, 3956) � 210.16, p � .0001, and aPP,aPU, aUP, and aUU melodies averaging 137.10, 91.56 144.96, and107.83, respectively, F(3, 4054) � 556.76, p � .0001. The twoglobal models confirm all the above results and add pitch,t(8,011) � �17.72, p � .0001 and IOI, t(8,011) � 18.58, p �.0001 as significant predictors. In summary, stimulus modificationis the only predictor of interest that did not have a significant effecton arousal ratings. These results are largely replicated using non-interpolated data, in which only pitch is no longer a significantpredictor, t(2,186) � �0.99, p � .32.
Valence ratings. There were significant effects of musicaltraining in which musicians overall rated melodies as having lowervalence (musicians M � 81.26; nonmusicians M � 84.08; F[1,8017] � 5.38, p � .02); stimulus modification, regardless ofdirection of manipulation, in which original melodies had morepositive valence than artificial melodies (original melodies M �91.20; artificial melodies M � 74.33; F[1, 8017] � 206.84, p �.0001); and stimulus predictability in which more predictablemelodies are rated more positively than unpredictable melodies(PP melodies M � 109.87; PU melodies M � 74.00; UP melodiesM � 87.00; UU melodies M � 70.02; F(3, 8015) � 224.81, p �.0001). Pitch predictability and onset predictability were bothsignificant predictors in which mean ratings for melodies withpredictable pitch, unpredictable pitch, predictable onset, and un-predictable onset were 91.93, 78.51, 98.43, and 72.01, respec-tively, F(1, 8017) � 122.51, p � .0001 and F(1, 8017) � 559.04,p � .0001, and the interaction between the two predictors wassignificant, in which onset predictability again has a larger effecton mean ratings than pitch predictability, t(8,015) � 8.40, p �.0001. Stimulus predictability is also a significant predictor wheninvestigating original and artificial melodies separately, in whichPP, PU, UP, and UU melodies have mean arousal ratings of171.90, 77.96, 94.59, and 44.46, respectively, F(3, 3956), 1,582.6,p � .0001, and aPP, aPU, aUP, and aUU melodies have meanratings of 78.98, 93.21, 45.66, and 70.19, respectively, F(3,4054) � 276.84, p � .0001. The two global models include IOI,t(8,011) � 22.07, p � .0001, but not pitch, t(8,011) � �1.48, p �.13, as significant predictors (in both models) and remove pitchpredictability, t(8,011) � 0.90, p � .36, from the set of significantpredictors found above. In summary, all predictors of interest aresignificant, including the interaction between pitch predictabilityand onset predictability. These results are largely replicated usingnoninterpolated data, in which only pitch and musical training areno longer significant predictors, t(2,186) � �0.70, p � .48, andt(2,186) � 0.69, p � .48, respectively.
This melody-level analysis has demonstrated that musical train-ing and stimulus predictability predict expectancy, arousal, andvalence ratings, with only one exception, in which musical trainingdoes not predict valence ratings when these are averaged for eachevent. Furthermore, there is a significant interaction between pitchpredictability and onset predictability for expectancy and valence
Thi
sdo
cum
ent
isco
pyri
ghte
dby
the
Am
eric
anPs
ycho
logi
cal
Ass
ocia
tion
oron
eof
itsal
lied
publ
ishe
rs.
Thi
sar
ticle
isin
tend
edso
lely
for
the
pers
onal
use
ofth
ein
divi
dual
user
and
isno
tto
bedi
ssem
inat
edbr
oadl
y.
23EXPECTANCY AND MUSICAL EMOTION

Figure 3. Mean expectancy (a and b), arousal (c and d), and valence (e and f) ratings for each melody formusicians (a, c, e) and nonmusicians (b, d, f). Hollow shapes illustrate original melodies, whereas filled shapesillustrate artificial melodies.
Thi
sdo
cum
ent
isco
pyri
ghte
dby
the
Am
eric
anPs
ycho
logi
cal
Ass
ocia
tion
oron
eof
itsal
lied
publ
ishe
rs.
Thi
sar
ticle
isin
tend
edso
lely
for
the
pers
onal
use
ofth
ein
divi
dual
user
and
isno
tto
bedi
ssem
inat
edbr
oadl
y.
24 SAUVÉ, SAYED, DEAN, AND PEARCE

ratings, and a similar pattern for arousal ratings, in which onsetpredictability has a larger effect on ratings than pitch predictabil-ity. Stimulus modification is a significant predictor for expectancyand valence ratings only. In the next section, the results of aCSTSA will be presented.
Cross-sectional Time Series Analysis
Here we present the analyses of the continuous time-series dataresulting from participants’ ongoing responses throughout listen-ing to the melodies.
Expectancy, arousal, and valence ratings were modeled sepa-rately using mixed-effects autoregressive models with random
intercepts on Participant ID and Melody ID, as well as randomslopes on the fixed effect predictor with the largest coefficientbefore slopes were added. Fixed-effect predictors were time, mu-sical training, stimulus predictability, stimulus modification, au-toregressive lags of up to 15 (in which each lag represents 200 ms,for a total of 3 s), and exogenous lags of pitch and onset IC of upto 15. A combined pitch and onset information predictor was alsotested to evaluate whether a combined measure superseded theseparate pitch and onset IC predictors. Maximum lags for consid-eration were selected based on a previously reported rate of changeof emotional responses (Juslin & Västfjäll, 2008) and precedent inthis type of analysis (Dean et al., 2014a). Pitch and IOI were
Figure 4. Box plots illustrating important mean comparisons between musicians and nonmusicians (a, e, i),original and modified melodies (b, f, j), stimulus predictability categories for original (c, g, k), and modified (d,h, l) melodies for expectation (a–d), arousal (e–h), and valence (i–l) ratings.
Thi
sdo
cum
ent
isco
pyri
ghte
dby
the
Am
eric
anPs
ycho
logi
cal
Ass
ocia
tion
oron
eof
itsal
lied
publ
ishe
rs.
Thi
sar
ticle
isin
tend
edso
lely
for
the
pers
onal
use
ofth
ein
divi
dual
user
and
isno
tto
bedi
ssem
inat
edbr
oadl
y.
25EXPECTANCY AND MUSICAL EMOTION

subsequently added as fixed-effect predictors to investigate thepotential effects of musical structure on ratings (which might be inpart through an emotional contagion mechanism). See Figures 5and 6 for an illustration of the variance fitted by random effectsand the fit of the models for a selection of melodies and partici-pants.
Expectancy ratings. The best CSTSA model for expectancyratings is summarized in Table B1 in Appendix B. In this model,
although autoregression and random effects were duly considered,an effect of musicianship was still clearly observed in addition tothose of pitch IC and onset IC and the optimal selection of theirlags. Thus, the model included random intercepts and randomslopes for L1pitchIC on Melody ID and Participant ID, as well asfixed effects of musicianship, L � 0–1, 7–8 of pitch IC; L � 0–2,10, 12 of onset IC; and p � 1–2, 4–6, 15 of autoregression. Allpredictors were significant, as Wald 95% confidence intervals did
Figure 5. Intercept (left) and slope (right) values of random effects on Participant (a, c, e) and Melody identity(ID; b, d, f) for expectancy (a, b), arousal (c, d), and valence (e, f) models. These show how each individualparticipant and melody was modeled and illustrate the variance among participants and melodies. See the onlinearticle for the color version of this figure.
Thi
sdo
cum
ent
isco
pyri
ghte
dby
the
Am
eric
anPs
ycho
logi
cal
Ass
ocia
tion
oron
eof
itsal
lied
publ
ishe
rs.
Thi
sar
ticle
isin
tend
edso
lely
for
the
pers
onal
use
ofth
ein
divi
dual
user
and
isno
tto
bedi
ssem
inat
edbr
oadl
y.
26 SAUVÉ, SAYED, DEAN, AND PEARCE

Figure 6. Expectancy (a–d), arousal (e–h), and valence (i–l) ratings for single randomly selected participants(six musicians [a, b, e, f, i, j; Participants 14, 35, 34, 18, 27, and 7] and six nonmusicians [c, d, g, h, k, l;Participants 1, 10, 8, 33, 5, and 37]) are plotted for Melodies 1 (a, c, e, g, i, k) and 13 (b, d, f, h, j, l), examplesof PP and UU categories, respectively. Ratings predicted by the model (teal) for those melodies for each of thoseparticipants only (single extracts) are plotted alongside their actual ratings (pink). Residuals were too small toillustrate on the same plot. These plots illustrate the high explanatory power of our model due to its randomeffects structure fitted specifically to this data set. See the online article for the color version of this figure.
Thi
sdo
cum
ent
isco
pyri
ghte
dby
the
Am
eric
anPs
ycho
logi
cal
Ass
ocia
tion
oron
eof
itsal
lied
publ
ishe
rs.
Thi
sar
ticle
isin
tend
edso
lely
for
the
pers
onal
use
ofth
ein
divi
dual
user
and
isno
tto
bedi
ssem
inat
edbr
oadl
y.
27EXPECTANCY AND MUSICAL EMOTION

not include zero. The addition of stimulus predictability as afixed effect did not improve the model, �2(3) � 1.80, p � .61,whereas musicianship and stimulus modification did, �2(2) �13.36, p � .001 and �2(1) � 3.91, p � .04, respectively. Thefurther addition of pitch and IOI significantly improved themodel, �2(2) � 409.33, p � .0001, and removed stimulusmodification as a significant predictor. Combined pitch andonset information content with lags of pitch and onset from thebest model outlined in the abovementioned text was signifi-cantly worse, �2(6) � 972.6, p � .0001.
A correlation test between the data and the model is highlysignificant, with correlation .93, t(82,486) � 783.09, p � .0001. Aproportion of data squares fit test is also high, with the modelexplaining 98% of the data. Although this particular model did notconverge, a model without random slopes removed did convergewhere all fixed effects were significant, model fit was equallygood, correlation test: .93, t(82,486) � 780.53, p � .0001; pro-portion of data squares fit: 98%, and the inclusion of slopesimproved the model significantly; therefore random slopes werereinserted into the best model as per the experimental design (Barret al., 2013). The final model thus includes design-driven randomeffects, musicianship, stimulus modification, pitch, IOI, optimalautoregressive lags of expectancy ratings, and optimal lags of pitchIC and onset IC. These results are replicated using noninterpolateddata, with only the selection of lags differing.
Arousal ratings. The best CSTSA model for arousal ratings issummarized in Table B2 in Appendix B. This model revealedstimulus predictability as a significant predictor of arousal ratingsin addition to pitch IC and onset IC, and a selection of their lagswhen autoregression and random effects were considered. Themodel included random intercepts and random slopes forL1onsetIC on Melody ID and Participant ID, as well as fixedeffects L � 0–1, 6–8, 10–13, 15 of pitch IC; L � 0–4, 7, 10,12–15 of onset IC; and p � 1, 3, 5–6, 15 of autoregression. Allpredictors were significant, as Wald 95% confidence intervals didnot include zero. The addition of musicianship and stimulus mod-ification as fixed effects did not improve the model, �2(2) � 0.60,p � .74, and �2(2) � 1.72, p � .42, respectively, whereas stimuluspredictability did, �2(2) � 14.91, p � .0005. The further additionof pitch and IOI significantly improved the model, �2(2) � 178.89,p � .0001, in which both are significant predictors of arousalratings. Combined pitch and onset information content with lags ofpitch and onset from the best model outlined in the abovemen-tioned text was significantly worse, �2(13) � 4,482.2, p � .0001.
A correlation test between the data and the model is highlysignificant, with correlation .96, t(80,183) � 978.48, p � .0001. Aproportion of data squares fit test is also high, with our modelexplaining 98% of the data. Although this particular model did notconverge, a model without random slopes removed did convergewhere all fixed effects were significant, model fit was equallygood, correlation test: .95, t(80,183) � 959.73, p � .0001; pro-portion of data squares fit: 98%, and the inclusion of slopesimproved the model significantly, �2(5) � 335.3, p � .0001;therefore random slopes were reinserted into the best model as perthe experimental design (Barr et al., 2013). The final model thusincludes design-driven random effects, stimulus predictability,pitch, IOI, optimal autoregressive lags of expectancy ratings, andoptimal lags of pitch IC and onset IC. These results are replicated
using noninterpolated data, with only the selection of lags differ-ing.
Valence ratings. The best CSTSA model for valence ratingsis summarized in Table B3 in Appendix B. This model revealedsignificant effects of only pitch IC and onset IC, and a selection oftheir lags when autoregression and random effects were consid-ered. The model included random intercepts and random slopes forL1onsetIC on Melody ID and Participant ID, as well as fixedeffects L � 0–1, 5, 8–9, 11–13, 15 of pitch IC; L � 0–1, 3–4, 10,13 of onset IC; and p � 0, 3–7, 9, 15 of autoregression. Allpredictors were significant, as Wald 95% confidence intervals didnot include zero. The addition of musicianship, stimulus predict-ability, and modification as fixed effects did not improve themodel, �2(1) � 0.29, p � .58, �2(3) � 4.77, p � .18, and �2(1) �3.46, p � .06, respectively. The further addition of pitch and IOIsignificantly improved the model, �2(1) � 600.99, p � .0001, inwhich both are significant predictors of arousal ratings. Combinedpitch and onset information content with lags of pitch and onsetfrom the best model outlined in the abovementioned text wassignificantly worse, �2(10) � 194.72, p � .0001.
A correlation test between the data and the model is highlysignificant, with correlation .94, t(80,183) � 827.83, p � .0001. Aproportion of data squares fit test is also high, with our modelexplaining 98% of the data. Although this particular model did notconverge, a model without random slopes removed did convergewhere all fixed effects were significant, model fit was equallygood, correlation test: .94, t(80,183) � 959.73, p � .0001; pro-portion of data squares fit: 95%, and the inclusion of slopesimproved the model significantly, �2(4) � 805.25, p � .0001;therefore random slopes were reinserted into the best model as perthe experimental design (Barr et al., 2013). The final model thusincludes design-driven random effects, pitch, IOI, optimal autore-gressive lags of expectancy ratings, and optimal lags of pitch ICand onset IC. These results are replicated using noninterpolateddata, with only the selection of lags differing.
Discussion
The results provide answers to all three of our research ques-tions. First, we find evidence that predictability of both pitch andtemporal musical structure have an effect on listeners’ expectan-cies and emotional reactions and that these can be manipulated.Second, we find that contrary to a prediction based on complexity,temporal expectancy influences perception more strongly thanpitch expectancy. Finally, we find that individual differences gen-erally supersede effects of musical training (Dean et al., 2014a)and intermelody differences were more substantial than differ-ences between melody predictability groups (PP, UP, PU, and UU)or manipulation type, in which differences between predictabilitygroups could nevertheless be detected in the discontinuous,melody-level analysis.
Using IDyOM (Pearce, 2005) to calculate average pitch andonset information content, we classified folk songs into four cat-egories based on overall expectedness, in which average pitchexpectancy and average onset expectancy could be high or low.We also manipulated pitch expectancy to transform expectedpitches into unexpected ones and vice versa. The four melodycategories resulted in different subjective ratings of expectancy,arousal, and valence; high pitch and onset information content
Thi
sdo
cum
ent
isco
pyri
ghte
dby
the
Am
eric
anPs
ycho
logi
cal
Ass
ocia
tion
oron
eof
itsal
lied
publ
ishe
rs.
Thi
sar
ticle
isin
tend
edso
lely
for
the
pers
onal
use
ofth
ein
divi
dual
user
and
isno
tto
bedi
ssem
inat
edbr
oadl
y.
28 SAUVÉ, SAYED, DEAN, AND PEARCE

(UU) resulted in high unexpectedness ratings, higher arousal, andlower valence; low pitch and onset information content (PP) re-sulted in low unexpectedness ratings, lower arousal, and highervalence; and mixed high and low pitch and onset informationcontent (PU and UP) lay somewhere in between, in which only thepredictable pitch and onset (PP) and unpredictable pitch and pre-dictable onset (UP) categories were not different from each otherin arousal ratings. This supports previous evidence that statisticallearning and information content may influence listener expectan-cies (Pearce, Ruiz, Kapasi, Wiggins, & Bhattacharya, 2010; Pearce& Wiggins, 2006) and arousal and valence ratings of music(Egermann et al., 2013). Additionally, we find a significant inter-action between pitch predictability and onset predictability forexpectancy and valence ratings, with a similar nonsignificant pat-tern for arousal ratings, in which onset predictability has a morepronounced effect on ratings than pitch predictability. CSTSAsupports these results with excellent models, explaining between93% and 96% of expectancy, arousal, and valence ratings, allincluding pitch and onset IC, and lags of these of up to 3 s aspredictors. We additionally find that explicit causal manipulationof pitch expectancy—the modification of selected pitches fromhigh to low or from low to high expectancy—results in a changein ratings in the expected direction. For example, melodies trans-formed from PP into the UP category (filled triangle in Figure 3)are rated with higher unexpectedness ratings and lower valencethan their original PP counterparts (hollow square in Figure 3), yetthese are also different from the original UP category (hollowtriangle in Figure 3) melodies. This effect is more pronounced forexpectedness and valence ratings than for arousal ratings, whichcan be explained by the intentionally inexpressive nature of thestimuli. Therefore, the manipulation of pitch expectancy addscausal evidence to previous research by demonstrating a direct linkbetween expectancy manipulation and expectancy, arousal, andvalence ratings.
CSTSA also allows us to assess the relative contribution of pitchand onset IC to expectancy, arousal, and valence ratings in moredetail. We find that onset IC coefficients are almost always ap-proximately 1.1 to 4.3 times larger than pitch IC coefficients forexactly (i.e., L1pitchIC and L1onsetIC) or loosely (i.e., L5pitchICand L6onsetIC) matching lags. Furthermore, the sum of onset IClag coefficients is far greater than the sum of pitch IC lag coeffi-cients for arousal and valence rating models, whereas the sum ofpitch IC lag coefficients is greater than onset IC lag coefficients forthe expectancy ratings model (though absolute values of individualonset IC coefficients are greater than the pitch IC coefficients).The discrepancy between these results and predictions based oncomplexity will be discussed further in the section on relativesalience. We choose to consider the sum of lag coefficients ratherthan the effect of each coefficient individually because we foundthat the choice of the exact combination of lags had minimal effecton the quality of the final model during optimization. This suggeststhat neither does each lag coefficient carry much interpretableinformation on its own nor is this particular combination of lags,with a mix of positive and negative coefficient values, generaliz-able. Incidentally, every model includes pitch IC and onset IC lagsof 0 and 1, with little overlap beyond this, suggesting that cogni-tive processing time for pitch and onset expectancy diverges afterthis. This variation in time scales could also explain why a com-
bined pitch and onset IC predictor did not replace the separatepitch IC and onset IC predictors.
Though the analysis of mean ratings yielded a main effect ofmusical training, with the exception of valence ratings when usingaveraged rating values, the amount of variance explained by mu-sical background was superseded by the amount of variance ex-plained by random effects on Participant ID for arousal and va-lence ratings, indicating that though groups can be formed,individual strategies are more important to explain these ratings.Though a large body of literature supports the existence of certaindifferences between musicians and nonmusicians (Brattico,Näätänen, & Tervaniemi, 2001; Carey et al., 2015; Fujioka,Trainor, Ross, Kakigi, & Pantev, 2004; Granot & Donchin, 2002),similar research by Dean et al. (2014a; Dean, Bailes, & Dunsmuir,2014b) has also found that though there were differences betweengroups, individual differences explain more variance than musicalbackground when rating the arousal and valence of electroacousticand piano music. However, musical background did hold an im-portant predictive power for expectancy ratings, as musicians gaveslightly higher ratings overall, showing greater unexpectedness.Though one might at first expect musicians to have lower expec-tancy ratings overall due to expertise with musical patterns, thealternative is possible when considering work by Hansen andPearce (2014), who present evidence that musicians make morespecific predictions (i.e., predictions that are lower in entropy oruncertainty) than nonmusicians when listening to music. It ispossible that due to these more specific predictions, any violationswere perceived as more unexpected, as opposed to the less specificpredictions of a nonmusician, which would result in less surprisewhen violated. That being said, it is worth noting that the overalldifference in ratings between musicians and nonmusicians is small,with musicians’ ratings being only 0.2 points higher.
Similarly, we found that the differences between individualmelodies, as modeled by random intercepts and slopes on MelodyID, outweigh categories of stimulus predictability and stimulusmodification in all but two cases: expectancy ratings, in whichstimulus modification was a significant predictor, and arousalratings, in which stimulus predictability was a significant predic-tor, such that PP � UP � PU � UU in terms of arousal ratings.The predictive power of stimulus modification in the context ofexpectancy ratings can be explained by the overall higher pitch ICin artificial melodies, as shown in Figure 3. This is likely due to thefact that the modifications were made by an algorithm and aretherefore not as smooth as human-composed changes might havebeen. As the original melodies already had relatively low IC, itwould be difficult to keep mean IC as low or lower with the changeof even one note, as this change could also have an effect on theIC of all subsequent notes in a given melody.
As for the importance of stimulus predictability in predictingarousal ratings, which was in the opposite direction to what wasexpected based on previous empirical (Egermann et al., 2013;Steinbeis et al., 2006) and theoretical (Huron, 2006; Meyer, 1956)research, this could be explained by the potentially confoundingeffect of duration on ratings. Our analysis revealed that noteduration did indeed have a significant effect on ratings, in whichmelodies with longer durations, corresponding to low onset expec-tancy, were rated as more unexpected, less arousing, and lesspleasant. The pattern of mean arousal ratings by stimulus predict-ability, with PP and UP (high onset expectancy) rated as more
Thi
sdo
cum
ent
isco
pyri
ghte
dby
the
Am
eric
anPs
ycho
logi
cal
Ass
ocia
tion
oron
eof
itsal
lied
publ
ishe
rs.
Thi
sar
ticle
isin
tend
edso
lely
for
the
pers
onal
use
ofth
ein
divi
dual
user
and
isno
tto
bedi
ssem
inat
edbr
oadl
y.
29EXPECTANCY AND MUSICAL EMOTION

arousing than PU and UU (low onset expectancy), matches thisinterpretation, which is further supported by previous researchestablishing a positive correlation between tempo and arousal(Carpentier & Potter, 2007; Husain, Thompson, & Schellenberg,2002). The significant effect of pitch on ratings is more surprising;a pattern of higher average pitch for PP and UP categories corre-sponds to lower unexpectedness ratings, higher arousal ratings,and higher valence ratings for these categories as compared withPU and UU categories. However, coefficients for pitch and IOI aresmaller than almost all other predictors in expectancy, arousal, andvalence models, suggesting that their overall influence is minimalcompared with pitch and onset IC on subjective expectancy andemotion responses.
Also, similar to Dean et al. (2014a), the use of CSTSA allows usto evaluate evidence for the presence of a common perceptualmechanism across all pieces of music heard. To do this, predictorsencoding melodies by stimulus predictability and modificationwere added to the basic models, in which a null effect of theseadditional predictors would indicate that the type of melody doesnot matter and the listeners’ ratings depend only on pitch and onsetIC in all melodies. In the case of valence ratings, neither stimuluspredictability nor stimulus modification were found to provide anyadditional predictive power to the model, whereas stimulus mod-ification was a helpful predictor for expectancy ratings and stim-ulus predictability for arousal ratings. However, explanations wereproposed for these results, and our data provide some support fora common perceptual mechanism across all melodies.
Relative Salience
Having considered the relative importance of pitch and onset ICin the context of our models of participant expectancy, arousal, andvalence ratings, here we consider how this relates to relativeperceptual salience. The question of relative perceptual saliencebetween musical parameters such as pitch, timing, structure, andharmony in music cognition is important but challenging and lacksa unified explanation (Dibben, 1999; Esber & Haselgrove, 2011;Prince et al., 2009; Uhlig, Fairhurst, & Keller, 2013). Generally,pitch or melody is considered the most salient aspect of a piece ofmusic. Prince et al. (2009), for example, argued that there aremany more possible pitches than there are rhythmic durations orchords; therefore, pitch takes more attentional resources to processand is more salient. On the other hand, in a corpus analysis of 18th-and 19th-century string quartets, Duane (2013) found that onsetand offset synchrony were the most important predictors ofstreaming perception of these string quartets, with pitch explaininghalf the variance that onset and offset synchrony did and harmonicoverlap explaining an almost insignificant amount. It is also im-portant to consider the musical genre when discussing salience, ascertain genres are more rhythmically driven (i.e., rap, electronicdance music, and African drum music), whereas others are moremelodically driven (i.e., opera). Folk music is more ambivalentand may vary song by song. Other genres may well producedifferent results; something that would be worth exploring in thefuture. Our stimuli best fit Prince et al.’s (2009) description ofmusical salience, as these melodies contain more different pitchesthan different rhythmic values. This would imply that the pitchdimension is more complex and therefore more salient. However,our results indicate that onset IC is more salient than pitch IC,
though here we evaluate the perception of emotion alongside thesubjective experience of expectancy as opposed to auditorystreaming (Duane, 2013; Prince et al., 2009). Interestingly, work incue salience in the context of associative learning explores theeffect of predictability and uncertainty on salience (Esber & Hasel-grove, 2011), with one model predicting increased salience forcues with high predictability (Mackintosh, 1975) and anothermodel predicting increased salience for cues with high uncertainty(Pearce & Hall, 1980). Though contradictory, these models haveeach accumulated significant evidence and have more recently ledto the development of both hybrid (Pearce & Mackintosh, 2010)and new unified models of cue salience (Esber & Haselgrove,2011). We considered the possibility that high and low uncertaintyand pitch and onset lag coefficients interacted, so that melodieswith high-pitch predictability (expectancy) and low-onset predict-ability (PU) led to larger pitch IC coefficients than onset ICcoefficients, and vice versa. This effect was not found in the data(see Appendix C), so we conclude that in this particular paradigm,onset is the more salient cue overall.
A Mechanism for Emotional Induction
Returning to the identified lack of research into specific mech-anisms for emotional induction by music (Juslin & Västfjäll, 2008;Meyer, 1956), the present research makes a single but significantstep toward isolating individual mechanisms. The study explicitlycontrolled for four of the eight proposed mechanisms, consideredtwo unlikely, and manipulated one while considering another as acovariate. Brain stem reflexes, evaluative conditioning, episodicmemory, and visual imagery are controlled for by presenting novelstimuli with equal tempo, intensity, and timbre alongside a ratingtask. Rhythmic entrainment and cognitive appraisal are highlyunlikely due to the lack of driving rhythm and experimentalsetting. Emotional contagion, information conveyed by musicalstructure itself, was addressed by including pitch and durationvalues into our CSTSA models of expectancy, arousal, and valenceratings. Though these were significant predictors, they carried lessweight than the lags of IC predictors. We examined musicalexpectancy by selecting stimuli with either high or low pitch andonset expectancy and additionally explicitly manipulated pitchexpectancy, finding evidence for a consistent effect of pitch andonset expectancy on ratings of arousal and valence by musiciansand nonmusicians. We additionally find that onset is more salientthan pitch and that musicians give higher unexpected ratings thannonmusicians, but group differences are overridden by individualdifferences on emotion ratings. Potential future work includes theuse of stimuli at less extreme ends of the expectancy spectrum tovalidate these findings and produce more generalizable models,manipulating onset IC in addition to pitch IC, allowing the eval-uation of dependencies between the two (Palmer & Krumhansl,1987b), exploring interactions of predictability and entropy onsalience cues in emotion ratings, and investigating other potentialemotional induction mechanisms in a similarly controlled way,working toward an integrated model of musical emotion inductionand perception.
References
Barr, D. J., Levy, R., Scheepers, C., & Tily, H. J. (2013). Random effectsstructure for confirmatory hypothesis testing: Keep it maximal. Journal
Thi
sdo
cum
ent
isco
pyri
ghte
dby
the
Am
eric
anPs
ycho
logi
cal
Ass
ocia
tion
oron
eof
itsal
lied
publ
ishe
rs.
Thi
sar
ticle
isin
tend
edso
lely
for
the
pers
onal
use
ofth
ein
divi
dual
user
and
isno
tto
bedi
ssem
inat
edbr
oadl
y.
30 SAUVÉ, SAYED, DEAN, AND PEARCE

of Memory and Language, 68, 255–278. http://dx.doi.org/10.1016/j.jml.2012.11.001
Bauer, A.-K. R., Jaeger, M., Thorne, J. D., Bendixen, A., & Debener, S.(2015). The auditory dynamic attending theory revisited: A closer lookat the pitch comparison task. Brain Research, 1626, 198–210. http://dx.doi.org/10.1016/j.brainres.2015.04.032
Bittman, B., Croft, D. T., Jr., Brinker, J., van Laar, R., Vernalis, M. N., &Ellsworth, D. L. (2013). Recreational music-making alters gene expres-sion pathways in patients with coronary heart disease. Medical ScienceMonitor, 19, 139–147. http://dx.doi.org/10.12659/MSM.883807
Boltz, M. G. (1999). The processing of melodic and temporal information:Independent or unified dimensions? Journal of New Music Research, 28,67–79. http://dx.doi.org/10.1076/jnmr.28.1.67.3121
Brattico, E., Näätänen, R., & Tervaniemi, M. (2001). Context effects onpitch perception in musicians and nonmusicians: Evidence from event-related-potential recordings. Music Perception, 19, 199–222. http://dx.doi.org/10.1525/mp.2001.19.2.199
Carey, D., Rosen, S., Krishnan, S., Pearce, M. T., Shepherd, A., Aydelott,J., & Dick, F. (2015). Generality and specificity in the effects of musicalexpertise on perception and cognition. Cognition, 137, 81–105. http://dx.doi.org/10.1016/j.cognition.2014.12.005
Carlsen, J. C. (1981). Some factors which influence melodic expectancy.Psychomusicology: A Journal of Research in Music Cognition, 1, 12–29.http://dx.doi.org/10.1037/h0094276
Dillman Carpentier, F. R., & Potter, R. F. (2007). Effects of music onphysiological arousal: Explorations into tempo and genre. Media Psy-chology, 10, 339–363. http://dx.doi.org/10.1080/15213260701533045
Castillo-Pérez, S., Gómez-Pérez, V., Velasco, M. C., Pérez-Campos, E., &Mayoral, M.-A. (2010). Effects of music therapy on depression com-pared with psychotherapy. The Arts in Psychotherapy, 37, 387–390.http://dx.doi.org/10.1016/j.aip.2010.07.001
Cirelli, L. K., Spinelli, C., Nozaradan, S., & Trainor, L. J. (2016). Mea-suring neural entrainment to beat and meter in infants: Effects of musicbackground. Frontiers in Neuroscience, 10, 229. http://dx.doi.org/10.3389/fnins.2016.00229
Collins, T., Laney, R., Willis, A., & Garthwaite, P. H. (2011). Modelingpattern importance in Chopin’s Mazurkas. Music Perception, 28, 387–414. http://dx.doi.org/10.1525/mp.2011.28.4.387
Dean, R. T., Bailes, F., & Dunsmuir, W. T. M. (2014a). Shared and distinctmechanisms of individual and expertise-group perception of expressedarousal in four works. Journal of Mathematics and Music, 8, 207–223.http://dx.doi.org/10.1080/17459737.2014.928753
Dean, R. T., Bailes, F., & Dunsmuir, W. T. M. (2014b). Time seriesanalysis of real-time music perception: Approaches to the assessment ofindividual and expertise differences in perception of expressed affect.Journal of Mathematics and Music, 8, 183–205. http://dx.doi.org/10.1080/17459737.2014.928752
Dibben, N. (1999). The perception of structural stability in atonal music:The influence of salience, stability, horizontal motion, pitch common-ality, and dissonance. Music Perception, 16, 265–294. http://dx.doi.org/10.2307/40285794
Duane, B. (2013). Auditory streaming cues in eighteenth- and earlynineteenth-century string quartets: A corpus-based study. Music Percep-tion: An Interdisciplinary Journal, 31, 46–58. http://dx.doi.org/10.1525/mp.2013.31.1.46
Egermann, H., Pearce, M. T., Wiggins, G. A., & McAdams, S. (2013).Probabilistic models of expectation violation predict psychophysiologi-cal emotional responses to live concert music. Cognitive, Affective andBehavioral Neuroscience, 13, 533–553. http://dx.doi.org/10.3758/s13415-013-0161-y
Esber, G. R., & Haselgrove, M. (2011). Reconciling the influence ofpredictiveness and uncertainty on stimulus salience: A model of atten-tion in associative learning. Proceedings of the Royal Society of London
B: Biological Sciences, 278, 2553–2561. http://dx.doi.org/10.1098/rspb.2011.0836
Fujioka, T., Trainor, L. J., Ross, B., Kakigi, R., & Pantev, C. (2004).Musical training enhances automatic encoding of melodic contour andinterval structure. Journal of Cognitive Neuroscience, 16, 1010–1021.http://dx.doi.org/10.1162/0898929041502706
Gingras, B., Pearce, M. T., Goodchild, M., Dean, R. T., Wiggins, G., &McAdams, S. (2016). Linking melodic expectation to expressive perfor-mance timing and perceived musical tension. Journal of ExperimentalPsychology: Human Perception and Performance, 42, 594–609. http://dx.doi.org/10.1037/xhp0000141
Granot, R., & Donchin, E. (2002). Do Re Mi Fa Sol La Ti—Constraints,congruity, and musical training: An event-related brain potentials studyof musical expectancies. Music Perception, 19, 487–528. http://dx.doi.org/10.1525/mp.2002.19.4.487
Habibi, A., & Damasio, A. (2014). Music, feelings, and the human brain.Psychomusicology: Music, Mind, and Brain, 24, 92–102. http://dx.doi.org/10.1037/pmu0000033
Hannon, E. E., Soley, G., & Ullal, S. (2012). Familiarity overrides com-plexity in rhythm perception: A cross-cultural comparison of Americanand Turkish listeners. Journal of Experimental Psychology: HumanPerception and Performance, 38, 543–548. http://dx.doi.org/10.1037/a0027225
Hannon, E. E., & Trehub, S. E. (2005a). Metrical categories in infancy andadulthood. Psychological Science, 16, 48–55. http://dx.doi.org/10.1111/j.0956-7976.2005.00779.x
Hannon, E. E., & Trehub, S. E. (2005b). Tuning in to musical rhythms:Infants learn more readily than adults. Proceedings of the NationalAcademy of Sciences of the United States of America, 102, 12639–12643. http://dx.doi.org/10.1073/pnas.0504254102
Hansen, N. C., & Pearce, M. T. (2014). Predictive uncertainty in auditorysequence processing. Frontiers in Psychology, 5, 1052. http://dx.doi.org/10.3389/fpsyg.2014.01052
Huron, D. (2001). What is a musical feature? Music Theory Online, 7,1–18.
Huron, D. (2006). Sweet anticipation: Music and the psychology of expec-tation. Cambridge, MA: The MIT Press.
Husain, G., Thompson, W. F., & Schellenberg, E. G. (2002). Effects ofmusical tempo and mode on arousal, mood, and spatial abilities. MusicPerception, 20, 151–171. http://dx.doi.org/10.1525/mp.2002.20.2.151
Jones, M. R., & Boltz, M. (1989). Dynamic attending and responses totime. Psychological Review, 96, 459–491. http://dx.doi.org/10.1037/0033-295X.96.3.459
Jones, M. R., Boltz, M., & Kidd, G. (1982). Controlled attending as afunction of melodic and temporal context. Perception and Psychophys-ics, 32, 211–218. http://dx.doi.org/10.3758/BF03206225
Jones, M. R., Moynihan, H., MacKenzie, N., & Puente, J. (2002). Tem-poral aspects of stimulus-driven attending in dynamic arrays. Psycho-logical Science, 13, 313–319. http://dx.doi.org/10.1111/1467-9280.00458
Juslin, P. N., Liljeström, S., Västfjäll, D., & Lundqvist, L.-O. (2011). Howdoes music evoke emotions? Exploring the underlying mechanisms. InP. N. Juslin & J. Sloboda (Eds.), Handbook of music and emotion:Theory, research, applications (pp. 605–644). New York, NY: OxfordUniversity Press. Retrieved from https://philpapers.org/rec/JUSHDM
Juslin, P. N., & Sloboda, J. (2011). Handbook of music and emotion:Theory, research, applications. New York, NY: Oxford UniversityPress. Retrieved from https://books.google.co.uk/books?hl�en&lr�&id�e250IFNvw1sC&oi�fnd&pg�PT6&dq�music�and�emotion&ots�U_cVJdhueJ&sig�WJjyrykHIdsA_xfMrv11w0GKDrE
Juslin, P. N., & Västfjäll, D. (2008). Emotional responses to music: Theneed to consider underlying mechanisms. Behavioral and Brain Sci-ences, 31, 559–575. http://dx.doi.org/10.1017/S0140525X08005293
Thi
sdo
cum
ent
isco
pyri
ghte
dby
the
Am
eric
anPs
ycho
logi
cal
Ass
ocia
tion
oron
eof
itsal
lied
publ
ishe
rs.
Thi
sar
ticle
isin
tend
edso
lely
for
the
pers
onal
use
ofth
ein
divi
dual
user
and
isno
tto
bedi
ssem
inat
edbr
oadl
y.
31EXPECTANCY AND MUSICAL EMOTION

Khalfa, S., Bella, S. D., Roy, M., Peretz, I., & Lupien, S. J. (2003). Effectsof relaxing music on salivary cortisol level after psychological stress.Annals of the New York Academy of Sciences, 999, 374–376. http://dx.doi.org/10.1196/annals.1284.045
Khalfa, S., Isabelle, P., Jean-Pierre, B., & Manon, R. (2002). Event-relatedskin conductance responses to musical emotions in humans. Neurosci-ence Letters, 328, 145–149.
Koelsch, S., Fritz, T., & Schlaug, G. (2008). Amygdala activity can bemodulated by unexpected chord functions during music listening. Neu-roReport: For Rapid Communication of Neuroscience Research, 19,1815–1819. http://dx.doi.org/10.1097/WNR.0b013e32831a8722
Krumhansl, C. L., Louhivuori, J., Toiviainen, P., Järvinen, T., & Eerola, T.(1999). Melodic expectation in Finnish spiritual folk hymns: Conver-gence of statistical, behavioral, and computational approaches. MusicPerception, 17, 151–195. http://dx.doi.org/10.2307/40285890
Krumhansl, C. L. (2001). Cognitive foundations of musical pitch. NewYork, NY: Oxford University Press.
Lerdahl, F. (1989). Atonal prolongational structure. Contemporary MusicReview, 4, 65–87. http://dx.doi.org/10.1080/07494468900640211
Lerdahl, F., & Jackendoff, R. (1983). A generative theory of tonal music.Cambridge, Massachusetts: MIT Press.
Mackintosh, N. J. (1975). A theory of attention: Variations in the associa-bility of stimuli with reinforcement. Psychological Review, 82, 276–298. http://dx.doi.org/10.1037/h0076778
Meyer, L. (1956). Emotion and meaning in music. Chicago, IL: Universityof Chicago Press. Retrieved from http://www.press.uchicago.edu/ucp/books/book/chicago/E/bo3643659.html
Narmour, E. (1991). The top-down and bottom-up systems of musicalimplication: Building on Meyer’s theory of emotional syntax. MusicPerception, 9, 1–26. http://dx.doi.org/10.2307/40286156
Palmer, C., & Krumhansl, C. L. (1987a). Independent temporal and pitchstructures in determination of musical phrases. Journal of ExperimentalPsychology: Human Perception and Performance, 13, 116–126. http://dx.doi.org/10.1037/0096-1523.13.1.116
Palmer, C., & Krumhansl, C. L. (1987b). Pitch and temporal contributionsto musical phrase perception: Effects of harmony, performance timing,and familiarity. Perception and Psychophysics, 41, 505–518. http://dx.doi.org/10.3758/BF03210485
Palmer, C., & Krumhansl, C. L. (1990). Mental representations for musicalmeter. Journal of Experimental Psychology: Human Perception andPerformance, 16, 728–741.
Pearce, J. M., & Hall, G. (1980). A model for Pavlovian learning: Varia-tions in the effectiveness of conditioned but not of unconditioned stim-uli. Psychological Review, 87, 532–552. http://dx.doi.org/10.1037/0033-295X.87.6.532
Pearce, J. M., & Mackintosh, N. J. (2010). Two theories of attention: Areview and a possible integration. In C. J. Mitchell & M. E. L. Pelley(Eds.), Attention and associative learning: From brain to behaviour (pp.11–39). Oxford, UK: Oxford University Press.
Pearce, M. T. (2005, December). The construction and evaluation ofstatistical models of melodic structure in music perception and compo-sition (Unpublished doctoral dissertation). City University London, Lon-don, UK. Retrieved from http://openaccess.city.ac.uk/8459/
Pearce, M. T., Ruiz, M. H., Kapasi, S., Wiggins, G. A., & Bhattacharya, J.(2010). Unsupervised statistical learning underpins computational, be-havioural, and neural manifestations of musical expectation. NeuroIm-age, 50, 302–313. http://dx.doi.org/10.1016/j.neuroimage.2009.12.019
Pearce, M. T., & Wiggins, G. A. (2006). Expectation in melody: Theinfluence of context and learning. Music Perception, 23, 377–405.http://dx.doi.org/10.1525/mp.2006.23.5.377
Pelletier, C. L. (2004). The effect of music on decreasing arousal due tostress: A meta-analysis. Journal of Music Therapy, 41, 192–214. http://dx.doi.org/10.1093/jmt/41.3.192
Prince, J. B., Thompson, W. F., & Schmuckler, M. A. (2009). Pitch andtime, tonality and meter: How do musical dimensions combine? Journalof Experimental Psychology: Human Perception and Performance, 35,1598–1617. http://dx.doi.org/10.1037/a0016456
Rentfrow, P. J., & Gosling, S. D. (2003). The do re mi’s of everyday life:The structure and personality correlates of music preferences. Journal ofPersonality and Social Psychology, 84, 1236–1256. http://dx.doi.org/10.1037/0022-3514.84.6.1236
Russell, J. A. (2003). Core affect and the psychological construction ofemotion. Psychological Review, 110, 145–172. http://dx.doi.org/10.1037/0033-295X.110.1.145
Saffran, J. R., Johnson, E. K., Aslin, R. N., & Newport, E. L. (1999).Statistical learning of tone sequences by human infants and adults.Cognition, 70, 27–52. http://dx.doi.org/10.1016/S0010-0277(98)00075-4
Schellenberg, E. G. (1996). Expectancy in melody: Tests of theimplication-realization model. Cognition, 58, 75–125. http://dx.doi.org/10.1016/0010-0277(95)00665-6
Steinbeis, N., Koelsch, S., & Sloboda, J. A. (2006). The role of harmonicexpectancy violations in musical emotions: Evidence from subjective,physiological, and neural responses. Journal of Cognitive Neuroscience,18, 1380–1393. http://dx.doi.org/10.1162/jocn.2006.18.8.1380
Strait, D. L., Kraus, N., Skoe, E., & Ashley, R. (2009). Musical experienceand neural efficiency – effects of training on subcortical processing ofvocal expressions of emotion. European Journal of Neuroscience, 29,661–668. http://dx.doi.org/10.1111/j.1460-9568.2009.06617.x
Temperley, D. (1999). What’s key for key? The Krumhansl-Schmucklerkey-finding algorithm reconsidered. Music Perception: An Interdisci-plinary Journal, 17, 65–100. http://dx.doi.org/10.2307/40285812
Thompson, W. F., Graham, P., & Russo, F. A. (2005). Seeing musicperformance: Visual influences on perception and experience. Semi-otica, 156, 203–227.
Trainor, L. J., & Trehub, S. E. (1992). A comparison of infants’ and adults’sensitivity to western musical structure. Journal of Experimental Psy-chology: Human Perception and Performance, 18, 394–402. http://dx.doi.org/10.1037/0096-1523.18.2.394
Uhlig, M., Fairhurst, M. T., & Keller, P. E. (2013). The importance ofintegration and top-down salience when listening to complex multi-partmusical stimuli. NeuroImage, 77, 52–61. http://dx.doi.org/10.1016/j.neuroimage.2013.03.051
Vines, B. W., Krumhansl, C. L., Wanderley, M. M., & Levitin, D. J.(2006). Cross-modal interactions in the perception of musical perfor-mance. Cognition, 101, 80–113. http://dx.doi.org/10.1016/j.cognition.2005.09.003
(Appendices continue)
Thi
sdo
cum
ent
isco
pyri
ghte
dby
the
Am
eric
anPs
ycho
logi
cal
Ass
ocia
tion
oron
eof
itsal
lied
publ
ishe
rs.
Thi
sar
ticle
isin
tend
edso
lely
for
the
pers
onal
use
ofth
ein
divi
dual
user
and
isno
tto
bedi
ssem
inat
edbr
oadl
y.
32 SAUVÉ, SAYED, DEAN, AND PEARCE

Appendix A
Summary of Originial Melodies
(Appendices continue)
Table A1Summary of 16 Original Melodies Used in This Experiment
File nameData set of
originNumber of
eventsAverage pitch(60 � midC)
Average note duration(24 � quarter)
Mean pitchIC
Mean onsetIC
Stimuluspredictability
Kindr138 15 33 67.69 74.18 1.3624 0.8962 PPA162 18 21 70.23 27.42 1.4328 0.8955 PPKindr151 15 51 66.05 22.82 1.5971 0.8114 PPKindr162 15 19 68.36 26.52 1.5574 0.9254 PPDeut3480 10 19 72.89 36.94 2.4272 4.4488 PUJugos052 4 54 66.22 6.77 2.2543 3.7433 PUI0511 23 53 66.83 11.67 2.0089 2.4660 PUDeut3284 10 67 69.71 6.52 2.0913 2.5380 PUI0533 23 39 67.76 11.79 5.6137 1.1401 UPA120 18 35 64.05 17.31 5.2750 1.3358 UPOestr045 6 30 68.90 36.40 4.7200 1.1290 UPOestr046 6 35 64.40 32.22 4.6734 1.1983 UPDeut3244 10 39 67.64 21.84 3.0216 4.7589 UUDeut3206 10 52 68.67 22.15 2.9122 4.5098 UUDeut3437 10 29 71.62 19.86 3.0114 4.3796 UUDeut3524 10 38 72.76 15.15 2.8472 4.3009 UU
Note. IC � information content; PP � predictable pitch and predictable onset; PU � predictable pitch and unpredictable onset; UP � unpredictable pitchand predictable onset; UU � unpredictable pitch and unpredictable onset.
Thi
sdo
cum
ent
isco
pyri
ghte
dby
the
Am
eric
anPs
ycho
logi
cal
Ass
ocia
tion
oron
eof
itsal
lied
publ
ishe
rs.
Thi
sar
ticle
isin
tend
edso
lely
for
the
pers
onal
use
ofth
ein
divi
dual
user
and
isno
tto
bedi
ssem
inat
edbr
oadl
y.
33EXPECTANCY AND MUSICAL EMOTION

Appendix B
Results of CSTSA Analysis
(Appendices continue)
Table B1Cross-Sectional Time Series Analysis Modelling of Expectancy Ratings for All Melodies;Coefficients for Fixed Width 95% CIs and Variance of Random Effects
Model component Predictor Coefficient 95% CI
Fixed effects Intercept 0.307 [0.251, 0.364]Time 0.001 [0.001, 0.001]Musicianship 0.030 [0.014, 0.047]Pitch �0.002 [�0.002, �0.001]IOI 0.003 [0.003, 0.003]L1ratings 0.960 [0.953, 0.967]L2ratings �0.065 [�0.073, �0.058]L4ratings �0.061 [�0.069, �0.053]L5ratings 0.015 [0.006, 0.025]L6ratings 0.035 [0.023, 0.037]L15ratings 0.015 [0.012, 0.018]PitchIC �0.263 [�0.309, �0.217]L1pitchIC 0.486 [0.306, 0.666]L7pitchIC 0.123 [0.079, 0.167]L8pitchIC �0.059 [�0.103, �0.016]OnsetIC �0.731 [�0.794, �0.667]L1onsetIC 0.845 [0.769, 0.920]L2onsetIC �0.181 [�0.240, �0.123]L10onsetIC �0.084 [�0.129, �0.039]L12onsetIC 0.138 [0.092, 0.183]
Predictor Variance —
Random effects on individuals Intercept 0.000 —L1pitchIC 0.000 —
Random effects on melody ID Intercept 0.019 —L1pitchIC 0.245 —
Residual variance 0.421 —
Note. CI � confidence interval; IC � information content; ID � identity; IOI � interonset interval.
Thi
sdo
cum
ent
isco
pyri
ghte
dby
the
Am
eric
anPs
ycho
logi
cal
Ass
ocia
tion
oron
eof
itsal
lied
publ
ishe
rs.
Thi
sar
ticle
isin
tend
edso
lely
for
the
pers
onal
use
ofth
ein
divi
dual
user
and
isno
tto
bedi
ssem
inat
edbr
oadl
y.
34 SAUVÉ, SAYED, DEAN, AND PEARCE

(Appendices continue)
Table B2Cross-Sectional Time Series Analysis Modelling of Arousal Ratings for All Melodies;Coefficients for Fixed Width 95% CIs and Variance of Random Effects
Model component Predictor Coefficient 95% CI
Fixed effects (Intercept) 1.98 [�0.07, 4.03]Time 0.06 [0.06, 0.07]PU �3.42 [�5.77, �1.06]UP �0.50 [�2.86, 1.85]UU �4.53 [�6.88, �2.17]
Pitch �0.04 [�0.05, �0.03]IOI �0.03 [�0.03, �0.02]
L1ratings 0.95 [0.94, 0.95]L3ratings 0.01 [0.00, 0.01]L5ratings �0.05 [�0.06, �0.05]L6ratings 0.03 [0.02, 0.03]L15ratings 0.01 [0.01, 0.01]
PitchIC �16.6 [�17.7, �15.4]L1pitchIC 16.6 [15.5, 17.8]L6pitchIC 2.46 [1.31, 3.62]L7pitchIC 2.05 [0.70, 3.39]L8pitchIC �2.14 [�3.37, �0.92]L10pitchIC 1.86 [0.63, 3.08]L11pitchIC �4.43 [�5.77, �3.10]L12pitchIC 4.91 [3.57, 6.25]L13pitchIC �1.95 [�3.18, �0.72]L15pitchIC 2.18 [1.23, 3.13]
OnsetIC �11.4 [�12.9, �9.83]L1onsetIC 72.4 [48.2, 96.6]L3onsetIC 6.96 [5.26, 8.66]L4onsetIC �8.38 [�9.98, �6.77]L7onsetIC 1.55 [0.34, 2.76]L10onsetIC �6.81 [�8.12, �5.49]L12onsetIC 5.43 [3.73, 7.13]L13onsetIC 4.47 [2.55, 6.39]L14onsetIC �2.93 [�4.83, �1.04]L15onsetIC 3.09 [1.59, 4.58]
Predictor Variance —
Random effects on individuals Intercept 0.47 —L1onsetIC 2.94 —
Random effects on melody ID Intercept 13.5 —L1onsetIC 4,815.2 —
Residual variance 276.7 —
Note. CI � confidence interval; IC � information content; PU � predictable pitch and unpredictable onset;UP � unpredictable pitch and predictable onset; UU � unpredictable pitch and unpredictable onset; ID �identity.
Thi
sdo
cum
ent
isco
pyri
ghte
dby
the
Am
eric
anPs
ycho
logi
cal
Ass
ocia
tion
oron
eof
itsal
lied
publ
ishe
rs.
Thi
sar
ticle
isin
tend
edso
lely
for
the
pers
onal
use
ofth
ein
divi
dual
user
and
isno
tto
bedi
ssem
inat
edbr
oadl
y.
35EXPECTANCY AND MUSICAL EMOTION

(Appendices continue)
Table B3Cross-Sectional Time Series Analysis Modelling of Valence Ratings for All melodies;Coefficients for Fixed Width 95% CIs and Variance of Random Effects
Model component Predictor Coefficient 95% CI
Fixed effects (Intercept) 5.38 [3.56, 7.20]Time 0.03 [0.03, 0.04]Pitch �0.09 [�0.10, �0.08]IOI 0.16 [0.15, 0.18]L1ratings 0.92 [0.92, 0.93]L3ratings �0.02 [�0.03, �0.01]L4ratings �0.03 [�0.04, �0.02]L5ratings �0.01 [�0.02, �0.00]L6ratings 0.01 [0.00, 0.02]L7ratings 0.01 [0.00, 0.02]L9ratings 0.00 [0.00, 0.01]L15ratings 0.00 [0.00, 0.01]PitchIC �9.19 [�10.6, �7.72]L1pitchIC 11.2 [9.74, 12.6]L5pitchIC 2.62 [1.45, 3.79]L8pitchIC �3.26 [�4.72, �1.79]L9pitchIC 3.29 [1.74, 4.83]L11pitchIC �1.68 [�3.22, �0.15]L12pitchIC 2.91 [1.47, 4.83]L15pitchIC 1.28 [0.20, 2.36]OnsetIC �20.0 [�22.2, �17.9]L1onsetIC 48.5 [29.7, 67.3]L3onsetIC 4.05 [1.92, 6.18]L4onsetIC �4.02 [�5.90, �2.13]L10onsetIC �5.35 [�6.65, �4.05]L13onsetIC 3.59 [2.32, 4.86]
Predictor Variance —
Random effects on individuals (Intercept) 0.11 —L1onsetIC 0.12 —
Random effects on melody ID (Intercept) 22.2 —L1onsetIC 2,878.7 —
Residual variance 439.9 —
Note. CI � confidence interval; IC � information content; ID � identity; IOI � interonset interval.
Thi
sdo
cum
ent
isco
pyri
ghte
dby
the
Am
eric
anPs
ycho
logi
cal
Ass
ocia
tion
oron
eof
itsal
lied
publ
ishe
rs.
Thi
sar
ticle
isin
tend
edso
lely
for
the
pers
onal
use
ofth
ein
divi
dual
user
and
isno
tto
bedi
ssem
inat
edbr
oadl
y.
36 SAUVÉ, SAYED, DEAN, AND PEARCE

Appendix C
Results of Submodel CSTSA Analysis
Perceptual salience is explained in a variety of ways in thecurrent literature, and there is currently no consensus on the correctway to describe or measure it. Dibben (1999) describes salience inrelation to pitch register, parallelism, and stability, Collins, Laney,Willis, and Garthwaite (2011) and Huron (2001) in terms ofrepetition, Prince et al. (2009) in terms of complexity, defined bynumber of different possible values (i.e., different pitches or dif-ferent rhythmic durations), and Lerdahl (1989), as a set of condi-tions combining pitch register, timing, timbre, attack, note density,motivic content, and grouping. Outside of music, salience is de-fined by predictability and uncertainty (Esber & Haselgrove,2011); there are two possibilities: predictable content becomesmore (i.e., a cue becomes salient if it predicts a reward) or less(i.e., new information is more interesting) salient. Whereas weinterpret larger CSTSA model coefficients to reflect more salientpredictors, here we test the hypothesis that melodies with highpitch predictability (expectancy) and low-onset predictability (PU)have larger pitch coefficients than onset coefficients, and viceversa. To do so, four submodels of each of the three CSTSA
models optimized in the main experiment were created, one foreach category (PP, PU, UP, and UU) to compare coefficientsbetween models. Details of these models can be found in TablesC1–C3. A linear multiple regression model with stimulus predict-ability, lag type (pitch, onset), and rating type (expectancy,arousal, and valence) predicting the coefficients of these CSTSAmodels revealed no significant effects, F(3, 168) � .50, p � .67,F(1, 170) � 2.23, p � .13, F(2, 169) � .51, p � .59, respectively.There were also no interactions between category and lag type,F(7, 164) � .79, p � .59. Although there was no statisticallysignificant effect, we observe that the sum of lags of onset IC wereconsistently larger than the sum of lags of pitch IC for all catego-ries of stimulus predictability for arousal and valence models,whereas the sum of lags of pitch IC were slightly larger than thesum of lags of onset IC in the expectancy model. In conclusion,our hypothesis was not supported, as salience does not seem to berelated to expectancy. However, this study was not designed toinvestigate this question, which would be interesting to explore ina future study.
(Appendices continue)
Table C1Coefficients of Submodels for Expectancy Ratings
Modelcomponent Coefficient PP PU UP UU
Fixed effects Intercept 0.393 0.399 0.235 0.204Time 0.002 0.001 0.003 0.001Musicianship 0.035 0.031 0.024 0.031Pitch �0.001 0.002 �0.002 �0.002IOI 0.001 0.003 0.004 0.005L1ratings 0.777 1.00 1.01 1.03L2ratings 0.042 �0.100 �0.141 �0.110L4ratings �0.045 �0.075 �0.075 �0.035L5ratings �0.010 �0.031 0.031 0.021L6ratings 0.052 �0.007 0.039 0.008L15ratings 0.027 0.013 0.019 0.009PitchIC �0.192 �0.197 �0.142 �0.549L1pitchIC 0.197 0.461 0.604 0.842L7pitchIC 0.242 0.210 �0.021 0.008L8pitchIC �0.005 �0.169 0.030 �0.087OnsetIC �0.756 �1.26 �0.316 �0.769L1onsetIC 1.15 1.50 0.687 0.277L2onsetIC �0.258 �0.469 �0.231 0.078L10onsetIC �0.530 �0.169 �0.038 �0.153L12onsetIC 0.188 0.034 0.058 0.235
Random effects Participant—Intercept 0.002 0.000 0.002 0.000Participant—l1pitchIC 0.014 0.003 0.000 0.000MelodyID—Intercept
0.105 0.005 0.010 0.006
MelodyID—l1pitchIC
0.078 0.174 0.337 0.178
Residual variance 0.455 0.397 0.536 0.319
Note. IC � information content; PP � predictable pitch and predictable onset; PU � predictable pitch and unpredictable onset; UP � unpredictable pitchand predictable onset; UU � unpredictable pitch and unpredictable onset; ID � identity; IOI � interonset interval.
Thi
sdo
cum
ent
isco
pyri
ghte
dby
the
Am
eric
anPs
ycho
logi
cal
Ass
ocia
tion
oron
eof
itsal
lied
publ
ishe
rs.
Thi
sar
ticle
isin
tend
edso
lely
for
the
pers
onal
use
ofth
ein
divi
dual
user
and
isno
tto
bedi
ssem
inat
edbr
oadl
y.
37EXPECTANCY AND MUSICAL EMOTION

(Appendices continue)
Table C2Coefficients of Submodels for Arousal Ratings
Modelcomponent Coefficients PP PU UP UU
Fixed effects Intercept �5.66 0.77 �4.68 �3.45Time 0.25 0.04 0.24 0.05Pitch �0.02 �0.02 �0.10 �0.00IOI �0.03 0.00 �0.12 �0.00L1ratings 0.87 0.96 0.89 0.95L3ratings 0.02 0.01 0.01 �0.00L5ratings �0.05 �0.08 �0.03 �0.02L6ratings 0.03 0.04 0.04 0.01L15ratings 0.05 0.01 0.02 0.01PitchIC �18.3 �12.7 �11.6 �20.5L1pitchIC 19.8 8.85 14.5 24.1L6pitchIC 9.35 1.42 �1.65 0.32L7pitchIC �2.64 3.32 8.12 2.05L8pitchIC �0.20 �3.68 �3.71 �4.12L10pitchIC 6.03 0.66 2.15 0.08L11pitchIC �10.0 �6.78 2.50 �1.29L12pitchIC 6.54 8.64 �2.35 1.75L13pitchIC 0.08 �7.88 3.12 �0.45L15pitchIC 3.69 0.04 2.14 5.71OnsetIC �24.7 �21.1 3.90 �7.01L1onsetIC 78.4 91.4 123.5 17.4L3onsetIC 10.2 1.84 10.5 4.73L4onsetIC �15.0 �7.82 �7.92 �2.71L7onsetIC �3.79 7.51 0.01 �1.55L10onsetIC �24.2 �1.00 �6.14 �1.82L12onsetIC 13.5 �3.32 5.03 6.53L13onsetIC 6.51 11.9 1.76 0.47L14onsetIC �3.12 �6.33 �4.64 �0.81L15onsetIC 1.30 1.28 5.12 2.40
Random effects Participant—Intercept 0.44 1.17 0.12 0.72Participant—l1onsetIC 0.51 0.08 0.24 1.10MelodyID—Intercept
35.3 8.23 56.4 3.90
MelodyID—l1onsetIC
2,443.5 3,846.0 11,190.0 447.2
Residual variance 368.1 225.3 323.7 186.2
Note. CI � confidence interval; IC � information content; PP � predictable pitch and predictable onset; PU � predictable pitch and unpredictable onset;UP � unpredictable pitch and predictable onset; UU � unpredictable pitch and unpredictable onset; ID � identity; IOI � interonset interval.
Thi
sdo
cum
ent
isco
pyri
ghte
dby
the
Am
eric
anPs
ycho
logi
cal
Ass
ocia
tion
oron
eof
itsal
lied
publ
ishe
rs.
Thi
sar
ticle
isin
tend
edso
lely
for
the
pers
onal
use
ofth
ein
divi
dual
user
and
isno
tto
bedi
ssem
inat
edbr
oadl
y.
38 SAUVÉ, SAYED, DEAN, AND PEARCE
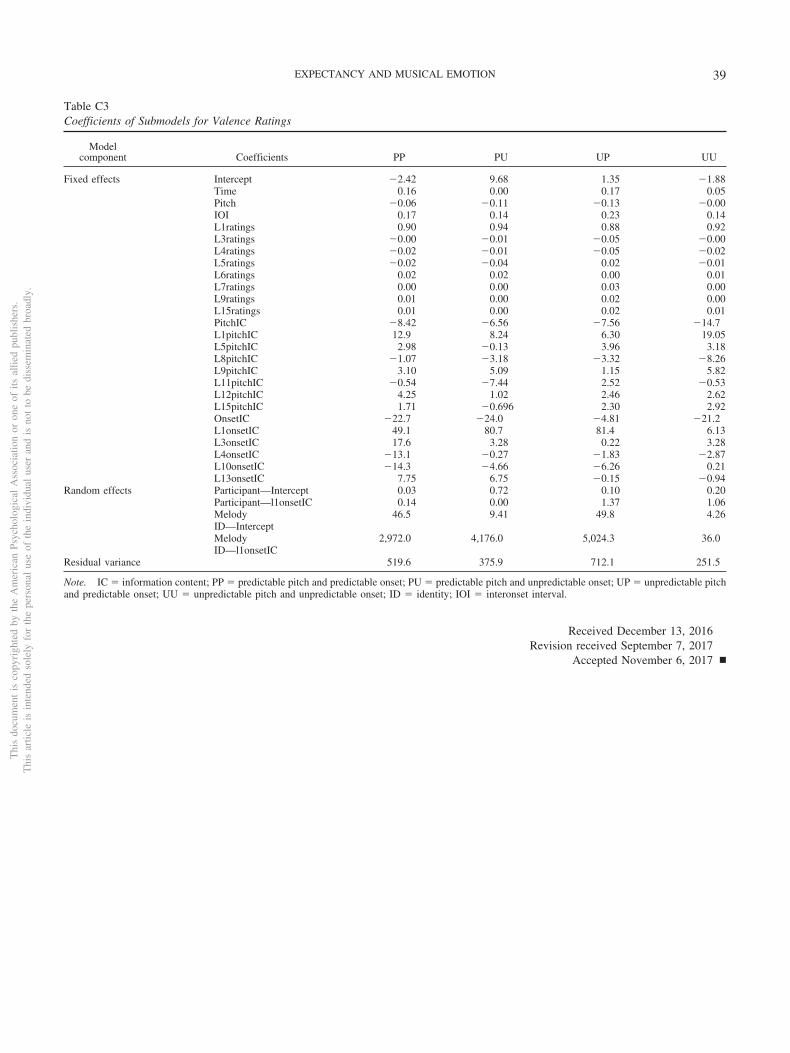
Received December 13, 2016Revision received September 7, 2017
Accepted November 6, 2017 �
Table C3Coefficients of Submodels for Valence Ratings
Modelcomponent Coefficients PP PU UP UU
Fixed effects Intercept �2.42 9.68 1.35 �1.88Time 0.16 0.00 0.17 0.05Pitch �0.06 �0.11 �0.13 �0.00IOI 0.17 0.14 0.23 0.14L1ratings 0.90 0.94 0.88 0.92L3ratings �0.00 �0.01 �0.05 �0.00L4ratings �0.02 �0.01 �0.05 �0.02L5ratings �0.02 �0.04 0.02 �0.01L6ratings 0.02 0.02 0.00 0.01L7ratings 0.00 0.00 0.03 0.00L9ratings 0.01 0.00 0.02 0.00L15ratings 0.01 0.00 0.02 0.01PitchIC �8.42 �6.56 �7.56 �14.7L1pitchIC 12.9 8.24 6.30 19.05L5pitchIC 2.98 �0.13 3.96 3.18L8pitchIC �1.07 �3.18 �3.32 �8.26L9pitchIC 3.10 5.09 1.15 5.82L11pitchIC �0.54 �7.44 2.52 �0.53L12pitchIC 4.25 1.02 2.46 2.62L15pitchIC 1.71 �0.696 2.30 2.92OnsetIC �22.7 �24.0 �4.81 �21.2L1onsetIC 49.1 80.7 81.4 6.13L3onsetIC 17.6 3.28 0.22 3.28L4onsetIC �13.1 �0.27 �1.83 �2.87L10onsetIC �14.3 �4.66 �6.26 0.21L13onsetIC 7.75 6.75 �0.15 �0.94
Random effects Participant—Intercept 0.03 0.72 0.10 0.20Participant—l1onsetIC 0.14 0.00 1.37 1.06MelodyID—Intercept
46.5 9.41 49.8 4.26
MelodyID—l1onsetIC
2,972.0 4,176.0 5,024.3 36.0
Residual variance 519.6 375.9 712.1 251.5
Note. IC � information content; PP � predictable pitch and predictable onset; PU � predictable pitch and unpredictable onset; UP � unpredictable pitchand predictable onset; UU � unpredictable pitch and unpredictable onset; ID � identity; IOI � interonset interval.
Thi
sdo
cum
ent
isco
pyri
ghte
dby
the
Am
eric
anPs
ycho
logi
cal
Ass
ocia
tion
oron
eof
itsal
lied
publ
ishe
rs.
Thi
sar
ticle
isin
tend
edso
lely
for
the
pers
onal
use
ofth
ein
divi
dual
user
and
isno
tto
bedi
ssem
inat
edbr
oadl
y.
39EXPECTANCY AND MUSICAL EMOTION