
Effects of physical parameters in mashing on lautering ...
284
This item was submitted to Loughborough's Research Repository by the author. Items in Figshare are protected by copyright, with all rights reserved, unless otherwise indicated. Effects of physical parameters in mashing on lautering performance Effects of physical parameters in mashing on lautering performance PLEASE CITE THE PUBLISHED VERSION PUBLISHER © T.M. Buhler PUBLISHER STATEMENT This work is made available according to the conditions of the Creative Commons Attribution-NonCommercial- NoDerivatives 4.0 International (CC BY-NC-ND 4.0) licence. Full details of this licence are available at: https://creativecommons.org/licenses/by-nc-nd/4.0/ LICENCE CC BY-NC-ND 4.0 REPOSITORY RECORD Buhler, Thomas M.. 2015. “Effects of Physical Parameters in Mashing on Lautering Performance”. figshare. https://hdl.handle.net/2134/16925.
Transcript of Effects of physical parameters in mashing on lautering ...

This item was submitted to Loughborough's Research Repository by the author. Items in Figshare are protected by copyright, with all rights reserved, unless otherwise indicated.
Effects of physical parameters in mashing on lautering performanceEffects of physical parameters in mashing on lautering performance
PLEASE CITE THE PUBLISHED VERSION
PUBLISHER
© T.M. Buhler
PUBLISHER STATEMENT
This work is made available according to the conditions of the Creative Commons Attribution-NonCommercial-NoDerivatives 4.0 International (CC BY-NC-ND 4.0) licence. Full details of this licence are available at:https://creativecommons.org/licenses/by-nc-nd/4.0/
LICENCE
CC BY-NC-ND 4.0
REPOSITORY RECORD
Buhler, Thomas M.. 2015. “Effects of Physical Parameters in Mashing on Lautering Performance”. figshare.https://hdl.handle.net/2134/16925.

Pllkington Library
•• L0':lghh.orough • University
Author/Filing Title .......... ~.~.~.'::~.~.} ..... T· .. t.'.: ................. .
Accession/Copy No.
Vol. No ................ . Class Mark ...................... . .........................
, , ~L 2000
I
o·


-------
Effects of Physical Parameters in Mashing on Lautering Performance
by
Thomas Martin BOhler
A Doctoral Thesis
Submitted in partial fulfilment of the requirements
for the award of
Doctor of Philosophy of Loughborough University
1. October 1996
© by T.M. BOhler 1996


Table of Contents .................................................................................................... i
Abstract ................................................................................................................... vi
Acknowledgement. .................................................................................................. vii
1. Introduction ........................................................................................................ 1
1.1. Background .......................................................................................... 1
1.2. Introduction and Objectives .................................................................. 1
2. Literature Survey ............................................................................................... 3
2.1. Introduction ........................................................................................... 3
2.2. Brewhouse Operations ......................................................................... 3
2.2.1. Raw Materials and their Influence on
~~ring ........................................................................................... 3
2.2.2. Milling ...................................................................................... 5
2.2.3. Mashing in Procedure (Pre masher design) ........................... 7
2.2.4. Mashing ................................................................................. : 9
2.2.4.1. Effects of Proteins on Lautering
Performance ............................................................................ 10
2.2.4.2. Effects of Polyphenols on Lautering
Performance ............................................................................ 14
2.2.4.3. Carbohydrate Material and Influences
on Filterability of Mash ............................................................ 14
2.2.5. Lautering Technique ............................................................... 17
2.2.5.1. The Lauter Tun Operation - Effects on
Performance ............................................................................ 18
2.2.5.2. Lauter Tun Operation - Influences on
Beer Quality ............................................................................ 20
2.3. Mechanical Forces and their Effects on Mashing and
Lautering ................................... , .................................................................. 21
2.4. The Impact of Agitation on Oxyge~ Uptake .......................................... 22
2.5. Effects of Increased Stirring Rates ....................................................... 23
2.6. Unit Operations in the Brewhouse ........................................................ 27
2.6.1. Theory of Mashing .................................................................. 27
2.6.1.1. Reaction Kinetics ....................................................... 27
2.6.1.2. Mixing and Agitation ................................................... 28
2.6.1.3. Shear in Fluids ........................................................... 31
2.6.2. Aspects of Filtration ................................................................ 32
2.6.3. Sedimentation ......................................................................... 33
2.6.3.1. Sedimentation Curve ................................................. 34

ii
2.6.3.2. Reduced Settling in Closed Systems ......................... 35
2.6.3.3. Sedimentation Model ................................................. 36
2.6.3.4. Compaction of Sediment... ......................................... 37
2.6.4. Cake Filtration ......................................................................... 38
2.6.4.1. Compressible Cake Filtration ..................................... 43
2.6.4.2. Compressible Cake Filtration with
Simultaneous Sedimentation ................................................... 45
2.6.5. Blockage Filtration .................................................................. 46
2.6.6. Washing of the Spent Grains Cake ....................................... .47
2.7. Discussion ....................................................................................... : .... 51
3. Materials and Methods ...................................................................................... 54
3.1. Raw Materials ....................................................................................... 54
3.1.1. Malt ......................................................................................... 54
3.1.2. Water ...................................................................................... 56
3.2. Equipment and Plants .......................................................................... 57
3.2.1. Pilot Mashing Equipment ........................................................ 57
3.2.1.1. Mashing-In ................................................................. 61
3.2.2. Pilot Lautering Rig .................................................................. 62
3.2.2.1. Design Specification .................................................. 64
3.2.2.2. Calibration Procedure ................................................ 66
3.2.3. Bench Scale Mashing ............................................................. 67
3.2.3.1. Torque Measurement in Laboratory
Scale Mashing Trials ............................................................... 69
3.2.3.2. Data Processing ......................................................... 70
3.2.3.3. Calculation of Shear Rates ........................................ 71
3.2.4. Bench Scale Mash Filterability Test ........................................ 72
3.2.4.1. Background ................................................................ 73
3.2.4.2. Information Content ................................................... 73
3.2.4.3. Apparatus/Material ..................................................... 74
3.2.4.4. Operation ................................................................... 75
3.2.4.5. Processing of Results ........................... : .................... 75
3.2.4.6. Accuracy of Analysis .................................................. 76
3.3. Brewing Procedures ............................................................................. 77
3.3.1. Milling ...................................................................................... 77
3.3.2. Mashing .................................................................................. 77
3.3.2.1. Process Routine ......................................................... 79
3.3.3. Lautering ................................................................................. 80

iii
3.3.3.1. Process Routine ......................................................... 81
3.4. Analyses ............................................................................................... 83
3.4.1. Viscosity Analysis ................................................................... 83
3.4.1.1. Measuring Principle ................................................... 83
3.4.1.2. Calibration Constant of the Glass Ball: ...................... 84
3.4.1.3. Analysis Procedure .................................................... 85
3.4.2. Filtrate Turbidity Analysis ........................................................ 85
3.4.3. Coulter Counter, LS130 .......................................................... 86
3.4.3.1. Diffraction Sizing ........................................................ 86
3.4.3.2. Measurement ............................................................. 86
3.4.3.3. Determining the Size Distribution ............................... 87
3.4.3.4. PIDS Sizing ................................................................ 88
3.4.3.5. Data Processing ......................................................... 89
3.4.3.6. Sample Preparation for the Laser
Sizer ................................................................................... 90
3.4.4. Coulter Multisizer 11 ................................................................. 90
3.4.5. Statistical Evaluation of Data .................................................. 91
3.4.6. Wet Sieving of Mash ............................................................... 92
3.4.7. Scanning Electron Micrographs .............................................. 92
3.4.8. Other Physical and Chemical Analyses .................................. 92
3.5. Conclusion ............................................................................................ 93
4. Results and Discussion ..................................................................................... 95
4.1. Initial Trials ........................................................................................... 95
4.1.1. Adjusting the Gap Setting of the Laboratory
Mill ................................................................................................ 95
4.1.2. Effect of Different Grinding Systems on Fine
Malt Particles ..................................................................................... 99
4.1.3. Comparability of Different Particle Sizing
Methods ............................................................................................. 100
4.1.4. Properties of Spent Grains Cake Layers ................................ 103
4.1.4.1. Particles and Size Distributions in the
Spent Grains Cake .................................................................. 104
4.1.4.2. Permeability of the Spent Grains
Cake Layers ............................................................................ 106
4.1.5. Change of Particle Size Distribution of the
Fines during Mashing ........................................................................ 108
4.1.6. Density of Fine Mash Particles ............................................... 110

iv
4.1.7. Viscosity of Mash .................................................................... 111
4.1.7.1. Viscosity Change During Mashing ............................. 111
4.1.7.2. Effect of Temperature on Viscosity ............................ 113
4.1.8. Industrial Scale Power Input.. ................................................. 114
4.2. Agitation Pilot Scale Trials .................................................................... 117
4.2.1. Valve Trials ............................................................................. 117
4.2.1.1. Introduction - Aims ..................................................... 117
4.2.1.2. Results ....................................................................... 118
4.2.1.3. Conclusions ............................................................... 125
4.2.2. Orifice Trials ............................................................................ 126
4.2.2.1. Aims ........................................................................... 126
4.2.2.2. Results ....................................................................... 128
4.2.2.3. Conclusion ................................................................. 128
4.2.2.4. Reproducibility Test ................................................... 129
4.2.3. Effect of Stirring on Mash Filtration
Performance - Laboratory Scale Trials .............................................. 131
4.2.3.1. Introduction ................................................................ 131
4.2.3.2. Aims ........................................................................... 132
4.2.3.3. Results ....................................................................... 132
4.2.3.4. Conclusion ................................................................. 140
4.3. Effects of Final Mashing Temperatures on Lautering
Performance ................................................................................................. 141
4.3.1. Introduction ............................................................................. 141
4.3.1.1. Aims ........................................................................... 142
4.3.1.2. Experimental .............................................................. 143
4.3.1.3. Results ....................................................................... 143
4.3.1.4. Conclusion ................................................................. 154
4.3.1.5. Applicability to Lautering and Practical
Mashing ................................................................................... 155
4.4. Particle Size Changes in the Fine Fraction of Mash
and the Effects on Lautering Performance ................................................... 157
4.4.1. Aim .......................................................................................... 157
4.4.2. Results and Discussion .......................................................... 157
4.5. Overall Conclusions ............................................................................. 160
5. Modelling of the Lautering Process ................................................................... 161
5.1. Description of the Process ................................................................... 161
5.1.1. The Effect of Temperature on MPS ........................................ 161

v
5.1.2. Effect of Temperature on Viscosity of the
Liquid Phase of Mash ........................................................................ 162
5.1.3. Sedimentation - The Cake Height after
Settling .............................................................................................. 165
5.1.4. Final Permeability of the Cake ................................................ 167
5.1.5. Effect of Pressure on the Final Cake Height... ........................ 169
5.1.6. Compaction of the Cake over Filtrate Volume ........................ 171
5.1.7. Effects of Cake Height on Permeability .................................. 173
5.1.8. Change of Extract with Time - Cake Washing ........................ 176
5.2. A Computer Model describing Lautering .............................................. 182
5.2.1. Development of the Computer Model ..................................... 182
5.2.2. Predicting Lautering Performance with the
Model ................................................................................................ 190
5.3. Conclusions .......................................................................................... 195
6. Conclusion ......................................................................................................... 195
6.1. General Comments and Overall Conclusions ...................................... 195
6.2. Implications on Industrial Brewing Practice .......................................... 196
7. Appendix ............................................................................................................ 198
7.1. Nomenclature ....................................................................................... 198
7.2. References ........................................................................................... 206
7.3. Glossary of Brewing Terms .................................................................. 215
7.4. Table of Figures ................................................................................... 221
7.5. Pictures and Electron Micrographs ....................................................... 229
7.6. Publications ........................................................................................... 245

vi
Abstract
This thesis investigates performance parameters of unit operations in the
brewery. It describes effects of the parameters temperature and agitation
during mashing on mash properties. Mainly two properties are influenced
by these parameters, the viscosity and the particle size distribution in the
fines. It could be shown that both factors have significant influence on
filterability of mash.
In pilot scale and laboratory trials particle size effects in mash were
investigated systematically. The importance of fine particles for lautering
performance could be confirmed and quantified.
The precipitation and aggregation of fine particles with increasing
temperatures in the mash could be monitored for the first time. It could be
shown that this parameter is not malt dependent. Mashes from different
malts react in the same way. In laboratory trials it could be proved that the
particle size parameter is more important than viscosity for filterability of
mash.
The parameters described above have been quantified and correlated with
mash filtration parameters. This work provided a basis for the
development of a computer model which describes mash separation in a
lauter tun.

vii
Acknowlegement
This thesis was carried out at the Process Innovation Department of BRF
International, Nutfield, England. I would like to thank all staff at BRF
International for their support during the experimental phase of this work
and the Director General for his permission to register and the financial
support. Special thanks to Steve Garland and Graham Gasson who
manufactured and assembled the pilot scale mashing and lautering plant.
I would also like to thank Or Malcolm McKechnie, Head of Process
Innovation, who waved many of the practical difficulties during this thesis
and Professor Charlie Bamforth, Director of Research, who made it
possible to register for a part time PhD. It was on Or McKechnie's
recommendation that Professor Wakeman accepted the supervisory task.
Further, I would like to thank Professor Wakeman for his excellent
supervision and guidance during the various phases of this thesis. The
meetings with Professor Wakeman and Or McKechnie at Exeter and
Loughborough enabled to re-focus on the aims of this thesis and made it
possible to develop solutions to various scientific and practical problems.
Last-but-not-Ieast I wish to thank my wife Almut for all the patience and
understanding she has shown during our separation, and particularly
during the write-up at Unna.
Unna, September 1996

1
1. Introduction
1.1. Background
This PhD Thesis was conducted as a part time research programme and
was supervised by Prof. Richard Wakeman (Exeter University and later
Loughborough University) and Dr. Malcolm McKechnie, Head of Process
Innovation was the external supervisor at BRF International (Brewing
Research Foundation). The experimental part of the programme was
carried out in part as a core research project of the Process Innovation
Department at BRF International, Nutfield, Great Britain. The basic subject
of this thesis was proposed by industrial members of the Process
Innovation panel meeting in April 1992. The main objective of the project was to investigate effects of agitation during mashing on wort filtration.
With the support of the Head of Department, Dr McKechnie, it was
possible to register with this project for a part time PhD at the School of
Engineering at Exeter University. The objectives of this work were adapted
by Professor Wakeman and Dr McKechnie to make it suitable for a postgraduate research subject. In summer 1995 Prof. Wakeman moved to
Loughborough University to take a Chair of Chemical Engineering. At this
time, registration was transferred to Loughborough University.
1.2. Introduction and Objectives
This work investigates the effects of processing conditions during mashing
on lautering performance. In beer brewing these two operations are
important for obtaining a suitable wort for good fermentation and for a high
quality beer. Both steps have crucial influence on the yield of the total
brewing process and on the overall performance in the brewhouse. Due to
this importance there has always been great interest in the brewing
industry to improve the knowledge base for these unit operations.
The following objectives were determined for this thesis:-
1. Investigation of effects of agitation on mash properties. Agitation due
to stirring and pumping could have various effects on the composition
of a mash. Soluble material from malt grist could be extracted to
different extents due to variations in mass transfer, due to forces

2
acting on the particles or due to enhanced enzymatic reactions. The
leaching of such soluble material could affect viscosity in a mash.
Particle attrition, due to mechanical forces would result in reduction of
the particle size distribution of a mash.
Both parameters, viscosity and particle size distribution, would
influence the filtration process in the lauter tun. The extent to which
these effects are combined in mashing and lautering and which of
these effects would be predominant should be clarified.
To make this work relevant for industry, the agitation levels in
industrial mashing should be determined and trials should use similar
range agitation levels.
This work should determine the influence of temperature on a change
of particle size distribution due to precipitation. Temperature in
mashing and lautering varies and this variation could affect the
precipitation of proteinaceous material.
2. It was also planned to develop a model for lautering. This would
require experimental data which is suitable for scale-up. Therefore, it
would be necessary to develop a pilot scale system which works
under similar conditions as the large scale plant.
In a computer model the different variables and effects on lautering
should be combined and quantified to enable prediction of these
process parameters.
As a starting point, a literature search should help to select suitable
experimental process conditions and to develop a suitable
experimental programme for the thesis.

3
2. Literature Survey
2.1. Introduction
The first part of this literature survey describes the operational steps in the
brewhouse such as milling, mashing and lautering. Parameters known to
affect the performance of the filtration step will be described. This will help
to establish standardised conditions during the experimental phase of this
study. In addition, influences of preceding processing steps (milling and
mashing) and other effects (such as raw materials) on mash separation
performance will be determined and described.
As it will be part of this work to investigate the role of agitation on filtration
performance, the effects which could play a role will be explored in detail.
The biochemistry of these operations is a major factor in this. However,
little information on mechanical and particle size effects on filtration
performance has been found in published literature. In the second part of
the survey, the theory of mashing and lautering will be described from an
engineering point of view.
In order to improve the understanding of the operations in the brewhouse,
the following flow diagram gives an overview and describes the functions
of each step (Figure 2.1). The special terminology used in brewing is
explained in the glossary, at the end of this work.
2.2. Brewhouse Operations
This chapter describes the operations milling, mashing and lautering with
a detailed view of their effects on filtration performance. A short discussion
on the effects derived from raw materials is presented first.
2.2.1. Raw Materials and their Influence on Lautering
Malt modification and use of adjuncts are very important for mash
composition and run off rate. Webster (1981) found that poorly modified
malts give high wort viscosities and produce large· amounts of fine
particles. Different concentrations of B-glucans and proteins in the mash

4
were observed for varying modifications of the malt (Home et al. 1993,
Narzif.l., 1985).
Flow Diagram
Malt Silo
Malt
Operation
I Milling
Equipment
Function
Malt Grist
Adjuncts Mash
Mashing
Mash Spent Sweet Wort Cast Grains Wort Kettle Wort
Lautering
2.1: Flow Diagram and Functions of Brewhouse Operations
Hot Trub Wort
Boiling
The calcium content of water can influence protein precipitation and pH
level of the mash; both have an effect on the filterability of the mash. Laing
and Taylor (1984) found a direct improvement of the run off rate with
increasing Ca content. This effect was thought to be mainly due to the
influence of lower pH-levels on the rate of proteolysis. Lower pH-values
improve the enzymatic action, and levels of total soluble nitrogen and the
ratio of FAN (free a-Amino Nitrogen) to TSN (Total Soluble Nitrogen) in
wort increase. The amount of fine particles in the filter bed is reduced,
which is the main reason for improved filterability. Lewis and Wahnon
(1984) also investigated this influence and found a near linear relationship
between Ca2+ addition and pH decrease. Calcium reacts with phosphates,
which affects the pH change.

5
2.2.2. Milling
This operation should prepare a grist composition, making suitable for the
succeeding stages of mash conversion and filtration. Milling is undertaken
by means of hammer or roller mills. For the separation of the mash with
lauter tuns a 6 roller mill is most commonly used. Figure 2.2 shows the
working principle of such a mill (Buhler, 1993).
Figure 2.2: Roller Mill (Buhler, 1993)
A: Precrushing roller cylinders
B: Husk removing roller cylinders
C: Grits milling roller cylinders
0: Screen box
E: Husks
F: Flour
G: Grits
H: Set of screens
M: Malt inlet
The coarser the milling, the higher will be the run off rate (Webster, 1981).
For the use of grist for lauter tuns, a compromise has to be achieved
between fineness of the grist and the preservation of the entire barley
husk. Fine milling, achieved in hammer mills, is advantageous for fast
enzyme reaction and solubilization of the extract in the malt (Wackerbauer
et aI., 1992). Muts and Pesman (1986) described this optimisation
problem as being between, on the one hand, the need for optimal
accessibility of the starch to amylolytic attack during mashing, and, on the

6
other, the improved solubility of unwanted materials like cell wall
components.
Richter (1993) examined different particle size distributions of the malt
grist on the rate of solubilization of extract. Extract increase is mainly
caused by hydrolysation of starch to lower molecular sugars, due to the
actions of a-amylase and ~-amylase. He found that finer milling did not
increase the reaction rate. The initial levels of extract in solution are higher
with finer milled grain, and these levels stay higher during the entire
mashing procedure. Finer grist enhances physical solubilization and water
absorption. The same observations were made for the concentration of a
amino nitrogen in the liquid phase of the mash. Meddings and Potter
(1977) also examined the influence of particle size on mashing: according
to Richter (1993), the rate of water uptake (absorption) and the rate of
solubilization of the malt extract increase with finer milling. The rate of
increase in "reducing power" (a measure for reducible compounds from
malt) also increases with fineness of the grist. The above factors are
favoured by fine milling, however, the husk fraction, with particle sizes
bigger than 1.25 mm is required as a filter aid in lauter tun operations. This
fraction assists to increase the permeability of the filter bed. These
conditions led to the use of 6 roller mills with 3 passages and screening
sieve sets (see Figure 2.2), which enables the production of large
amounts of fine grits (particle diameter bigger than 0.5 mm) with reduced
damage to the husk fraction. Further improvements can be achieved by
employing a conditioning stage: warm water or steam is used to increase
the water content of the malt by 1 - 2 % leading to reduced friability of the
husk and increased grist volume (Kraus et aI., 1973).
A different system for milling uses steeping of the malt before grinding it in
a two roller mill. In this wet milling procedure, the malt is in contact with
water for 60 seconds, which increases the water content in the husks to
about 20%. This can reduce the damage to the husk fraction (Herrmann,
1991), and the specific volume of the spent grains can reach 320 ml/100 g
malt.
Greffin et al. (1978) compared the recommended particle size distributions
(dry grist) of grist from various authors. In conclusion, and according to
MEBAK (Mittel-Europaische Brautechnische Analysen Kommission, 1987)

7
the distribution in Table 2.1 seems to be adequate for modern lauter tun
operation.
Table 2.1: Recommended particle size distribution of lauter tun grist
Sieve Fractions Particle size Weight [%]
Husks >1.27 mm 18
Coarse grits >1.01 mm 8
Fine grits I >0.54 mm 35
Fine grits II >0.25 mm 21
Grits flour >0.15 mm 7
Powder flour <0.15 mm 11
With milling of conditioned malt, the percentage of grist below 0.54 mm
and, in particular, the amount of the powder flour fraction can be reduced.
The fraction of fine grits I is increased. The specific grist volume changes
from 280ml/100g malt to 320ml/100g, which causes an increase of the
voidage of the spent grains filter cake (in the lauter tun) and consequently
a higher permeability (Narzill., 1990).
2.2.3. Mashing in Procedure (Pre masher design)
In order to obtain a homogenous distribution of the malt grist in water and
to minimise the risk of balling and dust formation, specially designed pre
mashers are used. Mashing in from the top into the mash conversion
vessel is the conventional method; the grist and the water-grist mixture is
fed by gravitation. Fig. 2.3 shows a recent design based on this principle
(McFarlane, 1993).
Designs for low oxygen uptake have been developed more recently, as
oxygen has been considered, to have a negative effect on the brewing
process and on the beer quality. Such premashers use screw conveyors
in combination with static in-line mixers and positive displacement mono
pumps (see Fig. 2.4).

8
__ Water
I I L ___ I
+ Mash
Figure 2.3: Vortex Pre-masher, (McFarlane, 1993)
Grist
Water ----""---liil
Mash
Premasher
Figure 2.4: Premasher System (Stippler, 1988)
The mash is fed into the mashing vessel from a bottom-entry inlet to keep
the mash surface in the vessel as smooth as possible. The agitator speed
is controlled by the liquid level. This technique minimises the oxygen
uptake by avoiding splashing of the mash. However, Lie et al. (1977)
found that the mashing in procedure has little effect on oxygen uptake, as
compared to the uptake in the mashing, lautering and boiling stages. It is
an additional advantage of this newer pre-mashing system, that mash

9
concentrations can be very high. Liquor to grist ratios of 2.3 : 1, which
allow the addition of hot water (for infusion mashing) during the mashing
process, can be easily achieved (Narzil1, 1992, Heyse, 1993).
2.2.4. Mashing
Mashing is basically an enzymatic conversion and extraction process.
Insoluble components in the malt are solubilised by physical and
enzymatic action. In addition, high molecular weight molecules are
degraded into smaller molecules. There are several different mashing
procedures in use, which can be categorised by the application of
temperature:
1. The simplest procedure is the so called "Infusion Mashing". Malt grist
and water are mashed at single temperature. A temperature of
between 65 and 68?C is kept constant during the entire process. This
allows the use of unheated vessels, and is mainly employed for well
modified malt. It was also very often used for experimental purposes,
because it allows easier modelling and gives better repeatability.
2. Another variation of the infusion mash is a temperature programmed
procedure, employing temperature rests between 40 and 78°C. The
advantage is an enhanced enzymatic conversion, resulting in higher
extraction yields. This method is most commonly used in breweries
world wide.
3. Slightly more complicated is the so called "Decoction Mashing". During
the mashing process, parts of the mash are boiled, in order to obtain
physical degradation of the malt grist. The so treated mash-parts are
pumped back to the remaining mash and heat it up. Enzymes from the
remaining, un-boiled mash are then degrading material which was
solubilised during the boiling stage. Up to three mash parts can be
boiled. This procedure is mainly used for less well modified malt.
Figure 2.5 shows a flow sheet for a typical mashing vessel.

CIP Rtn ....
tIP ~y
~-__ +-- STEAl<
-"'-______ -+1 _ _ FROI1 CER£AL .,.. COCKER
Figure 2.5: Flow sheet of a mashing vessel (Briggs, 1993)
10
For a close examination of the consequential effects of mashing on
lautering performance, it will be necessary to describe the reactions of
different chemical groups in detail.
2.2.4.1. Effects of Proteins on Lautering Performance
Proteinaceous material has major effects in mashing and subsequent
lautering. It is generally agreed, that proteins can affect filterability of mash
in a negative way. Most effects have been explained using chemical
mechanisms. Malt contains a wide range of different protein compounds.
The most important group of proteins for the lautering process contain
sulphur-aminoacids like cysteine or cystine as a dipeptide. The reaction of
these sulphuric compounds in proteins, in malting and in mashing has
been reported by various authors.
Baxter and Wainwright (1979) examined the hordein fraction of barley and
its behaviour in malting and mashing. They showed that a part of these
hordeins have a relatively high sulphur content (extractable with 70%
ethanol containing mercaptoethanol). Hordeins are broken down during
malting to smaller peptides and aminoacids by the action of enzymes, but
hordeins with higher sulphur content are broken down to a lesser extent.
Their proportion in the malt is therefore higher. During mashing, lower

11
molecular weight hordeins are extracted but large molecules remain
insoluble.
As large proteins contain a higher level of disulphide bonds, the total
amount of cystine in the spent grains is increased. Baxter and Wainwright
(1979) concluded that, during mashing, a rearrangement of disulphide
bonds occurs, forming more cross-linked material which precipitates and
accumulates in the spent grains. This protein material reduces the
filterability of mash in the lauter tun. They proved this theory by using
reducing agents (like metabisulphide, mercaptoethanol, cysteine, ascorbic
acid), which could improve the filtrate flux substantially. These reducing
agents help to keep the thiol groups unlinked. This work showed that
sulphur containing hordeins participate in protein-protein interactions and
that disulphide bonds play an important role in these reactions. It also
demonstrates the importance of the redox status of the mash.
Gel-proteins, another class of proteinaceous material, were investigated
by van den Berg et al (1981). Their name is derived from the gelatinous
layer they form after extraction with SOS-solution (Sodium Oodecyl
Sulphate) and centrifugation. Graveland et al (1979) found this fraction in
wheat flour and described it as a group of glyco-proteins. They have very
high molecular weights up to 106 Oaltons. The gel-proteins consist of sub
units with different molecular weight, which are linked to each other by
inter-molecular disulphide bonds. These bonds can be broken during the
reducing phase of the malting process, when oxygen is used by the
germinating barley. Another part of these gel-proteins is broken down by
enzymatic action, during the malting and the mashing process, into
smaller peptides and aminoacids.
Muts et al. (1984) reported a direct correlation between gel-protein
concentration in malt and the filtration rate in a lauter tun (see Figure 2.6).
The correlation coefficient for these trials was 0.854. They analysed the
top layer of the lauter tun filter cake and found 60% proteins, 20%
polysaccharides, 12% lipids and 8% residual material.

10.0
1.
., . . '.
\0
Gel·protein content Img/gl
Figure 2.6: Concentration of gel-proteins and effects on lautering performance
12
As described earlier, the mashing process, with its possible oxidative
environment can lead to re-formation of disulphide bonds with resultant
increasing molecular weights. These disulphide crosslinks of gel-proteins
lead to the formation of large protein complexes. They can also be linked
with gluteline or albumin fractions, either by molecular interchanges or by
enclosure. Due to their hydrophobic character this protein-fraction can
easily adsorb lipids. p-glucan, pentosans and small starch granules linked
to proteins can also become part of these complexes (Barett et al. 1975).
Van den Berg et al (1981) found that the amount of fine material in the
spent grains cake and the filterability are linked, with the filtration rate
being dependent on the amount of gel-protein in the fine fraction of the
cake.
The precipitation and aggregation of proteins causes the formation of a
sediment on the filter bed in the lauter tun (the so called "fines layer").
How this formation of fines is influenced by the mashing process has been
described by several authors.
Ferenczy and Bendek (1991) analysed this upper layer on the filter cake
and found, among carbohydrates and polyphenols, a protein content of
more than 60%. They observed that, in temperature programmed infusion
mashing, the total nitrogen content reduces with mashing time. The higher

13
molecular weight protein fraction is reduced to the greatest extent. These
authors describe two reasons for this reduction. For the first the
degradation, due to enzymatic work, and secondly the precipitation with
increasing temperatures while heating up from 50 to 70°C. In pure malt
they found a reduction of over 50% of protein with molecular weights
greater than 5000 Daltons. The precipitation and removal of proteins was
found to occur in two steps: the proteins precipitate, and then an
aggregation with polyphenols takes place.
Lewis and different co-workers also investigated the reduction of proteins
during mashing. Lewis and Oh (1985) state that the formation of
proteinaceous precipitate in mash appears to be unique to temperature
programmed mashing. This protein material dissolves during the protein
rest temperature (40 - 55°C) and precipitates even at low mashing
temperatures. Their studies showed that up to 10 % (w/w) of this
precipitate could be found in the spent grains. The effect of the amount of
protein particles was studied in a model lautering system, with glass
beads instead of mash spent grain. It was shown that added protein
material had a negative effect on the run off rate and that the aggregation
of these particles induced clogging of the filter bed.
Lewis and Wahnon (1984) observed, that the final amount of higher
molecular weight proteins « 5000 Daltons) in solution, after different
infusion mashing procedures, were the same. Proteins dissolved during
low temperature rests at 25 or 40°C, but were precipitated with increasing
temperatures. A single temperature stand infusion mash at 70°C did not
show this effect of release of high amounts of proteins into solution.
As proposed by various other authors (Narzir.., 1985, Ferenzcy and
Bendek, 1991), the reduction in higher molecular weight proteins could be
partially accounted for by enzymatic degradation. However, Lewis and
Wahnon (1984) prove in a mass balance, that the amount of protein
recovered from a specially prepared model lauter bed (glass beads
without spent grains) was equal to the reduction of proteins in the liquid
phase of the mash. That meant that the entire reduction of higher proteins
could be explained by precipitation. The size of proteinaceous particles
can have major impact on the filterability of the mash. Therefore factors
influencing formation and size of flocs will also influence filterability.

14
2.2.4.2. Effects of Polyphenols on Lautering Performance
Lewis and Serbia (1984) investigated the influences of polyphenols on
aggregation of proteinaceous particles, and found that this effect was
dependent on the presence of low molecular sized polyphenols. This
fraction, consisting of proanthocyanidins and tannoids, is described as
sensitive to oxygen, as Narzil:l. claims in several articles (Narzil:l., 1987,
Narzil:l., 1992, Narzil3. et aI., 1986). Hug et al. (1986) also confirm this
influence on the oxidation· of polyphenols. Lewis and Serbia (1984) found
that polyphenols react with protein only at comparatively high temperature
(i.e. 70°C) and only after an initial aggregation occurred. By inactivating
the polyphenols with PVP (Polyvinyl Pyrrolidone) in mash, a reduced
precipitation was observed. The oxidation due to addition of hydrogen
peroxide with peroxidase had a similar effect on the floc formation. The
haze which formed at 70°C, without a subsequent aggregation, made the
mashes unfilterable. Sodium-metabisulphite, a reducing agent, had a
reverse effect. It increased removal of protein. This again shows the
importance of the redox status in different circumstances.
2.2.4.3.
Mash
Carbohydrate Material and Influences on Filterability of
Barrett et al. (1973) found influences of particle size, and especially of fine
particulate materials, on the filterability of mash. The addition of wheat
flour caused an increased amount of fines on top of the spent grains bed.
The composition of this sediment is given with 30 - 70% carbohydrate and
30% protein, depending on the composition of the raw materials. The
carbohydrate fraction was found to consist mainly of glucose with
significant amounts of xylose, arabinose and galactose. The fines
examined by electron microscopy showed aggregates of small starch
granules, enclosed in a "matrix of amorphous material". Kano and
Karakawa (1979) also described the impact of starch granules in the spent
grains bed on wort run off. They considered small starch granules to be
implicated with lautering difficulties.
Barrett et al. (1975) analysed the composition of fine material in more
detail. In an all-malt mash they found the following fractions as percent dry
weight: aggregates of protein 42%, starch 29%, bound polar lipids 17%,
ether soluble, free lipids 5%, pentosane (arabinoxylane) 5% and ~-glucan

15
3%. These concentrations vary with different raw materials. However,
these results correlate well with the analyses described previously.
Carbohydrates are the main soluble fraction which produces extract.
These water soluble substances could cause changes in viscosity. Barrett
et al. (1973) demonstrated that the change in viscosity due to different
extract concentrations is negligible. Changes in extract (analysed as
specific gravity in the liquid) also seemed to have a very small effect on
run-off rate at lautering temperatures.
Lewis and Oh (1985) stated that "small differences in specific gravity,
especially at high temperature, had only a small effect on run off rate". It is
important to mention this, because different mashing intensities and grist
particle sizes can cause variations in extract levels.
More critical in their influence on filterability are higher molecular weight
carbohydrate compounds in the form of ~-glucan or pentosane. These
substances, also called gums, are originally located in the cell walls of
barley as a support material and they are partially soluble in water
(Schuster et al. 1967, Bamforth 1982). In addition to the soluble fraction
there are further amounts of insoluble ~-glucans in the hemicellulose
fraction of malt.
These components can have two effects on filterability of the mash. They
can increase the viscosity of the liquid phase of the mash (the wort) and
they can, due to their stickiness, change the composition of the filter bed
and reduce the pore size of the cake. Barrett et al. (1973) examined the
influences of (l,-glucan on the filtration rate and found the particle size
effect to be more important than the viscosity effect (see also Eyben and
Huipe, 1980). They also reported that aggregation of macromolecules of
~-glucan and pentosane with the protein of small starch granules result in
an impermeable deposit which blinds the filter bed and impedes wort run
off. These bonds with proteinaceous material are possible if, as Pierce
(1980) reports, glucan contains small amounts of proteinaceous material.
The work of Pierce also found increasing viscosity of (l,-glucan combined
with wort as compared to water. Eyben and Huipe (1980) state that
viscosity and ~-glucan content have no significant value in predicting the
filtration rate. They also mention, that the filtration depended closely on
the nature and size of particles present in the mash bed.

16
With improvement of l1-glucan analysis-techniques it became clear that
not only is the total amount of l1-glucan important, but also the molecular
weight of the components. Aastrup and Erdal (1987) carried out a mass
balance of l1-glucan with the calcofluor analysis .in the mashing and
lautering stage. This method detected molecules bigger than 50 000 Oa (Wainwright, 1990). They found about 50% of this high molecular weight ~
-glucan in the wort and about 30% in the spent grains, irrespective of the malt modification. With a single temperature infusion mash (65°C), the
release of l1-glucan into solution was constant over the mashing time and
the final amount was similar to other mashing procedures. Narzil1 et al.
(1990) observed a rapid increase in high molecular weight (>90 000 Oa)
fractions with lower modification of the malt and increasing mashing in
temperatures. The change of the particle size with fine milling increased both total and high molecular weight ~-glucan content; the high molecular
weight pentosanes were increased as well. Fine ground grist allowed the
release of more cell wall polysaccharides. In the case of undermodified
malt, higher amounts of l1-glucans were released. The a-glucan content
was found to be independent of the grist particle size. The improved
solubilization of finer grist changes the composition of wort, as these
components go into solution but are often not degraded during the
mashing process.
The relation between viscosity of the wort in laboratory analysis and the 11-
glucan content was investigated by Neumann and Zaake (1980). They
found a poor correlation coefficient of 0.37. This study also showed that an
improved modification of the malt is an important condition for a low content of cell wall components such as ~-glucan.
Similar results were published by Muts et al. (1984), who found the malt
modification to be a decisive factor for the mash filterability. Large
amounts of undegraded, high molecular weight l1-glucans and gel-proteins
were found the most important factor in determining beer filterability.
However, with lautering the gel-proteins were thought to play the more
important role, because the influence of l1-glucans on viscosity at lautering
temperatures (75 - 78°C) is very low.
Stirring can have a great impact on the solubilization of l1-glucan,
especially if the malt modification is very low (Jager et al. 1977). With all
malt worts these authors found higher viscosities in sweet wort of stirred

17
mashes. A correlation between viscosity of the first runnings and the total
lautering time was also found.
2.2.5. Lautering Technique
The lautering procedure separates wort from spent grains. This filtration
technique is carried out as follows.
Mash slurry is pumped from the mash conversion vessel into the lauter tun
(see Figure 2.7, describing a typicallauter tun). The mash is fed vertically
from bottom inlets. This allows the solids in the mash to distribute evenly
and settle on top of the false bottom without compacting. The bulk of the
particles sediment very quickly, in about 10 minutes under normal,
practical conditions. Smaller particulate material forms a layer of fines on
top of the spent grains cake. Filtration is started when all the slurry is
transferred into the lauter tun. The first turbid filtrate is recirculated to the
top of the filter bed, until an acceptable clarity of the filtrate stream is
reached. This recirculation helps in forming a suitable filter cake which is
able to restrain even small particles in the range of 5 to 10 jJm.
After the recirculation phase, the wort is drained until the liquid level is just
above the filter bed. This measure helps to maintain the buoyancy of the
spent grains cake. Hot water is then added on top of the filter cake to
wash it (sparging).
In order to increase permeability of the bed, the cake is raked by means of
knives. This procedure ensures that new channels are created in the cake.
The level (height) of the rake-knives in the bed is controlled by the filter
resistance. If high resistance occurs, the cutting is carried out at a very
small distance (about 3 cm) above the support bottom. During the washing
procedure the rake works continuously. The amount of water used for
sparging is predetermined by the extract content desired in the wort.
However, the cake has to be washed carefully enough to gain high
extraction yields.

- - ----------------------
1L ./ I .~
1 Vent stack
2 Cleaning in place
3 Sparging device
4 Spent grains blade adjustment
5 Lauter tun machine
6 Cutting knives
7 False bottom
8 Spent grains blade
-1---'-' .------------',
TTr \\.
n1 TTl JJ II J
13
-.l!
:: r /' .. 15
'6
9 Lauter tun support structure
10 Mash infeed
11 Spent grains flap
12 Spent grains collecting vessel
13 Wart collector ring pipe
14 Lauter tun drive
15 Lifting device
16 Wart pumps
Figure 2.7: Typicallauter tun with additional equipment (Ziemann, 1993)
18
The flow of the filtrate is maintained by the hydrostatic pressure difference
and the active suction of a filtrate pump. The pressure drop across the
filter cake increases with filtration time as the filter cake compacts. By
employing the raking procedure (which increases the porosity of the bed)
the filter resistance in the bed can be reduced.
2.2.5.1. The Lauter Tun Operation - Effects on Performance
Trials from Jager et al. (1977) showed, that the run off rate not only
depends on viscosity, but also on the structure of the cake. The ratio of
malt to adjuncts and milling regimes seem to be very important. Even with
worts of high ~-glucan content normal run off times can be obtained,

19
whereas maize as an adjunct (which is relatively glucan-free) reduced the
lautering time. This was reported to be influenced by the structure of the
bed.
With increasing depth, due to higher loading of the filter, the filtration rate
gets reduced (Webster 1978, 1981). During the filtration, the bed tends to
compact or tighten. This reduces the permeability with lower filterability as
a consequence. Raking is most commonly used to lift and open up the
bed.
In modern lauter tun operation, the mash is pumped in from the bottom of
the lauter tun (see Fig. 3.7). This accelerates stratification of particles
(formation of the bed) and reduces the oxygen uptake. Herrmann et al.
(1990) found this improvement to be due to the absence of mechanical
sedimentation forces. Compaction of the cake is avoided and the
permeability of the bed is much higher.
De Clerck (1957) described the sedimentation of the spent grains and the
formation of the bed. It is possible to identify three different layers. The
largest particles sediment fast and form a thin layer on the false bottom.
On top of that a mixture of husks and coarse particles settle, the main part
of the cake. The upper layer consists of very fine, light particles.
Huige and Westerman (1975) reported that with increasing initial flow
rates the permeability decreases further. This effect was already observed
empirically by De Clerck (1957).
In general, it is necessary to control the suction on the bed, not only at the
beginning of the filtration, because this influences the compaction of the
bed. Too high a suction could lead to a premature plugging of the filter
cake. The first runnings are recirculated on top of the filter bed until an
acceptable clarity is reached. If the wart gets too cloudy during lautering,
recirculation can be applied again.
Further steps which include raking, sparging and the removal of wort and
weaker wart are carried out continuously.
The raking machine is started, if the spent grains resistance reaches 80 -
100 mm water column (0.008 - 0.01 bar). At this point it is then lowered
according to the spent grains resistance to a minimal level of 3 cm above
the false bottom. The raking is used over the remaining period of lautering,

20
with an average speed of the rake of 0.8 - 2.5 m/min (Stippler, 1988,
Johnstone, 1992).
The addition of sparge liquor (hot water) of 75 - 76°C is started if the liquid
level is 1 - 2 cm above the spent grains cake. This is necessary to keep
the spent grains floating and avoid oxygenation of the spent grains
(Narzil1, 1985). The flow rate of the wash water is controlled by the run off
rate. This procedure allows the level in the lauter tun to be kept constant.
Oxygen uptake and a disturbance of the upper layer of the bed can be
avoided. Measures to ensure low oxygen uptake influence the design of
lauter tuns; the recirculated wort is fed into the vessel from underneath the
liquid level, and the sparge inlets are very close to the surface of the wort.
The wort is removed from below the false bottom by means of "extractor
pipes". The pipe diameter is designed to allow wort velocities of 0.1 - 0.3
m/so A bottom area of 0.9 m2 is covered by one pipe (Herrmann et al.
1990).
Currently, for the false bottom mainly stainless steel in the shape of
segmented plates is used. These plates have slots of 0.8 - 0.9 mm width,
providing a free area for the filtrate flow of 10%. Wedge wire constructions
are also used with the advantage of a higher open area (of 20%) and
higher mechanical strength. Salzgeber (1976) found that the free area had
little effect on the filtration rate. His investigation used slotted plates and
wedge wires with free areas of 10.7 - 31%. Wider gaps produced worts
with higher solids concentrations and didn't show improved filtration rate.
2.2.5.2. Lauter Tun Operation - Influences on Beer Quality
The lautering procedure has a major impact on the clarity of the wort
(Leedham et aI., 1975). The opinions concerning clarity of the sweet wort
are very different, and the influence of haze on quality of the final beer is
manifold, but the following aspect is most important:
Lipids from malt get into solution during the mashing process. In the mash
separation stage most of the lipids should be restrained. The lipids content
is closely related with turbidity of the wort. The higher the turbidity, the
higher the level of long-chain fatty acids (Dufour et al. 1986). Linolic acid
and palmitic acid have very high concentrations in the mash and are
therefore found in increasingly high levels in turbid wort (Narzil1 1885).

21
These compounds can affect the flavour stability of beer (Nielsen, 1973;
Zangrando, 1978). Ahvenainen et al. (1983) describes 50 mg/l as a
normal level, above the critical limit of 100 mg/l negative effects on flavour
and head retention value can occur. High amounts of haze can also have
negative effects on beer filterability. Below a lipids level of 5 mg/l,
fermentation may be slower.
In practice, haze, solids content and lipids level show a good correlation
for one filtration system. Modern lauter tuns, for example, can contain
levels of 20 mg/l of solids in the sweet wort. Englmann and Wasmuht
(1993) postulated that the solids content in sweet wort should be below
150 mg/l for good quality beers. Older lauter tuns produced solids levels of
100 - 200 mg/l or even higher.
2.3. Mechanical Forces and their Effects on Mashing and Lautering
The effects of malt quality and mashing on resultant filterability in lauter
tuns have been studied intensively. The influence of shear is very often
cited as being deleterious to the filterability. However, only few
investigations have been carried out on the effects of mechanical forces.
Most effects were described and quantified using chemical analyses. No
detailed information was found on effects such as particle attrition,
aggregation or precipitation.
Milling is the first step in the brewhouse, where mechanical forces are
acting on the process stream. This affects the particle size distribution of
the grist, which determines the permeability of the filter bed and
consequently the run off rate (Webster, 1981).
In the mash .conversion stage, mechanical forces can be induced with
stirring or with pumping (Leedham et aI., 1975; Schur et al., 1981). It has
been generally accepted that the agitation should be as low as possible.
However, a certain amount is unavoidable to achieve sufficient mixing to
establish a uniform temperature and an acceptable mass transfer rate.
This applies especially to the mashing in and heating up procedures.
Temperature stands can be carried out without or with intermittent stirring.
The design of mashing vessels and stirrers is based on establishing gentle
mixing conditions, viz. folding the mash with low speeds, providing mixing

22
without splashing and minimal surface movement. All brewhouse suppliers
fit their mashing vessels with specially designed paddle stirrers and dished
bottoms. The stirrers are fitted immediately above the bottom of the
vessel. Inclined blades are used to move the mash in a specific flow
pattern: In the centre of the vessel the mash is pushed downwards against
the heating pads. At the periphery the upward stream is also forced by the
stirrer, for better heat transport and suspension of the particles. A typical
mash stirrer is shown in Figure 2.8. Designs of different brewhouse
manufacturers vary slightly.
Figure 2.8: Mash Stirrer (Briggs, 1993)
Herrmann (1991) recommends the use of circumferential stirrer speeds
below 3 m/so A speed of 3 to 4 m/s is also used by Briggs (Robertson,
1990). The stirrer speed should be adjusted to follow the liquid level in the
vessel, in order to avoid vortices (Narzif.l., 1992). Stippler (1988)
recommends using a diameter of the stirrer (OR) of 0.7 times the vessel
diameter.
2.4. The Impact of Agitation on Oxygen Uptake
In industrial use, intensive stirring is always associated with an increased
oxygen uptake (Schur et ai, 1981). Lie et al. (1977) investigated the
influence of stirring on oxygen uptake, using a sulphite solution to monitor

23
the reaction of oxygen with the solution. They found that both brewhouse
design, and especially stirring, determine the oxygen uptake. Surface
movement caused by stirring or convection causes the transfer of the
oxygen saturated top layer into the liquid. Even with infusion mashing
procedures, where no mash transfer takes place, this could lead to high
oxygen uptake. Heating periods and periods with higher temperatures
(above 60°C) are sensitive to oxygen uptake. In addition, transfer of mash
(with decoction mashing or during transfer to the filtration unit) has a
further deleterious impact on the oxygen uptake. The absolute values of
oxygen consumption in mash were difficult to determine, because of
different rheological properties of the diluted sulphite solution used in
these trials. However, relative values permitted comparability of different
systems and procedures.
Schbffel (1978) describes the stirring of the mash and its influence on
oxygen uptake. Mass transfer between air and mash is marginally
increased with higher stirrer speeds, because the surface boundary area
is increased compared to a quiescent surface. This is due to both the
vortex in the stirred vessel and waves. Extreme aeration of the vortex can
occur if the air phase reaches down to the stirrer blades. Air is then
dispersed into the liquid. This effect is mainly dependent upon on the
liquid level above the stirrer and the stirrer speed. The influence of the
stirrer speed on oxygen uptake was also reported by Schur et al. (1981)
and Zurcher and Grul1 (1989).
2.5. Effects of Increased Stirring Rates
The impact of shear due to stirring of mash is often quoted in literature
(NarziI11985; Leberle and Schuster. 1956, van Waesberge 1988) but only
a few researchers have quantitatively investigated the effect of mechanical
forces in mashing on lautering performance. All investigations in this field
imply that it is very difficult to induce shear without getting oxygen uptake
(Van Waesberghe, 1988). Van Waesberghe found shear forces to be
more important than oxygen uptake for negative effects on filterability of
the mash. Combined effects were regarded most deleterious for lautering.
Some work has been carried out in applying different agitation levels to
the mash. Laing and Taylor (1984) used different speeds (0 - 80 rpm) of a
stirrer with 50 mm diameter. With increased mixing, the mash bed

24
permeability decreased (see Figure 2.9). At stirrer speeds above 60 rpm,
the permeability showed a strong and rapid decrease. This was explained
as the production of fines and husk breakage. Above a critical level, the
particles were broken up, rather than displaced. The influence of oxygen
in these trials has not been considered.
0.11
0.13
0.00 .
0.00
tl 20 :JJ 40 00 00 MEh Sinirg Rae [rpTj
70
Figure 2.9: Influence of stirring of mash on 'permeability'. The permeability displayed in
Laing and Taylor (1984) is not related to the filter area. Hence. the abolute
figures are not comparable with other cake permeabilities.
Jager et al. (1977) also analysed the influence of agitation (determined as
stirrer speed) on mash filterability and wort composition. These trials,
carried out in a pilot size brewhouse used stirrer speeds of 4.0 rpm in the
mash conversion vessel and 5.5 in the mash copper. For "extreme"
conditions stirrer speeds of 6.5 and 9.0 were employed. The authors used
three different malt modifications, adjuncts and enzymes in their trials. Analyses such as extract, viscosity, polyphenols, total soluble nitrogen, a.
amino nitrogen showed no significant changes for the two different
agitation rates. Only the B-glucan level in the sweet wort of undermodified
malt showed a dramatic increase (7 - 14 fold) with the higher agitation
regimes. More interesting than results from these analyses are the
influences of different malt modifications, different amounts of adjuncts
and different stirring rates on viscosity, run off rate and spent grains bed
permeability.

25
Viscosities of all-malt worts showed no significant changes with increased
stirring. Maize and rice dosage resulted in a reduction of viscosity with
increasing concentrations, whereas higher amounts of barley caused a
rise in viscosity. Undermodified malt treated with higher agitation resulted
in a longer lautering time. The use of maize and rice reduced the volume
of the spent grains cake in all cases. Increased agitation had similar
effects and caused a further reduction of the filter bed volume. Maize, in
particular, produced high amounts of fines on top of the cake and showed
an impaired filterability. Raw barley increased the filter bed volume and
showed, despite the higher wort-viscosity, an improved filterability.
These results define the importance of the particle size distribution of the
mash solids as a key factor for the permeability of the filter bed in the
lauter tun. They also highlight the effect of viscosity with its
interdependence on malt modification and the use of adjuncts and
. agitation in mashing. In comparison, the effect of agitation on changes in
the particle size distribution seems to be more important than the changes
in viscosity. It has to be noted that oxidation effects were not mentioned
and that oxygen uptake was not controlled.
Arndt and Linke (1979) determined the amount of stirring required for a
sufficient conversion (extraction) of the raw materials in a laboratory
mashing unit. This work has been carried out with an adjunct
concentration of 30% raw barley and enzymes for the degradation of
gums.
They used different stirrer speeds and analysed the change in extract,
nitrogen content, viscosity, pH, colour and the time for saccharification.
They found no substantial influence of agitation on extract level and
saccharification time. The amount of protein and a-amino-nitrogen was
found to increase with increasing stirrer speed. The viscosity values had
the lowest levels at 500 - 600 rpm in the laboratory mash tun; these values
were proposed to be suitable for scale-up. Details about the amount of
shear induced into the mash are not given. However, they reported that
excessive stirrer speeds influence the downstream processes (without
giving more details about oxygen uptake or particle size changes).
Uhlig and Vasquez (1992) proposed a method to measure the influence of
shear forces in the mash. With this method they assessed the amount of
non-hydrolysed fines and found increasing amounts with mashing time

26
and higher stirrer revolution rate. They also found that at temperatures
above approx. 60°C the higher speed of the stirrer blades had a negative
effect on the production of fines. This indicates that a component in the
mash which develops at this temperature level reacts very sensitively to
shear and is broken down into fine particles.
Leedham et al. (1975) and Curtis (1979) investigated the input of
mechanical forces into the mash with stirring or recirculation, by
comparing two breweries. They observed changes in particle size
distribution, filterability, viscosity, and f1-glucan content: Higher forces
produced more particles below 2.5 ~m diameter in beer, they reduced
filterability by membrane filtration and caused a release of more, higher
molecular weight ~-glucan. Mashes subjected to higher shear produced
higher pressure drops in the lautering stage and beer filtration was
negatively affected as well. These findings are confirmed by the results
reported by Uhlig and Vasques (1992).

27
2.6. Unit Operations in the Brewhouse
The second part of this survey describes the theoretical background for
the two main operations in the brewhouse, mashing and lautering. The
unit operations are mixing (agitation), sedimentation, filtration and washing
of filter cakes. These principles are described, using information from
brewing literature and related areas, as well as literature about unit
operations in chemical engineering.
2.6.1. Theory of Mashing
The mashing process extracts water soluble material from the malt grist.
Lower molecular malt components like sugars and peptides are instantly
soluble, but a transport from the grain into the liquid is required. Enzymatic
hydrolysis of higher molecular mass, insoluble components into soluble
components are a decisive part of this extraction. Therefore the malt
particles must be in aqueous suspension, where mixing assists quick
reaction rates.
2.6.1.1. Reaction Kinetics
Starch hydrolysis is the most important reaction in mashing. Due to the
action of 0.- and ~-amylase, insoluble starch is degraded into soluble
sugars. Physical factors are the dissolution of hydrolysed carbohydrates,
the dissolution of malt enzymes and the gelatinization of starch at a temperature of 55 QC (Marc et aI., 1982). In summary these reactions lead
to the formation of soluble extract, consisting of dextrins and sugars with
up to three molecular units.
Schur et al. (1975) investigated the formation of extract and fermentable
sugars as a summary reaction of several, different hydrolysis enzymes.
They describe the kinetics of formation of soluble material (extract) by a
first order reaction:
2.1
Where E is the extract level in the resulting wort for the reaction time t, E",
the resulting extract level for t = 00, and k is the reaction rate constant. By

- - - - ----- --------
28
plotting equation 3.1 in a logarithmic scale, it is possible to derive the
reaction rate constant k from the slope of the line.
In Eoo - E =-kt E
2.2
Schur et al. (1975) obtained a maximum k value of 2.52x10⁻² min-1 for a
reaction temperature of 60°C.
The activation energy A for the production of extract in mashing can be
calculated from the Arrhenius equation:
A
k = ce RT 2.3
For a temperature range of 50 to 55°C an activation energy of A = 4.7
kcal.mol-1 results, for 55 to 60°C the activation energy is A = 7.2
kcal.mol-1. From these findings Schur et al. derived that for coarse ground
grist diffusion is the rate limiting step. For higher temperatures, above 60°
C, they observed negative values for the activation, which they found was
due to heat inactivation of enzymes. However, remaining enzyme
activities seemed to be high enough to transfer starch granules (which do
not gelatinise until temperatures higher than 60°C are reached) into
soluble extract. This explains why the maximum extract yield was reached
at 67°C.
2.6.1.2. Mixing and Agitation
The agitation of mash has two main aims:
1. to improve mass transfer by providing a homogeneous particle
distribution in the suspension. This improves extraction of malt grist
by transfer of extract from the particle surface into the liquid. An
improved mass transfer also provides better enzymatic reaction rates
by reducing local high concentrations of product in the solution (Arndt
. and Linke, 1979)
2. to provide an even temperature distribution in the mash, keeping its
variation as little as possible (in practice: !If < 0.5 °C). It is also
important to prevent the development of fouling and stagnant layers,
because ~hese layers have low thermal conductivities, reducing the
rate of heat transmission into the liquid.

29
Mash is normally heated using steam jacketed vessels. Heating areas and
steam pressures have to be designed to provide heating up rates in the
mash of at least 1 °C·min-1. The overall heat transfer coefficient from the
heating medium to the mash is influenced by the convection on the steam
side, the conduction in the vessel wall and forced convection in the mash
(see Figure 2.10). The natural convection in the mash is supported by the
agitation, which is, especially during heating, very necessary.
~team I
Temperature Profile:
Convection
-.........-.
c:
! 8
\,,-;--i _ Laminar; Turbulent Flow
Film
, Forced Convection
Figure 2.10: Heat transfer in a mashing vessel
The heat transfer from the wall of a vessel into the mash can be
described, using the equation formulated by McCabe et al. (1985), for heat
transfer with anchor stirrers:
2.4
The heat transfer coefficient hj for the heater-liquid surface is obviously
dependent on the Reynolds number defined by
2.5
in stirred containers. In addition, the coefficient K and the exponent a are
also dependent on the Re number. This indicates the importance of the

30
flow regime in the vessel for the heat transfer from the inner wall of the
vessel into the mash. McFarlane (1993) mentions the heat transfer on the
mash side being "proportional to the Reynolds number raised to the power
of 0.8 under turbulent flow conditions".
However, Schoffel's (1978) experiments showed the heat transfer from the
wall was not the dominant process in determining temperature use in the
mash. For a stirrer speed increase of 50%, the transfer coefficient is
increased by 30%, whereas the time to attain the desired temperature is
cut just by 15%. The influence of the diameter of the stirrer is regarded as
more important than the stirrer speed, for improved mixing and heat
transfer (Schoffel 1978).
Suspending the malt grist in the liquor, described as the second task of
agitation, is as important as the heat transfer. Stirring should provide good
transport conditions for transfer of solubles from the particle into the liquid
phase. Without mixing, the mass transfer from the malt particles into the
liquid can be described by molecular diffusion. The force creating a mass
flow into the liquid phase is the difference in concentration. Fick's Law
describes this situation:
. I'1c m=-D
I'1L 2.6
The application of turbulent flow increases the mass transfer significantly:
in addition to the molecular diffusion coefficient D, a coefficient E,
describing the transport created by turbulence, can be added to the
equation:
. I'1c m=-(D+E)
I'1L 2.7
High mass transfer rates m are obtained, if all particles are in direct
contact to the surrounding liquid. This state is reached if all particles are
whirled up in the liquid by a turbulent flow. Einenkel and Mersmann (1977)
defined the minimal stirrer speed required to comply with this criterion:
with
1
(Fr PH v )3 = KRem
I'1pvocv
2.8
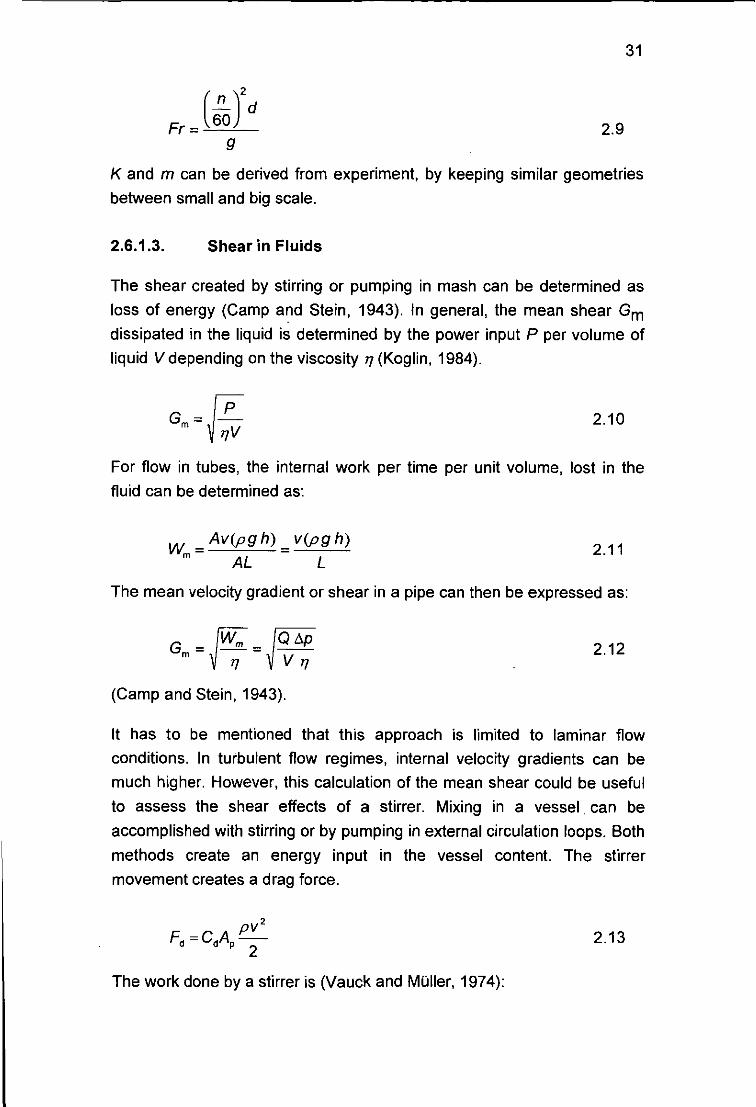
31
2.9
K and m can be derived from experiment, by keeping similar geometries
between small and big scale.
2.6.1.3. Shear in Fluids
The shear created by stirring or pumping in mash can be determined as
loss of energy (Camp and Stein, 1943). In general, the mean shear Gm
dissipated in the liquid is determined by the power input P per volume of
liquid V depending on the viscosity 17 (Koglin, 1984).
G = /P m ~-;;v
2.10
For flow in tubes, the internal work per time per unit volume, lost in the
fluid can be determined as:
w = Av(pg h) = v(pg h) m AL L
2.11
The mean velocity gradient or shear in a pipe can then be expressed as:
Gm = ~Wm = ~Q D.p 17 V 17
2.12
(Camp and Stein, 1943).
It has to be mentioned that this approach is limited to laminar flow
conditions. In turbulent flow regimes, internal velocity gradients can be
much higher. However, this calculation of the mean shear could be useful
to assess the shear effects of a stirrer. Mixing in a vessel. can be
accomplished with stirring or by pumping in external circulation loops. Both
methods create an energy input in the vessel content. The stirrer
movement creates a drag force.
2.13
The work done by a stirrer is (Vauck and Muller, 1974):

32
2.14
The mean shear induced in the liquid in a vessel is then:
2.15
Modern mash-stirrers follow the requirements for low shear input into the
mash: they are built with large diameters, using low rotation velocities an9
small projectional areas of the blades. For practical assessment of stirrers,
the work input for any kind of stirrer device may be computed from the
torque measurements made on the rotating shaft.
2.6.2. Aspects of Filtration
The unit operation of cake filtration can be divided into individual
processes which describe and structure the wide range of influences on
filtration performance (Klotz and Dallmann, 1984). The following lays out
the different influences on the filter cake.
Processes in the filter cake:-
• Cake formation
Cake structure is dependent on properties of particles in the slurry
such as particle size distribution, differential density between liquid and
solid phase, shape of particles, solids concentration in the slurry and
differential pressures throughout the cake.
• Fluid flow through the cake
This most important micro-process contains the flow regimes inside the
cake at a given cake structure.
• Cake compression
This effect describes the strength of the cake and its consolidation
behaviour during filtration. It covers the change of pore shape
distribution due to the liquid flow, which results in a reduction of
voidage.
• Blockage
This determines the change of the filter cake structure due to transport

of small particles into the cake. Such particles can attach to the walls
of filter pores or seal filter pores of the cake. Both principal
mechanisms cause an increase in resistance of the cake.
Processes in the slurry:-
• Particle sedimentation
33
Particles with different density to the surrounding liquid sediment due
to gravitational forces. As described in section 2.6.3 sedimentation can
have significant influence on the formation and structure of the filter
cake.
• Particle transport due to fluid flow
This microprocess describes the change of particle concentrations in
time and place due to laminar or turbulent flow patterns, induced by the
filtrate flow, sedimentation or raking of the cake.
2.6.3. Sedimentation
Solids in the mash slurry settle on the false bottom plate of the lauter tun,
forming the active filter material. The false bottom is mainly designed as a
support, only restraining particles bigger than the slot diameter of about
0.6 mm.
Solids concentrations in the mash are typically greater than 20%. The size
of particles ranges from approximately 5 IJm to 2 mm with a mean particle
size of 1.6 mm (Chladek, 1977). However, this varies with milling
conditions and previous operational steps. The density of the particles can
also be expected to be different. These conditions make it inaccurate to
use sedimentation models, derived from Stokes law, which assume
uniform particle sizes and dilute suspensions.
Fitch (1962) found that sedimentation with high particle concentrations
and solids of different density, size and shape settle in zones (bands) with
. mixed distribution (sludge line settling). This leads to sedimentation
behaviour in separate bands. If the range of particle size is not more than
about 6: 1, the interface between the band of the suspension and the
particle free liquid zone is very distinctive (Coulson et al. 1985). In a mash
the particle range is about 400: 1, which means the separation of bands is

34
less distinct, but sludge line settling could still be appropriate for
describing this behaviour.
For activated sludge some interesting aspects of sedimentation behaviour
have been reported. Similarities with mash sedimentation are evident and
therefore some aspects are listed below.
Lower layers of activated sludge reduce the sedimentation velocity by
supporting upper layers. The reduction can be substantial, especially with
higher concentrations and for liquid levels below 2 m height (Dick and
Ewing, 1967).
For the same medium, diameters of cylindrical vessels greater than 90 cm
were necessary to avoid influences from walls. Smaller diameter cylinders
gave higher sedimentation velocities. This was caused by the lower drag
force on the walls (Horn, 1988).
2.6.3.1. Sedimentation Curve
Concentrated suspensions which settle in concentration bands can be
described by a sedimentation curve (see Figure 2.11).
height above the base
h 0 a Constant
o
sedimentation
velocity
b
, ,
- Interface clear liquid to settling band
Decreasing sedimentation velocity
p . c d
Sedimented band timet
Figure 2.11: Sedimentation curve (after Horn, 1988)
The height of the falling clear liquid/slurry interface is plotted against time.
Three different areas can be determined:

35
1. The interface settles at the beginning at a constant rate and sediment
is accumulated on the bottom of the container. (a-b)
2. The sedimentation rate decreases because the increasing particle
concentrations hinder the settling (b-c).
3. When the sedimented band and the settling band meet each other,
the rate of fall decreases further. (This point is called "critical settling
point" (point c)). Subsequent sedimentation (c-d) results in a
consolidation (compaction) of the sediment. Liquid is forced upwards
and the particles contact one another, forming a bed.
2.6.3.2. Reduced Settling in Closed Systems
Sedimenting particles in closed systems cause a liquid flow opposite to
the sedimentation direction. This counterflow reduces the sedimentation
velocity.
It can be seen from a balance of the volume flow over a differential area in
vertical direction, (see Figure 2.12)
+
Figure 2.12: Settling of particles in closed systems
2.16
that the volume flow of particles dVp replaces the liquid flux dVL .
This can be written as
2.17

36
with wpR, the sedimentation velocity of particles in a closed system and
wL, the average liquid velocity over the cross section.
With the porosity Ei the fraction of the differential element taken by the
particles can be expressed as
dAp -=1-Ei dA
and the fraction used by the liquid as
dAL -=Ei dA
Combining equations 3.17,3.18 and 3.19 results in: .
W L 1-Ei -=--
2.18
2.19
2.20
The free particle velocity wp is reduced by the upwards streaming liquid:
2.21
Hence, it is possible to express the ratio of the two different sedimentation velocities:
2.22
This shows that, for low porosities (or high particle concentrations), the·
sedimentation velocity is considerably reduced.
In the lautering procedure the filtrate recycling on top of the bed is started
at the beginning of the settling, which minimises or avoids an upwards
flow and increases the sedimentation rate.
2.6.3.3. Sedimentation Model
If the sedimentation velocity is only dependent on the concentration of the
suspension, it is possible to determine the characteristics of the
sedimentation velocity from different slurry concentrations.

37
Using a mathematical model for the sedimentation process (Kynch, 1952),
the characteristics of the sedimentation velocity for a range of
concentrations can be extrapolated from just one sedimentation curve
(Talmage and Fitch, 1955).
For the application of this model the following basic assumptions have to
be correct (Coulson et ai., 1985):
1. particle concentration is uniform across any horizontal layer
2. wall effects can be ignored
3. there is no difference in settling as a result of differences in particle
shape, size or composition
4. the velocity of the falling particles depends on the local concentration
of particles
5. the initial concentration is either uniform or increases towards the
bottom of the suspension, and,
6. the sedimentation velocity tends to zero as the concentration
approaches a limiting value corresponding to that of the sediment
layer deposited at the bottom of the container."
From brewhouse practice, it is well known that in lautering differentials in
settling occur due to the size or shape of the particles (see 2.2.5.1).
Therefore the use of this sedimentation model would be restricted, or even
inappropriate.
2.6.3.4. Compaction of Sediment
Higher concentrations of slurry or sedimented particles in lower layers
close to the bottom behave differently from the way described above. The
particles are touching each other and are supported from the bottom of a
container. The weight of the particles causes a compression of the
sediment. For a limited particle concentration the sedimentation behaviour
can be described by compression.
For the determination of the sedimentation rate from the sedimentation
curve, it is necessary to know the point when compression of the entire

38
sediment occurs. The compression point is reached when the interface
liquid/suspension reaches the consolidated sediment layer.
If this point can't be detected visually or directly from the graph, it is
possible to determine this point by a geometrical construction (see Figure
2.11, Horn, 1988).
A balance of the static forces acting in this bed can be described as follows (Horn, 1988), (see Figure 2.13):
+
92sV dx
Figure 2.13: Forces exerted on particles in compacted beds
In comparison with band sedimentation, (where the pressure Ps is zero)
the pressure exerted by the solids Ps reaches high values, which makes it
impossible to neglect these forces in modelling.
It could also be an important factor that bridging of the solid aggregates
increases the influence of wall effects (Michaels and Bolger, 1962).
2.6.4. Cake Filtration
This section describes basic theory of .cake filtration. Operations relevant
for lautering are described in more detail.

39
Flow through the cake
The fluid flow through a filter cake can be visualised as a flow of liquid
through a packed bed of solid bodies with regular pores.
Darcy's basic equation relates the average flow velocity u of a filtrate of
viscosity Tt through a filter bed with thickness L to the driving pressure !lp.
u=Kb.P 1]L
·2.24
The permeability of the bed K can be expressed as cake resistance R
with:
2.25
With this relationship the Darcy equation can be written in the form:
2.26
Under experimental conditions the superficial velocity u will be determined
as filtrate volume per unit time and unit filter area
1 dV u=--
A dt 2.27
Equation 3.26 becomes
dV b.pA -=--dt 1]R
2.28
The overall resistance R can be divided into individual resistances, the
resistance of the medium Rm and the cake Rc (Ruth, 1946). Equation 2.26
becomes:
2.29
The medium resistance is usually assumed to stay constant over the
filtration time, however, compression of the medium or particle penetration
into the pores could increase this parameter.

40
The cake resistance is expected to increase throughout the filtration run,
because additional material settles on top of the filter cake. The flow paths
through the filter get longer. This increase is proportional to the mass of
dry solids deposited on the cake. The proportionality constant a is defined
as the specific cake resistance. The dimensions of a are [m.kg-1)
representing a fictional pore length per unit mass of cake.
W Rc =a-=aw
A 2.30
with the total mass of dry cake deposited W or w the mass per unit area.
W is related to the filtrate volume V by a material balance.
If V volumes of filtrate have been filtered, a dry mass W has been
deposited as filter cake. This cake has a moisture content m defined by
the mass ratio:
mass of wet cake m=-------
mass of dry cake 2.31
The mass fraction of solids in the feed slurry (mash) is:
mass of solids s = ---:--:--mass of slurry
2.32
With these relations, the ratio of the volume of filtrate to the dry mass of
cake can be expressed as:
pV 1-s -=--(m-1) wA s
2.33
This can be rearranged to express the cake dry solids mass by the filtrate
volume.
w = ps V = cV 2.34 1-ms
Where c is the concentration dry solids in the slurry, corrected for the
presence of liquid in the cake.
With equation 2.30 and 2.34 equation 2.29 can be rearranged to:

L1p U=----=---
V 77ac -+ 77Rm
A
41
2.35
This equation relates the filtrate flow velocity to the pressure drop and the
resistances of the medium and the cake. The change of the cake
resistance is expressed by the filtrate volume and the corrected dry solids
concentration.
The flow velocity is related to the filtrate rate dVldt by:
1 dV U=-- 2.36
A dt
Inserting 2.36 in 2.35 gives the basic filtration equation:
1 dV A tlp = 2.37
Carman and Kozeny
In Darcys law (see equation 2.24) the characteristics of the filter bed with
regard to fluid flow are described by only one parameter, the permeability
K.
Carman and Kozeny's model specifies this permeability further, by
introducing geometric properties of the packing.
The laminar flow through a porous bed explained by Darcy's Law is
closely analogous to the laminar flow through a capillary tube described by
Poiseuille's law (Carman, 1937).
d 2 L1p u=---- 2.38
3277 L
where L is the length of a straight circular capillary with a diameter, d.
Kozeny introduced the porosity of a packed bed in parcy's equation. He
expressed the permeability using porosity 8, particle surface per unit
volume of packed space S and the Kozeny constant Ko. Carman replaced
. the surface area S using the following relationship for spherical particles
with a diameter d.

s = 6 (1- &) d
in Kozeny's equation
42
2.39
2.40
which is known as the Carman-Kozeny equation, a more detailed form of
Darcy's law. It can be written in a more general form as follows:
&3 l1p u = -:-:--~-:----:o
KoS~ (1- &)2 ryL 2.41
It shows the influencing factors such as particle size, porosity and particle
shape on the permeability of a filter cake.
Porosity is the most important factor on the permeability. It is largely
dependent on the packing structure of the bed. That is the arrangement of
particles in relation to each other.
Particle size effects on cake permeability can. be explained by two
influences:
1. permeability increases with the square of the particle diameter (as
shown, for spherical shaped particles, in equation 2.40)
2. in particle distributions with a wide dispersity, smaller particles will
reduce the porosity by occupying the voids between larger particles, thus
reducing porosity of the cake due to denser packing.
The specific resistance of the cake can be related to the porosity by
combining equations 2.41, with 2.35:
It shows that the specific resistance is very sensitive to changes in
porosity.

43
Relationship between cake thickness and filtrate volume
The mass of dry solids deposited on a unit area of filter can be related to
the thickness using the average porosity of the cake Bav and the density Ps
of the solids
The filtrate volume is related to the thickness by:
v = 1-ms Ps (1- BaJAL S P
The ratio of wet to dry cake mass is related to the porosity by:
m=1+ P Bav
Ps (1- Bav)
Using equation 2.45 in 2.44 leads to:
2.6.4.1. Compressible Cake Filtration
2.43
2.44
2.45
2.46
For compressible cakes, the porosity is affected by the pressure drop
across the cake. The influence of different pressures have been
investigated using a compression permeability cell in which a cake in a
cylindrical tube is subjected to mechanical pressure by a piston. The
change of E or a are recorded for different pressures. From these
investigations empirical relationships like the Lewis equation
a=aoLlpn 2.47
were proposed (Tiller and Crump, 1985) to relate the specific resistance to
the pressure drop. With an and Ba specific resistance and porosity at unit
applied pressure drop and the compressibility index nand A. The porosity
relation can be expressed in a similar way:
2.48

44
n and A, are zero for non compressible cakes, for compressible cakes
values range between 0 and 1, sometimes up to 2. aa and Co have a
mathematical meaning but no physical significance.
As a practical working relationship to describe compressible cake filtration
it is possible to replace a in equation 3.37 by the average specific
resistance over the cake aav.with
2.49
With this functional relationship equation 3.37 can be written as:
1dV A LIp = ----'----- 2.50
Constant pressure operation
When LIp is maintained constant during filtration equation 3.37 may be
integrated (with .limits 0 to t and 0 to V; c, Rm, a are constant)
V 2A2L1p = -----'---- 2.51 t aCT/V+2AT/R
For the practical evaluation of filtration performance in constant pressure
experiments it can be useful to transfer equation 3.50 to the reciprocal
form:
2.52
or in the integrated form
2.53
It can be seen that if Kl and K2 are constant (basic assumptions for the
integration) a straight line can be obtained by plotting W versus V or dtldV
vs. V, with K1 the slope of the line and K2 the intersection on the ordinate.
If the medium resistance K2 is zero or negative a simpler relationship can
be obtained.

45
2.54
Filterability can be defined as
2.55
Hermia and Eyben (1983) described the lautering process as
compressible cake filtration. They present values for the specific filter
resistance of spent grains with aav = 1 x 10¹⁰ m/kg. The influence of the
filter cake support (medium resistance) was assumed negligible. For the
compressibility of the spent grains cake in relation to pressure they quote
the Lewis law with values for n of 0.9 to 1.0. That means the filter cake
compressibility is linearly related to pressure.
In 1990 Hermia and Rahier quote the Lewis equation to be applicable for
spent grains filtration. The value of n is described as 'slightly greater than
one'.
They conclude that with such a highly compressible cake, filtration should .
be carried out under moderate pressure. Optima of around 1 bar (Hermia
and Rahier, 1990) were found by experiments. It has to be mentioned that
their trials have been carried out with finely milled griSt. Hence particle size
distribution is narrower and differs significantly from grist used in lauter
tuns.
Baluais et al. (1986) fits the following Lewis equation aav = 1.6 x10⁷xLl
p1.05 m/kg (in a range from 0.5 - 1.5 x10⁵ Pal to describe the change of
the specific resistance of the lauter tun cake with pressure. Trials were
carried out in a compression cell. He gives values for the specific
resistance of 1.25 - 1.4 x 10¹⁰ m/kg.
2.6.4.2. Compressible Cake Filtration with Simultaneous
Sedimentation
The lauter tun filtration procedure was described by Bockstal et al. (1985)
as a constant pressure filtration with a compressible cake and
simultaneous sedimentation. These authors also used Ruth's equation for
constant pressure (equation 2.52) as a basis:

46
The first term of this equation increases with the increasing mass W of
cake deposited per unit area of filter medium. As Bockstal et al. (1985)
found, the mass of cake is not only dependent on the volume of filtrate,
but particle sedimentation affects the increase of deposit on the filter cake
to a further extent. Therefore the absqlute mass deposited on the cake is:
W = m1 A+W2 2.56
The mass of particles, W2 sedimenting is (for a constant slurry
concentration and a constant settling velocity):
W2 = C A Vs t 2.57
Where Vs is the settling velocity of the particles derived from Stokes law
(Bockstal et aI., 1985).
With this additional term, equation 2.52 becomes:
dt = a1]c v +1]Rm +a1]cv, dV A2Ap AAp AAp
and after integration:
2.58
2.59
This equation describes constant pressure filtration combined with
sedimentation. Bockstal et al. (1985) found good correlation with hammer
milled grist experiments. Typical values obtained in his experiments were:
K, = 1]ac =4x10³ [s.m-e] 2 2A2 LIp
2.60
with A = 2 X 10⁻³ m2. Rm was assumed to be negligible.
2.6.5. Blockage Filtration
The complete blocking filtration model assumes that each particle
reaching a filter medium seals a filter pore. With this assumption each
volume of filtrate filtered through a filter area causes a certain proportion
of the filter area to block.

47
The proportion blocked, per unit volume of filtrate, is dependent on the
volumetric concentration of solid particles and the projectional area of the
particles.
There are filtration models between the two extremes of the blockage
filtration and the cake filtration model: the standard blocking filtration
model for example assumes that the pore volume in a filter cake
decreases with the volume of liquid filtered, as particles deposit on the
pore walls. In this instance particles are not directly blocking the pores, but J
reduce the pore's cross sectional area.
Poiseuille's equation for flow in capillaries explains the importance of the
cross sectional diameter d as a parameter for the flow and pressure loss
relationship:
2.61
In the case of lautering it is easy to imagine that if fine particles settle on
top of a coarse spent grains cake, these fine particles could be drawn into
the capillaries of the cake. These particulates could then reduce the size
of the cross sectional area of pores in the cake or even block individual
pores.
2.6.6. Washing of the Spent Grains Cake
The washing of non-dewatered filter cakes is very important as the
spent grains retain about 50% of soluble sugars. Sparging in the lauter tun
operation is carried out by displacement. In practice about 4t' of hot water
(of temperatures between 72 and BO°C) per kg of malt are used to sparge
the filter cake and to leach the residual extract out of the solids. This liquor
is applied evenly on top of the spent grains surface and permeates
through the voids of the bed. Care has to be taken not to disturb the filter
cake structure. The formation of cracks or channels in the cake can be
avoided by raking.
A suitable way of presenting the washing performance can be the so
called washing curve (see Figure 2.14). In this curve the normalised wash

48
fluid concentration ~ on the exit of the filter is plotted as a dimensionless ~ .
function versus the number of void volumes of wash liquor W.
w=~ cAL
Flu'd concentration
c
1 -1-.............. . - :
o o
,: • • 1\
\
A
\ B
" " I
2
- -I
3
Void volume of wash liquor used: w
Figure 2.14: Washing curve
2.62
Wakeman (1981) divided the washing curve into two main stages. In
the first phase a quantity of filtrate is displaced hydraulically by the wash
fluid. The optimum washing by pure displacement would result in a plug
flow through the filter bed (see Figure 2.14, Curve A). The volume of wash
liquor required would be equal to the void volume of the cake.
In real filter cakes (e.g. a spent grains cake), however, pores with a
wide distribution of sizes are present. Sparge water travels quicker in wide
than in small pores, which causes a breakthrough of wash liquor prior to
the use of one void volume (Curve B in Figure 2.14).
Between the two main phases of cake washing an intermediate
phase can be identified where the fluid from smaller pores is still high in
extract concentration. Effluent from larger pores dilutes the fluid from the
smaller pores.

49
The second stage is dominated by mass transfer mechanisms.
Extract is 'attached' to the surface of particles and held in interstices
between particles. In addition porous structural material for example from
plant cells can contain high extract within the pores. In this stage the
following fundamental mechanisms can be identified (Wakeman, 1981):
• "internal diffusion in the solid;
• transfer to the liquid phase in the pores of the solid
• diffusion in the particle micropores to the particle exterior
• diffusion in the liquid surrounding the particles
• eddy mixing in the inter-particle voids".
This shows the complexity of the phenomena influencing the
washing process. In addition, changes in the cake structure can affect the
washing process further. In lautering, for example, raking will enhance
mixing effects and disturb the original filter cake structure.
Washing of spent grains (from finely ground malt grist) filter cake without
raking was explained with the axial dispersion model (Moll et aI., 1991,
Hermia and Rahier, 1990). This model describes the displacement of
liquor in the bed by a wash fluid with the same density and viscosity during
laminar flow. Application of the dispersion model is suitable for washing
cakes with fine particles, if the cake consists of fully saturated pores
before washing starts (Wakeman, 1981). Hydrodynamic dispersion is
caused by two mass transport phenomena:
1. the mechanical dispersion due to a flow through the pores and
2. molecular diffusion caused by concentration gradients.
The dispersion model gives a good description of a wide variety of
washings (Purchas and Wakeman, 1986). It can be written as:
2.63
where

50
2.64
When there are no sorption effects K=O and 1..=1.
The term (~~) is characterised as a combination of two dimension less
groups, the Reynolds number Re = p u d ".1 for the wash liquor flow
through the cake and the Schmidt number Sc =...!L, which describes the pO
ratio of molecular diffusivity of momentum to the molecular diffusivity of mass.
uL L 0 -=ReSc--DL dOL
ud -=ReSc o
The effective particle size, d is calculable with (Wakeman, 1986)
d = 13.4w.;-c - 3 ap,c
2.65
2.66
2.67
The axial dispersion coefficient DL and the molecular diffusion coefficient o can be related quantitatively. The relationship is dependent on the tortuosity of the cake. For granular material and Re Sc < 1, a factor of J2 was found (Wakeman, 1975).
DL = 0.707 o 2.68
for Re Sc > 1 and a bed thickness greater than 10 cm the following correlation was found (Perkins and Johnston, 1963, in: Wakeman, 1981):
DL =0.707+1.75ReSc o
2.69
Hermia and Rahier (1990) applied the following simplification of the dispersion model for washing of the spent grains cake with pure water:
2.70
51
2.7. Discussion
The literature survey describes effects from the raw materials and the
process on lautering performance. It also presents literature describing
mashing and lautering from an engineering point of view.
Analysis of the literature suggests that the influence of the fines layer on
lautering performance is dominant. Research focus sed on the analysis of
the fine fraction of the spent grains cake and possible influences from raw
materials and processing. Substances in this layer and their change with
variables such as malt modification, or oxygen uptake and temperature
regimes during mashing were described. The impact of the status of these
substances on lautering performance was measured.
The sulphur bonds of proteins can crosslink and hence increase in size.
Gel-proteins can, due to their large size and stickiness, reduce the
permeability of a filter bed. These compounds were found to be mainly
raw material dependent. Proteins also precipitate already at "normal"
mashing temperatures (50-78°C). Polyphenols, also present in mash, can
act as finings and support aggregation of proteins to larger flocs. Small
starch granules, a group of carbohydrates, were determined in the lauter
tun bed as one reason for reduced lautering performance. The amount of
granules is raw material dependent.
Many of the articles quoted above mention particle size or particle size
distribution, without actually measuring it, as the main reason for effects
on lautering. In most cases no direct investigation of the size of these
small particles was possible as suitable analysis was not available. Most
of the effects were described and quantified using chemical analyses.
Hence, a relationship from particle size distribution of the fines fraction of
mash to lautering performance is missing. Such a relationship should be
able to explain the different chemical effects mentioned above.
Another effect on lautering mentioned in the literature is the viscosity of
the liquid phase of the mash. The viscosity of the mash will be affected by
concentration of the extract and higher molecular mass carbohydrates
such as ~-glucan and pentosanes. The influence of extract on viscosity is
limited and can be predicted, whereas the release of high molecular mass
carbohydrates can cause viscosity changes which are raw material and

52
process dependent. For an investigation which focuses on particle size
changes during processing, it will therefore be beneficial to use one
source of raw materials with a low concentration of such carbohydrates,
as these substances could mask relationships related to size change.
Several researchers report the negative influence of stirring on the
production of fine particles. In most cases fines are not analysed
quantitatively and details of particle size distribution changes and the
relationship to lautering performance are not available. None of the
research results found in the literature tried to correlate and predict the
lautering performance from particle size distributions using a systematic
approach.
Most research work used the stirrer speed as a measure for shear rates.
Power input of a stirrer, which would give a more detailed picture of the
shear stress acting in the mash, was not measured.
Only a few parts of the unit operations in the brewhouse are described in
the literature with models. Amongst these, only those related to the
processes in the lauter tun were found relevant for this work. No
comments were found in the literature describing the. sedimentation
behaviour of mash in the lauter tun. Lautering was described as
compressible cake filtration under constant pressure. However, under
practical conditions in the lauter tun, the suction of the wort flow varies
with time and with change of the extract concentration of the wort during
washing. The washing of the spent grains cake was described using the
dispersion model.
From this literature search, the following conclusions can be derived to
provide a guide for the experimental work.
1. As both water and malt affect the composition of a mash these
parameters should be kept constant.
2. Particle size distributions in the mash, especially in the fine fraction,
seem important for the clarity and the filtration performance in the
lauter tun. It would therefore be appropriate to find a suitable
procedure to characterise the sizes of these fines.
3. There are various parameters in the mashing process which could
influence the particle size distribution in the fines. In the main, two

53
parameters could be very important and therefore especially
interesting to investigate: the temperature of the mash and the
agitation regimes in the mash vessel.
4. The role of oxygen on lautering performance and the relationship to
agitation is unclear, therefore the trials should separate oxygen and
agitation effects in mashing.
5. It would be interesting to measure power input into mash as a function
of the shear stress acting on the mash particles.
6. For suitable modelling of the lautering process, the pilot scale lauter
tun should be wide enough to avoid wall effects. Filtration should be
carried out under variable pressure to make the results more realistic.
Cake washing should be incorporated into the process.

54
3. Materials and Methods
3.1. Raw Materials
The two raw materials involved in the experiments for this thesis are malt
and water. The properties of both materials were defined using analyses
recommended by the Analysis Committee of the European Brewery
Convention (EBC). As mentioned in the discussions of the literature
survey it was found important to limit the raw material variables. Both
water and malt can have influences on lautering performance: Water can
affect the pH levels in mash due to ion concentrations; different pH levels
and ion concentrations would then affect the enzyme activities in mash.
With changes in pH levels different components from malt (polyphenols,
proteins) would be water soluble and leached from the malt grist.
Malt is processed barley which can vary in composition due to the
processing, the growth conditions and the barley variety. This can have a
wide range of influences on the mashing and lautering process.
3.1.1. Malt
Standard malt
The malt for all "agitation" trials was taken from one batch. This batch was
stored at the maltings at BRFI.
The barley variety used for this malt is "Blenheim", harvested 1992.
The following malt analysis (see Table 3.1) was carried out at the Brewing
Service~ Department at BRFI after arrival of the first part (22. 7. 93).
This analysis describes the malt as very well modified. The extract
difference in the mash between fine and coarse ground malt (0.2 mm, 1.0
mm) is very low. Therefore the influence of milling conditions on extract
formation is expected to be reduced. The ratio of total soluble nitrogen to
total nitrogen in the malt sample is relatively high. Nearly half of the total
nitrogen is soluble (46%) under normal mashing conditions. This malt
does not require any enhanced protein degradation during the mash

55
conversion. Therefore, the mashing procedure can be designed without a
protein rest.
Table 3. 1: Well modified malt from "Blenheim" barley
Analysis Result
Moisture 3.9 % (WNV)
Hot Wort Extract (0.2 mm) 82.0 % (WNV)
Hot Wort Extract (1.0 mm) 81.6 % (WNV)
Fine Coarse Difference 0.4 % (WNV)
Colour 4.4 EBC
Total Soluble Nitrogen 0.73 % (WNV)
Total Nitrogen 1.57 % (WNV)
Soluble Nitrogen Rate (Kolbachzahl) 46%
Free Amino Nitrogen 150 mg/l
pH 5.88
Viscosity 1.50 mPas
About 20% of the total soluble nitrogen consists of free amino nitrogen
(FAN). This value shows that a simple mashing procedure with a single
temperature stand will be sufficient to provide enough FAN for yeast
nutrition.
The pH-value is normal. The viscosity of the laboratory wort is low,
showing that the cytolytic modification of this malt is very good.
Underrnodified malt
In one trial the effect of heat on particle size distribution of fines in the
mash was investigated. To verify that effects are relevant over a range of
different malt modifications, a less modified malt was used to compare it
with the well modified malt. The malt analysis is shown in Table 3.2.

------- -~ -~---
56
Table 3. 2: Analysis of less modified malt
Analysis Result
Moisture: 4.5 % (WNV)
Hot Wort Extract (0.2 mm) 81.3 % (WNV)
Hot Wort Extract (1.0 mm) 78.3 % (WNV)
Fine Coarse Difference 3.0 % (WNV)
Colour 2.9 EBC
Total Soluble Nitrogen 0.66 % (WNV)
Total Nitrogen 1.71 % (WNV)
Soluble Nitrogen Rate (Kolbachzahl) 39 %
Free Amino Nitrogen 0.12 mg/l
pH 6.00
Viscosity 2.00 mPas
3.1.2. Water
Water used for brewing purposes has to have a suitable ionic composition.
As mentioned above. enzymatic reactions, extraction and precipitation
reactions are dependent on ionic composition and pH levels in the malt.
The quality of the water used for these trials was improved and
standardised by the use of a reverse osmosis filter cartridge. After
treatment by reverse osmosis the concentration of minerals, such as Mg2+
and Ca2+, is reduced. Softer water creates a lower pH level in the mash, a
prerequisite for suitable mash conversion and a good beer quality.
The following analysis results (Table 3.3) were obtained from reverse
osmosis water taken at the beginning of the experiments (Jan. 1994).
The remaining alkaline level, RA, defined by Kolbach (Narzif.l., 1985) as a
measure for the influence of water ions on the mash pH value; can be
calculated from the above analyses. It relates the pH reducing ions in the
water to the pH increasing ions and is expressed in Od (German degrees
of hardness), with CaH (calcium hardness), MgH (magnesium hardness)
and total alkaline level which is related to the hydrogen-carbonate
concentration) :
RA T t I Ik I· I I CaH+0.5xMgH = 0 a a a ,ne eve - ------=-3.5
RA=0.39- 0.046°d+0.5xO.27°d =0.34°d 3.5
57
3.1
The remaining alkaline level (RA) is only slightly positive. Kolbach found
that -10 0 d reduces the pH in the mash by 0.3 units, compared to distilled
water. This shows that a value close to zero (as found above) won't effect
a pH change. This water will behave neutral in the mashing process.
Table 3. 3: Water analysis of reversed osmosis water
Parameter Result
Hydrogen-carbonate, HC03- 8.54 mg/l
Magnesium <0.2 mg/l
Calcium 1.9 mg/l
3.2. Equipment and Plants
This section describes the equipment used for pilot a'nd bench scale trials.
3.2.1. Pilot Mashing Equipment
Mashing was carried out in a pilot rig built by APV Rosista, Rochester, UK.
This plant was modified for the requirements of these investigations.
Figure 3.1 shows the arrangement of all parts of the rig. All pipework and
vessels are manufactured in 316 stainless steel with a sand blasted
surface finish. Mashing is carried out in a 100 I jacketed vessel with
electrical heating pads in the conically (45 0 to the vertical axis) shaped
bottom section. The heating pads provide a thermal energy input of
approx. 3 x 0.7 kW = 2.1 kW. The heating elements are controlled by a
Cal 9000 Temperature controller (Controls & Automation Ltd. Hitchin, UK)
combined with a PT100 thermocouple inserted in the mash vessel.

58
Picture 3.1: Mashing and lautering pilot plant
The bottom outlet of the vessel is directly flanged to the inlet of a
progressing cavity mono pump (Robbins & Myers, London, UK). This
pump delivers a flow through a loop with an internal pipe diameter of 47
mm.
®
®® ®
Figure 3.1: Top view of the mashing rig with:
1: Mash vessel
2: Hot Water Tank
3: Mono Pump
4: Mashing-in Unit
5: Hot Water Mashing-in Pump
6: Outlet to the Lauter tun Rig
7: Control Unit with Frequency Inverter

59
The motor of this pump is frequency controlled, which allows to adjust
pressure-f1owrate combinations over the entire flow range. The setting of
the frequency controller was calibrated against the flow rate of mash
through the pump loop. Figure 3.2 shows this relationship. The flow rate
was measured using a pre-calibrated electromagnetic flow meter, type
Variomag (Endress + Hauser, Manchester, UK) in the mash loop. This
flow meter was also used during some of the trials. The flow rate of the
pump was fixed at a level suitable to create sufficient mixing in the mash
vessel. It must be mentioned that flow rate of the pump is constant over
different pressure drops up to pressure losses of 4 bar created at a valve.
The frequency controller was set to '4.0' equivalent to a flow rate of 26.6
f. min-1.
A loop from the mono pump into the mash conversion vessel was fitted, to
control the mixing in the vessel. An inductive flow meter, pressure
transducers and an adjustable single seat valve were fitted in the loop
(see Figure 3.3). The total hold up volume in the loop, from the mono
pump outlet to the inlet in the mashing vessel has been calculated to:
v = dj' 7! 1= (4.7cm)' 7! 108cm = 1874cm3 4 4
5OO~----~--~--,-----~--~--~-----.00
450
400
350 .r'c '1: 3XJ Q)
~250 c ~200
~ 100
. 100
00
• Revolution Rate
... , , , , , ... Flow-Rate -,- ..... -,----- .. --- 40
" ; '-1"· ,
., , , . - - - - - - -.). - - - ~ - ..•. -; - - - _, - - - __ , __ •. -1- ___ ;- __ _ , , ________ .l _ • ..1 ___ ...i ____ , ____ i ____ 1_ •• __ l- ____ •. __
, , , , . , , , 10
0+-~~_+~_r~+_~~_+~,r~+_~~_40 o 2 3 4 5 6 7 8 9 10
Setting Frequency Controller
Figure 3.2: Flow rate and revolution rate vs. setting of the frequency controller
3. 2

60
The pressure in the flow loop was measured using two different methods:
Small pressure differences in the loop were measured using a U-tube
manometer, large pressure losses, induced at the valve, were measured
by electronic pressure transducers (Wika, Croydon, UK).
For trials in the small power input range (small differential pressures),
orifices were inserted in a straight section of the loop, which replaced the
inductive flow-meter. The pressure loss across the orifice was measured
at two tappings before and after the orifice (see Figure 3.3).
Manometer
Orifice Plate
Pressure Transducers
Mash Vessel
Mono pump
Figure 3.3: Pressure measurement at the mashing flow-loop
The orifice plates and tappings were manufactured according to BS 1042
Figure 3.4 shows the design.
Flow Direction
Figure 3.4: Orifice plate with pressure tappings at a distance of 0.5 x d and 1 x d from the
plate. Discs with a diameter do of 0.5,0.6,0.7,0.8, O.g x d were available.

61
3.2.1.1. Mashing-In
Malt grist was stored in a 'hopper' container, directly above the mash
vessel. During mashing-in, the malt grist dropped into the mash vessel
and was mixed with water, which was continuously inserted tangentially
into the vertical pipe. The setup is shown in Figure 3.5
Malt Grist
Mash Vessel Water Tank
Figure 3.5: Mashing-in unit
The amount of water added to the grist has to be controlled in order to
achieve a constant water to grist ratio. The hot water from the liquor tank
is pumped into the hopper's vertical pipe by a centrifugal pump through
pipework with 1 inch internal diameter. Control of the mass of water
pumped in could be achieved by timing the opening time of a pneumatic
butterfly valve which was fitted in the pipework.
The following calibration curve, shown in Figure 3.6, was obtained for·
water at 70°C.
To get 17.5 kg of hot water into the mash vessel, the pneumatic valve has
to be opened for 82 s. This mass of water is required for 5 kg of grist at a
water to grist ratio of 3.5 to 1. This time was found long enough to get all
the dropping grist wetted with water.

62
~.--------------------------------------. , , , 22 I I I 'I
~ ~ ~ ~ ~: ~ ~ ~ ~ ~ ~ ~ ~ ~ [ ~ ~ ~ ~: ~ ~ ~ ~ ~ ~ ~ ~ ~:~ ~ ~ ~ ~~ ~ ~ ~ ~ I ~ ~ ~ ~:~ .~.~~ 20: :: ::: ~ 18
"' __ .1 ______ , ____ L ____ 1 _________ '- ___ -' ____ .L_/ __ L ___ _
I I :: 'I ~ I
•.. I 16 , :/ '; ~ ~ ~ 14 . - - - -1- - - - ~ - - - - r - - ,- - - - - -:- - - -" - ,~ - - ~-~ I ,,/ F
~ 12 ~ ~ 10 /r" .gj8 ~ ~ I I : /: I I I
6 -: . - - - -1- - - - .,. - - - -~ - - -1- - - - - - - - - r - - - -j - - - - -t- - - - -j- - - - •
: : /1 :' : I : : -;---- ..... y .... : : ---;----------;- ---,- ----2 . - - .... ,' - _./ .. l ..... _ .... I.. ..1 .. _ .. _ ,.. .... : .. , . . .. ..t.
/' '
o~~~~~~~~~~.~,~~~~~,~~~~ W 10 ~ ~ ~ 00 00 M 00 90 100
tirre [s]
Figure 3.6: Calibration curve for the premasher timed water dosage
3.2.2. Pilot Lautering Rig
The pilot scale lautering rig· was designed to assess the filterability of
mash under circumstances which allow scale-up of the results to large
industrial scale lauter tuns. Therefore the following requirements had to be
fulfilled:
1. specific load of the lauter tun floor area in the same range as industrial
scale equipment.
2. specific filtrate flow rates in the same range as industrial scale
equipment
3. pilot lauter tun should be wide enough to avoid wall effects during
settling of the fines and with filtration.
To meet these requirements, a jacketed glass column (Schott, Mainz,
Germany) with an internal diameter of 15 cm and a height of 1.5 m was

63
used. Bottom and top plates were machined at BRFI's workshops from
stainless steel plates. The entire rig was assembled at BRFI.
The pipework supplying hot water for cake washing and for the filtrate line
was made from 1/4 inch o.d. stainless steel pipes (Swagelock, Ohio, USA)
and silicon tubing (3.2 mm Ld., WT 1.6 mm, Watson-Marlow, UK). The two
media (water and wort) were pumped by two coupled peristaltic pump
heads (see Figure 3.7, Watson Marlow, Falmouth, UK). This ensures that
the same volumes of liquid removed from the lauter column by filtration
are replaced with water.
Two pressure transmitters (range 0 - 1000 mbar, Sensor Technics GmbH,
Waldkirchen, Germany) were fitted to monitor the pressure loss across the
filter cake and to control the flow rate of a peristaltic pump.
-r-
Turbidimeter
Ta
J: J Circulation Heater
Hot Wort
Water
~ PlC Collector Tank
Tank f-
PT~ ~ ~
~ : l ]
Mash
Figure 3.7: Lauter Tun Setup
The turbidity of the filtrate is analysed in-line with a nephelometer type
turbidity meter. As turbidity of wort changes with temperature, the filtrate
needs to be kept at a constant temperature under different flow rates. This
was accommodated by a laboratory glass shell and tube heat exchanger,

64
installed ahead of the turbidimeter. After turbidity measurement, the filtrate
is collected in a 12 C graduated glass aspirator bottle.
The bottom plate of the lauter tun which includes the false bottom was
made of a stainless steel plate with a mash inlet in the centre and two
tappings below the false bottom for the filtrate outlet and for the bottom
pressure transducer. Figure 3.8 shows the details of the design. A
stainless steel wire mesh (BOPP, Zurich, Switzerland) with an aperture
size of 600 IJm was inserted into the solid bottom plate as false bottom
and clamped into position in the centre and at the outer circle by rings.
The active filter area of the false bottom was calculated to be 0.0134 m2.
Pressure Transmitter Wort Outlet
Mash Inlet
Figure 3.8: Bottom plate for the lauter tun
3.2.2.1. Design Specification
The specific load for a lauter tun is typically in the range from 150 to 250
kg m-2. For the pilot scale trials, a load of 170 kg m-2 dry malt grist was
selected. This represents a good value for normallauter tun operation.
To achieve this value with the floor area in the pilot lauter tun 2.27 kg m-2
are required. At a water to grist ratio of 3.5 to 1, 7.95 litres of water will be
in the mash. Malt grist requires a volume of 0.7 C per kg of grist. Thus the
total volume of mash in the lauter tun will be:

65
7.95£ + (0.7 k~ x 2.27k9) = 9.5£ 3.3
This volume of mash requires a height in the lauter tun of 0.527 m.
Maximum flow rate in the lauter tun should be set to 0.12 £ m-2 S-l. This
specific flow rate requires a pump which delivers:
R 3 R ml 0.12-
2 xO.0134m2 =1.608x10- -=96.5-.
m s s mm 3.4
To achieve this flow rate, a peristaltic pump (Watson-Marlow, Falmouth,
UK) with 3.2 mm Ld. silicone tubing and speed control was used. The
peristaltic pump revolution rate was controlled by the differential pressure
between the two pressure transmitters (PT a and PT b at the column,
Figure 3.7).
Picture 3.2: Pilot lauter column with peristaltic pump, control equipment and turbidimeter

66
3.2.2.2. Calibration Procedure
The pump control was set up to reduce the flow rate with increasing
suction across the bed. This condition simulates practical conditions of
large scale equipment very well, where neither differential pressure nor
filtrate flow rate are constant. Transmitter 'a' was calibrated to read zero at
atmospheric pressure. Transmitter 'b', below the bottom plate, was adjusted with hot water (75°C) in the column filled to the level of
transmitter 'a', to give a zero reading at the differential pressure output dp.
The slope of the flow rate versus the differential pressure of the pump was
then calibrated by changing the water level in the column. This allows to
simulate differential pressure conditions. Figure 3.9 shows four possible
calibration points. The flow rate was adjusted (for a defined pipe
dimension) to maximum flow at dp = 0 mbar. This maximum flow is set at
0.16 £ m-2 s-1, with the variable potentiometer setting of the pump at 4.0.
The second condition for the pump speed is dp = 30 mbar. At this
pressure the pump speed should be zero.
Calibration situations:
I dp = pa - pb 1 2 3 4
-..
Calibration conditions: pa = 0, pb = 0 if liquid is at the level of transducer a
Figure 3.9: Calibration procedure for the lauter tun pump control unit

67
Figure 3.10 shows the calibration curve a potentiometer setting of 4.0. The
relationship between f10wrate and pressure drop can be described by a
second order polynomial equation. A direct correlation between rotation
speed (min·1) and flow rate (g min-1) was found for the silicon tubing. The
flow rate at 0 mbar is 98 g min-1 which is equal to a specific flux of 0.12 e m-2 s.
120
110
100
00
00
70
o o ... _. _. -, .. - - - - - - -, - - - - - - - -. -... ._-,----- --~---
0
,,: • • • , -•
- -'- - . ••• _ •• ,.J _ __ • ____ _
o , o
o ,
o 0 --,-------,- ... -t-
o ,
. 0
, 0
o 0 ______ .J •.•. _. __ ..•... _J. ______ -' __ _
• 0
• • 0
o . .. • 0 -----.,--• • 0
o o •
o
I'"
o ___ --' _______ -l ___ , .••. , ..• ' .
------~ .. :----~-- ..
, , 0
20 . -.-" ..... -----~-------,--- ----,---0
10 0
"'1"
0 -5 o 5
o
o "'j'" _ .. _---,-------
10
dP[mbar]
15
Figure 3.10: Calibration curve for the setting 4.0
20
The flow is zero at a differential pressure of 25.4 mbar. The relationship
between differential pressure and flow rate can be described by' the
following equation 4.5:
dV/dt[g/min] = 98.707 - 3.193 x dp [mbar]- 0.0279 x (dp[mbar])2 3.5
3.2.3. Bench Scale Mashing
Mashing was carried out in the BRFI Mashing Bath, a purpose built water
bath with accurate temperature control (lOB, 1977). 500 ml of mash can
be prepared in stainless steel beakers (see Figure 3.12). These beakers
are inserted into the bath and held in position by rubber seals. The mash
samples can be stirred by magnetic flea at two speeds or, more accurately

l
68
by an external stirrer described later. Stirring of the mash is not essential
in this setup, because of the indirect heating no over-heating can occur.
The experimental conditions in the mashing bath were similar to the pilot
scale trials. The mashing programme used a constant temperature of
65°C for 45 min and "mashing-off" of 75°C. The temperature rise from 65
to 75°C was achieved in 10 minutes. Mash samples were chilled to 20°C
after 70 min total mashing time. Samples were stored in an ice bath and
analysed immediately afterwards. The mash volume was 420 ml with a
liquor to grist ratio of 3.5 : 1, in three trials higher concentrated mash was
used (270 ml '" 2.5 : 1; 350 ml '" 2.8 : 1; 390 ml '" 3.2 : 1) to investigate
higher power input. The higher concentrated samples were re-diluted after
the mashing process to a liquor to grist ratio of 3.5 to 1. This made the
results of the filterability tests comparable. Agitation was controlled using a
Haake Rotovisco measuring head M1500 with a RV100 drive unit. This
equipment allows accurate control of angular velocity co and measurement
of the torque T created by the stirrer. The stirrer used for the trials was a
two bladed paddle design (see Figure 3.12). Specific power input into
mash was calculated from equation 3.6 and 3.7.
where
P =P spec. V
pspec.: specific mechanical power input per litre of mash
P: total power input
V: mash sample volume
3.6
3.7
Maximum tip speed achieved with the (paddle diameter: 40 mm) stirrer
was 1.05 m/so To adapt the velocity gradient between wall and blade to
industrial scale, a smaller clearance, of 10 mm, from the bottom of the
beaker was used. This increases the velocity gradient as calculated in
Section 3.2.3.4. Direct monitoring of the velocity profiles, however, was
not possible.

69
3.2.3.1. Torque Measurement in Laboratory Scale Mashing Trials
To enable a quantitative determination of the mechanical energy put into
mash by a stirrer, it was necessary to measure the torque at the shaft of
the stirrer and its angular velocity.
Measurement of torque at the shaft of a stirrer was facilitated using a
Haake, Rotovisco RV100 (Haake, Karlsruhe, Germany) with an M 1500
measuring-drive unit. The RV100 provides the possibility to create a
constant angular velocity in a range from 0 to 50.6 s-l (which can be " selected at the RV100 in a linear range from D=O to D=100%) at the
M1500 drive unit.
Angular velocity aJ and the velocity setting 0 at the instrument are related
by:
aJ = 0.5050B x 0 3.B
To create agitation in a beaker, a two-paddle impeller was used (see
Figure 3.11). The torque created at the stirrer shaft was measured, over
the mashing time, at the M1500 measuring unit and recorded at the
RV100 as t-t plot. Figure 3.11 shows an example of a typical plot. A factor
at the ordinate t enabled to adjust for a suitable sensitivity of the
recording.
1.0,----.---------;--.,------,
0.9
....... --,---.
0.7 . - ; ,
0'·1\1---: ---" 0.6 .c--._~--~+--"::""_"':""_-1 'if'. .
~ 0.5 .. ~ OA -----,---"
!i' :E. 0.3
en 0.2 - - - - - " ..
0.1
10 20
"~----- '---,
----,---
30 40
Tnne Imill 50
Figure 3.11: Example for a torque vs. time plot
70
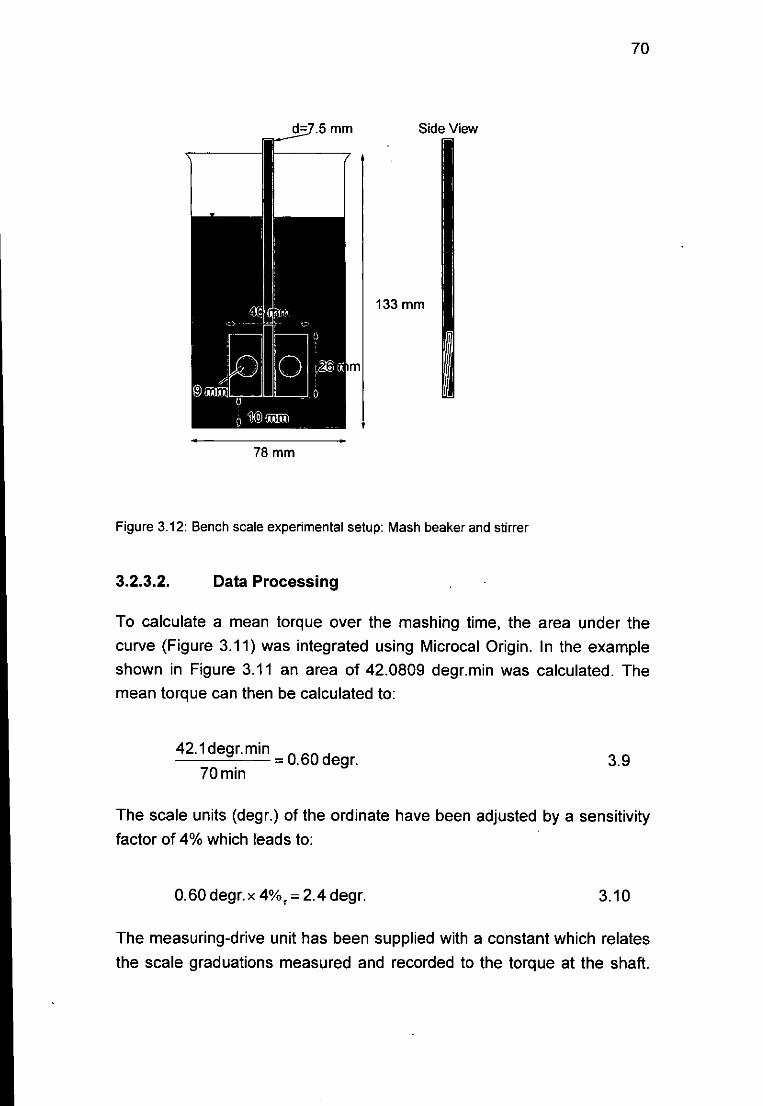
70
Side View
133mm
I 78 mm
Figure 3.12: Bench scale experimental setup: Mash beaker and stirrer
3.2.3.2. Data Processing
To calculate a mean torque over the mashing time, the area under the
curve (Figure 3.11) was integrated using Microcal Origin. In the example
shown in Figure 3.11 an area of 42.0809 degr.min was calculated. The
mean torque can then be calculated to:
42.1 degr. min = 0 60 d . egr. 70min
3.9
The scale units (degr.) of the ordinate have been adjusted by a sensitivity
factor of 4% which leads to:
0.60 degr.x 4%,= 2.4 degr. 3.10
The measuring-drive unit has been supplied with a constant which relates
the scale graduations measured and recorded to the torque at the shaft.

71
The M1500 has a constant of 0.147 Nm degr1. With this constant the
mean torque "C acting at the stirrer can be calculated:
2.4 degr. x 1.47 x 10.3 Nm.degr:' = 3.53 x 1 0-3 Nm 3.11
.In the given example, an angular velocity ill of the stirrer of 40.4 s·1 has
been set. It 'is now possible to calculate the average power input P in the
mash:
P = ill x r= 40.4s-' x 3.53 x 10⁻³ Nm = 0.14W 3.12
The specific power input is the average power input related to the mash'
volume. Standard trials have been undertaken with a total volume V of
420 ml.
3.2.3.3.
p =p= 0.14W =0.33Wr' spec. V 0.42 f
Calculation of Shear Rates
3.13
Direct measurement of velocity profiles in the mash has not been possible,
but the maximum shear rate can be calculated with one assumption.
If we assume a linear velocity gradient in the liquid, the velocity gradient
will be maximum at the gap where the stirrer tip is closest to the wall. This
condition applies at the gap between stirrer and bottom. The gap is 10
mm. Shear rates can then be calculated using equation 3.14:
3.14
If the liquid velocity at the wall vmin is zero the equation can be simplified
to:
VU G=_P-dgap
3.15

72
The shear rates determined using this equation have been plotted over
the velocity of the tip (see Figure 3.13) for all trials. It can be seen that
shear levels are in a range from 0 to 120 S-1.
For large scale mash vessels, the following shear rate can be calculated
using modern design requirements (Vtip < 3m S-1; distance between stirrer
tip and bottom of the vessel, 0.05 m) described in Chapter 2.
G= vup = 3ms-1
60s-I dgap 0.05m
3.16
This shows that small scale trials cover the same shear range as large
scale applications.
3.2.4. Bench Scale Mash Filterability Test
A mash filterability test, designed as a quick comparability test for
assessing the filterability of mash, has been developed. The sample
volume is kept small to facilitate bench scale mashing experiments to be
assessed. The test is carried out in a Millipore pressure filter cartridge with
Whatman GF/D filter disks as filter medium; it requires a total operation
time of about 20 min per sample.
120 -,------,--------,-------:--,
100 .. - - ...... - ., - - - - - -1- - - - ., - •• - - - _ - _ .!- - .- ____ '" ~ ___ - _
, " .' 80 - ' ...... .. ' :
, , . , --------------,-----~~-------7-------------
Co : ......
~ 40 - - - - - - - - ., - .. - -- - -~. : - - - - - - - - - - - .~ - .... - - - - - '"' - - .. ,-... " I , .. ' ,
20 - - - - - - .;..:'- - - - - -:- - - - - - - - - - - - - ~ - - - - - - - - - - - --.. I ! .. ,
0.2 Q4 0.6 Q8 1.0 1.2
lip-speed vtip [m.s")
Figure 3.13: Shear rates in bench scale experiments calculated using the assumption of
linear velocity gradient

73
3.2.4.1. Background
In order to analyse mash filterability in a reasonable time scale with a
small sample volume it was necessary to develop a new analysis
procedure. This test is designed to assess mainly the filterability of fines.
Previous trials, carried out in a pilot scale lauter tun confirm that fines
(accumulating in the lauter tun in the upper layer of the cake) have
predominant effects on lauteringlfilterability performance. Therefore
results from a test focusing on the filterability of fines can be scaled-up for
both mash filters and lauter tuns.
In the Millipore system, a spent grains cake similar to the lauter tun can
not develop, as settling regimes, cake height and wall effects are totally
different. Also, cake washing (sparging) and other procedures employed in
large scale are not applicable.
3.2.4.2. Information Content
The Millipore Filter system in combination with a digital balance and printer
can be used to determine filterability of mash in normal mash
concentrations (Figure 3.14). From the slope of dtfdV vs. V plots the
specific resistance of filter cakes and other filtration characteristics (such
as the tendency for blockage) can be determined.
It is not appropriate to determine other cake properties (such as porosity)
from the trials, as the size and structure of the cake is very different from
large scale filters. Perhaps such information about the cake would be
applicable for mash filter presses, if hammer milled malt is used.

--Figure 3.14: Bench scale mash filterabilily test
3.2.4.3.
1 Pressure Vessel supplying constant pressure of 100 mbar
2 Millipore Filter
3 Digital Balance
4 Printer
5 Digital Stop Watch
Apparatus/Material
74
• Stainless steel pressure holder (Millipore, Watford, UK): diameter d;
=3.5 cm, active filter area A filter = 9.62 cm2
• Digital balance including printer: Mettler, High Wycombe, UK
• Digital stopwatch, accuracy ±100 ms
• Low pressure device, supplying a constant pressure of 100 mbar = 1 x
104 Pa, measured at a pressure gauge, (Wika, Coulsdon, UK, range: 1
bar, accuracy: ±1 %)

75
• Water bath at 55°C
3.2.4.4. Operation
• Assemble the filter stand including balance, printer and low pressure
vessel (see Fig. 3.14).
• Pre-heat filter including filter disk in the water bath (55°C).
• Shake sample well (50 - 50 ml in a centrifuge plastic tube) and pour
into filter tube, keeping the outlet closed.
• Close lid and connect pressure tubing
• Open outlet
• Start filtration by opening valve to the low pressure device
• Print balance reading in constant intervals (0 - 1 min: every 5 sec; 1 - 5
min: every minute; then after 5,7 and 10 minutes)
3.2.4.5. Processing of Results
Constant pressure filtration can be described using the following basic
equation for cake filtration:
3.17 .
If Rm is zero, or the term allowing for the resistance of the filter medium is
negligible, the equation reduces to
dV N/',.p 3.18 - =
dt 'lacV
or:
dV 1 3.19 -=-
dt KV
K can be determined by inverting the equation to:

dt =KxV dV
3.20
76
where K is the slope of the linear fit to the data sets in a dtldV versus V
plot.
Figure 3.15 shows an example of such a plot with linear functions fitted to
the th ree sets of data.
1.2x10",-------------------,
1.Ox10"
8.Ox10'
~ ]!. 6.Ox10'
~ 4.Ox1o'
2.Ox1o'
, , ..... I
, ........• " •... "1'" •
.- .. ' ... - - . - - ., .... ,
~.# ,~
~...-:;:. ~ , ... ~ ... ~ ... ~ . - ..... ~'~~ ,,' - , .~ - - , - - - -
o dtN65.1 o dtN652 Cl dtfV65.3
O~O+--~-___r----T_-~-__.-~-___1
0.0 5,Ox10-6 1.Ox10-' 1.5x10-'
Cumulative Filtrate Volume Im')
Figure 3.15: dtldV versus V plot of reproducibility trials.
3.2.4.6.
Slope K: (65.1): 4.216x10¹²
(65.2): 4.191x10¹²
(65.3): 4.276x10¹²
Accuracy of Analysis
2.Ox10-'
The repeatability of the filtration analysis was tested by analysing 3
samples, taken from the same mash (Trial 65). The slopes K of linear fits
for the three trials have a variation coefficient of 1.027%.

77
3.3. Brewing Procedures
3.3.1. Milling
Milling of malt was carried out on a pilot scale two roller mill (Robert Boby,
Bury St Edmunds, UK). On this mill the batch size for one brew (5 kg of
malt) could be milled in about 25 minutes. The two rollers of the mill have
the following dimensions:
• diameter of the rollers: 3"=7.62 cm
• width of the rollers: 2%"=6.35 cm
• revolution rate: 64 rpm
Figure 4.17 shows the mill. The gap between the two rollers is adjustable
by a gear which moves the right roller. In addition the dosage of malt
ahead of the gap can be controlled by an adjustable flap. The gap was set
to 0.75 mm for all trials using the Blenheim malt batch. The gap is
measured using a feeler gauge. In trials with undermodified malt quality
the gap was set to 0.55 mm. These settings were found suitable to
achieve a sieve distribution close to the recommended values given in
literature for lauter tun processes. Details about the relevant experiments
are given in Section 4.1.
The crushed malt grist was stored and transferred to the mashing in unit in
a bucket with a lid. The milling procedure was usually done directly before
mashing.
3.3.2. Mashing
The mashing in the pilot rig was carried out using 5 kg of grist and 17.5 kg
of water (liquor to grist ratio 3.5 : 1).
After mixing water and grist, the mono pump was started and kept going
for the entire mashing time.
The mashing procedure was adapted to the malt quality. For all trials an
infusion mashing procedure with an initial mash temperature of 65°C was
used. After 45 minutes the mash was heated to 75°C. The total mashing

78
time was fixed to 70 minutes. The heating rate was 0.6°e min-1 at a mash
volume of 21 litres (see Figure 3.17).
Figure 3.16: Schematic of the laboratory roller mill with
1. Hopper
2. 5 litre beaker
3. Milling chamber (adjustable parts in red)
Picture 3.3: Rollers of the mill

OO~------------------------------__ --,
, I I I I I m _____ J _____ I _____ ~ _____ I _____ L_ ---~-- ___ ~ ___ _
0' L
~ :J 60 ro ~
Q) a. E Q)
f- 50
I I I I I I
, , , , -----~-----,-----T----------, , ,
, , , , --- --,- -- --,- ---_. , , ,
I . I I I I
-----~-----~----~----4-----~----~-----~----I I I 1 I I , , ,
Mashing Time [min]
Figure 3.17: Temperature programme for mashing
3.3.2.1. Process Routine
79
In order to establish reproducible trial conditions all manual work had to be
standardised. The following routine was set up:
1. Preparation, set the evening before the trial:
• Mash vessel - Temperature setting: 75°C, filled with water up to the
edge of the cone.
• Liquor tank - Temperature setting: 72°C, filled with 120£ of reverse
osmosis water.
2. Main Procedure:
• switch on temperature recorder
• circulate water in the MV until temperature is stable (about 65°C)
• switch off MV-heater and reset set-point of the temperature controller
to 65°C
• pump the hot water into the lauter column
• add water from liquor tank (preheat pipework) about 15 seconds
• put mash grist into hopper

80
• start mashing in procedure - for 5 kg malt at 3.5 : 1 liquor to grist,
leave pneumatic valve open for 82 seconds - after this the mashing
timer is started
• start mash pump and switch on heater of the mash vessel
• Stir the mash gently for about 1 min to improve mixing
• adjust temperature controller to 75°C after 45 minutes
3. Mash transfer to the lauter tun
• stir the mash before the transfer
• open valve to the transfer pipe
• drain water/mash mixture into bucket
• switch the three way valve on the lauter tun mash inlet from draining
to mash in position (mash starts to fill the lauter column)
• close the adjustable 90°-valve on the mashing plant to stop the mash
to flow in the loop
• fill the column with mash to the 52.7 cm level
• switch the three way inlet valve immediately to drain position
• collect about 5 litres of mash sample in a beaker
• after the mash sample is collected, switch the mono pump off
• remove the sample from the drain pipe
• switch mash vessel heater off.
4. Shut down procedure
• remove the remaining mash from vessel and pipework, rinse and
clean the plant
3.3.3. Lautering
The lautering procedure was used to analyse the filtration performance in
terms of cake permeability, extraction/washing efficiency and the wort
clarity. The following routine was used to get consistent information about
the lautering performance.
81
3.3.3.1. Process Routine
1. Preparation, set the evening before the trial:
• fill the water tank of the lautering rig with reverse osmosis water
• heat the water up to 75°C
2. Main Procedure:
• fill the space between the lauter tun floor and the wire gauze with
water from the bottom wart outlet to avoid air pockets to develop
• preheat the lauter column with hot water from the mash vessel
• start recirculation in the hot water loop of the lauter column jacket (set
to 75°C)
• drain the water in the column just before pumping the mash in
• fill the mash into the column up to 9.5£ level (for details see mashing
procedure)
• start the stop watch
• monitor sedimentation by measuring the height of the two interfaces
(spent grains to fine particles phase and fine particles to clear
headspace) every minute
• start filtration after 10 minutes by switching on the peristaltic pump
• monitor the following parameters during filtration every 5 minutes:
differential pressure
height of the fine particles and spent grains layer
total filtrate volume
extract in the filtrate (hand held refractometer)
haze reading at the turbidity meter
• switch off the pump when 11 litres of filtrate are collected
3. Shut down procedure
• release the silicone tubing from the peristaltic pump and drain the
remaining water off
• discharge the spent grains by removing the bottom plate

82
• rinse and clean all parts of plant
During the lautering procedure mash samples were analysed to determine
viscosity of the liquid phase of the mash at 75°C, density of the liquid
phase of mash at 75°C, wet sieve analysis using a 1000 IJm and a 150IJm
sieve, extract concentration in the cold liquid mash phase (20°C) and
particle size distribution of the fine fraction (that has passed a 106 IJm
sieve) in the mash.
The 1 H' wort sample was mixed and analysed immediately after the
lautering for extract content, dry solids in the wort and particle size
distribution. If required, samples were analysed for chemical composition.
The data collected during a trial were processed using QuattroPro
(Borland, Twyford, UK) spread sheets and Origin (MicroCal Software,
Northampton, MA, USA) data analysis software. Examples of the standard
lautering graphs are given in Figure 3.18.
o 20 40 80 100 120 140 180 180
Time [min]
Figure 3.18: Lautering graph for a standard run

83
3.4. Analyses
3.4.1. Viscosity Analysis
The viscosity of wort and the liquid phase of the mash were determined at
a run off temperature of 75°C directly after mashing/lautering. These
analyses were determined in a falling ball viscometer ('Hoppler'
Viscometer, Zeiss, Jena Germany). The apparatus is displayed in Figure 3.19.
3.4.1.1. Measuring Principle
This instrument measures the time it takes for a ball to pass two ring
marks in a cylindrical glass tube. This glass tube is inclined by an angle of
10° with respect to the vertical axis. This viscometer is designed to measure low to medium viscous and clear liquids which show Newtonian
behaviour.
Figure 3.19: Falling ball viscometer
The system temperature is controlled by a water bath with circulation of
water through the jacket of the viscometer. To move the ball to the top of

84
the tube the entire jacketed glass vessel is turned round by about 180°. To
obtain a sufficient accuracy from the analysis, the fall of the ball was
measured 4 times.
The dimensions of the glass ball had to be determined before the trials.
Glass ball dimensions:
Diameter: d = 0.622 inch = 1.580 cm
1 1 Volume: V = - 7(d3 = - 7(1. 580 cm)3 = 2.065 cm3
6 6 Mass: M = 4.9579 g
Density: p= m = 4.9579 g = 2.401~ V 2.065 cm3 cm3
3.4.1.2. Calibration Constant of the Glass Ball:
The calibration trials were carried out with de-ionised water at 20°C.
Properties of water: (at 20°C)
• dynamic viscosity 17w = 1.002 mPas
• density p = 0.9982 g/cm3
time for the ball to fall between the two lines:
{=67.87 s (mean value: 67.87; standard deviation: 0.1388 s; variation
coefficient: 0.2%)
Calculation of constant Kb1 :
Kb,= 17w = 1.002 x 10-
3Pas =0.01054x10⁻³Pacm3s
t{Pb' - pJ 67.87s (2.401-0.9982)L g cm 3
3.18
The dynamic viscosity of a sample is calculated from the following formula:
3.19

85
where:
17 dynamic viscosity [mPas]
t fall time of the ball [s]
P1 density of the ball [g cm-3]
P2 density of the liquid [g cm-3]
Kb1 ball constant [mPas cm3 g-1 S-1].
3.4.1.3. Analysis Procedure
A sample of hot mash is filtered through pleated filter paper. The first 200
ml of the filtrate were transferred to the viscometer and the density bottle.
Hot filtration together with use of the first 200 ml ensured that blinding of
the filter and changes of the cut off size were minimal. Both analyses were
measured directly after the sampling. This ensured that no gas bubbles
occured in the analyses.
The time interval for the fall of the ball was recorded four times, in order to
reduce inaccuracies in temperature or stopping time.
The density bottle's temperature was adjusted in the water bath until
equilibrium was reached (about 10 min). After that the bottle was chilled
with cold water, in order to avoid evaporation, and measured immediately.
3.4.2. Filtrate Turbidity Analysis
The turbidity of the filtered wort is measured in an in-line turbidity meter
(Ratio 2000 Turbidimeter, Hach, Namur, Belgium). The Ratio 2000
turbidimeter is equipped with three light detectors. One detects light at 90°
angle, the second detects light transmitted through the sample, after being
reduced in intensity by a 'black' mirror, and the third detects light scattered
in a forward direction. This arrangement makes it possible to measure the
nephelometric signal ratioed against a weighted sum of the transmitted
and forward scatter signal. This ratioing improves the stability of the signal
over long term and compensates for dust on optics. The turbidimeter was
operated in a range from 0 to 200 NTU (Nephelometer Turbidity Units)
which is equivalent to 0 to 800 EBC Units. Calibration was carried out with
formazin standard solutions according to the operating handbook.

86
3.4.3. Coulter Counter, LS130
Sieved mash and wort samples were analysed on the laser sizer for all
trials. In addition some samples of different sections of the spent grains
cake were analysed.
Two different particle sizing methods are combined in the LS 130, (Coulter
Electronics, Luton, UK) which enables the sizer to measure particles in a
total size range from 0.1 to 900 IJm.
3.4.3.1. Diffraction Sizing
The LS series uses laser light at 750 nm to size particles from 0.4 to 900
IJm by light diffraction. The laser radiation passes through a spatial filter
and projection lens to form a beam of collimated light. The sample cell of
the fluid module shapes the suspension fluid into a thin sheet (3 mm) that
flows at right angles to the laser beam's light path. This measurement
geometry minimises the number of particles that re-scatter light, scattered
from other particles in the cell.
A Fourier lens collects the diffracted light up to about 15° and focuses it
onto two sets of detectors: one for the low-angle scattering and the other
for mid-angle scattering. A second Fourier lens system collects the
diffracted light from about 10° to 35° and focuses it into a third set of
detectors.
3.4.3.2. Measurement
The fluid module's sampling system pumps the suspension fluid with
sample particles through the diffraction sample cell where laser light is
directed onto the particles for particle measurement. As the particles move
through the cell, the collimated laser light is scattered, or diffracted, from
each particle. A diffraction pattern is the pattern of scattered light intensity
as a function of scattering angle, or simply by the amount of light scattered
by the particle in different directions. The diffraction pattern of each
particle is characteristic of its size.
The LS130 measures particle size by measuring the combined particle
size-dependent diffraction patterns by means of a Fourier lens.

87
A Fourier lens is an ordinary lens that is used in a special way which gives
it special properties. A Fourier lens is focusing any light striking the lens at
a given angle onto a single annular area on its plane of focus, the Fourier
plane. The Fourier lens is sensitive only to the angle of the light rays
incident on it and not to the position of the source of light.
The Fourier lenses used in the LS 130 are used to focus light scattered at
a given angle from any particle anywhere in the diffraction sample cell,
independent of the particle speed, onto a single annulus on the detector
plane. The result is that the Fourier lens forms an image of the entire
diffraction pattern of each particle, the image being centred at a fixed spot
on the Fourier plane. This image is centred at the same fixed spot
regardless of the position or velocity of the sample of the particle in the
diffraction sample cell. The individual diffraction patterns from the moving
particles in the sample cell are superimposed, creating a single composite
diffraction pattern that reflects the contributions of each particle. This
composite diffraction pattern can be accurately sensed by the detectors
judiciously placed on the Fourier plane.
3.4.3.3. Determining the Size Distribution
The diffraction detector system consists of 126 photo diode detectors in
three sets. These are the low-angle (mainly for large particles), mid-angle
(mainly for average particles) and high-angle (mainly for small particles)
sections. Each detector is placed at a known angle from the optical axis.
Since a particular sample always contains particles of different sizes, each
with a corresponding set of diffraction patterns, the detectors produce an
integrated flux pattern that contains composite size information for all the
particles in the sample. This integrated flux pattern is decomposed into a
number of diffraction patterns one for each size classification. The relative
amplitude of each classification is used to measure the relative number,
surface area or volume of particles of that size range.
3.4.3.4. PIDS Sizing
The LS 130 provides the primary size information for the particles in the
0.1 to 0.4 IJm range and enhances the resolution of the size distributions
up to 1 IJm. This additional measurement is needed because it is very

88
difficult to distinguish particle sizes by diffraction patterns alone when the
particles are smaller than 0.5 IJm in diameter.
Polarisation Intensity Differential Scattering (PIDS) is based on a polarised
light source. For particles in the range of sizes close to the wavelength of
light, the difference in scattering of vertically or horizontally polarised light,
when the scattering is observed at roughly right angles to the direction of
propagation of the light, depends on the ratio of particle size to the
wavelength of the light wave.
To get as much information as possible about the small particles
measured by the PIDS assembly, it illuminates polarised light of three
different wavelengths (colours). The three wavelengths of light permit
three different ratios of particle sizes to light wavelength.
The PIDS assembly uses an incandescent tungsten halogen lamp and
three sets of vertically and horizontally polarised filters to provide polarised
monochromatic light at three different wavelengths: 450nm (blue), 600nm
(orange) and 900nm (near-infrared). The light is focused through a slit that
acts as a spatial filter and is formed into a narrow, slightly diverging beam
that is projected though the PIDS sample cell.
The intensity of the light scattered in the plane perpendicular to the flow is
measured at five different angles by photo detectors in the PIDS detector
assembly. A sixth detector behind the cell measures the intensity of the
un-scattered light to determine the amount of obscuration.
For three wavelengths, the different scattering pattern is detected at the
five detectors. In total, the PIDS assembly makes 30 measurements of the
light scattered from the sample: scattered light of two polarisations at three
wavelengths and five scattering angles. These 30 measurements are then
reduced to 15: the difference in scattering between the two polarisations
measured at each of the three wavelength and five scattering angles. The
15 measurements form a pattern that varies sensitively with particle size.

89
Picture 3.4: Laser Sizer sample cell with laser diodes and PIDS assembly
3.4.3.5. Data Processing
The Laser Sizer LS130 acquires particle size information in 100 channels.
Channels are logarithmic, progressively wider in span. For statistical data
processing the median size at the centre of each channel is employed.
The logarithmic median diameter dLC (in IJm) is calculated as follows:
. [Iog,ower boundary -log upper boundary 1 dLC = anlllog"----------------"
2
where dLC is the logarithmic diameter.
3.20
To calculate the weightings, the median size is converted into the
appropriate units. For example the formula for the weighting for volume in
[lJm3) is:
3.21
All experimental results refer to the geometric mean particle size' (MPS) of
a size distribution which can be calculated from the distribution:

90
3.22
Xc = median size of the channel in IJm for diameter, IJm2 for area and IJm3
for volume.
3.4.3.6. Sample Preparation for the Laser Sizer
60 ml of mash were diluted in 340 ml of cold tap water. This suspension
was mixed and sieved through a 106 IJm sieve. It is important that the
sieve is pre-wetted to obtain a good sieving effect. Larger aperture sieves
(710 IJm and 250lJm) were tried first but larger particles passed through
these sieves and masked any change in volume size distributions in the
regions of interest. The sieved suspension was then added into the
sampler (hazardous fluids module) of the Laser Sizer. The analysis of
mash should be done directly after the mashing procedure.
3.4.4. Coulter Multisizer 11
The Coulter Multisizer 11 has been employed as an alternative particle
sizing apparatus to determine size distributions of fine particles «106IJm
class) in the mash.
The Multisizer 11 determines the number and size of particles suspended in
a conductive liquid by monitoring the electrical current between the
electrodes immersed in the conductive liquid on either side of the
aperture, through which a suspension of the particles is forced to flow. As
each particle passes through the aperture, it changes the impedance
between the electrodes and produces an electrical pulse of short duration
having a magnitude essentially proportional to the particle volume. The
series of pulses is electronically scaled, counted and accumulated in a
number of size related channels which, when their contents is displayed
on the integral Visual Display, produces a size distribution curve.
The analyses were carried out using a 140 IJm orifice tube which gives an
analysis range from 2.504 to 77.96 IJm. The· size range is split
logarithmically into 64 channels. The volume of suspension analysed was
500 IJI.

91
501-11 of the sample suspensions from the laser sizing (dilution 60 ml mash
in 340 ml of water) analysis were diluted in 10 ml isotone. This is equal to
a dilution rate of the mash of 1 to 1133.
3.4.5. Statistical Evaluation of Data
Particle size analysis and all other data were processed using either the
built in computer facilities of the LS 130 or by Origin. (MicroCal Software
Inc., Northampton, MA, USA).
Where applicable standard deviation, coefficient of variation and
confidence limits at 95% confidence were calculated.
In the LS 130 program the standard deviation of a distribution is calculated
as:
SO= I[nc(I09Xc -I09Xgt]
Inc 3.23
where SO is the standard deviation, and ne is the percentage of particles
in each channel.
In more general statistical evaluations of analytical results, the standard
deviation of the sample is calculated using:
SO = -",i-,,--' _-:-_
n-1 3.24
The coefficient of variation, CV, is the standard deviation divided by the
mean. It relates the measure of distribution to the average about which it
is measured, as a percentage. Thus it measures the relative variation as
opposed to the absolute variation, which is useful for comparing the
distribution in different sets of data.
CV = SOx100% x
3.25

92
95% confidence limits were used to describe the size range (± 2 x SO)
about the mean value within which 95% of the values should fall.
3.4.6. Wet Sieving of Mash
This analysis was found suitable to detect the change in particle size
during the mash conversion under different agitation regimes.
An evenly distributed mash sample volume was taken from the outlet of
the mashing vessel, after filling the lauter column. 146.5 ml of mash were
then added on top of a 1 000 ~m sieve. The mash is then washed through
the 1 000 ~m and through a 150~m sieve below it by spraying with tap
water. The sieved suspension was collected in a bottom tray. Both sieves
were then placed into a drying cabinet for 24 hours at 120°C. The liquid
volume of the bottom tray was determined and 10 ml of this suspension
were filtered through a Whatman No. 541 filter paper, to determine the dry
solids of the fines. It proved impossible to filter the entire suspension as it
showed a very bad filterability. Hence only a small quantity was analysed.
The dry weight was re-calculated for the weight in the total sample. The
relative concentrations in the three fractions of the mash samples were
expressed as percent of the total weight of particles.
3.4.7. Scanning Electron Micrographs
Mash particles from different sections of a filter cake were analysed after
lautering on the BRFI electron microscope (Phillips, Holland).
Different sections of filter cakes from two trials and the fines layers of two
additional samples were analysed with this technique. Before analysis
they were stored at -20°C. For the scanning samples were frozen in liquid
nitrogen at -196°C then observed at -185°C. The results are shown in
Appendix 7.2.
3.4.8. Other Physical and Chemical Analyses
The liquid fraction of mash and wort samples after lautering were analysed
for their chemical composition. The following analyses were carried out by
following standardised analysis procedures specified by the European
Brewery Convention (Analytica EBC, 1988):

93
• Free Amino Nitrogen (FAN)
• Total Soluble Nitrogen (TSN)
• Polyphenols
• pH
• Colour
• Apparent Fermentability, FA:
FA = (Gbef. - Gafter ) x 1 00 3.26 Gbef.
where Gbef.is the specific gravity before fermentation CPlato) and Gaiter. is
the specific gravity after fermentation (OPlato).
Samples were analysed after storage in refrigerators 24 to 48 hours after
lautering at the BRFI Quality Services Department, a NAMAS accredited
laboratory.
Extract content in the mash and wort samples was measured off-line during mashing and lautering. Extract in the filtrate from the lauter tun was
measured every five minutes during the trials on a laboratory hand-held
refractometer (Fisons, Crawley, UK). The analysis has an accuracy of the
reading of ±0.25% (w/w) extract. Samples of the filtered mash were
measured with a hydrometer (Saccharometer, Glasblaserei der VLB
Berlin, Germany) to determine the original extract content in the mash.
The accuracy of the reading is ±0.05% (w/w) extract. The wort sample
after lautering was also analysed with a hydrometer to obtain information
about the dilution effect during cake washing.
3.5. Conclusion
This chapter describes the raw materials and the brewing procedures
used in all trials. Some effort was put into developing standardised
conditions for the trials, in order to achieve suitable reproducibility of the
results. It can be seen that major emphasis was laid on the development
of suitable analyses for filterability and lautering performance at either the
laboratory or pilot scale.

94
The second part of this chapter describes the procedures used to analyse
changes in mash composition. The second main emphasis of this work
was put on the particle size analysis, especially of the fines fraction. The
literature review showed that the relationship between particle size
distribution of the fines in the mash and the influence on lautering
performance is still unclear.
Particle sizing was verified by comparison of different analysis methods on
the basis of laser diffraction sizing, electrozone measurement and electron
microscopy. This was necessary mainly because the laser sizing, which is
the most suitable analysis for most trials, is based on a model which
relates the diffraction to the size.
Analyses of other physical conditions in the mash and the wort such as
viscosity and extract concentration were also found very important. They
can have direct influence on filterability of the mash.
Chemical analyses were employed to a lesser extent, not because of the
availability of suitable methods, but more because the literature search
indicated that even very sophisticated analyses could not show a clear
relationship between mashlwort composition and lautering performance.

95
4. Results and Discussion
In this chapter the results of all trials are presented and discussed.
Conclusions are drawn which guided subsequent trials and an overall
conclusion is presented at the end.
4.1. Initial Trials
Chapter 4.1 reports the trials which were necessary to develop standard
brewing conditions and verify the suitability of analysis procedures. In this
chapter, the properties of different parts of the spent grains cake and the
fines are also described.
4.1.1. Adjusting the Gap Setting of the Laboratory Mill
The milling of malt for all trials was carried out on a laboratory 2 roller mill
(see Chapter 3.3.1). The gap was set to a distance suitable for grinding
'Iauter tun grist'. This type of grist is defined by its sieve distribution. An
'optimum' sieve distribution for lauter tun filtration performance was found
empirically (e.g. NarziP.., 1985). The gap setting between the two rollers
had to be adjusted to achieve this optimum distribution of the grist. The
following results were obtained for the three gap-settings tested (Figure
4.1). The sieve set used for the analysis (0.65 to 0.85 mm gap setting)
was slightly different from the standard, recommended by MEBAK (Mittel
Europaische Brautechnische Analysen Kommission, 1987) (see Table
4.1). Table 4.1 shows the sieves used at BRFI in comparison to the
standard Pfungstadter sieve set.
Figure 4.1 compares the sieve distributions obtained from three different
settings of the laboratory mill with the optimum distribution recommended
by NarziP.. (1985) for the use of two roller mills. This shows that the 0.75
mm setting is close to the recommended standard distribution. This gap
setting was used for this batch of malt, for all trials.

Table 4.1: Sieve set and grist fractions
Fractions \ Sieve Set Standard [iJm]
Husks 1270
Coarse grits 1010
Fine grits 1 540
Fine grits 2 250
Powder flour 150
Bottom 0
30
10
o tulks c. gits f. grits 1 f. grits 2
Partide F radion
Figure 4.1: Sieve analysis for well modified malt
BRFI [iJm]
1400
1000
500
250
150
0
~ O.85rrrn ll§§§lI 0.75 rrrn
~~ O.85rrrn
8 st..-dard
flour p. flour
96
A more detailed sieve analysis has been carried out for the 0.75 mm gap
setting. Figure 4.2 shows the sieve distribution.

97
~.-----------------------------------.
'-
15 -
,-~ r-E 10 - - - - - - '" . - - - -
i
o 1000 ~ 300J 4000
Sieve Size [~l
Figure 4.2: Sieve analysis for malt grist milled with 0.75 mm gap setting
The small particle range from 0.1 to 700 IJm was easier to analyse by
laser light scattering (LS 130). Figure 4.3 shows the differential volume
distribution and the differential surface area distribution. The volume
distribution has two characteristic peaks at 5 and 20 IJm. These peaks
represent small and big starch granules respectively. The fraction up to 40
IJm accounts for 40% of the volume of particles below 710 IJm. In terms of
surface area the two peaks in the range from 1.3 to 35 IJm account for
95% of the particles in this analysis. After mashing the fraction below
40IJm is smaller, however, there are still large amounts of such small
particles present in the mash.
For the investigations of temperature effects a different malt batch with a
lower modification was used. Malt modification influences the friability of
the kernels. There are more cell wall components left in the malt and
therefore the kernels are crushed into larger bits. This effect can be
counteracted by a smaller setting of the roller gaps.
Figure 4.4 shows three sieve distributions for this malt batch. The gap
setting 0.55 mm produces the sieve distribution closest to the standard.
This setting was used to mill this malt batch.

6
-.- Volume Distribution 5 - ~- - Surface Area Distribution
l\ '0" es. 4
m ~ 2l 3
{? :J en 2 "0 c:
'" ~ 1 .;;J g
0
~ / J.~ •
// ~ .,._l -~ : 7/· .\\
L , I ~\ ,/ \ .0. \. rf
'q i 1 \\ . q I ~\ I
f b ,p. \. .". r 000
0 ~ \\
I r! ~ ,I
P •........, • ,. •• \1 •••• .. ~ _. ..
I •• ~ • • ••••• oai.- _ . ~l"Ioe~OOOO(!OOOOOOOOOOOO(>OOO~OOOOO(JOOO
f I .. r
f
1 10 100 1000
Partide Size [~ml
Figure 4.3: Particle size distribution, grist in water sieved at 710~m
40~n------------------------------------'
'* - 20 E
i
husks c. grits f. grits 1 f. grits 2
Partide Fradion
Figure 4.4: Sieve analysis for undermodified malt
~ O.75rrm ~ 065rrm ~ O.55rrm
B Stardard
flcu p. flour
98

99
4.1.2. Effect of Different Grinding Systems on Fine Malt Particles
Four different milling systems (Laboratory roller mill (see Chapter 3), a
laboratory hammer mill, a household coffee grinder, and a laboratory disk
mill) have been tested to investigate the influence of different milling
systems on the break-up of fine particles such as starch. Figure 4.5 shows
the volume distribution of the fine malt grist fraction, which was dry sieved
using a 150 IJm sieve.
It can be seen that all four milling systems were unable to break up starch
granules. Bimodal distributions, showing large (size: approx. 20 IJm) and
small starch granules (size: 2 - 4 IJm), were the same irrespectible of the
method of milling. The laboratory roller mill produced a larger amount of
coarser particles which were in a shape suitable to pass the 150 IJm sieve.
Visual examination of this fraction of the grist revealed spike shaped
particles often more than 10 times longer than the diameter.
8 'f~ -0- Roller Mill 0.65 rrrn 'rr'\:~ --,,- -Calfee Grirder : (1 \11 - ·c._ • Hamre' Mill 0.70 rrrn
6 .• _. _ . __ .. __ .• _: __ 7_ j~ . -. ~- Disk Mill 0.5 rrrn
~ h \~, ' , • :;( ~I '
L --. ---- -- -- -:-/if- ---~, --------' --------------. :g "[],,. : I '\
2 - "'."., ,. :,~~~:, "of,! "" "~\\ . "'.'1P"'\I\l~ : ,\ " ,,"aV ~~oo, ", 000000
''!Jl;~ , ~ [] 0 00 . !.l..aM- 4,'\ 14~6. ," 0000000000 0 000 o ~tl1l:D hb,,>:> 1.'". 00 []
" 1 10 100 1000
Partide Size [~mJ
Figure 4.5: Particle size distribution of fine malt particles after a dry sieve step at 150~m.
The legend gives the gap sizes of the different mills
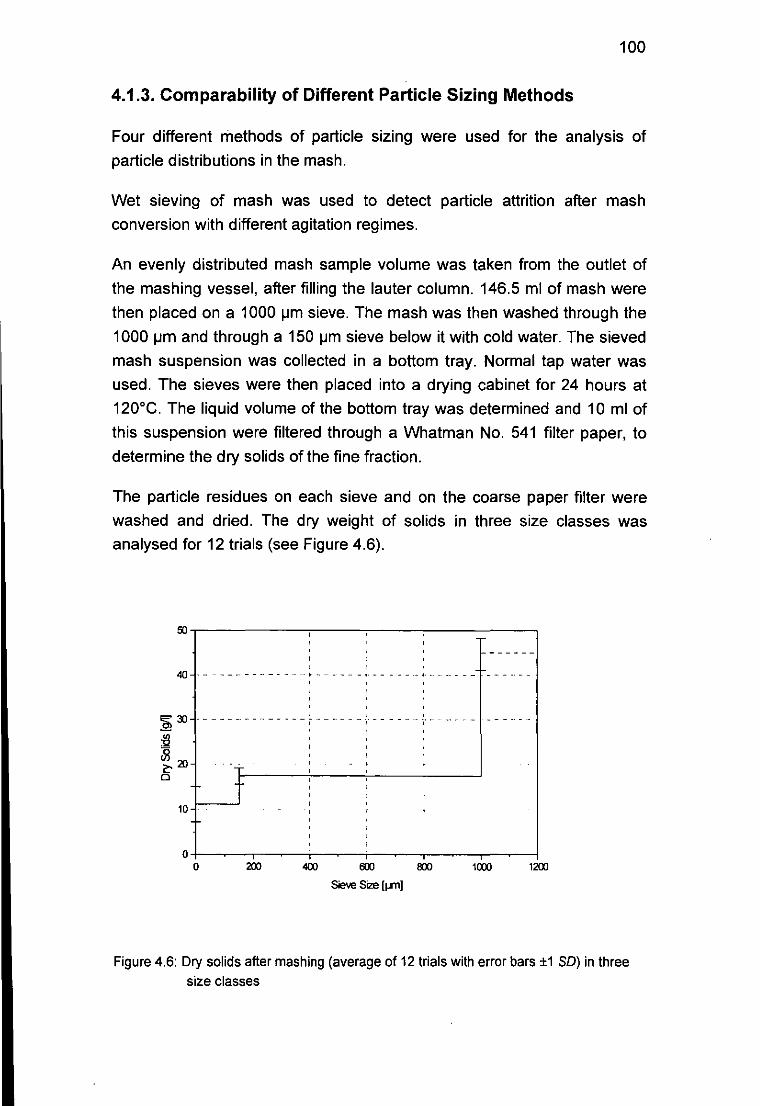
------- --
100
4.1.3. Comparability of Different Particle Sizing Methods
Four different methods of particle sizing were used for the analysis of
particle distributions in the mash.
Wet sieving of mash was used to detect particle attrition after mash
conversion with different agitation regimes.
An evenly distributed mash sample volume was taken from the outlet of
the mashing vessel, after filling the lauter column. 146.5 ml of mash were
then placed on a 1000 ~m sieve. The mash was then washed through the
1000 ~m and through a 150 ~m sieve below it with cold water. The sieved
mash suspension was collected in a bottom tray. Normal tap water was
used. The sieves were then placed into a drying cabinet for 24 hours at
120°C. The liquid volume of the bottom tray was determined and 10 ml of
this suspension were filtered through a Whatman No. 541 filter paper, to
determine the dry solids of the fine fraction.
The particle residues on each sieve and on the coarse paper filter were
washed and dried. The dry weight of solids in three size classes was
analysed for 12 trials (see Figure 4.6).
ro,------,---,-----,----------.
, 40 ---------.----- ... --------!._-
10
,
"-----.-- '---'--1"-"---
t
, , ,
O+-~--.-----+_----T-----+_----._--~ o 200 400 6JO !lOO 1000 1200
Sieve Size (jn1]
Figure 4.6: Dry solids after mashing (average of 12 trials with error bars ±1 SO) in three size classes

101
It was found that this method is relatively inaccurate for the following
reasons:
• Sampling of mash is difficult due to large amounts of large particles
bigger than 1000 IJm. These particles sediment quickly, hence it is
difficult to create even mixtures. This reflects in the wide standard
deviation of the >1 OOOlJm fraction.
• Extract, mainly sugar, needs to be washed out of all fractions because
it affects the dry weight of the solids. As the fine fraction does not filter
well, washing is very time consuming and inaccurate. This affects
mainly the fine fraction below 1501Jm, which was filtered and washed to
remove the sugars.
Despite the inaccuracy, the analysis can significantly indicate high attrition
levels created in the 'valve' trials. This analysis was used for those
experiments to quantify attrition.
The distribution of fine particles below 106 IJm has never been analysed
quantitatively. However, several references point out that fine particles
have strong impact on lautering performance. Therefore fine particles in
the sieve fraction below 106 IJm were analysed in great detail using the
Coulter Counter Multisizer and the LS 130 Laser Sizer. Laser sizing was
used as a standard procedure, because of easier sample preparation and
data handling.
The two different methods were used in parallel in a set of trials (Figure
4.7 and 4.8) to assess the relevance of the information and to verify the
results of the Laser Sizer.
Both examples show in general similar distributions, however, the
distribution of the Multisizer is narrower and the particle size is shifted
towards smaller size. One explanation for the difference is the nature of
the material analysed. The mash particles contain high amounts of
protein. In aqueous solutions with high salt concentration these
substances can dehydrate, which causes the particles to shrink. In
addition, such proteinaceous material can be highly porous and, hence,
the liquid volume replaced (Multisizer principle) by one particle is smaller
than the volume which could be calculated from its surface area (Laser
Sizer principle).

1anoo.---------------------------------~--__,5
f-o- MS6SoC 8o:XX) - - 1-<,- MS 7S'C
-'-LS6SoC -'-LS7S'C
2 3 4 5
- - - - - '1 - - - - - - - - - - - - - - - - - - - - - - .•.• 4
,
2~
10 20 30 40 50 100
Partide Size [~ml
Figure 4_7: Trial 66 PSD of the fine fraction (below 106 ~m sieve) analysed with both
Multisizer and Laser Sizer.
1anoo ~ .. .
. l ...... _/,/,\ .. /_, , ... \.
f-.- LS 80'C i'" l \ -'-LS9S'C, i V \ .
4 - f-'- MS 80'C· ,,,(;.A·.. '\ "0' ' I «' .... iE f-"- MS 95'C : J" i \, '\'\ ~ , /. \' . ~ 3------ - -- -:- '!k- -- \ \--
o~~( i \ '\ \:\' t / I l °b'h \., . -----.- ------ --)l:)i" ---T --~: -.-.- -K---.- -
~ 1 - - - - - - - _",0//(,[_ ----\l-~"J":'< -'~~----r::iS' ,-0 , 8.' •
a e'· J' , ,J, \~ aJ:P .-rl., ,j' I ••
...... ~,pt! ( t"\ -_: • :~··F<lJ' ! O.f. ____ of'f!. '
= 8o:XX)
= 'E 8o:XX)
a ~
froX) .=! ~
40000 ~
= ;;;;
" ::; = 1CXXXl
• 0
5
2 3 4 10 20 30 40 100
Partide Size [~ml
Figure 4.8: Trial 66 at 80 and 95'C on both Multisizer and Laser Sizer
102

103
The Multisizer was equipped with a 140 Ilm aperture tube; this gave an
analysis range from 2.5 to 78 Ilm. In three distributions (at 65, 75 and
800 G) fine particles with particle diameter below 2.5 Ilm could be found
and it can be assumed that even smaller particles were present, but could
not be detected because of the analysis range.
The Laser Sizer detects mash particles down to 2 Ilm. As only relative
concentrations are calculated with the diffraction model, smaller particles
are not shown, because of the large concentration of bigger particles in
the range of 20 to 40 Ilm present in the 106 Ilm sieved mash.
In addition to the particle analyses described before, image analysis of
mash particles was undertaken using scanning electron microscopy
(SEM). With this method it was possible to get more information about the
shape of the fine particles in the mash.
The pictures attached in Appendix 7.5 show the amorphous, gelatinous
structure of these particles. For this analysis fine particles from the
samples prepared for the Multisizer were attached to a membrane disk
(Millipore 0.451lm) by filtration. It can be seen that the shape of most
particles changes as they are drawn into the filter surface matrix. The size
of these layers varies from sub micron to the 100 Ilm range. The three
dimensional structure is very difficult to identify in this status, but it seems
to vary with temperature. At temperatures from 65 and 75°G the 'sheets' of
particles on the membrane are very flat, whereas particles incubated at
higher temperatures (95° G) seemed to have a firmer three dimensional
structure. In general the structure of these particles can be described as
amorphous, which gives them a relatively high surface area.
4.1.4. Properties of Spent Grains Cake Layers
Two discrete layers can be identified in a spent grains cake. A relatively
thin top layer which contains mainly fine material and a thick layer which
contains a mixture of all other, bigger particles. A photograph of a vertical
section of the entire cake is shown in Picture 4.1.
After filter cake washing the fines layer has a height of approximately 1 to
2 cm. The second layer of the cake is much thicker, approximately 25 cm
in height. These two layers are characterised for their particles, particle
size distributions and for their filtration properties.
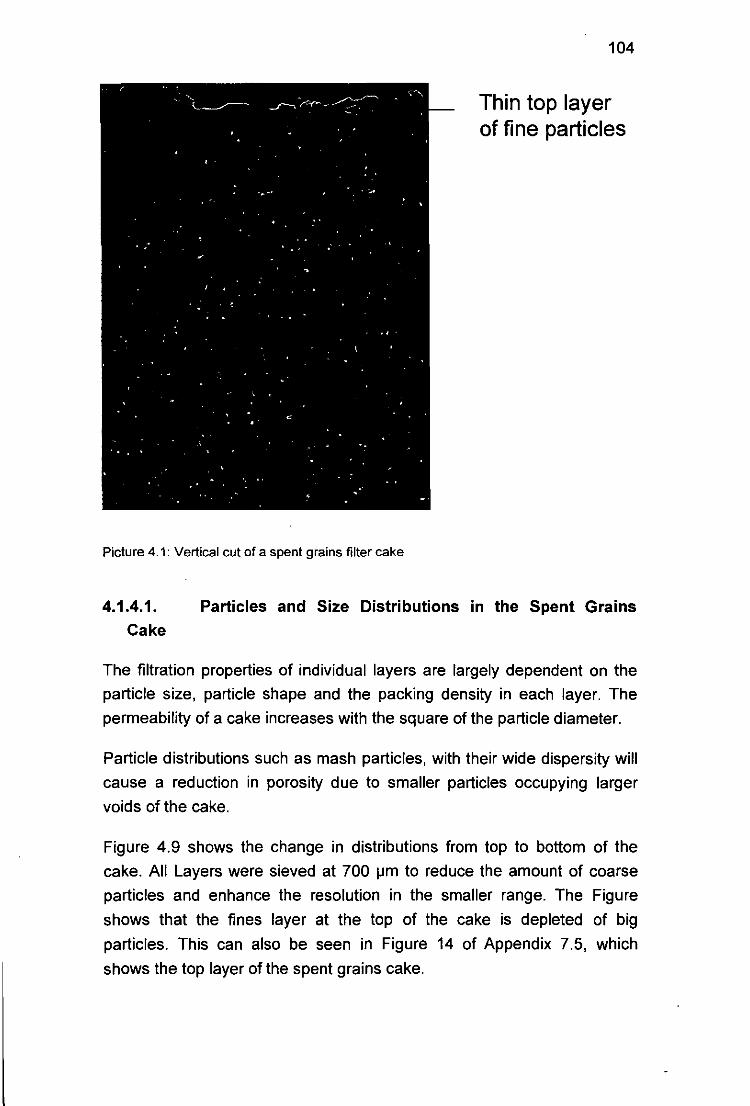
Picture 4.1: Vertical cut of a spent grains filter cake
104
Thin top layer of fine particles
4.1.4.1. Particles and Size Distributions in the Spent Grains
Cake
The filtration properties of individual layers are largely dependent on the
particle size, particle shape and the packing density in each layer. The
permeability of a cake increases with the square of the particle diameter.
Particle distributions such as mash particles, with their wide dispersity will
cause a reduction in porosity due to smaller particles occupying larger
voids of the cake.
Figure 4.9 shows the change in distributions from top to bottom of the
cake. All Layers were sieved at 700 IJm to reduce the amount of coarse
particles and enhance the resolution in the smaller range. The Figure
shows that the fines layer at the top of the cake is depleted of big
particles. This can also be seen in Figure 14 of Appendix 7.5, which
shows the top layer of the spent grains cake.

105
Despite the sieve step at 700 ~m a large quantity of bigger particles was
present in the analysed suspension. This effect can be explained with the
shape of the particles. Most large particles can be derived from the barley
husk. The shell (husk) of the kernel is very hard and flexible. If it breaks, it
will crack in the axial direction rather than across the length axis. This
effect can be seen on the electron micrograph picture, Figure 7, in
Appendix 7.5. The large husk in the centre of the picture is split in the axial
direction. In addition this picture shows that the inner (concave) side of the
shells are empty because this material has been degraded during the
mashing process. Large mash particles are elongated, with a bent shape.
The layer close to the bottom of the cake has also been analysed by wet
sieving (see Figure 4.10). The biggest fraction of particles is the fraction
above 1OOOlJm. It contains the husks and makes up 65% of the weight of
all sieve residues. The second largest group with 16% of the total dry
weight consists of particles bigger than 710 ~m. The remaining residue on
the dried sieves makes up only approximately 20% of the total dry weight.
The fines smaller than 106 IJm were not analysed in this trial.
7r---------------------------,-------------,
Partide Diameter [~ml
Figure 4.9: Particle size distributions in four different layers of the spent grains cake

106
4.1.4.2. Permeability of the Spent Grains Cake Layers
From two lautering trials (Trial 58 and 59) samples of the two spent grains
layers were analysed separately in a laboratory scale filtration stand (EBC
Filtration Stand). To achieve a satisfactory filtration effect, a needle felt
type AMN (P+S Filtration, Rossendale, Lancs. UK) was used as a filter
medium. The differential pressure across the cake was set constant at 100
mbar.
Table 4.2 shows that the permeability of the fines layer is approx. 40 times
lower than the permeability of the spent grains layer. The difference in
particle size distributions already indicated the different permeability. The
fine particles cause much higher packing density and hence cause higher
resistance to flow through the bed.
During subsequent experiments and in modelling of the lautering
procedure, it was assumed that the fines layer is dominant in determining
the permeability of the cake.
ooo.~----------~----~----------~------,
45.0.
40.0.
35.0.
15.0.
10.0.
, ... - - - - - - - - - - - - - -- - - - - , - - - - - - - - - - - - _. .-_ -:'-:-"7.-:. -: .. -.":.
5.0.
o.o.+-~~~----r-~~r----.-----+--~~ 1<XXl 1200
Figure 4.10.: Wet sieve analysis of spent grains cake bottom layer. (5 analyses with error
bars ±1 SO)

107
Using the data in Table 4.2 it can be shown that this assumption is valid.
Typically the height of the spent grains section of the cake is 0.2 m, the
height of the fines section is approximately 0.02 m. Disregarding
compaction of the cake with height, the calculated average resistance of
the fines layer would then be 4x10¹¹ m-1 and the resistance of the spent
grains section would be 1x10¹¹ m-1. This results in a total resistance of
R,ola' = RSG +RF = 1x 1 ottm-' +4 x 10ttm-' = 5 x 10tt m-'.
Table 4.2: Filtration trials to determine the permeability of different spent grains layers
Sample t,.V/t,.t [ml/s] L [mm] Permeability [m2]
Spent grains 3.64 30 2.048x10⁻¹²
58
Fines 58 0.85 3 4.781x10⁻¹⁴
Spent Grains 3.1 33 1.918x10⁻¹²
59
Fines 59 0.95 3 5.344x10⁻¹⁴
Another approach to determine the permeability of individual cake layers
was undertaken in the pilot scale lauter column (Trial 12). Known
quantities of cake sections were suspended in hot water (75°C) and
pumped into the lauter column. After an initial sedimentation phase the
clear supernatant was filtered through the cake. The flow rate of filtrate
was set constant and the corresponding differential pressure was
measured. The concentration of dry solids was determined. The fines had
a dry weight of 1.90 g £-1, the spent grains had a dry concentration of 2.16
g £-1. The permeabilities of the individual layers are presented in Table
4.3. As the flow rate of the peristaltic pump was used as a parameter it
was not possible to obtain two sets of data at identical differential pressure
levels.

108
Table 4.3: Permeability of the two sections of filter cake
Sample tNItJ.t [mlls) L [mm) tJ.p [mbar) Permeability [m2)
Spent Grains 4.036 65 10 7.342x10⁻¹⁰
12
Fines 12 1.163 12 60 6.509x10⁻¹²
The combined total resistance of these two layers (again ignoring the
compressibility of the cake) would be (at a spent grains height of 0.2 m
and a fines height 0.02 m):
Rtotal = RSG + RF = 2.724x10⁸ m-1 + 3.073x10⁹ m-1 = 3.345x1 09 m-1.
The average resistance of a typical lauter tun cake (determined for
example in the trials described in Chapter 5.2) with a height of 0.25 m
would be 1.25x10¹⁰ m-1. The variations in overall resistance between
these two trials and the lauter tun cake resistance could be assumed to be
an effect of the different differential pressures across the cake.
More important than this calculated overall resistance is the fact that both
trials showed a much lower permeability of the fines layer than of the
remaining spent grains cake. This data supports the supposition further
that the fines layer determines the filterability in lautering. It seems
therefore valid to focus in more detail on effects of the mashing stage on
the filterability of the fines layer to derive fundamental information about
influences on lautering performance.
4.1.5. Change of Particle Size Distribution of the Fines during Mashing
In this study the particle size distribution of the fine fraction of mash was of
major interest. The PSD of this fraction has been monitored during the
standard mashing process (un-agitated sample in laboratory trial, see

109
Figure 4.11). A change in the distribution was found: the breakdown of
starch particles during mashing decreases the size of the peaks at 4 and
20 IJm. An additional peak occurs at 80 IJm. This peak consists of
proteinaceous material. A chemical analysis of the composition indicated a
protein content of over 40% (w/w). Particles in this peak can be broken
down enzymatically. Figure 4.12 shows the breakdown of these particles
(from an agitated trial (Trial 29) by different groups of enzymes. This trial
indicates that proteins and carbohydrate material is present in this group.
Enzymes which are breaking down carbohydrate chains seem very
effective in degrading these particles. However, the commercial enzymes
applied in this trial very often contain small amounts of proteolytic activity,
which makes it impossible to determine the nature of these particles with
high accuracy. The particles in this fraction consist of carbohydrates and
proteins.
10r-------------,-------------,-------------,
-0- 1 min, 6SoC
8- -- - -,,- - IS min, 6SoC - -A- - 40 min, 6Soc
-0- 70 min, 7SoC
2 --
Size [~ml
Figure 4.11: Change of particle size distribution of the sub 106 IJm sieved fraction of mash
during mashing

5.5-,-------------------,
...... - - - - - - - - - - - ....... - - - - - -0- Untreated CorIroI
. -9- CelllJase
~ "" _______ .~~~_~~".: • .!.. -e- a:Amylase
.. -. --t-.. :::=" . =:=~:::....,
;j!. 3.0 - - - - - - - ,/0 ...... ;0;0-: \ .. _ .. _ ..... _______ _ Cl) Ij' . •••• • ••• .• ~
5.0
4.5
4.0
3.5
1.5
05 0 \
O.O.,..._.,;:...~~~...._--~-.... '...,..---o ---I 1 10 100 1000
Size [~ml
Figure 4.12: Particle breakdown in the 100~m range with enzymes
4.1.6. Density of Fine Mash Particles
110
This analysis is important for the modelling of sedimentation in the lauter
tun. If particle shape and size and density are known it will be possible to
predict the settling behaviour and relate it back to the performance in the
lauter tun. Density of clear wart Pw and wart with particles Pwp have been
measured using a density bottle.
The density of the clear liquid is determined by mass of liquid m1 and
volume of the density bottle Vo:
m P1=~
o 4.1
The density of the suspension is composed of the mass of particulates
and the mass (mp and mW2 ) of the liquid in the density bottle:
4.2

111
and the volumes of the solid and the liquid fraction:
4.3
known variables: p"m"VO,P2,m2,
The volume of the particles Vp has been analysed by centrifugation in a
laboratory centrifuge. It is then possible to determine the liquid volume in
the sample:
4.4
The mass of the particles can now be calculated by combining equations
4.1, 4.2 and 4.4:
4.5
The particle density can then be calculated:
4.6
The densities of the fines fraction from three independent trials were
analysed. The particle density covered a range of 1.090 to 1.150 g/ml.
4.1.7. Viscosity of Mash
4.1.7.1. Viscosity Change During Mashing
It was not possible to acquire information from the literature about the
change of viscosity of mash during the conversion. Therefore trials had to
be carried out, defining viscosity levels after different conversion intervals
with different mash concentrations. Mash was incubated at 65°C for
defined time intervals. As mash contains high amounts of big particles
disturbing the viscosity analysis, the mash had to be filtered using a

112
pleated high capacity filter. The viscosity of the solid-free filtrate was then
determined in a falling ball viscometer, described in Chapter 3. The
following results were obtained (Figure 4.13 and Table 4.4):
Table 4.4: Viscosity in relation to conversion time and concentration
Liquor to grist ratio Viscosity after Viscosity after Viscosity after
(mash 10 min 40 min 70min
concentration) conversion time conversion time conversion time
3:1 1.033 mPas 1.056 mPas 1.067 mPas
3.5:1 1.023 mPas 1.049 mPas 1.055 mPas
4:1 0.704 mPas 0.834 mPas 0.811 mPas
1.0.-------------_-~--_-__,
0.6
, , . - - 1- _ ..• , , , ,
"------ ---- --- ---_.,-_. __ ._--, , , -0-3:1
- -0- - 3.5:1 ___________ 1
- -6- -4:1
0.5 +--_;-~_;_~-T_~_i_-~_;_-_;-~_r~__l o 10 20 30 40 50 60 70 so
Mash oonversion lime [min]
Figure 4.13: Viscosity in wort
This result shows that viscosity increases with conversion time. It is mainly
the concentration of sugars and, other soluble substances which increase
viscosity. It can be concluded, that with concentrations below 3,5: 1, a final
maximum viscosity is reached after about 40 min of conversion. This
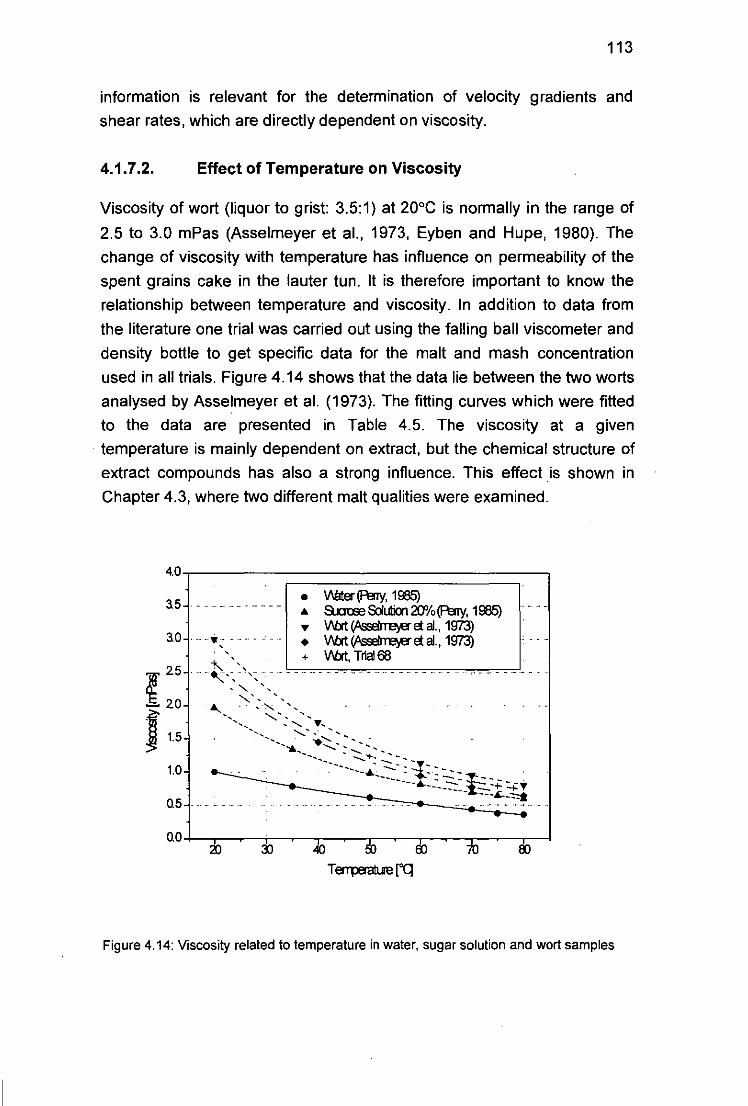
113
information is relevant for the determination of velocity gradients and
shear rates, which are directly dependent on viscosity.
4.1.7.2. Effect of Temperature on Viscosity
Viscosity of wort (liquor to grist: 3.5:1) at 20°C is normally in the range of
2.5 to 3.0 mPas (Asselmeyer et aI., 1973, Eyben and Hupe, 1980). The
change of viscosity with temperature has influence on permeability of the
spent grains cake in the lauter tun. It is therefore important to know the
relationship between temperature and viscosity. In addition to data from
the literature one trial was carried out using the falling ball viscometer and
density bottle to get specific data for the malt and mash concentration
used in all trials. Figure 4.14 shows that the data lie between the two worts
analysed by Asselmeyer et al. (1973). The fitting curves which were fitted
to the data are presented in Table 4.5. The viscosity at a given
temperature is mainly dependent on extract, but the chemical structure of
extract compounds has also a strong influence. This effect is shown in
Chapter 4.3, where two different malt qualities were examined.
• VISta- (F\3ry, 1005) • SJcJooe S:JIution 2O'/o(F\3ry, 1005)
3.5 .... - ... _ .. -
... VIbrt (Ass:/IT"f¥lI"et al., 1973) • VIbrt (Ass:/IT"f¥lI"et al., 1973) + VIbrt, Trial 68
05·
Figure 4.14: Viscosity related to temperature in water, sugar solution and wort samples

114
Table 4.5: Third order polynomial regression on viscosity vs. temperature data
Medium Fitting Function Regression
Coefficient
Water (Perry, 1985) y = 1.408 - 0.02419 x + 2.117 x 10-4 x2 -9.341 x 10-7 x3 R =0.999
Sucrose 20% (w/w) y = 3.349 - 0.08823 x + 0.0010 x2 -4.683E-6 x3 R =0.999
(Perry, 1985)
Wart 1, (Asselmeyer et y = 5.220 - 0.1409 x + 0.0016 x2 - 7.083 x3 R =1
al. 1973)
Wart 2, (Asselmeyer et y = 4.266 - 0.1139 x + 0.001322 x2 - 5.811 x 10-6 x3 R =0.999
al. 1973)
Wart (Trial 68) y = 4.564 - 0.121 x + 0.00141 x2 - 6.073 x3 R =0.999
4.1.8. Industrial Scale Power Input
In a questionnaire, 5 BRFI member breweries were asked to provide
information on practical energy input into the mash during mashing. The
following results were obtained from 5 different brewhouses (see Figure
4.15). Brewhouse A applied a decoction mashing procedure with two parts
of the mash being boiled. All other brewhouse procedures were based on
infusion mashing.
Figure 4.16 shows that mashing time and maximum power input levels
vary in a wide range, even for infusion mashing procedures. This can be
due to different stirring intensities. However, different stirrer design and
different mash solids concentrations could have additional impact.

115
1.6,-------,------_-,-_______ --, :1
!I 1:1 I I I'll l'l I 1.2~ ~J i J ! 11 =-===~ ~ 1.0 lit 1 !: 11 ~il ~--- ==~ f 0.0.6
8 - -1- -1-11- --I: -:: -1- 1---------!- -----1- ------ -----
~ -1- -I-l- -11-l-I-I- --------: -----: ------- --- --i 0.4 -1-- I --il- -- ---11- ~Ir -1-- -- -- ' , ,
1.4
0_2. - -I ~ -t-- , HI -~I ~I- --------~ ---'" _! l! -
, I _ _1_ - - ,- - - - - -I " ! : -,T-
O'O~~~~~~'L-,-L-~~._~~~~~~~~"-~-~'~-~,~--~-~-~ 140 20 40 60
fv'asI1rg lirre [nin]
Figure 4.15: Variation of specific power input for different brewhouses (Brewhouse A could
not be displayed because of the use of a decoction mashing procedure)
0.7~------------------~
0,6
0,5
~ 0.4
I -;: 0.3
~ 02
0.1
0.0 A B C
Brewhouse D E
Figure 4.16: Average specific power input in different brewhouses
It can be seen that power levels for industrial mashing equipment vary
over a wide range, between 0.11 and 0.64 W/I.

116
The total work input depends on the stirring time. Figure 4.16 shows that,
due to the long mashing time in brewhouse A, the work input is the highest.
7000.------------------------------------.
6000
5000
2000
1000
o A B C
Brewhouse
D E
Figure 4.17: Specific work input over the entire mashing time.

117
4.2.Agitation Pilot Scale Trials
Pilot scale trials were carried out to get information about the effects of
mash agitation on lautering performance. Different agitation levels were
created in a flow loop, as shown in Chapter 3 by means of a single seat
valve or with orifice plates. Trials of agitation effects on lautering
performance were started at the pilot scale because this size would
enable scale-up to large industrial scale much easier than bench scale
tests. Results about parameters such as washing efficiency and clarity of
the filtrate are also much easier to obtain.
4.2.1. Valve Trials
4.2.1.1. Introduction - Aims
Different levels of energy loss were created in the flow loop of the pilot
mashing rig using a single seat valve which creates constant pressure
losses. The flow rate Q in the loop was kept constant at 25.3 C min-1 for all
trials. The use of a positive displacement mono pump enabled constant
flow even at different pressure losses. Sufficient mixing was achieved by
constant recirculation of mash. The interface to air was constant, as the
mash surface was kept quiescent. This was thought to be a clear
advantage compared to stirring with an impeller. As oxygen was reported
to have additional effects on lautering and wort composition, this was a
suitable way of keeping this parameter constant.
The pressure loss at the valve was varied in a range from 0 to 1 bar. This
range of pressure loss !Jp can be related to the energy loss Pas:
P=!'>.p.Q 4.7
The range of power loss can be related to the volume of mash in which
this energy dissipates. It can be assumed that the energy dissipates in a
small pipe section, along a length L, mainly before and after the valve.
With this assumption, it is possible to calculate the specific power input
into the mash across the valve to:

p = /).p.Q = /).p.Q spec. V d 2 "
-L 4
Picture 4.2: Flow loop at the mash vessel
118
4.8
Figure 4.18 shows the specific power input across the single seat valve,
for a pipe length, L, of 17 cm (V=295 ml). This is the distance between the
left corner of the vertical pipe and the centre of the pressure transducer.
4.2.1.2. Results
12 trials have been carried out, covering the pressure loss range from 0.0
to 1.0 bar. This relates to an energy input in the range 0 to 150 W/f. (see
Figure 4.18). This range covers even extremely high agitation conditions.
Agitation effects, caused by the Mono pump were consistent for all trials,
as the flow rate and the total pumping time were not varied. It has to be
mentioned, that the power input of the Mono pump causes a background
agitation level. Its magnitude could, however, not be quantified.
Different parameters relevant for lautering performance were analysed.
These analyses are discussed below.

140 , , ,
- - - - - - - - - - - - - - - - - T - - - - - •. ,-•..
-------------~----- ----------~--------
----------------- -------------,
-----~----------------~--------
O~--~_.------_r------._----_;------~ 0.0 0.2 0.4 0.6 O.B to
Pressure loss aaoss the 9O"va1ve [bar]
Figure 4.18: Specific power input at the single seat valve
Extract and viscosity of mash
119
Figure 4.19 shows extract and viscosity in relation to the power input. Both
parameters show some variation, however, an influence from the
parameter agitation couldn't be identified. Correlation coefficients from the
linear fitting function are R = 0.34 for Extract and R = 0.49 for viscosity in
the mash liquid phase. Different agitation levels seem to have very little
effect on these parameters.
Wet sieving of mash
Mash samples were sieved through 1000 and 150 IJm sieves, to
investigate if particle break-up can be observed. Figure 4.20 shows the
effect of particle attrition. With increasing amounts of power dissipated in
the liquid, more fine particles are created (R= - 0.81 for the fraction
>10001Jm and R = 0.82 for the fraction <150IJm).

18.01.======:::::;--r----';,=====::::::::==~ 0.80 • Extract in tl'<! Mash , j 0 IAscosity at 75°C
17.8 - - -I - - - - r - - - - - - - - 'l - - - - r
'0 ' ! 0 I A
17.6 t-=-=-=-=~-~-j,~-..::-..::..::..::..::.::..:-~c.::..:.::..::.~L,-v:r-~~-=---=--.::...:.=~~~--':L-__j- 0.75
17.4 . - - - - -0 - - ~ - - 0- - - <$>- - r - - - - - - - - ~ - - - - - - - - - r - - - - - - - - " , ---------~---------r--------~---------~---------
O~ 17.2
17.0, -
, , .....• , .. .. _. - ---
16.4 - - - - - - - - - -l - - - - - - - - _ I- ________ -l _________ , ________ •. _ , , 1a2----------~---------~--------~---------~--------.
I ! I I ,
16.0+--~-__+--~-+_----+-~~--i--_-_I 0.80 o 50 100 150 200 250
Specific power input [Wr']
120
Figure 4.19: Extract and viscosity change with specific power input in the liquid phase of mash samples
ro~---~--~~--~---~--~ , , , , 'I '" I 00 . - .. - - - - - - ~ - - - - - - 6 - - ~ - - - - - - - - ~ - - - - - • :~:: - - -
50 f-~-~-~-~-~-~"'~-~-~-~-~; -~-~-~--:-:--~"'~"'c:--:-1:-"-,.".-----o..:.-"';.~-~i -:..:..-.:.-~-~-~-~-~"'~- ~ - - - - - - - - . I ~ :
I I I j ---------,---------r--------,---------r----h----. : _________ -l _________ I- ________ ~ ___ _
, , ,
20 • , , I • I ,
---~--~--------l---------r---------. ' , 10 ---------~---------,--------1---------r---------
, "
O+---~--+_------~~--~--~--~------o 50 100 150 200 250
Specific power input [Wr']
Figure 4.20: Dry weight of two sieve fractions of mash

121
Change of the particle size distribution in the fine particle fraction
Fine particles below 106 IJm have been analysed in more detail using the
LS130 Laser Sizer. Figure 4.21 shows a distinct change of the mean
particle size (MPS) of the number distribution with power input. The
biggest changes occur already at very low levels, which indicates that
some fractions of mash particles are very sensitive to attrition. The
smallest MPS found in the trials was at approximately 3.5 IJm. This
suggests that this is the lower end of the analysis range of the LS 130.
Extract in Wart
Extract in the filtrate sample changes only slightly with agitation. The
biggest changes were observed at minimal agitation levels (see Figure
4.22). At higher levels of agitation no significant changes are observable.
This analysis is depending on the variations of water to grist ratio which
could occur due to variations of the brewing procedures. This effect makes
the data less accurate.
7.0,-------,------,------,------,-----,
6.5
6.0
'E 35.5
.~ ~ 50
II 4.5
m ::;; 4.0
, , .- - - - -1-" _ ..
, - ...... ,.~ , ,
, " _________ J _________ L ________ ~ _________ L ________ _
" ,
, -- ------~---------~--------~---------~---------
• I I I , ,. . ,. - - - - - - - - ... - - - - - - - - - ,- - - - - - - - - -1 - - - - - - -- - - t- - - .• - - - - - -.. , , , , , . - - , .... - - - - ., - - - - - - - - r ". - - - - - - - ..., - - - - - - - - - r - - - - - - - - -, , , , , ---------l---------r-----, ,
, . ' ~5 ---------~---------~--------~---------~----i----
I I I I
, " 3.0+--~-_t·-~-___+-~-___+·-~-___+-~-_l
o 50 100 150 200 250
Specific paNer input IWJ ']
Figure 4.21: Change of MPS with increasing agitation

13.0 -,-----,-----,-----,-----,-----,
_ 12.5
~ t::
~ 12.0 ~
, , ,
~----,,-t--------"- ----.-'---- -----------. -. ~ !
" " ' .5 I I :
tS I I I I
~ 11.5----------~---------~--------~---------~---------I I I I
I I I I , , , , ,
, , 11.0 +--~-_i,---__t,-----t-----i----l
o 50 100 150 250
Spedfic power input [WJ 1 J
Figure 4.22: Change of extract content in wort with agitation
Mean turbidity of wort
122
Turbidity was measured in-line over the entire lautering time. The average
value calculated after integration was related to the agitation input into the
mash. It can be seen in Figure 4.23 that, with increasing agitation, the
turbidity levels increase. This is in accordance to the findings in the dry
solids analysis which showed an increase in the fines fraction and with the
laser sizing analysis of the fines which showed a reduction in size of small
particles. This analysis documents that smaller particles can not be
restrained in the spent grains cake, they are carried over into the filtrate.
The level of turbidity in the wort is relatively high compared to normal
brewery conditions (Englmann and Wasmuth, 1993), which indicates that
there were high amounts of fine particles in the mash. A direct comparison
of this analysis with brewing practice is not possible as recirculation of the
first cloudy wort back on top of the spent grains bed was not used.
Dry solids in wort
The dry solids loading increases with agitation (R=O.67) (see Figure 4.24).
However, the analysis conditions show a high variation. This might be due

123
to difficulties in sub-sampling. Again normal brewhouses could achieve
lower levels of solids of approx. 34-40 mg/l. 200 mg/l as obtained in these
trials were described as hazy lautering (Englmann and Wasmuth, 1993).
100.-------~------~----------------------~
140 ..... : - - - - ,- -. - ~ - - - - - - - -:. - - - - - -. - - -- •
,
00 --------,--------,--------,----------------. ,
oo+-------_r--~--_r--~--_r-------.------~ o 50 100 150 200 250
Specific power input !\N.r ' )
Figure 4.23: Turbidity increase with agitation
O~.---------------------------------------~
... .2!
~
020
~ 0.15
. 5
'" ~ 5l ~ 0.10
•
•
• • •
• • - - - - - - - - - - - - - - - - - - - - - - - .-
•
, . ' , •
0.05 +-------.--------.--------...,--~--_r------_j o 50 100 150 200 250
Specific power input [W.r')
Figure 4.24: Dry solids in wart with regards to specific power input

124
Lautering
Lautering performance was determined as total lautering time, which was
the time required to collect 11 litres of wort, and as extract ratio between
mash extract and wort extract. Mash and wort volumes are constant,
therefore the ratio between mash and wort extract can show differences in
washing efficiency of the filter cake. In Figure 4.25 the total lautering time
is plotted against the agitation regime. It is clearly visible that agitation
affects wort run off, however, the variation between the trials was relatively
high. The formation of the cake in the lauter tun can have additional
effects on total lautering time. It was found in some trials, that an uneven
distribution of the mash particles could cause great variations in run off
rates, particularly if the amount of coarse particles was too low, when the
run off rate was reduced. This effect was due to sedimentation of larger
particles in the mash vessel. It was later found that this effect could be
avoided, by application of manual stirring before the mash transfer.
100,-------,-------,-------,-------,-------, , 100 - - - - - - - - - ~- - -- - - - - - ~ - - - - - - -Y ~- - - - - - - - - ~ - - - - - -- --
" , " , 1W .--------,------ ---r--------,---------r--------
, , " .. 100 ---------,---------r--------,-------- ,---------
"E' I I I I
§. 150 - - - - - - - - - ~ - - - - - - - - - :. - - - - - "' I ....•. , .,. •. :. _ . __ .• ,. ___ _
I 1~ ---------4-- ... ---~- ~ ------- ... J---------~---------, " , " ,---------~--------~---------~--------.
---------~---------~--------~---------~---------, , , , 110 _________ ~ _________ ~ ________ ~ _________ L ________ _
, , 100 _________ ~ _________ L ________ ~ _________ L _______ _
, I I I , , oo.+---~--~--~--~--~--~------~------~
o 50 100 150 200 250
Spedfic power input [W.r ']
Figure 4.25: Effect of agitation on lautering time
Figure 4.26 shows the effect of agitation on washing efficiency in the pilot
lauter tun. With increasing shear, the efficiency shows a trend to get lower.
Biggest influences were again observed at the lower end of the agitation

125
range. The reduction in washing efficiency can be contributed to increased
blockage of pores in the filter cake. Hence washing and leaching was less
effective.
0.80,--------------_--, ___ ....
0.78
0.76
J 0.74
J i
0.72
• • •
...... ; ....
.' • , 0.70 ---------------.------------~-----------------
j 0.68
O.es
o 50 200 250
Figure 4.26: Extract ratio (Extract in the mash I Extract in the wart)
4.2.1.3. Conclusions
This set of trials showed that agitation measured as power input into the
mash influences mashing and lautering parameters. Quality parameters
. (such as wort clarity) are affected as well as performance parameters
(such as lautering time). However, these trials did not give an entirely
conclusive picture of the effects. The low end of the power input showed
the strongest influence in most of the parameters analysed.
Two effects may provide the reasons for this:
1. The biggest changes occur at very low power input. As brewers
observed differences in lautering performance with agitators, it seems
possible that significant changes happen only in the minimal power
input range used in industry.

126
2. Due to mixing problems and sedimentation of solids in the mash
vessel, local overheating could occur. This might have caused some
changes in the composition of the mash particles. Initially, the
temperature effect was not regarded very important for the mash
composition and filtration properties.
Subsequent trials should investigate the effects in a power input range
close to industrial scale conditions. This is a specific power input range
from 0 to about 0.6 W £·1 of mash (see Chapter 4.1). That is considerably
lower than the power dissipated in this set of trials.
4.2.2. Orifice Trials
4.2.2.1. Aims
Previous trials showed that major changes in analysis parameters
occurred at the lower range of power input. In addition, results from a
questionnaire to the brewing industry showed that the small power input
range is much closer related to practical conditions. This set of trials was
designed to create power dissipation at an orifice in the mash flow loop in
a similar range to industrial scale mash stirrers.
Trials were carried out using different orifice plates in a flow loop (see
Chapter 3.2 for the design). The orifice diameters were designed to
establish a specific power dissipation at the vena contracta of the orifice
between 0 and 0.6 W £·1. Figure 4.27 shows the power dissipation at the
orifices, calculated from differential pressure loss measurement before and after the orifice. The flow rate in the loop was constant at 4.22 x 10⁻⁴
m3 s·1. The power dissipated in 0.12 £ of mash.
This range of power input relates very closely to an industrially relevant
power input of 0 to 0.8 W £.1. It was assumed that the Mono pump in this
flow loop caused a background power input small enough to observe
changes in this range. All trials have been backed by chemical analyses of
the mashes and worts. Specific power input was calculated using equation
4.9.

0.7 -,--,------------,-------,----------,-------, . , 0.6 . - - -\- - - - - - -. - - - - - - -,- - - - - - - - - - - - - _. - _ .. - - - - .. t- - -_ ..
~ 05
~ OA
l03
1\ I I \ I
\""""\, ... . ',
" "-" _______ i.._
.----'~""
'. I 1 102 ,-, -.... , ....... __ . __ 'a., ...... ____ ; ________ , _______ : ___ ". _ I '_.
'" '.
0.1 - . - - -: - - - - - - - , - - - - - - -: - - - - >:-,~.< .. :._:_: __ :_;~_:_~_: __ : ____ :_; 0.0 -l--;--~---r--_--;-,~-_;,-~-_,__....:.::;=~--I
0.5 0.6 0.7 0.8 0.9
Diameter ratio (did.,)
Figure 4.27: Specific power loss at the vena contracta of the orifices
The power dissipation at the orifice is:
where
p= Q b.p V
P: power loss in the fluid
Q: flow rate
to
,1p: pressure difference between the two measuring points and
V: volume of mash between the two pressure tappings.
127
4.9

128
4.2.2.2. Results
Mash analyses
Extract content and viscosity measured in the liquid phase of the mash are
not affected by increasing shear. Both parameters were constant over the
agitation range.
The particle size distribution measured using two sieve steps (1000 IJm
and 1501Jm) and laser light scattering analysis of the fine fraction (below
106 IJm) showed no influence from increasing power input.
Wort analyses
Extract, in the filtered wort sample from the lauter tun, also showed no
significant influence of shear. Wort clarity, analysed as mean haze reading
over the filtration time in a turbidimeter, and as total dry solids in the
filtered wort, was also not affected by the shear created at orifices.
Lautering Performance
The time to collect a known quantity of wort was not influenced by the
agitation. It took an average 127 minutes to collect 11 ( of filtrate.
Permeability of the spent grains bed is also constant over the range of
power applied.
4.2.2.3. Conclusion
It could be shown that mechanical power induced at levels from 0 to 0.6
W (-1 at an orifice had no significant effect on mash and wort properties.
This behaviour may be caused by the use of a mono pump to move the
mash in a loop. The mechanical power input of the pump may be high
enough to cover any additional mechanical power dissipation at the
orifices. Changes could be observed at very high power input levels,
which are about 10 to 25 times higher than the maximum level created
with the smallest orifice plate.
It can be concluded, that the arrangement of the mashing equipment with
recirculation of the mash in a loop and the use of a mono pump was not
suitable to investigate changes in low power input conditions. However,
pumping was necessary to keep mash particles in suspension and to

129
avoid local overheating at the heating pads. Re-engineering of the pilot
mashing equipment during the experimental phase of this thesis was not
feasible. To obtain further data with small power input and to verify the
observations in the pilot scale, trials in laboratory scale were therefore
considered a suitable alternative.
Despite the difficulties with the available pilot scale mashing equipment, a
sufficient range of data could be obtained which enabled the modelling of
the lautering process to determine variations of the observed analysis
parameters.
4.2.2.4. Reproducibility Test
Physical analysis of mash and wortl/autering
The reproducible behaviour of these trials irrespective of the power
dissipated at the orifices made it possible to treat this set of trials as
reproducibility tests for the pilot plant. Table 4.5 shows the statistical
calculation of standard deviations for these analyses. The overall
reproducibility seems acceptable as most analyses show little variation.
Only the dry weight analyses of the fine particle fractions (sieve bottom
tray and dry solids in wort) and the wet sieving analysis shows a
considerable variation. This may be due to the difficulties in "sub
sampling" heterogeneous mixtures.
Chemical analyses
Chemical analyses of filtered (laboratory filter) mash and wort samples
(after lauter tun filtration) were obtained, which indicate that there are no
changes occurring during mashing with different orifices. Table 4.6 gives
the statistical evaluation of the results. The pilot plant allows the execution
of highly reproducible trials. The standard deviations of all analyses are in
the range of their analysis accuracy.

130
Table 4.5: Statistical evaluation of analysis data
Analysis Mean Sample standard Variation Number of
deviation, SO Coefficient, VC [%] values
Extract mash t6.72 ·Plato 0.13 ·Plato 0.78 12
Viscosity 0.745 mPas 0.008 mPas 1.05 11
Mash residual dry weight 61.1 % 5.0% 8.02 12
1 000 ~m sieve
Mash residual dry weight 23.7% 2.4 % 10.20 12
150 IJrn sieve
Mash residual dry weight 15.2 % 5.3% 35.16 12
bottom-tray
MPS (mean particle size) 4.742 ~m 0.255 ~m 5.38 12
Extract wart 12.17 ·Plato 0.16 ·Plato 1.28 12
Dry solids in wart 0.175gn 0.035 gn 20.09 10
Lautering time 127.15 min 7.56 min 5.95 10
Height of the spent 36.0 cm 2.2 cm 6.23 12
grains cake
Permeability at 5 mbar 4.70E-9 m' 6.73E-10 m' 14.32 11

131
Table 4.6: Statistical results of chemical analyses.
Sample: Mash Wort
Analysis mean standard variation mean standard variation
deviation of coefficient deviation of coefficient
sample [%] sample [%]
FAN (free amino 239 mg/l 3 mg/l 1.13 176 mg/l 3 mg/l 1.56
nitrogen)
TSN (total soluble 1405 mg/l 19 mg/l 1.38 1013mg/l 25 mg/l 2.45
nitrogen)
Polyphenols 248 mg/l 16 mg/l 6.55 245 25 10.24
pH 5.59 0.13 2.38 5.63 0.12 2.11
Colour 8.30 EBC 0.00 EBC 0.00 7.20 EBC 0.10 EBC 1.39
Apparent 71.00 % 0.58% 0.81 71.67% 0.47% 0.66
fermentability
4.2.3. Effect of Stirring on Mash Filtration Performance -Laboratory Scale Trials
4.2.3.1. Introduction
From the previous experiments, it could be concluded that the
investigation of very low stirring regimes and conditions without agitation is
only possible in small scale trials, where temperature control is achieved
by a water bath. It was found in separate pilot scale experiments that
temperature is an important parameter for the particle size distribution of
fines and filterabilily of mash. Trials with varying mashing off temperatures
were carried out separately from the main experimental programme to

132
investigate and quantify this effect. The results are presented later in this
thesis, but were available to decide about the progress of the experimental
programme. In conclusion, the results of the temperature trials made it
clear that accurate control is required for the investigation of other
mashing parameters such as agitation. Under industrial or pilot scale
conditions, heating with steam or electrical heating pads would cause local
overheating and charring on the heat exchange surfaces, because of
insufficient heat transport under such conditions. Hence, it was decided to
investigate these low levels of power input in a laboratory scale setup.
Zero agitation does not occur in modern brewhouses, but to get
information about the total range of power input would be useful to draw
conclusions and to model the process.
4.2.3.2. Aims
The aim of this set of trials was to investigate agitation effects with small
power input down to no agitation. Effects of agitation have been
investigated previously in pilot scale facilities, however, very low agitation
levels were not achievable, because of the constant power input required
for recirculation.
In this set of trials the following analyses were carried out:
1. particle size distribution of fine particles in mash (fines) below 106 IJm
sieve size
2. viscosity in mash
3. concentration of fine particles (dry solids)
4. extract content determined as density
5. filterability of mash.
4.2.3.3. Results
The range of specific power applied was in the range from 0 - 0.5 W £-1,
(see Figure 4.28; using normal mash concentration and different impeller
velocities). The more concentrated mashes had power inputs between 0.6
- 1.4 W £-1. This higher range was carried out to link this set of trials to the
pilot scale trials.

133
Specific power input
The specific power input relevant for large scale industrial mashing plants
is in the range from 0.05 to 0.65 W £-1 (see Chapter 4.1, with a maximum
agitator tip speed of 3 mls, at a distance of the agitator tip to the wall of 50
mm. The Haake stirring device is putting similar power levels into the
mash (see Figure 4.28).
Effect of agitation on mean particle size (MPS) - LS130 analysis
Particle size distributions were analysed on diluted, sieved (106 IJm)
samples. This procedure enhances the analysis accuracy in the small
particle range, most relevant for filterability performance. To enable
comparisons to be made between unimodal particle size distributions, the
MPS of the differential number distribution was used. It can be seen from
Figure 4.29 that agitation causes attrition of particles - MPS decreases.
For specific power inputs up to 0.1 W £-1 the MPS is nearly constant. With
higher levels of agitation, a significant decrease occurs, which reaches a
minimum MPS of 3.3 IJm at 0.3 W £-1 and stays constant thereafter.
0.005,------------.,.-----------,0.5
0.004
~ 0.003
Q)
e-~ 0.002
0.001
, . . ,
, , , , .
,
•
'. OA
en
03 ~ . 0
f 0.2 5" ~
- - - - - - - _!Ill. __ !I ___ :_ _ _ _ __ ~ _______ : _______ ~ _ _ _ _ _ _ 0.1 ~ • I ... :
, ~,
0.(XXl.-_-=="r--~_+-~--+-~__T---r__~---I 0.0 M 02 M M 08 1.0 12
v'P [m/s]
Figure 4.28: Effect of different stirrer velocities (as tip speed, Vtip) on torque and power
input in mash (420 ml,mash, concentration: 3.5 : 1)

52,---~--------~------------__ ---------,
5.0
4.8 •
4.6 •
4.4
~ 42
f£ ~ 4.0
3.8 .......... .
3.6
3.4
• - .,.
32+----r---,----+----r---,----.-~_.--_1 0.0 02 0.4 0.6 0.8 10 . 12 14 16
Spedfic Pcmer Input [WI]
Figure 4.29: Effect of agitation on MPS
Concentration of fine particles
134
The dry weight of fine particles (particles below 106 ~m sieve size) has
been analysed. Figure 4.30 shows that with attrition more fine particles are
created. From 0.2 - 0.3 W (1-1, the solids concentration of the fines does
not increase further, which means no additional particles below 1 06 ~m
diameter are produced. It can be assumed that a specific material, which
is sensitive to shear, is broken down into smaller particles. It can be
assumed that only a limited quantity of such shear sensitive material is
present in the mash, as a plateau of the fine particles concentration is
reached.
Density of mash
The density of the liquid phase of mash was measured at 20°C. Figure
4.31 shows the influence of agitation on the release of soluble material
into the liquid phase. Minimal agitation levels are already sufficient, to
improve diffusion and thus enhance mass transport. Zero agitation shows
wide variation, as convection during heating (from 65°C to 75°C) and

135
manual mixing of the cold sample (to ensure even sample distribution)
after mashing might have had an effect on mash-density. The density
remains constant, as soon as a minimal amount of mixing in the range of
0.05 W £-1 has been applied. This means that more powerful stirring
regimes will not enhance malt extraction, minimal levels are sufficient.
1.60-
, , .-'------'--, , --~-----1.40 - - - - - -~- ... - - ~ -- - -:- - - - 7 --
1); 1.20 ... :."" ""; .0.
S. ~ 1.00 • v
~ ell 0.60 ~ . o
• ,
.- ..... ""I,·",··, -- ,".'.' I···
, 0.60
_____ ...J _____ ~ _____ 1 _____ • .:. _____ , ______ ~ _____ 1 _____ _
I I I I
0.40 - - - - ,- - - - - ;- - - - - -1- - - - - -;- - - - - - r- _ .• - - ., - - - - - ... - - - - -
.
0.0 0.2 0.4 0.6 0.8 1.0 1.2 1.4 1.6
Spedfic Power Input IWIl
Figure 4.30: Effect of agitation on particle concentrations below 106~m
Viscosity of mash
It can be shown that viscosity and density for this malt correlate well (see
Figure 4.32). Therefore it is not surprising, that viscosity shows the same
behaviour with agitation as density (see Figure 4.33). Even very high
agitation levels (>1 W £-1) do not affect viscosity.

1.075 ... ", .. ~.~.~.~ .• ~ .. ~ .. ~:.~ .• ~ ... ~ .. ~-= .. -F .. ~'.~ .. ~ .. ~.'~' .. ~.'.!'!..=. ... =:.'=~== ... =. ~ .•............
• • •
1.070 __________ ... __________ .. _____ '- ____ "' _____ l _____ _
1.CB:l
U2 U4 U6 U8 1.0 1.2 1.4 1.6
~ FbNer InpJt [WI]
Figure 4.31: Effect of agitation on density in mash
2600
• 2400 •
--_ ... 200J _ .. '-1'0 .. , _ •..• - •...
, : -- \i1scosity = -39.329 + 38.fH! x Density (R=O.~)
t6OO+---'~--r-~--'-'--~--+-~--;"-~ tOO5 1.C6J tOO5 t070 t075
Density [glmI]
Figure 4.32: Density - viscosity correlation for small scale agitation trials
136

26 ... .. , ..... ... ... ...
24 ....... , ........ ,.... .'. • >, •• • ••• !,. ,
20 ........... ,
t8±-~T~--j-~---jr::--~:t:-~-+::-~--+~--;-.----1 M ~ M M 08 1~ 12 1A 1B
~c A::Mter 1npJ! [WI]
Figure 4.33: Effects of agitation on viscosity
Filterability of mash
137
Filterability 11K was determined from the slope K of a dtldV vs. V plot. This
slope describes effects of viscosity, particle concentration and cake
resistance, normalised to the filter area and the differential pressure
applied (see equation 4.10).
dV A2 I!.p 1 1 1 = -=--dt 7]ac V KV
4.10
Highest filterability levels were achieved at zero or at minimal agitation
rates up to 0.1 W £-1 (see Figure 4.34). Stirring with a power input higher
than 0.1 W £-1 caused a reduction in filterability. Again, the biggest
changes were observed in the range from 0 - 0.4 W £-1 specific power
input. This indicates already the strong link to particle size effects where
the biggest changes are also in this range. Filterability also approaches a
plateau for specific power inputs above 0.5 W £-1.

1.40<10-13 -,------,---,.--------,---,.------,-----,-----,
1.2x10⁻¹³
1.Ox10-'3
~ 6 Ox10-14 .0 .
i u: 4.Ox10- 14
2.Ox10- 14
••
•
• ... •
Range,pf..spep..pmver _ input in :
ind4Sbial mash,ing
• •
... """ ";--
• O.O~=;==r==-=;===;=="'i-~---;-~-i__-__;_~__;_-.____I
0.0 0.2 0.4 0.6 0.8 to t2 1.4 1.6
Specific Power Input [WI]
Figure 4.34: Filterabilily of mash in relation to agitation
Resistance
138
The specific resistance, a, of a mash cake, determined in the Millipore
filter is shown in Figure 4.35. The specific resistance describes the
structure of the cake, its voidage and the liquid-flow paths; parameters
which are largely affected by particle surface and particle size distribution.
It can be seen that the resistance of the bed increases linearly with the
power input. The strong decrease in filterability at low power input ranges
can therefore be explained mainly by the viscosity increase. The low
power range (up to 0.1 W C-1) again shows little change from the zero
agitation trials.
Correlation between MPS and Filterability
As described above, filterability is directly affected by particle size
distribution. Increases in particle diameter can increase filterability. Figure
4.36 shows this relationship. Better control of analysis conditions (mainly
temperature during the viscosity and filtration analyses) would help to
increase the accuracy of the filterability determination.

5.Ox1012 •
4.Ox1012
• 3.Ox10'2
• • • LOx10'2 ill
• 1.Ox1012
• O.O+-~-+~-.--~--.~---.~_.--~-;-~----,-.----l
0.0 0.2 0.4 0.6 0.8 1.0 1.2 1.4 1.6
Specific Power Input [WI]
Figure 4.35: Effect of agitation on specific cake resistance
'W
'"E ~ .0 I!! Q)
"" U.
1.6x1U 13
1.4x1U13
1. 2x1U 13
1.Ox1U 13
8.Ox1U 14
6.Ox1U14
4.Ox1U14
LOx1U14
. :. 1- )
O~I
",I. .. : '. , I ! I , ,. ,
----1----~---,----,----1----,----T-· .• -,- - - - i - - --
:. I I I I. I • ,
----'----r---'----,----,---- - - - T - - - -,- - - - r - - - -
, 1.4WI ,
.' .' ,
-- -". _.
.... , ..
, , ,
• "1-·' .. I , ,
., .. ,
O.O'+~_+_~_+_~_+_~_+_~_+_~_i_~_i_~_i_~_i_--.----l 3.2 3.4 3.6 3.8 4.0 4.2 4.4 4.6 4.8 5.0 52
MPS [~ml
Figure 4.36: Correlation between MPS and filterabilily
139

140
4.2.3.4. Conclusion
This set of experiments made it possible to investigate lower levels of
power input, without additional effects of temperature.
It was shown that all parameters are affected by agitation, however
significant changes were mostly observed in a minimal power input range
from 0 - 0.4 W C·1. Extract and viscosity, were affected in an even
narrower band from 0 to 0.1 W C-1. The range of power applied in these
trials was similar to industrial scales, which makes it possible to transfer
the findings. It can be concluded that power input could be reduced down
to 0.1 W C-1 to reach optimum filterability, without extract loss.
Power input levels higher than 0.1 W C-1 immediately exhibited negative
effects on filterability: MPS in the fines decreases and total solids levels
below 106 IJm increase.
For all analyses a plateau is reached at 0.5 W C-1, for this well modified
malt. Above this level analyses did not vary significantly. Pilot trials used a
flow loop with valves and orifices, the mash was pumped by a mono
pump. The mechanical energy input of this pump could not be quantified,
but it is now possible to conclude that, as no significant changes in extract
(density) or viscosity could be seen in pilot scale trials, its energy input
must be in excess of 0.5 W C-1. Effects on filterability above 0.1 W C-1
(where viscosity is constant) can be explained at a high significance level
(R=0.96) by a change of the MPS.

141
4.3. Effects of Final Mashing Temperatures on Lautering Performance
4.3.1. Introduction
Effects of different final mashing temperatures on lautering performance
have been previously reported in the literature. Increasing the temperature
from 65 to 75°e was found to reduce filtration time (time to collect a given
volume of filtrate) in lautering by over 40% (Kano and Karakawa, 1979).
This was explained by the residual amount of starch in the spent grains, , which is higher at lower temperatures.
In practice, the temperature of 78°e was found most suitable1 , because
run off rates are higher than at lower temperatures. The only explanation
for this increase of filterability with temperature was attributed to the
reduction of viscosity with higher temperatures (LOers, 1950; Hough et al.
1986; NarziB, 1985).
Particle size analyses of mash from previous trials indicated that
significant changes can be observed with different mashing regimes.
Strong agitation of mash, for example, created a higher proportion of fine
particles. The mean particle size (MPS) of a 106 IJm sieved mash sample
was reduced. A good correlation between MPS (number distribution) and
lautering performance (see Figure 4.37) was found.
These experiments were designed to investigate the effect of final
temperatures on the particle size distribution of fines.
11n large scale brewing, generally a final temperature in the mash of 78'e is used. At this
temperature, a small a-Amylase activity remains in the mash for a limited period. Higher
final mashing temperatures are not employed, because an extraction at higher
temperatures would result in a solubilization of higher dextrins and other branched
carbohydrates. These substances would not be degraded by the remaining enzyme
activity. Higher viSCOSity and turbidity in wort and beer, together with microbiologically
unstable products would be the consequence.

1ro~--------~----~--------~----~--~
, '''' .... ; I ,
160 . - - '''',<: -.. - .. -"I - .• - - •. "I' _ •.•. - I'· - •
C '''', :E-. ;', I - .........
........ ~....... I
, ...... r , I I
- - - - - - ~ - - - ".- ~ - - - ::-, ... ~~ - - - .-:- - - - - - ;- - - - - - ~ - - - - - -I ...............' I
......... !.. • j
; ---ii---~-
I-~ , I ----_
: --:----.--120 -, , ,
100+-~~--~_r~--r_~-~,~~--~-r~~ 3.0 3.5 4.0 4.5 5.0 5.5 6.0 6.5
Mean partide size (number distribution) [~ml
Figure 4.37: Effects from MPS on totallautering time
4.3.1.1. Aims
It was the aim of this set of trials firstly:
142
• to quantify the influence of mash temperature on PSD and viscosity,
and, secondly
• to identify, whether changes in particle size distribution (due to
temperature effects in mash) play a role in mash filterability.
Consequently, the extent of PSD and viscosity effects on filterability
should be quantified.
In this set of trials, specifically, the effects of final mashing temperatures
between 65 and 100°C were quantified with the following analyses:
1. the particle size distribution of mash (PSD)
2. viscosity,
3. extract content and
4. filterability of mash.

143
4.3.1.2. Experimental
Infusion mashing was carried out at a constant temperature of 65°C for a
time of 40 minutes. After the temperature rest, the mash was heated to
100°C. At 5°C-intervals, samples were taken from the mash.
In total, three trials were carried out. Two of these used the same well
modified malt and milling conditions but different brewhouses. One trial
was done with an undermodified malt.
Trial 66 was carried out on the pilot plant set up for agitation work, under
identical conditions to previous trials. The heating rate was set to an initial
rate of 0.5°C.min-1. During the entire mashing process the mash was
recirculated in the Mono pump loop. Malt was from the batch used for all
previous trials (Blenheim, 1992 harvest). The total heating interval from 65
to 100°C required 110 min.
Trial 67 was carried out using the same procedure as above; the only
difference was the use of undermodified malt, prepared in the BRFI
maltings, in combination with a finer gap setting (0.55 mm) of the roller
mill. The setting was adjusted to obtain a similar grist sieve distribution to
the well-modified malt. The total heating interval from 65 to 100°C required
105 min.
In trial 68, again well modified malt was used (same batch as trial 66) but
in the BRFI pilot brewhouse. The water quality in the brewhouse is
different from pilot trials, as 200 ppm CaS04 is added to the de-ionised
water. However, the main difference between agitation pilot plant and
brewhouse operation is the different mixing of the mash and the heating
rate. This trial was carried out to see how mixing conditions and very short
temperature inCUbation times influence the mash properties. Therefore the
heating rate was set at 1°C.min-1 , up to 100°C. The heating interval from
65 to 100°C was 35 min in comparison to over 100 minutes in both other
trials.
4.3.1.3. Results
Change of mean particle size - LS130 Analysis
Particle size distributions were analysed in a diluted, 106 IJm sieved mash
sample. This processing enhances the resolution of particle size changes

144
in a small size range, i.e. the sensitivity of the analysis is increased.
Monitoring of fine particles is of great importance, as filterability in the
lauter tun is directly dependent on amounts and properties of fine particles
(Muts and Pesman, 1986).
The mean particle size (MPS) determined from the differential number
distribution on the Laser Sizer (LS130) shows, for all trials, a significant
change of the size with increasing temperature (see Figure 4.38).
11.-------~--~--~--~----~--~----__.
• - . 10 • Trial 66
• Trial 67
.. Trail 68
§. 9
/;,'., ....
•
5
• ~ __ --_~_-::l~ . .." .. ___ - 1Il--
65 70 75 80 85 80 95 100
Mash temperature [0G]
Figure 4.38: Effect of mash temperature on MPS (number distribution).
The well-modified malt (Tria[ 66, 68) is s[ightly less sensitive to
temperature than the undermodified malt. [t can be assumed that the higher [eve I of the values obtained from undermodified malt (Trial 67) is
due to a proportion of smaller particles (such as small starch granules)
present in the mash. Trial 66 shows a slightly higher level at the start of
heating, which could be caused by a mechanically induced precipitation
reaction, due to elevated agitation levels (shear) or by chemical effects
such as different redox values. Changes in the redox state could be
explained by different oxygen uptake in the two brewing plants or by
effects from the different water qualities (buffer capacity).

145
In general, change of the PSD in mash, which occur mainly in the size
range between 2 and 40 IJm can be described by the precipitation of
proteins above 60°C. This effect was described by Lewis et al. (1984,
1985). They observed changes in protein content and protein molecular
weight distribution due to denaturation of proteins and precipitation with
polyphenolic substances.
Change of particle size distribution (PSD) - Multisizer Analysis
The Laser Sizer can describe PSD changes with mashing temperature.
However, it is not possible to quantify particle concentrations. Therefore
additional particle size analyses were carried out with the Multisizer to
determine particle concentrations in the 106 IJm sieved mash samples.
The Laser Sizer and the Multisizer operate different particle detection
systems, thus corroborating the Laser Sizer analysis and proving that
differences in the particle size distribution can be observed with mashing
temperature.
10c000.-----~------~------------~------_,
o
6S·C -7S·C
--- 80·C - 9S·C
, , , ,.
,/ ' ..... " , J '_',.J T , ...... . , ,
:' ., ,
5
/ ~-> , . '\
I ... \-
I '- '-'-
/
10 15 20 25
Partide Diameter [~ml
Figure 4.39: PSD of mash (Volume distribution), Trial 66, analysed on the Multisizer.

146
Figure 4.39 shows the change of the PSD (differential volume distribution)
for Trial 66. It is clearly visible that smaller particles disappear with higher
temperatures. The sharp inflexion at 2 IJm in the curves for 65 and 75°C
show the lower end of the analysis range of the 140 IJm orifice on the
Multisizer. Even smaller particles can be expected, below this level, from
the shape of the curves. Results for both other trials are similar.
Concentration of fine particles
The volumetric particle concentration of a diluted suspension, sieved with
a 106 IJm sieve was determined in the Multisizer. Increasing fine particle
concentrations generally have a negative effect on the filterability of a
suspension. It can be shown, that particle concentration changes during
the heating period are not significant: no additional fine particles are
created in either of the two brewhouses and even different malts have no
significant effect (see Figure 4.40).
1.0.
0..9 • Trial66
~ 0..8 • Trial6? ~ 0
';;; 0..7 • Trial 68 Q)
~ 0.6 ~.
'0 0..5 .. :" .. , .. <:
. Q • ~ 0..4
1l 0..3 I <:
• --.- .". . .......• ! .... "
8 ~
0..2
I-0..1
0.0. 65 70 75 80 65 90 95 100
Temperature in the mash ['C]
Figure 4.40: Volumetric particle concentration of fines in the analysis suspension

147
A similar result has been obtained from the dry solids analysis: the
standard deviation of this analysis was found to be high in relation to the
small solids content in the 106IJm sieved, diluted sample. Changes in dry
solids could not be observed. It can be concluded that no additional fines
are forced into solution by agitation during the heating period (see Figure
4.41).
0.020
• Trial 66
~ 0.015 • Trial6? .. Trial 68 ,£ ~ c: B !!!
0.010 C B c: , • 8 • • Ul • • . • ~ .. I • .. ... !i! 0005 • • .... . , . -- . . ...• ~. .. 0 ... •
0.000 65 70 75 ao 85 90 95 100
Temperature of mash [OCl
Figure 4.41: Dry solids concentration of fines «106IJm sieve step) in mash
Viscosity of mash
The viscosity of samples, taken every 5°C, typically, from 65 to 100°C,
was determined at 20°C. As filterability trials were carried out at 65°C, it
was necessary to recalculate the viscosity to this temperature level. This
was done by a viscosity vs. temperature calibration curve established for
one mash sample (Trial 68). Figure 4.42 shows the effect of temperature
on viscosities of wort, water and sucrose solution.
The following equation was employed to relate viscosities obtained at
20°C to those at 65°C:
7765 = 0.188 + 0.272 7720' 4.11
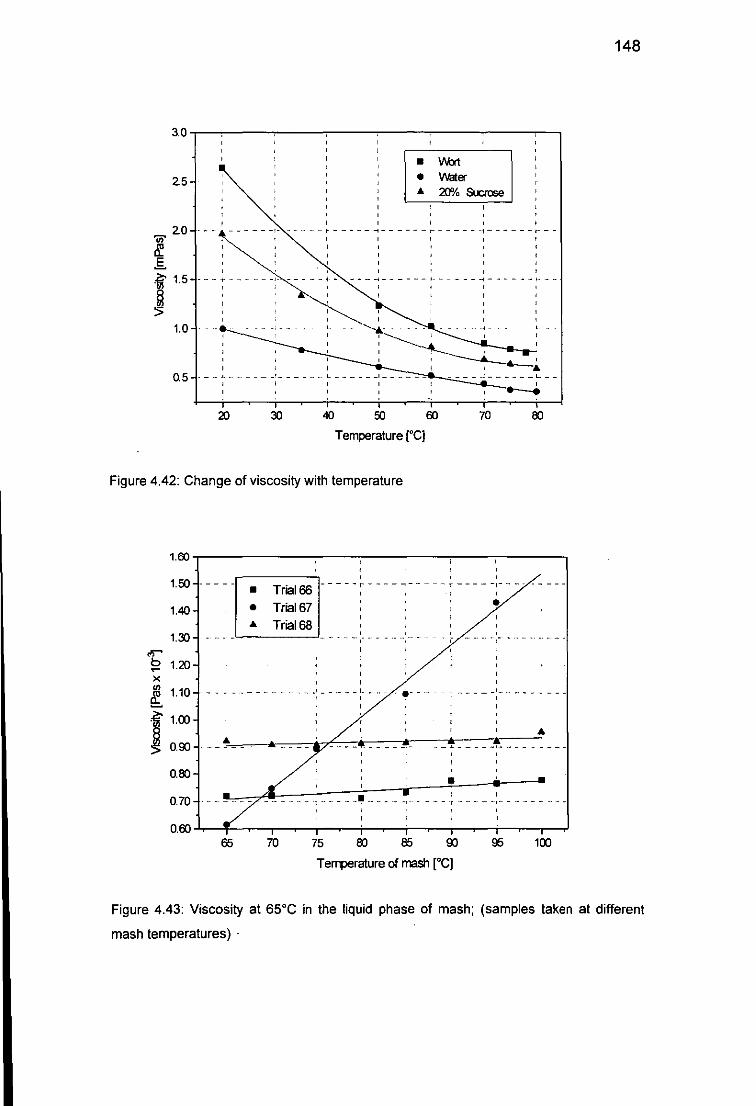
u;-
tI:. .s ~
~
3.0
2.5
2.0 . - -
1.5
1.0
• \MJrt • Water .. 20'10 Sucrose
, - - - - - -,- - - - - - I - - - - - -I - - - - - - .- - - - - - -I - - - - - - ,-
- - - - - _I· - - - - - ;
,
----I------~------I------~ , , ,
, " .......... : , •• , - ,. , .... ··1 ,. ,., I
' '--- I I : -+--~ I
I '~&--' ~-------~. , ~ 05 .--~ ______ I ______ ~ ______ I _____ - ____ ~ ______ L __
,
20 30 40 50 60 70 80
Temperature ["C]
Figure 4.42: Change of viscosity with temperature
1.60 ,---------,----;----,---.,---,----,
1.50
1.40
• •
Trial 66 Tria16?
- - - - - r - - - - -, - - - - - T - - - - -,- - --
• .. Trial 68
1.30,
'b T'"" 1.20 x
~ 1.10 ~- - - - - ~ - - - - -; .. -,
f 5
1.00
0.00 .. ..
0.80 • 0.70 .. , - .-.
65 70 75 80 65 00 95 100
Temperature of mash [0C]
148
Figure 4.43: Viscosity at 65°C in the liquid phase of mash; (samples taken at different
mash temperatures)

149
It can be seen in Figure 4.43 that viscosities for both well-modified malt
mashes (Trial 66 and 68) do not change to a great extent. The different
levels between Trial 66 and 68 are caused by different amounts of extract
in solution. Viscosity of Trial 67, using· undermodified malt, however,
shows a strong increase of the viscosity with mashing temperature. As the
extract level is only slightly increasing (see Figure 4.44), it can be
concluded that this drastic viscosity increase is due to release of high
molecular weight material (such as dextrins and p-glucan and gums) into
soluble form. The three dimensional structure of these substances is
capable of increasing viscosity. Release of these materials could be due
to temperature effects or, additionally, due to agitation regimes present in
the pilot plant.
It is important to mention again, that viscosity increase for the well
modified malt is minimal. As subsequent filterability trials were carried out
at 65·C, it can be said that the effect from viscosity on a change of
filterability is very small.
Density of mash
Density of the liquid phase of mash was measured at 20·C. Figure 4.44
shows the results for the trials. It is clear that the liquor-to-grist ratio for the
two experimental set-ups were different (Trial 66 and 68). Trial 68 was
mashed at a higher concentration.
Interestingly, the slopes of extract formation with mashing temperature are
different (see Table 4.7) between the two brewhouses (Trial 66 and 68).
Table 4.7: Slopes for linear fits of density and extract vs. mash temperature
Density slopes (fit for 65 - Extract slope (fit for 65 -
95°C) g/mll"C 95°C) °Platol"C
Trial 66 7 x 10⁻⁵ 0.07
Trial 67 5 x 10⁻⁵ 0.05
Trial 68 5 x 10⁻⁵ 0.05

1.000,------------:--,----------,20.0
1.078 19.5 _.-----,;'~-i"' __ .3
1078- -~.' -----' .. ~' -~.- ~ ~ .- .+ .--i , , . - 19.0 , ,
1.074 : 18.5
~ 1072 - • Tr~l66 - - : - - - - ~ - - - - - ~ - - - - ~ - - - - - :- - - - - - - - 18.0 I ~ • TriaI6?: , : ,: ... &i 1070- - .. Trial68 .. ;- ... ~-.---~----~-.---~-.-- •. -- 17.5 ~ o "---,------' , , I , .2-
1006
1.006
, , , , ........... , ...... -.-1-· '" . "" _" ,_ ......... _~ ... _" ..
IL . ; . - - - - - - - -~- - - - -.. " - - - i
...---- ' ,
65 70 75 00
• ................. ; ..........•.... I I , ____
' ___ , __ . - -~ - - - ~" . ~-----,
65 00 95 100
Temperature in mash ["C]
Figure 4.44: Density (Extract) in the liquid phase of mash
17,0
16.5
16.0
150
This indicates that the stronger mixing conditions enhanced extract
formation (density increase) at higher temperatures.
Filterability of Mash
Filterability was tested using a Millipore filter cell. The filtration of all mash
samples was carried out at 65°C. This temperature was chosen to avoid
cold trub formation (below 65°C) and to avoid additional effects on mash,
described above, beyond 65°C. Filtration curves were plotted as dtldV
over V diagrams. In these diagrams the resistance of the filter medium
(Whatman GFID filter paper) could be determined as zero (section of the
fitted line at the ordinate is negative or zero).
An example of a plot is given in Figure 4.45 for Trial 67. It can be seen
that filtration experiments (for individual temperatures) can deviate from
standard cake filtration when a certain volume has been filtered, because
of pore blockage. Linear fitting functions have been drawn for data points
only, which are in accordance with cake filtration laws. This fact will reduce
filtration performance further, as only a very limited volume can be filtered
before blockage of the filter occurs.

151
4.Ox1o'
0 d1dV65 0 d1dV70 0
'" d1dV75
3.Ox1O' 'V d1dV80 0
0 d1dV85 + d1dV90 x d1dV95 " d1dV100 0 '--__ ---' _____________ 0 ___ _
l.Ox1o'
4.Ox1cr' 6.Ox1cr6 8.Ox1cr6 l.Ox1cr5
Cumulative Fittrate Volume 1nl'1
Figure 4.45: Trial 67, dtldV vs. V plot with linear fits for data points in accordance with
cake filtration law
Filterability 11K of the slurry can be determined directly from the slope K of
the linear fit in dtldV vs. V plots as:
dV =~V dt K
4.12
It is also possible to calculate the average specific resistance a of the filter
cake from the slope K of the filtration curve, as viscosity 1/, concentration
of the slurry c, A and 6.p are known.
4.13
The effects of mashing temperatures on filterability 11K are displayed in
Figure 4.46. If a limited filtrate volume in accordance with cake filtration
laws was observed this was marked at the data point.
It can be seen, that filterability increases dramatically with the temperature
in the mash samples. The differences of the malt quality are also visible:
Trial 67 shows the lowest filterability and the maximum filterability is

152
6.OX1CT13I--;;::====;-;---------;--~--~
5.OX1CT13
tOX1CT 13
Figure 4.46:
• Trial66 io • TrialS7 _' _ _ _ _ _ _ _ _ _ _ _ _ _ _ _ _ _ . ____ , __ _
... Trial68 : I
, - "'l - -
<0.017 rri'1 ... <0,((6 rrri
, • <0.005 rri'1 , - <0.005 rri'1
• ;,
, "" ••• 0"' •• 1.. .. ,
, ,
,
"
; I I -,- - --- - - - - . -. - ---,------I-----T--
• .. ' ..
Temperature in mash [0G]
" •••••••• 1 •• , •• ,
. .. " ... , , ,.
, ..-"-'~ ....
Filterability measured in a Millipore filter cell for different mashing
temperatures (. and •• maximum volume filtered per filter area before
blockage occurred)
already reached at a lower temperature, This can be explained by the
strong increase of viscosity in Trial 67 with mashing temperature, which
counteracts any improvement of filterability with higher temperatures,
Trials 66 and 67 show a very similar shape of the filterability curve, only
the initial value is elevated, an improvement in filterability between
mashing temperatures of 65°e and 78°e could be clearly seen,
Table 4,8: Filterability increase between 65 and 78°e
Trial No, Filterability (1/K) Filterability (1/K) Increase in filterability [%J at 65°e [mS,s-1J at 78°e [ms,s-1J
66 0,82 x 10⁻¹³ 1,89 x 10⁻¹³ 230
67 0,17 X 10⁻¹³ 0,47 x 10⁻¹³ 276
68 0.41 X 10⁻¹³ 1,18xlO-13 288

-- ----~-----------
153
The change of filterability could be due to a change of the viscosity TJ, the
resistance of the filter cake a or the concentration of the solids in the mash
c (see Equation 4.14).
KA2 !1p a=----'- 4.14
TJc
c and TJ are known as well as the differential pressure over the cake !1p
and the filter area A, which makes it possible to calculate the resistance of
the cake. As already described earlier, the total amount of solids in the
mash c does not change significantly during heating. The viscosity TJ is
also near constant for the well-modified malt (Trials 66 and 68). These
facts leave only the average specific resistance a to explain the changes
in filterability (see Figure 4.47).
5.Ox1012 -,------,---,.-----------,..--.,..--,
4.Ox1012
f ';;' 3.Ox1012
~ ~ Q) 2Ox1012
er:
i en 1.Ox1012
•
65 70
• Trial66
• Trial 67
• Trial 68
75 80 65 80 95 100
Temperature i1 mash ["C]
Figure 4.47: Specific resistance of filter cakes with mashing temperature
The specific resistance of the filter cakes reduces with mashing
temperature. Curve fitting gives similar equations to the filterability plot
(see Figures 4.46 and 4.47). It can be concluded that resistance is the
predominant effect for filterability.

154
Trials 66 and 68 show no major difference in specific resistance, which
means that differences observed in the levels of filterability are due to
different viscosities. Trial 67 shows a higher level than both other trials, an
observation which could be explained by the different malt modification.
In general, it was found, under all test conditions, that the improvement of
filterability is caused by a change of the specific cake resistance and is not
caused by viscosity changes. (As filtration was carried out at 65°C for all
mash samples, no viscosity differences occurred due to filtration
temperature.) .
This effect of reduced specific cake resistance with higher temperatures
can only be explained by a change of the mash composition with higher
mash temperatures. As enzymatic effects could only cause changes up to
about 75°C, there must be other reasons for the big increase of filterability
with temperature.
If the specific resistance a is plotted against mean particle size (MPS)
(see Figure 4.48) it can be seen that the decrease in resistance can be
described with high correlation (R=0.96 - 0.98) with the MPS-increase, in a
range from 65 up to about 85°C. The change of the cake resistance with
temperature in the practical temperature environment can be explained
solely by MPS changes. However, it is not possible from this plot to predict
the resistance of the filter cake from MPS. Therefore, additional
information about the nature of the material will be required.
The mash produced in the agitation pilot plant showed the lowest level of
resistance. Reasons for this behaviour have to be investigated further.
4.3.1.4. Conclusion
These results show that previous assumptions, about the improvement of
lauteringlfilterability with mash temperature have not taken the importance
of the change of particle size distributions into account. In the literature,
viscosity change due to a temperature increase is given as the only
explanation. Viscosity has a linear influence on filterability; however, an
increase due to higher filtration temperature (78°C instead of 65°C) will
affect filterability in lautering by about 20 to 25%.

5.Ox1012 ------=:::---------------, .,. 65°C
4.Ox1012
{ -; 3.Ox1012
i .~ 2.Ox1012
i en 1.Ox1012
. _____________________________ r'------,
•
65"C
•
4 5 6
65"C
7 'S
MPS[~ml
• Trial66
• Tria16?
.. Trial68
9 10
Figure 4.48: Specific cake resistance vs. MPS
11
155
Filterability actually changes by over 200% from 65 to 78°C in small scale (Millipore) trials, without the beneficial influence of lower viscosity. This big
increase can only be explained by a fundamental change of the specific
resistance of filter cakes with mashing temperatures.
The importance of particle size effects in mashing are demonstrated here.
The reduction of fines in the mash, described using the MPS is able to
explain the drastic changes in cake resistance with temperature.
The change of the particle size and the reduction of fine matter below 2 - 4
]Jm could be due to precipitation and aggregation effects of proteinaceous
material with polyphenols (Lewis and Wahnon, 1984; Lewis and Oh, 1985;
Lewis et aI., 1992) and other components capable of reacting with
proteins.
4.3.1.5. Applicability to Lautering and Practical Mashing
In pilot scale lauter tun operation, a change in lautering run-off rate could
be observed with changing mean particle size similar to these trials. This
indicates, that the particle size change affects lautering performance as

156
well as filtration rates in the Millipore cell. It has been shown, that the
conditions in the pilot scal.e lauter tun are similar to large scale operation,
which makes the results and observations of these trials valid for the
industrial scale of brewing.
In relation to agitation effects (see Chapter 4.2.3), the maximum reduction
in specific resistance observed with temperature increase was less
pronounced (see Table 4.9). This means that the application of higher final
mashing temperatures can not "cure" problems caused by agitation.
Table 4.9: Maximum change of specific resistance due to agitation and temperature
effects
Effect: max. specific min. specific Reduction in speCific
resistance at: resistance at: resistance
Temperature 65'C 95'C 1.50 x 10¹² m kg-1
(Trial 68)
Agitation 1.4 WII OWII 4.46 x 10¹² m kg-1
Additional trials investigated the effects of higher lautering temperatures
downstream in fermentation and conditioning. It was found that higher
temperature lautering causes the formation of additional haze during
conditioning. Fermentation rates were similar to normal lautering
temperatures. The haze observed in the conditioned beer consisted of
neutral polysaccharide material, mainly starch and ~-glucan. The
application of external heat stable enzymes during lautering or of malt
inherent enzyme extracts during the fermentation and conditioning stage
could reduce such haze formation.

157
4.4. Particle Size Changes in the Fine Fraction of Mash and the Effects on Lautering Performance
4.4.1. Aim
It could be concluded from the results presented above that MPS of fine
particles in mash varies with mashing off temperature and agitation
conditions in the mash. To expand the MPS range in pilot scale trials,
additional trials were carried out at MPS levels not covered by previous
investigations. To obtain such extremes higher mashing off temperatures
(above 75°C), as described in Chapter 4.3, were used. The aim of these
trials was to obtain correlations between pilot scale lauter tun performance
(spent grains bed permeability and extraction) and the particle size
distribution of the fines. These correlations were required for the modelling
work.
4.4.2. Results and Discussion
The following graph shows effects from MPS change on the permeability
of a lauter tun cake. As permeability changes with height of the bed and
viscosity, the permeability varies during lautering. The permeability of the
spent grains bed approaches a constant value during cake washing. In
this phase the height of the bed is constant and viscosity which is a
function of extract content is also constant. This constant level was
reached after collection of 8 litres of wort.
The graph in Figure 4.49 shows that MPS of the fines has a clear effect on
permeability. Linearity was achieved by plotting the square of the MPS
against permeability. This might suggest that the surface area of the
particles contributes to this change, as the surface area is proportional to
the square of the mean particle size.
Not only permeability of the cake is affected by MPS change but also the
washing efficiency. The washing efficiency was determined as Ewort
IEmash '; the higher the efficiency the better the washing. Best results were
achieved when the fines were aggregated to larger particles. In practical
circumstances this means that less water is needed to achieve the same
washing effect. The maximum amount of washing liquor used is limited

158
firstly by the total volume of wort which can be boiled and secondly by the
minimum extract level permitted before boiling. Lower extract levels would
require a longer boiling and evaporation phase, and more energy would
be required to achieve sufficient evaporation.
2.Ox1(J"O
~ 1.5x1(J"O
~ 1.Ox1(J"O
! !!:-~ 5Ox1(J'" .0 .
~ ~ 0.0 ~ -~ ~.- ..
o
Figure 4.49: Effect of MPS on permeability of the spent grains cake (R = 0.88)
The third parameter analysed as a function of MPS is the turbidity of the
wort. It could be observed already in the first trials in the lauter tun that
wort with higher agitation was less clear. This effect relates also to the
particle size distribution of the fines. Finer particles cannot be restrained in
the filter cake and they cause increased turbidity.
Under industrial conditions turbidity levels could be reduced by
recirculation, however this would extend the total lautering time, a fact
which is not often tolerable.

o.oo.,----,-------,------c-----;----,
, 0.78 .,------,-
0.78 •
i w
0.74 •••• . -.~ 0.72 .... . -.: ,
---.---------,---------
~ , ,
••• O.70+--~-t_--_;-~-__+_-~-+_-~__I
3 4 5 6 7 8
MPS[~ml
Figure 4.50: Effect of MPS on washing efficiency (R = 0.79)
~.--------------------------,
36
32
2B
24
20
• , " "':-. - -• .-III --,------ ---,--'----'--
, --'- - - - - - - - -'- - - - - - - - -,- - - - - - - -• •• • •
• •
• • ., , ,
---------r--------,---, ,
---,---------,------
I , , .1.. . ______ _ 1 _ _______ _
-------•
16+---~--_r--~--_+------~--------r_~~~
3 4 5 6 7 8
MPS[~ml
Figure 4.51: Effect of MPS on turbidity in the filtrate (R = 0.83)
159

160
4.5. Overall Conclusions
The experimental programme of this thesis focused on the investigation of
the two parameters of the mashing process, maximum temperature and
mechanical power input.
Mechanical power input is a function of the shear stress acting in the
mash slurry. The effects of particle attrition causing a reduction in filtration
performance and a reduced clarity of the wort were already known from
the literature. (However, chemical analyses of mash and wort could not
describe the effects of particle size change.) A detailed study of the
attrition of fine particles with shear was done here for the first time.
It is now possible to look at industrial brewhouses and study effects of
attrition on site. Effects on mash filterability can be computed from the
combined effects of MPS and viscosity. The next step will be to develop a
computer model which describes these effects on lautering performance.
For different types of malt there might be additional parameters, which are
related neither to viscosity nor to particle size change. Investigation of
different malts or other raw materials might reveal these effects. However,
for one combination of raw materials it will be possible to optimise the
lautering performance in industrial size brewhouses.
It could be shown that the mean particle size correlates with the filterability
of mash in bench scale and in pilot scale trials.
In the literature, the temperature of the mash before lautering was
considered a balance between enzyme activity and reduction in viscosity
with higher temperatures. Effects of temperature in the range from 65 to
78°C on particle precipitation were mentioned in the literature (Kano and
Karakawa, 1979, Lewis and Wahnon, 1984; Lewis and Oh, 1985; Lewis et
aI., 1992.) The effects on particle aggregation, however, were never
quantified. Additional effects from processing conditions or raw material
quality might be existing.

161
5. Modelling of the Lautering Process
5.1. Description of the Process
In this chapter the lauter tun filtration procedure is modelled. The results
obtained in previous experimental work were assembled to outline the
process unit operations mathematically. The parameters identified
previously as important in determining lautering performance were used to
model the procedure.
The program used for the model is based on the firidings in the pilot scale
experiments. The model was designed to react to changes in particle size
distribution of the fines and in viscosity. As already described earlier,
particle size is affected by temperature and agitation. Viscosity is mainly
affected by temperature and the soluble extract concentration for this malt
quality.
Temperature is a parameter which is relatively easy to measure, it was
therefore put directly into the model. Agitation, however, is difficult to
quantify. The MPS change in the brewery due to shear or agitation in the
mash needs to be measured directly. The analysis of fine particles with
laser sizing is easy to carry out.
5.1.1. The Effect of Temperature on MPS
Mash temperatures above the minimum 'saccharification' temperature of
65°C causes particle aggregation in the fine fraction. Thus, the MPS
increases with mash temperatures above 65°C. This behaviour,
investigated in Chapter 4.3, could be incorporated into the 1i3utering
model.
The maximum temperature in the mash has a permanent effect on the
MPS. In the mashing procedure for all agitation trials the maximum
temperature was 75°C. The MPS figure at this temperature was used as
an input variable to calculate the MPS at temperatures from 65°C up to
95°C.
The change of the MPS with the mash temperature t can be described
with the following equation (graph shown in Figure 5.1):

162
MPS = MPS7s'c - 0.144 x (t - 75°C) + 0.0052 x (t - 75°C)2 -1.869E-4 x (t - 75°C)3 5.1
with an accuracy of R = 0.97.
10.-----__ --__ ------------------------,
. , , 9 .-~-----~-----~-----~-----------:------'-----~--
, ! A
8 , .
- •• ! •••• , , ' .. , ' ,
-.f. --- -- - - --- -- -- --~ - --- ~ --- -- ~ - -, '" , ,
4 - -. - - - - - j- - -" - -:- - - - - .•. - - - - ". -- .•.. - •. :"" - , .. , ,
'''I' _ ..... 'j' ...
-10 -5 o 5 10
t-75 ['C]
Figure 5.1: MPS-temperature relationship
, , ,
15 20 25
MPS depends on temperature in a linear way (R=0.99) in the range from
75 to 95°C. The following equation (dotted line) was fitted in this range:
MPS = MPS75'c + 0.18 x (t - 75°C) 5.2
5.1.2. Effect of Temperature on Viscosity of the Liquid Phase of Mash
Brewery laboratories determine viscosity at 20°C. To enable the use of
routine analysis, it was necessary to correlate viscosity at 20°C to that at
70°C, therefore the viscosity-temperature trial (Trial 68a) was extended
down to 20°C. In addition, Eyben and Hupe (1980) report the temperature
correlation between 20 and 70°C for worts from over 20 different malt
samples. This relationship is displayed in Figure 5.2.

1.00~-----------------~
0.95
0.00
0.85
-v>oeo 8? . .E. 0.75 U o 0.70 I'-a; 0.85
loeo 5 0.55
0.50
, , , ' ...... 11 - .. EYberi and Aupe; i 980 .. •. r
· - - -. - -Trial 68a- - -:- - - -: - - - - - - - - - -:- - - - - - -:.. --:---, , , "
. , · - - -1- - - "I - - - - " - - r - - -I - - - - - - - ,.. - - -, - - ~ - - - 'r - - - j- -
I I .. I , , , , i, !
· - - _,_ - - ..; - - - .:.. - - - ,_ - - -1- _ - '-- ___ , ______ -.:.. ___ 1 ___ _
, , ,
,E I I - - - -, - - -,- - - - - - - T' - - -;- - --,
.. '.- - - .. ! '- -. - - ." ..... - __ , .,. - - ._ - - - , ... - - •. - "" - __ - ........ - - 1- _ , , . , ,
, , ' I, ,
0.45 - J,. ___ -;- ___ '- __ -: _______ ; ___ ,- - ____ - ~ - - -:- •
" , 0.40 .t::-"'-;'~-i-""""'r--r"-",..." ~.' '-'",,"~T"""T-i-~~~~--i-~'-,' ',..." -.--l
0.8 1.0 1.2 1.4 1.6 1.8 20 22 24 26 28 3.0 3.2
Viscosity at 20'C [mPasj
Figure 5.2: Relationship between viscosities at 20'C and 70'C
The linear fit has the following relationship (R=O.99):
'170 =O.180+0.254x 1720 [mPas)
163
5.3
This relationship was incorporated in the computer-model to avoid the
need for a viscosity analysis at higher temperatures.
For all trials viscosity in the liquid phase of mash (wort) was measured at
75°C. This temperature was also used for lautering.
As temperature in the lautering stage may vary in industry, this would
affect the viscosity of a wort. To obtain a relationship between temperature
and viscosity, a trial was carried out applying temperatures up to 85°C
(Trial 68a). In addition, data sets from the literature about temperature
effects on water (Perry, 1985), sugar solution (Perry, 1985) and wort
(Asselmeyer et aI., 1973) were used.
It was shown in the previous experiment that viscosity at 70°C can be
predicted from 20°C analysis. The fitting function shown in Figure 5.3 was
now used to determine the viscosity (from the 70°C value) at any lautering

4.0,----------------------,
3.5
3.0
~ 2.5
~ oS 2.0
~ R 1.5 ~
, ?
" '0' . ,
o Trial 68a o Water l> Sucrose (20 %) 9 \I\bt 1 o \I\bt 2
.. -- Fittirg Function , , . I , I I ,
- - - - -,6; - - - -, - - - - ,- - - - - - - - - - - - - - -,- - - - -,- - - - -,- - - - -I i , I • I 1 'V 1 , , ,
. - - - - ~ - - - - ~ - ~ - -('l - - - - - - - - - - - - - -: - - ., - -: - - - - ---: - - - - -I L 0 I
1.0 .----.?----~----'~----6·---"9,---"~-----~-----:-----,,0. l>~ I i '0 : 6. 9 .
-, -, ,- .•• - - - !-- - - - - '- - - - - - - - - ·0 - - - . - - - ,. _I - - - -' - - - -. _
009 0 0.5
0.0 +-~_+_~__;_~_;--r_~_._-_+_~_+~_;-...__l 10 20 30 40 50 60
T, .... ['C]
70 90 100
164
Figure 5.3: Viscosity-temperature relationship, with fitting function covering the range from
65 to 95'C
temperature in the range from 65 to 95'C:
17lau1 =; 170 + 0.0298 x T1aut + 1.30 x 10⁻⁴ x T1aut2
The following procedure is used in the model:
1. viscosity at 20'C is the input value
2. viscosity at 70°C is calculated using equation 5.3
3. using equation 5.4 170 is calculated using the known data
pair 17lauC 7iaut at 70°C. 4. the viscosity at the lautering temperature used in the
brewhouse is calculated using equation 5.4 with 170.'
5.4
In addition to temperature, soluble extract in the filtrate influences
viscosity. Viscosity increases with soluble extract concentration. This

165
effect influences lautering at the washing stage. With increasing dilution of
the extract the viscosity drops and, hence, filtration rates increase.
The change of viscosity with extract concentration was measured by
Kolbach (1960). Kolbach's data can be fitted with the following equation
with a correlation coefficient of R=0.99998.
'1= 'ID + 5.856 X 10⁻² x E -1.4188 X 10⁻⁴ x e + 1.4646 x 10⁻⁴ x E' 5.5
This equation was used to describe the viscosity change during lautering
as a function of extract concentration. The dilution of the extract
concentration during washing causes the viscosity of the filtrate to
decrease with filtrate volume. The differential pressure across the cake
decreases with viscosity and, as filtrate flow rate and pressure drop are
linked, the flow rate increases during cake washing.
5.1.3. Sedimentation - The Cake Height after Settling
Particles from the mash settle in the lauter tun. Due to the wide particle
size distribution, a fine particle fraction settles in a separate layer on top of
the spent grains. This sedimentation determines the total bed height at the
start of the filtration.
The sedimentation of fine particles is influenced by two factors:
1. density difference between particles and the liquid and
2. particle size of the fines (MPS).
Solid-liquid density differences and viscosities in mash were kept constant
in the trials. Hence it is possible to plot the settling rate against the square
of the MPS. It can be reasoned that the surface area of the particles
affects settling velocity; e.g. in Stokes' law, the settling rate is proportional
to the square of the particle size.
5.6 dt 18 'I

166
This relationship is shown in Figure 5.4. It can be seen that the
assumption of the square influence of the MPS is right.
, 0.0 . - - -
" , .- - - - - - ,- - - - - - - - , - - - - - - - --. - - - - - - - .., - - - - - - - -, , .. ' ,
. '. . . , -~ ....... -~
• , , , • " ..... """" .. "" ........ '; ..... . "f •• ,
, : . ,
10 20 30 40 50 60
MPs" [lJrn1
Figure 5.4: Sedimentation rate vs. MPS2. Linear regression: with R = -0.93822
dhdt"' = 1.474x10" - 1.4802x10·5 x MPS2 [ms"] 5.7
Variations in the behaviour might be due to inconsistency of temperature
or viscosity during settling.
Analysis of the sedimentation rate and the above correlation may be a
suitable way to replace the particle size analysis where a laser sizer is not
available.
In the pilot scale lautering procedure, the settling was limited to 10
minutes. After this interval the filtration was started. The lowest possible
level of the bed after sedimentation is 0.42 m. This level is dependent on
the total concentration of solids, the load of mash in the vessel and the
packing density of the spent grains. Due to the complexity of the input
variables, it would be suitable to measure the final sedimentation height
for each application. In the experiments used to establish this model, the
total concentration of solids was kept constant at a level of 74 g £-1. This

167
value is directly related to the water to dry grist ratio of 3.5 to 1. The filling
level of mash was constant at 0.53 m, hence the maximum sedimentation
height at the start was 0.53 m. Figure 5.5 shows calculated and measured
data for the total cake height after sedimentation.
0.70 ,--------.,--------;----;----------,
0.65
0.60
E ::cO 0.55
~ u 0.60 ..... _--- --,-"---
~ • '15 0.45 E
, , . , , . - .1 __ ,
• Alot scale data --Calculated data
. , , - -. .- - - - - - "T -- --',-- ----- ------
• •
f 0.40 - - - - - - - - .. - - - - - - - - - - - - - - - ~ --- - - - - - ~ - - - - - - - - - ! - -
0.35
0.30 +--~___r-~-.__~--+--~-i--~-...,_----l 2 3 4 5 6 7
MPSI~ml
Figure 5.5: Measured data compared with calculated data using the following equation for
0.42 m < HQ < 0.53 m
Ho = 0.53 + (1.474 x 10⁻⁴ - 1.4802 x 10⁻⁵ x MPS2 x 540) [m] 5.8
5.1.4. Final Permeability of the Cake
The permeability, K was calculated for all pilot scale trials from the
following measurements using Oarcy's equation (equation 5.9).
• Height of the bed, L • filtration rate, dVldt
• viscosity, 1}, and
• differential pressure across the cake, dp.

K = dVTJL dtdp
168
5.9
Constant permeabilities were achieved after 8 litres of wort were collected.
Due to inaccuracies in the pilot scale analyses, especially at the beginning
of the experimental programme, the calculated values for the permeability
are spread at the lower end of the permeability range. However there is a
clear relationship between MPS2 and the permeability of the cake. The
linear regression for the data had a coefficient of R = 0.83. The
permeability analysis of the bench scale work could verify that the
assumption of inaccuracies during the measurement is valid, as small
scale work carried out on the Millipore filter cell (see Chapters 4.2.3 and
4.3) shows a much stronger correlation (see Figure 5.7). In this case the
parameters were easier to control.
The fitted lines (Figures 5.6 and 5.7) show a distinct off-set on the x-axis
from the origin. The reasons for thit are the characteristics of the Laser
Sizer LS 130 for the analysis of fines and the model used to calculate the
size distribution. Expressed as number distribution the limit of the MPS
value was approximately 3 IJm.
2.Cbc1rr 10 _ .... _. _. _. - :- ..... -, ...... -- - ... - .... - ~- •.
, ,
" ,.
'E 1.5x1cr1O
~
i E 1.Ox1cr1O
& ~ u:
5.Ox1cr"
, ,
, . ______ ~ _____________ L ______ ~
, ,
•
•
, ., ,
. ,
, , -----,------
.------~------ --.----~------~------~------, •• ' , I
, . ... ., '.. ' • • •• I . .... ~
o.o-t-~-+~~-.-~--r--~-T--~-T--~--l o 10 20 40 50
Figure 5.6: Final permeability vs. MPS2

169
These correlations verify that MPS2 from the fines is the key parameter
determining permeability of the filter cake. It was therefore decided to
focus the computer model on this effect. Effects from the coarse particles
layer seem negligible for the modelling of agitation and temperature
aspects (see also Chapter 4.1.3.2).
5.Ox1cr12 .---------,--.....,-----,----------,
4.Ox1cr12
'E 3.Ox1cr12
£i"
1 2.Ox1cr12
~
1.Ox1cr 12
• • • - _. - - :- - - - - - - - - - ,- - - - - i- - - - -,- - - - - - - - - - - - . - -1- - - - -
, ------- --------,
, , -,
- - - i- - .- -;
• •
-.: ----_._--, ,
• ___ . -i- _ - - -,- ______ - - -"'- - - _. -,
0.0 +-~--'F-__.~_+~_+~__t-____,~__,--j__.---1 o 10 20 30 40 60 70 so 00
MPs2[~
Figure 5.7: Bench scale permeability for trials with agitation and temperature variation.
Pressure was constant at 100 mbar. Correlation coefficient R = 0.97
5.1.5. Effect of Pressure on the Final Cake Height
The final filter cake height in the lauter tun is affected by pressure. The
relationship between pressure and cake height is important for the
calculation of the final pressure. For the pilot scale trials another trend in
the behaviour could be detected.
It has already been shown that the initial height of the cake after
sedimentation is affected by particle sedimentation behaviour. This relates
to the volume of the particles, and hence to the MPS. During the progress
of the filtration, smaller particles compact to a greater extent than larger
ones, and hence permeability of the filter bed is lower. This trend is shown
in Figure 5.8 with a regression coefficient of R = 0.80.

170
A curve with the following equation was fitted:
Lmin = 4.2215177 -15.733068 x La + 15.445633 x La 2 5.10
0..45,----------:--------'-----,
0..40
E '2 0..35
~ :E ~ o..~
fJ :c
, . - - ".' - - -. - - - - -"' - - - - - - - r- -
• •
.• •
'. •• •
, ,
,
• unn I -, - fitted Lmn
• • .~ 0..25 C-
. - - - - - - -.- - - - - - -. - - -. - - - , , . ' . '
----- 1-------·-------o
J • 0.20 ............. - .- - - .. _.".- .. - - .. - " .- - - - - - - - - - - .. - - "
• • • O'15+----r-~_r--___ir_~-._--_r----1
0..40 0..42 0..44 0..46 0.,46 0..50 0.,52
~ (height before fittration) [m]
Figure 5.8: Height of the cake before and after filtration
The pressure across the bed was plotted for 11 trials against the cake
height. In this plot (see Figure 5.9) the changing initial cake height has
influence on the maximum pressure drop. The higher the initial cake
height, the higher the span of the differential pressure. It is the purpose of
this graph to build a relationship between the final pressure and the final
height of the cake.
The following function (red line) was fitted (R =0.94):
L = 0.35 - 1.17 x 10⁻⁴ x LIp + 2.18 x 10⁻⁸ x Llp2 5.11
The pressure at the final height of the bed after compaction can now be
calculated using the relationship between MPS and minimum
Permeability, the Darcy equation and the final height-pressure correlation.

171
Maximum compression, where the cake height would be independent from
the pressure across the cake, is not reached in this graph because the
pressure used in the pilot scale trials was too small.
0.42 , 0.40 - - - - - - - - -:- - - - - - - - - -: - - - - - - - - - - - - - - _. - __ A3e
0.22
0.20
0.18 '----~--'--~---'--~----'----~--'---' o 500 1000 1500
Pressure (Pa]
Figure 5.9: Effect of pressure on cake height
5.1.6. Compaction ofthe Cake over Filtrate Volume
The initial cake height La (after the sedimentation step) and the final cake
height Lmin at the end of filtration were already defined in previous steps.
The progressing compaction of the bed with increasing filtrate volume is
influenced by different effects:
• firstly, wort drains from the cake and voids in the cake decrease their
size (compaction) and
• secondly, the cake exerts a resistance as liquid flows through the bed.
As the top layer has the highest resistance, the bed is compressing
with increasing differential pressure across the cake.
These effects occur simultaneously and are combined in the model. The
height difference L-Lmin per volume of'filtrate for nine trials is plotted in
Figure 5.10. The experimental data can be fitted with first order
exponential decay functions.

0.22
0.20
0.18
oS 0.16
j 0.14 ,
...J 0.12 2l c: 0.10 ~ ~ 0.08 "C
:E 0.08 .~
I 0.04
0.02
...... l .... ", •. ,.l. _ 0<' I ""' "" .1 .... _ .1 .•.•.. , , , , , _ ••• ,i, __ ._ •• I. __ .... J ... __ , , ,
.. ! ~. I _ ..
H26 H36 .
• H40 • H41
• H45 H54
, H79
172
Figure 5.10: Height of the bed vs. filtrate volume, trial data with fitted exponential decay
Fits for all trials were obtained to establish correlations between the fitting
parameters of the exponential decay function and the minimum cake
height. Figure 5.11 shows the decay constant t plotted over L min: L min
determines the decay constant.
The decrease of the height of the cake with filtrate volume from start of
filtration to the point where cake height reaches its minimum, can be
described using the parameters La, L min and t in a first order exponential
decay function. The following equation applies from V = 0 to V = Vlolal:
L = L - {(L - L . ) x e t,~~y } o 0 mm 5.12
The fitting function shown in Figure 5.11 replaces t in equation 5.12
tdecay = 0.00247 - 0.00310 x L min - 0.00246 x Lmin2 5.13

0.0024 -.---~---,------------,,------,------,
0.0022
0.0020
'"E 0.0018
i 0.0016
I: 8 0.0014 >. i 0.0012
-
• • , • I •
* l ~ ____ _ .1 _ . ___ . _ .. __ "' _ .. ___ ...i ____ "
, ., . - - - - _e. __ ,~ _ _ _ _ _ _ I
• • ----------------, , ,
• _ ••••••• '" _" 1.. __ , , ,
. - - .. - - -- - - - ..., - - - - - - -
.~ . , ---- ------------------
•••• • , .
• 0.0010 ·-------c·-------,---------------.-- ---- ----
, 0.0008 - - - - ,- - - - I" - - - - - - - i - - - - - - - - - - - - - - - -, - - - - - - - .- - - -
, , , 0.0008 -+--~_i_---T_~-__.---r___~-_;_---l
0.15 0.20 0.25 0.30
L",;n [m]
Figure 5.11: Decay constant, t vs. Lmin (R = 0.80)
0.35
5.1.7. Effects of Cake Height on Permeability
0.40
173
Permeability of the cake is affected by its packing density. The packing
density is a function of cake height, because the total mass of solids is
constant over the lautering process. For the final bed height the
corresponding permeabilities are shown in Figure 5.12. The equation for
the fitting curve is:
B = 1.31x 10⁻⁸ x L4.68 5.14
The effects of compaction and reduction in porosity on permeability can be
described using the Kozeny equation
5.15

174
2.5QE.{)10,----------------------,
, , , - - - - - - - t' - - - - - - - -r - - - - -, - - -: - - .- - - - - .-2.00E.{)10 . - - - - - - -
Figure 5.12: Permeability - height of the cake. after Lmin =constant
Since the total volume of solids, Vs. is constant. the porosity. Ei. is a function of cake height, Le. as a first approximation. As
5.16
and
5.17
hence,
( Ei3 ) (3 2) 5 B =f =f Le xLc =f(Lc)
(1-4 5.18
This correlation was used to describe the change of porosity with height of
the bed.

175
The examples shown in Figure 5.13 indicate that this assumption is
reasonable in a range of 8 = 0.25 - 0.55 (related to Le = 20 - 35 cm)11.
Deviations from this model occur at the beginning of filtration, when the
porosity of the bed is above 8 = 0.65. At this stage, the wort is not filtered
through the entire cake but filtrate is also flowing from the pores of the
lower part of the cake This effect agrees with the limitations of the
Carman-Kozeny model described by Dullien (1975).
5x1cr'O .,--------,----------,-----,
0 Trial 15
4x1cr'o 0 Trial 18 D. Trial 23 'V Trial 53 0 Trial 59 ,
---_._----------,--_ .. _-_._- -,~-.--~~--,----.--
0.000 0.001 0.002 0.003 0.004 0.005 0.008
(Bed height. L'I [m')
Figure 5.13: Permeability change as a function of cake height
The flow rate dVldf is linked to L1p by the peristaltic pump control
equipment. The relationship was adjusted in the calibration experiments
(see Chapter 3.2.2) and can be described by the equation,
dVldf = 1.65 x 10⁻⁶ - 5.32 x 10⁻¹⁰ x L1p - 4.66 x 10⁻¹⁴ x,1p2 5.19
11 For a further discussion on cake porosity see the conclusions of this chapter.

176
5.1.8. Change of Extract with Time - Cake Washing
Extract in the filtrate changes with filtrate volume. Initially the water below
the slotted bottom and in the pipework dilutes the wort. As filtration
proceeds the extract content rises to a maximum. This maximum depends
on the concentration of the mash. With further progress of the filtration, the
wash water added on top of the cake dilutes the filtrate and leaches
soluble sUbstances from the cake.
Cake washing in lautering was described by Hermia and Rahier (1990)
with the so called dispersion model. For washing of spent grains with pure
water, and because there are no sorption effects of the cake, the model
can be simplified as follows.
5.20
To verify that experimental extract data fits this model some examples of
the trials have been tested. To compare the data with fittings of washing
curves, the void volume of the cake was calculated.
The volume of the cake at maximum compression can be determined from equation 5.11. A minimum cake volume of 2.65x10⁻³ m3 was determined
for these trials. It was assumed that at this compression the cake voidage
is near zero, the volume of the cake would be the volume of the particles
only. It can be anticipated that milling, concentration of the malt and the
raw material source influence the volume of the solids and the packing
density in the cake. The void volume can then be determined as.
Vvoid = V cake - Vparticles 5.21
The void volume of the cakes can be calculated using the individual final
height of the cake and the filtration area of the cake. With these Figures it
is now possible to determine the volumes of wash liquor used per void
volume of the cake.
Washing of the cake starts when all supernatant wort is drawn into the
cake. The total volume of wort to be filtered before washing occurs is
calculated using the following equation:

177
5.22
The extract content per volume of filtrate was normalised by the maximum
extract content in the filtrate.
Figure 5.14 shows the result of this fitting process. It can be seen that the
axial dispersion model with the assumptions described before fit the
washing of the spent grains cake quite well.
0.2
0.0
.., Trial29
• Trial24 _ .
0.0 0.2 0.4 0.6 0.8 1.0 1.2 1.4 1.6 1.8 2.0
Void \/Olumes 01 wash [-]
Figure 5.14: Washing curves 01 data and fitting functions (dashed curves with Trial 26:
uL . uL . uL uL - = 3.7909; Tna128: - = 4.8833; Tna129: - = 2.8786; Trial 24: - = o 0 0 0 1.7051.
In the model the extract curves were not fitted with the dispersion model
but directly with a sigmoidal function. This made modelling much easier
and reduced the number of necessary calculation steps. The sigmoidal
fitting functions is described with the following equation.
E - Em"" -Eo E - ( ) + 0 V-Xc 1+exp--
dX
5.23

where:
Xc: centre of the curve
dX: width of curve
Emax: initial extract
Eo: final extract level
14
4
2 ,
--:-----
O+-~~T"~~~~~_r~~~~~~~~_1 O,(XXJ 0,001 0.002 0.003 0.004 0.005 O.cm 0.007 O.cm 0.009 0.010 0.011 0.012
Filtrate IKllume [m1
178
Figure 5.15: Sigmoidal fitting curves on trials dataln general, these sigmoidal
curves described the trial data quite well, over nearly the entire range of
the filtration. The four trials above were the same as for fitting the
dispersion model; this shows that the sigmoidal fits are able to describe
the extraction curves.
The only problem is that this function cannot describe the dilution effect at
the beginning of the filtration procedure. Despite this deficit, the sigmoidal
equation was used in the computer model, because the dilution effect is
not consistent for all trials and will also depend on the geometry of the
equipment used.
Table 5.1 shows that mainly dX varies between the trials. This parameter
describes the change of extract over the filtrate volume. The smaller this
parameter the better the washing effect.

179
Table 5.1: Parameters for the fitting curves of the above examples
Trial 26 Trial 28 Trial 29 Trial 24
Emax 17.0 17.3 17.5 17.0
EO 1 1 1 1
Xc 0.0847163 0.0852383 0.0797507 0.0810564
dX 0.009572 0.0086533 0.0130718 0.0206695
It has been shown in Chapter 4.4 that the washing efficiency (defined as
extract in the mash to extract in the wort) changes with MPS (see Figure
5.17). With high MPS in the fines better washing efficiency was achieved.
This effect will be outlined now.
Bigger particle size in the fines could increase tortuosity in the cake as
less pores would be blocked with layers of particles with low permeability.
The tortuosity of channels in the bed would be increased. This effect
results in a decrease of the axial dispersion coefficient and a better
washing efficiency. Another important effect is the height of the cake
during cake washing. It is affected by the compaction of the cake. This
effect is described above: MPS affects permeability of the bed and
permeability has been correlated to Lmin• hence MPS affects Lmin. Again
lower MPS values in the fines cause lower final bed heights. Cake
washing would be less efficient.
This correlation between small particles and the washing efficiency was
investigated. For all trials sigmoidal functions were fitted and a dX - MPS
relationship was established. The results showed no clear correlation
between dX and the MPS (R=O.38). Xc was set constant to O.0086m3.

0.00.,----:----:-----:------:-----,
0.78 . __ ._ .. ,------" "',"' "f'" , ,
0.76 - - - - - - - - "L - - - - - - - '- - . ,.:! - - -'- - ....
, , -' I ..... J ,
"'- - -,- "
:.. .... 0.74 .. - - - - -..f .......... , .. AA .&.- j- - - -,- - - ; ... --' - - .',-
, --,
0.72 _ A- _ ...... ' ... , .. ,,_ ... _____ .. i... -,- - - - - _1- ,_
, aa
0.70 ----:. .... , ... ------,. . ..... _-,----_.
O.68+--~-_+_-~-__T-~-_;----i__-~__l
3 4 5 6 7 8
MPSI~ml
Figure 5.16: Washing efficiency as a function of MPS
0.0030 .,-----;-----;-----,-------,--------,
0.0025 .... -.--,----
0.0CI20 .': --1-a
a a
0.0010 ------A-_ -.
0.0005 ,..
-"':-
~ aa
a·
-- a
--- ,
-------,.-
----
a
-,-- -, - -
O.OOOO+----;--~_;-~-_+---__+_---{
3 4 5 6 7 8
MPSI~ml
180
Figure 5.17: Width of the sigmoidal fitting curve versus MPS with linear correlation and
upper and lower limits (2xSD)

181
The described influence of the MPS on the washing curve can therefore
not be verified. The effect of the MPS on extraction, however, has been
shown before with a much clearer correlation. One of the reasons for this
unclear correlation with extract data over filtrate volume may be the
inaccuracy of the analysis. Extraction data was determined after filtration with hydrometers, an analysis with relatively high accuracy (E = ±0.05
°Plato). The extract over volume curve (to which the sigmoidal curve was
fitted) was determined directly during filtration with a refraction analysis
and total volume of filtrate determination, which is less accurate (E = ±0.5
°Plato , V= ±0.25 e).
5.2. A Computer Model describing Lautering
5.2.1. Development of the Computer Model
The computer algorithm shown in this section was derived from the
correlations explained above. It assembles the various relationships which
originate from viscosity and MPS variations.
The initial calculations (see Figure 5.18) determine the MPS and the
viscosity at filtration temperature from the input variables.
The next stage of the programme calculates the height of the filter cake
after sedimentation, before filtration starts. The sedimentation rate is
calculated using equation 5.7. The total time for sedimentation is 10
minutes. The initial height of the cake is influenced by the size of the fines.
Higher initial levels are caused by slower settling rates. After the
sedimentation stage, filtration starts.
In the following calculation the final height of the bed after washing was
determined. It was found that this is a function of the permeability. The
permeability of the cake is dominated by the permeability of the fines. As
shown in Figures 5.6 and 5.7, mainly the MPS of the fines affects this
parameter.
The main part the algorithm is shown in Figure 5.19. This part calculates
the main parameters for the filtration run and the washing process. As
neither differential pressure nor flow rate are constant over filtration time
the total time required to collect a pre-set volume of wort and individual

182
values of cake height and extract concentration were calculated by
iteration. The following flowcharts show the different parts of the computer
program.
~ '-'---.,--)--------------, ~,
0'~~v ,
Figure 5.18: Initial calculations to determine MPS and viscosity at lautering temperature.
initial and final cake height

1:2~~~:~ ta ) ________ _
120 I
Lmin
~ ~~~ ,
, ,..
~~ ~
J ''''' .. -=:::l B[g ~ (VlII~::J
dp(I>IJ
Figure 5.19: Main part of the lautering model
183

184
The following list shows the text of the program, written in MicroCal
Origin's programming language, LabTalk™, which is based on the
languages DOS and C++.
The program is started with the command in lauterin.txt. It runs the batch
of commands in prog_run.txt.
lauterin.txt
I run c:loriginlprog run. txt;
The individual programs in the batch are carried out in a sequence. The
modular structure made changes and de-bugging much easier.
run c:loriginlmps_temp.txt;
run c:loriginlvis_temp.txt;
run c:loriginlltmod1.txt;
run c:loriginlltmod2. txt;
run c:loriginlltmod8.txt;
The individual algorithms of each program module are listed below.
I*Subroutine to calculate the MPS at maximum mash temperature
*mps_temp.txt'l
getn (MPS (no shear) at 75'C) MPSgiven (Max. mash temperature) TMax (Please
insert the malt specific MPS and your maximum mash temperature:);
MPSdt=75-65; I*calculates the lab mash
*temperature difference to 65'C*1
MPSO=MPSgiven-O.045*MPSdt-O.0032*MPSdtA2;
dtemp=Tmax-65;
I*calculates the MPS at 65'C*1
I*calculates the brewhouse
*mash temperature
*difference to 65'C*1

MPS = MPSO + 0.045'dtemp + 0.0032'dtempA2; /*defines MPS change
'with temperature"
type -c ("MPS at the given temperature is $(MPS,.3)~m");
185
/*Subroutine to calculate viscosity at lautering temperature and the Slope A 1 of the
viscosity-extract relationship, vis_temp.txt"
getnum (Viscosity of 'first wort') visc20 (Please insert the first wort viscosity at 20'C
[mPas]);
getnum (Extract of 'first wort') Efirst (Please insert the first wort extract at 20'C ['Plato]);
getnum (Temperature) Tlaut (Please insert Your lautering temperature ['C]);
AD = 1.324 - D.D1776'Tlaut + 7.058E-5'TlautA2;
visc70 = 0.177 + 0.254'visc20;
'*Viscosity of water at lautering
temperature"
/*calculates the viscosity
'at 70'C"
visczero = visc70 + 0.0298'70 - 1.3E-4'70A2;
/*calculates the imaginative
'viscosity at O'C,
'for a square relationship
'between 65 and 9S'C"
visclaut = visczero - 0.029S'Tlaut + 1.3E-4'(Tlaut)A2;
"calculates the
'viscosity at the given
'Iautering temperature"
A 1 = (visclaut - AO + (3.604E-5'EfirstA2) - (3.720E-5'EfirstA3))' Efirst;
type -c ("The viscosity at Your lautering temperature is $(visclaut,.3) mPas");

Itmod1.txt
I*Subroutine: Calculation of the final bed height in the pilot lauter tun:
'Itmod 1 . Ixt"
Bmin=-6.92E-11+4.889E-12'MPSA2; I*Minimum Permeability
'at end of filtration
if (MPS < 3.76) {Bmin=O};
pfinal=data(0,2500,100);
col( 1) = pfinal;
A=0.0134;
eta=visclaut ' 1 E-3;
'in the pilot lauter tun"
I*minimum value, Bmin should
'not get negative"
I*make pressure data from 0 - 2500 Pa"
I*Pressure range in [Pal used
'in Pilot Lauter Tun"
"Area Lauter Tun in [m2]*'
"viscosity in [Pa.sl at end
'of filtration assumes: end = beginning"
u=(1.65E-6-5.32E-1 0'pfinal-4.66E-14 '(pfinaIA2));
I*velocity in [m"sl,p in [Pal
'related to dp"
LP=(0.35-1.17E-4'pfinal+2.18E-8'(pfinaIA2));
B 1 =( u'eta'LP)'(A 'pfinal);
col(2)=B1 ;
I*height of the bed in [ml,p in [Pal
'related to lauter tun
'final pressure"
I*Darcy Equation to obtain
'the final pressure by
'substitution"
I*assign col(2) for B1 data',
186

for(i=1;i<=26;i+=1) {
if(col(2)[ij> Bmin && col(2)[i+lj < Bmin) {
pmin=(col(l )[i]);
Lmin=0.35-1.17E-4"pmin+2.1SE-S"pminh2;
}
}
I*calculate the final bed
"height in [mj"';
type -c "The final pressure across the bed is $(pmin,.O) Pa";
type -c ("Lmin=$(Lmin,.2)m");
Itmod2.txt
1*2.Calculation of the cake height after 10 minutes sedimentation:
"Itmod2. txt"'
t=600;
HO=0.527;
Hmin = 0.42;
I*total sedimentation interval [sj"'
I*Liquid Level in the Lauter Tun
" [mj*'
I*minimallevel of the bed [mj"'
dhdt = 1.5E-4 - 1.4E-5 " MPSh2; I*Sedimentation Rate (dh'dt)
" [m'sj"'
ts = 0.9 "t;
H=HO+dhdt"ts;
I*Effective Sedimentation Time
" [mlsj"'
I*Height of cake calculated after
"sedimentation rest"'
187

if (H <=Hmin) {LO=Hmin;};
if (H > Hmin) {LO = H;};
if (H > HO) (LO = HO;);
type -c "The final sedimentation level is $(LO,.2) m";
Itmod8.txt
I*Main Program to calculate the Lautering Time incl. extraction: Itmod8.txt"
dt = 120;
A = 0.0123;
Vtotal=0.011 m'
tdecay = 0.0027 - 0.00431 ' Lmin;
BO=1.31 E-8 'LminA4.679;
Emin = 0;
EEff = 0.66 + 0.015 ' MPS;
XO=0.78xVtotal
dX = 6.22E-3 - 6.49E-3 ' EEff;
for (i=1 ;i<=1 01 ;i+=1) (col(3)[i]=dt'(i-1)};
col(3)[i] = t[i];
col( 4 )[i] = dp[i];
col(5)[i] = dVdt[i];
col(6)[i] = dV[i];
col(7)[i] = Vtotal[i];
col(8)[i] = L[i];
col(9)[i] = B[i];
col( 1 O)[i] = E[i];
col(11 )[i] = visc[i];
for (i=1; i<=100; i+=1){
col(dp)[1] = 0;
I*time-interval for steps: 2 minutes"
I*filter area"
I*total filtration volume"
I*decay constant for the compaction of
'the cake"
I*permeability at minimum cake height"
I*minimum extract level at end of
'washing"
I*washing efficiency as afunction of
'MPS"
I*centre'of extraction curve"
I*width of sigmoidal extraction curve"
188

col(dVdt)[i] = 1.65E-6 - 5.32E-10*col(dp)[i]- 4.66E-14*col(dp)[i]'2;
col(dV)[i] = col(dVdt)[i] * dt;
cOI(Vtotal)[i] = sum(col(dV))[i];
col(L)[i] = Lmin + (LO-Lmin) * e'(-col(Vtotal)[i]/tdecay);
if (col(L)[i]<=Lmin) {L[i]=Lmin};
col(B)[i] = 1/3E7 * (col(L)[i])'5;
col(E)[i] = (Efirst-Emin) 1(1 + e'((col(Vtotal)[i]- XO)/dX»;
189
col(visc)[i] = AO + A1*col(E)[i]- 3.604E-5*col(E)[i]'2 + 3.720E- 5*col(E)[i]'3;
col(dp)[i+1] = (col(dVdt)[i] * col(L)[i] * (col(visc)[i] * 1 E-3) I (A*col(B)[i]));
if (col(Vtotal)[i]>= 0.011) {ttotal=col(t)[i]; break};
}
tminutes=ttotaV60;
type -c "The totallautering time is $(tminutes) minutes;
The model runs in MicroCal Origin, a Microsoft WindowsTM based scientific
graphics program. Due to use of the Windows user interface the program
is user friendly. Display of graphs and use of the program is possible on
any computer running the Windows Version 3.1 or higher.
5.2.2_ Predicting Lautering Performance with the Model
The computer model shown above was developed from all data available
from the experimental work. To check the accuracy and relevance of the
model for different input parameters, results from individual trials were
tested against the model. The following lautering diagrams (Figure 5.20 -
5. 23) show real data from experiments compared with the calculated data of the model.
It can be seen that lautering time can be predicted from the model with
good accuracy, whereas extraction of the cake during washing is
averaging the real data. The change of the cake height fits the real data
with good accuracy. As explained in section 5.1, the cake height plays a
crucial function in determining totallautering time.
The lautering time observed in the trials was compared with data
calculated from the model by varying the input values for MPS. Viscosity
was kept constant. Figure 5.24 shows that the lautering time predicted
from the model lies in the same range as the measured data. The slope of

190
the fitted curves with MPS are very similar. The relatively large variation in
lautering time is mainly due to variations in viscosity in the real data.
3Or-:;::~::;::~=::::::=;-:-:r==?;~~~ 0.6 CXlferential pressure Cake Height
• Filtrate wlurre Eldrad
, I I , !
--~-----~----r----l---- 0.5 ,
0.4
"6 -- -, .- - .- - 0.3 -
0.2
0.1
o 20 40 60 100 120 140 160
Time [min]
Figure 5.20: Trial 57 real (data pOints) and calculated data (lines)
30
~ 25
~
~ 20
is 8 15 Q)
1!! ~ u:: 10 0
1;1
~
-S 5
,ji 0
, \
\
, , - •
£llferential pressure Fillrate wlurre Eldrad
• Cake Height , ,
- - l - - - - -,- - - - - r - - - - "r - - - -
, I , I I I I I I
• \ I I I I , I I I - - -\, - l' - - - -..., - - - - -,- - - - - r - - - -., - - - - -,- - - - - r - - - - l' - - --
• , I I I I I
.A..I~~ ......... ":""'''.a. I
-.~-~-~-!.~: .. ~~~':..--:_-_::-_- --:- ~---r - - - -.., - - - - -1- - - - -!- - - - - -t - - --•• """<.. -____ ~_ .. : : : : I
•• ., ."~"r".lr:-._, 11: ••• I1 : ••• i. •••• -.
: ~ ~ ~ _ ; ~ : ~ : ~ ·.~.~~;~~~:~~~~~~;~~r~§JI::~~~f ~ ~ ~ ~ ~ ~ ~ ~ -,. .,t"''' I I I I --__ ~. I
:r~:~::;.~'''''' I - I
-.~~::~>~:
t
0.6
0.5
0.4
0.3
0.2
0.1
0.0 o 20 40 60 100 120 140 160 160
Time [min]
Figure 5.21: Trial 30 real (data points) and calculated data (lines)
.§.
t

~~-----------------------, 0.6
• 25 .-•
o 20
Offerential pressure Filtrate wlurre Exlraa
40
: IL-_....::Ca=ke::..:.He=i,,9hc:t--, ________ ~----~ _____ I ______ ----
00 100
Tore [minI
120
, -,- - - - - - - - - -
- - - ,-
140 100
Figure 5.22: Trial 54 real (data points) and calculated data (lines)
~
~ 25
Ig
i 20 .: l:i =0: 15 Cl)
1!! '" u: 10 0
~ ~
5
S 0
• Dflerential pressure • Cake Height ... Filtrate wlurre .. Extrad
, , , , ,. ___ j ____ .1. __ _ .1 ____ .1. ____ 1. __________ L ____ 1 ___ _
'.' I I , , iII~..p ,
'-·11 • ' I , , " ,. " " ............................ . ---------7-"~~-:·:;:r!.::!~~~-·t--------~"::-----~~~t---_.-
....... ~ ....... " , ' ",T .- .... . ", .- -~:"~ ..
I ~>,j-~ ..... _.¥~. ',,, I I...... I ' .. "
...... ~ ... --""::--:-..... "" ... ,,_. . .. '> ..... ,., .. . ;.oL-' I .... ..
-£~._4{ I '. ...
... - I • • • • • • •• • •••••
-;!I(:!:~----.--. -.... ,-----_. --:------. - -. ----------
o -, 20 40 100
Tore [minI
120
"'1 0" ,
140 100
Figure 5.23: Trial 79 real (data points) and calculated data (lines)
0.5
0.4
0.3
0.2
0.1
0.6
0.5
0.4
0.3
0.2
0.1
0.0 100
191
.s :s, ~
It can be seen that the model can predict lautering performance for
variations in viscosity and MPS, other parameters such as raw materials

192
and milling have to be constant. The temperature and MPS in the fines
can be varied over the range found in industrial conditions.
165 r;-:-----;:::====~========~:~ , ... Experimentallautering time
160 " " " .':' .. " , " . - - - - • Predicted lautering time , " I .,' I
1~-·--·-----'~-------------------------~------!------*---, , , I '\ • .. I !
........ 150 ---"-----.-1--',------ ·---------·------ ... ------i-------+---
.£ £145
, . "' -.. , ......•. -, ·-1·· - , . ··1· ..... ,., ,,1
Q) I" ,:;: ~ 140 - . - - ~ - - - - - -:- - - - - -.; '-'!-'; - - -.- - - - ~ - -- - - ~ - - - - - -:- - - - - - ~ - --g> 135 - . - - ~ - - - - - -: - - - - - - - -,. ~ ' ... - - -y - - - - ~ - - - - - ~ - - - - - -,:- - - - - - ~ - - -'c I ' ... " I I
2 130 ... :.... ..... 'y ... ~-', ... :...... ,: '0.
ffi ," ..... ' , , I
...J 125 . __ -'- ______ : ___________ .. ____ ~ ... _'..: ~ _____ ~ ______ : ______ ~ __ _ I .. .1
I I "'... I , ! 120 - . - - -'- - - - - - -1- _ - __________ - y ____ :... y_' ... __ .J ______ i ______ ..l __ _
': W I ... '~:, I :
115 .. -: ...... , .. . ........ ~".. . .... ' ........... : .. . ,
1104--.,--~-T_,~--._~_"r-~-~,~--T_,----,r_~-;--4
M M W U M ~ M 6.5
MPS [~ml
Figure 5.24: Predicted lautering time (dotted line) and measured data (triangles)
Only one set of data are available to test the predictive capability of the
model in respect of lautering performance. In this case there are
limitations. The trial has been carried out at constant pressure conditions
(10 mbar) with a swan-neck run off. Hence, there was no differential
pressure-flow rate correlation. The model was changed to accommodate
for these different conditions. It can be seen that with these changes a
good correlation to measured data was found (Figure 5.25).
Further tests were not possible, because, in addition to the above
mentioned changes in operation conditions of the pilot lauter column, raw
material parameters and milling were changed.

25 •
o
Clteential pressure Rltrale \Olurre Exlrad
40 60
----~----~----~----~----
00 100
Tore [rrinl 120 140
,
160
193
0.6
0.5
0.4
0.3 §:
f 0.2
0.1
0.0 100
Figure 5.25: Comparison between measured (data points) and predicted data (lines) (Trial
carried out by Robin Thorn)

194
5.3. Conclusions
A computer model has been developed which models the physical
parameters in mashing and their influence on lautering performance.
The model has been based on the findings from the experimental
programme of this thesis. Temperature effects on viscosity and MPS have
been incorporated by correlation. Agitation is difficult to measure. The
effects of agitation, however, on particle attrition can be determined
quickly in the laboratory with high accuracy. Therefore MPS has been
included as a parameter representing attrition.
Both viscosity and particle size effects have been combined to model
lautering. Effects relevant to lautering performance such as sedimentation,
compaction of the bed, permeability. and washing efficiency were derived
from the experimental data. The determination of total lautering time has
been based on an iterative algorithm. Direct calculation was not possible
due to the variable pressure, variable flow rate condition in the
experiments. This condition complicated modelling; however, the model is
much easier to apply to large scale industrial brewing.
A major weakness of the model is the assumption of cake porosity. It was
assumed that cake porosity is zero when at maximum compression. This
assumption was made because experimental data on wet and dry cake
mass was not available. For further work it would be recommended to
determine the porosity by measuring dry and wet cake mass and the
average density of solids in the cake (see equation 2.45).
The computer model has been shown to be flexible enough to give
realistic results with the input variables given. However, there are still
areas where the model could be extended and improved. For such
investigations a different malt quality, perhaps also different milling could
be investigated and the findings incorporated into the model. As this thesis
work focused on the variation of process parameters in mashing it does
not include variation of such parameters.

195
6. Conclusion
6.1. General Comments and Overall Conclusions
This thesis describes effects of the mashing parameters temperature and
agitation, on mash properties. In the main, two properties are influenced
by these parameters, the viscosity and the particle size distribution in the
fines.
For the first time particle size effects in mash were investigated
systematically. The importance of fine particles for lautering performance
could be confirmed and quantified. In the trials attrition effects were
investigated using only one malt quality, thus enabling the work to focus
on mashing parameters.
The precipitation and aggregation of fine particles with increasing
temperatures in mashing could be monitored. It was shown that this
parameter is not malt dependent. Mashes from different malts react in the
same way.
Viscosity effects on lautering performance have been reported in the
literature as the main influencing factor. It could be shown using constant
filtration temperatures and the variation of MPS that this parameter is
more important than viscosity in determining mash filterability.
Experiments were carried out either at a pilot scale or at a laboratory
scale. It was found that a stirrer with torque meter was ideal to determine
power input and to relate large scale trials to laboratory scale.
Filter cake washing was described with the dispersion model for mash
filter applications. The suitability of this model was confirmed.
In pilot scale trials it was tried to mimic different agitation conditions uSing
a circulation loop with a mono pump. It could be shown that the effect of
the pump masked any additional variation of the power input in the loop by
single seat valves or orifices. However, it was still possible to get sufficient
data in a wide MPS range to enable modelling of the particle size
parameter with pilot scale data.

196
Small scale trials using a stirrer with torque meter revealed that minimal
power input up to 0.1 WfR. was sufficient to achieve optimum extraction of
the malt. Additional power input had negative influence on filterability of
the samples. It was confirmed that this is due to attrition effects mainly in
the particle fraction below 106 IJm. Due to a careful selection of the malt
quality, viscosity changes could be excluded and it was therefore possible
to establish a very close correlation between filterability and MPS change.
The comparison of attrition effects with temperature-induced aggregation
shows that higher temperature lautering cannot cure high attrition rates.
However, aggregation of particles by heat can improve lautering
performance.
In this thesis, the lautering process has been modelled for the first time.
Previous attempts of modelling mash filtration have focused on the
application of filter presses, which is the second, most used method in the
brewing industry. The sedimentation behaviour of mash will only be
observed in lauter tuns. It has not been described and modelled before.
Bockstal et al. (1985) described the sedimentation for hammer milled malt,
which appears to settle in one band only.
The model described here has been based on the findings from the
experimental programme of the pilot trials of this thesis. At present the
model is limited to one malt quality, and only mashing parameters are
included. Data predicted from the model showed good correlation with real
data.
6.2. Implications for Industrial Brewing Practice
The findings presented in this thesis will have significant influence on
practical brewing. Mashing conditions beneficial for lautering have been
developed and optimised empirically. It is now possible to optimise these
conditions by monitoring the key parameters for lautering in the mashing
process.
There are two areas where optimisation is possible, temperature and
agitation regimes. The brewhouse manufacturers agree that agitation in
mashing should be minimal. This is particularly so where mixing is not
essential for enzymatic conversion or for a good heat transfer. This is at

197
temperatures above 72°C and at stages where temperature is constant,
i.e. at mash transfer into the lauter tun.
Higher mashing off temperatures have been proposed by several authors
as a measure to increase lauter tun filtration rates. The main reason why
run off rates are much higher at higher temperatures has not been
identified. Effects of higher temperature have been contributed to viscosity
only.
Higher mashing temperatures above 78°C have found widespread
application in practical brewing in decoction mashing, where parts of the
mash are boiled in separate vessels. This procedure has been proven
suitable for the preparation of mashes with lower modified malt.
Dependence on raw material quality can be reduced and consistent
lautering rates can be achieved. Boiling affects extraction of malt grist in a
positive way and improves the particle size distribution in the fines by
aggregation of the protein fraction. Boiling time has been optimised
empirically for optimum extraction. It might now be possible to optimise
also the particle aggregation and hence increase lautering rates.
Only particle aggregation due to heat has been described in this thesis.
From the literature it could be assumed that other parameters such as
polyphenol content of the mash, cation concentrations or acidity of the
mash could also influence particle aggregation. Consequently, a careful
optimisation of these parameters for enhanced mash filtration rates might
be possible.
The computer model makes it possible to test effects of particle size
distribution and viscosity on mash filtration performance. It could be used
directly as a tool for optimisation of mashing conditions and in the
development of new procedures.

198
7. Appendix
7.1. Nomenclature
A activation energy kcal mol-1
A cross sectional area (face area) m2
a exponent
a constant: a = aTJc
AL area taken by liquid m2
Ap area taken by particles m2
Ap projectional area normal to the direction of motion m2
B permeability of the cake m2
b constant: b = TJRm ·
C coefficient relating to a reference temperature T2
or reaction rate k2
C concentration kg m-3
Cd d rag force coefficient
cg gravimetric concentration (w/w)
cp specific heat at constant pressure kJ kg-1 K-l
Cv (solids) concentration by volume (w/v)
Cw concentration in the wash liquid kg m-3
Co initial concentration kg m-3
CV coefficient of variation %
0 velocity setting on the Haake Rotovisco

199
0 molecular diffusivity m2 S-l
0 dispersion coefficient m2 S-l
d diameter m
Oa diameter of impeller m
dgap gap between stirrer blade (tip) and wall m
d j internal (pipe) diameter m
°L axial diffusion coefficient m2 S-l
dLC logarithmic median diameter jJm
do orifice diameter m
dp diameter of particles m
OR diameter of the stirrer m
°t diameter of agitated vessel m
degr. degree of a scale from 0 to 1
dh differential height m
dt differential time s
dX width of the extract fitting function m3
E extract level °Plato
E extract content in the wort °Plato
E turbulent mass transfer coefficient m2 s-l
e exponent
Emax maximum extract content °Plato
Eo extract content in the wort at Vtotal °Plato
Ero extract level after infinite time of conversion %(w/v)

200
F filterability m6 S-1
f constant
FA apparent fermentability %
FA buoyancy force N
Fd drag force N
FG force due to the mass of the particle N
Fw drag at the wall of a particle N
Fr Froude number
G shear rate S-1
9 gravitational acceleration m S-2
Gaiter·: specific gravity after fermentation ·Plato
Gbef.: specific gravity before fermentation ·Plato
Gm shear rate S-1
h head of fluid m
hj individual heat transfer coefficient W m-2 K-1
Ho height of the cake after sedimentation m
K permeability m2
K constant
k thermal conductivity W m-1 K-1
Kb1 ball constant Pa cm3
g-1 s
Ko Kozeny constant
K1 constant
K2 constant

201
L length or thickness m
Le heig ht of the filter cake m
Lmin minimum height of the cake m
La initial height of the cake before start of filtration m
M absolute mass deposited kg
m exponent
m moisture content
m mass kg
m mass of cake deposited per unit area kg m-2
m diffusion mass-flow density kg m-2 s-1
mF mass of the filter kg
mp mass of particles in the density bottle kg
mw2 mass of the liquid fraction in the density bottle kg
m1 mass of cake deposited with volume of filtrate kg m-3
m1 mass of clear liquid in the density bottle kg
M2 mass of particles sedimenting kg
m2 mass of suspension in the density bottle kg
MPS mean particle size of a number distribution IJm
n impeller (stirrer) speed min-1
n exponent (compressibility index)
n number of data points
ne percentage of particles in a channel %
P power input W

202
Ps solids pressure N m-2
Pspec specific power input W £-1
Pe Peclet number
Q volumetric flowrate m3 S-l
R universal gas constant 1.98 cal
mol-1 K-1
R cake resistance m-1
Rc resistance of the filter cake m-1
RF resistance of the fines layer m-1
Rm resistance of a filter medium m-1
RSG resistance of the spent grains layer m-1
Rtotal total resistance m-1
RA remaining alcality (degrees of hardness) od
Re Reynolds number
s solids concentration in a slurry (mass fraction)
So specific surface of the particles in the cake m2 m-3
Sc Schmidt number
T absolute temperature K
t mashing time, time interval min
tdecay decay constant m3
7jaut lautering temperature °C
u average liquid velocity through a filter cake ms-1
V volume of liquid m3

203
v velocity of the tips of an impeller (v = ;0 D.) m S-1
v mean velocity over cross section in a tube m S-1
Vo sedimentation velocity m S-1
Va cake volume before contraction m3
Vb cake volume after contraction m3
Vcake cake volume m3
VL volume of liquid replaced by particles m3
VL flow rate of liquid m3 s-1
Vp Volume of the particle fraction in a density bottle m3
Vp volume of particles settling m3
Vparticles particle volume m3
Vp flow rate of particles m3 S-1
v, velocity of the tip of a stirrer relative to the liquid m S-1
VS volume of solids m3
Vs settling velocity of particles m S-1
VI collected filtrate volume at time t m3
Vlolal total wort collected m3
Vvoid void volume m3
Vw2 volume of the liquid fraction in a density bottle m3
Vwort wort volume m3
Vo volume of a density bottle m3
W wash ratio

204
W total mass of cake deposited kg
W mass of solids deposited per filter area kg m-2
wL liquid velocity m 5-1
Wm mean work Nm
wp free settling velocity of particles m S-l
WPR reduced settling velocity m S-l
W2 mass deposited by sedimentation kg
x distance variable in vertical direction m
x average of a group of data points
Xc centre of the extract fitting function m3
Xc median size of a channel Ilm
Xg geometric mean of all channels Ilm
Xi individual value
a specific cake resistance m kg-1
a average specific resistance m kg-1
aAV average specific filter resistance m kg-1
ao specific resistance at unit applied pressure drop m kg-1
Llc concentration difference kg m-3
.dL distance m
LIp pressure difference N m-2
Llpc pressure loss across the filter cake N m-2
LIx distance m
LIp density difference between solid and liquid kg m-3

205
porosity
cav average porosity
'7 dynamic viscosity N m-2 s
'7 dynamic viscosity at lautering temperature N m-2 s
'7w dynamic viscosity N m-2 s
'70 dynamic viscosity at ooe N m-2 s
'720 dynamic viscosity at 20 0 e N m-2 s
'765 dynamic viscosity at 65°e N m-2 s
'770 dynamic viscosity at 70 0 e N m-2 s
v kinematic viscosity of a fluid (v=T]/p) m2 S-1
A exponent (compressibility index)
A defined by equation 3.64
universal constant
P density kg m-3
PFL density of a fluid kg m-3
PL density of liquid kg m-3
{Jp density of particles kg m-3
Ps density of solids in the cake kg m-3
P1 density (ball) kg m-3
P2. density (liquid) kg m-3
T torque Nm
angular velocity s-1

206
7.2. References
Aastrup, S., Erdal, K., A mass balance study of ll.-glucan in malt, spent
grains and wort using the Calcofluor method, EBC Proceedings of the 21.
Congress, Madrid, 1987, 353 - 360.
Ahvenainen, J., Vilpola, A., Makinen, V., Einflull. der Lauterarbeit auf
Brauprozell. und Bierqualitat, Monatsschrift fOr Brauwissenschaft, 36,
(1983),2,69 - 73.
Arndt, G., Linke, L., Labortechnische Untersuchungen zum Maischprozell.
bei der Bierherstellung, Lebensmittelindustrie 26, (1979), 10, 461 - 465.
Asselmeyer, F., Hohn, K., Issing, E., Die Temperaturabhangigkeit von
Viskositat und Dichte bei Bieren, Ausschlag- und Vorderwurzen,
Monatsschrift fOr Brauwissenschaft 26, (1973), 4, 93 - 101.
Baluais, G., Leclerc, D., Moll, M., Lenoel, M., Washing and compression
dewatering of brewing mash, EBC Monogr. XI, Wort Production, Maffiier,
(1986), 52 - 71.
Bamforth, C.w., Barley ll.-glucans, their role in malting and brewing,
Brewers Digest (1982), 6, 22 - 35.
Barrett, J., Clapperton, J.F., Divers, D.M., Rennie, H., Factors affecting
wort separation, J. Inst. Brew. 79, (1973), 407 - 413.
Barrett, J., Bathgate, G.N., Clapperton, J.F., The composition of fine
particles which affect mash filtration, J. Inst. Brew., 81, (1975), 1/2, 31 -
36.
Baxter, E.D., Wainwright, T., The importance in malting and mashing of
hordein proteins with a relatively high sulphur content. EBC Proceedings
of the 17. Congress, Berlin (West), (1979),131 - 143.
Bockstal, F., Fourage, L., Hermia J., Rahier, G., Constant pressure cake
filtration with simultaneous sedimentation, Filtration & Separation, 22,
(1985),4,255 - 257.
Briggs of Burton, Exhibition Catalogue, Interbrau 1993, Munich

207
Buhler GmbH, Braunschweig, Exhibition Catalogue, Interbrau 1993,
Munich
Camp, Th. R, Stein, P.C., Velocity gradients and internal work in fluid
motion, Journal of the Boston Society of Civil Engineers, XXX, (1943), 4,
219 - 237.
Carman, P.C., Fluid Flow Through Granular Beds, Transactions of the
Institute of Chemical Engineers, 14, (1937),15,150 -166.
Coulson, J.M., Richardson, J.F., Backhurst, J.R, Harker, J.H., Chemical
Engineering, Volume 2: Unit operations, 3rd Edition, Pergamon Press Ltd.,
Oxford, 1985.
Chladek, L., Mathematisches Modell des Lauterprozesses bei der
Bierherstellung, Die Lebensmittel-Industrie 24 (1977), 9, 416 - 420.
Curtis, N.S., The impact of R&D on brewery design, MBAA Technical
Quarterly, 16, (1979),4,198 - 203.
De Clerck, J., A texbook of brewing, Vol. 1, English translation, Chap man
and Hall, London, 1957,286 - 295.
Dick RI., and Ewing, 8.B., Evaluation of activated sludge thickening
theories, Journ. of the Sanitary Eng. Division, 9, (1967), 9 - 29.
Dufour, J.P., Alvarez, P., Devreux, A., Gerardi, W., Influence of the
filtration procedure on the relationship between wort turbidity and its lipids
content, Monatsschrift fOr Brauwissenschaft, 39, (1986), 3, 115 - 121.
Dullien, F.A.L., Chem. Eng. J. 10, 1, (1975)
Einenkel, W.-D., Mersmann, A., Erforderliche Drehzahl zum Suspendieren
in Ruhrwerken, Verfahrenstechnik, 11, (1977), 2, 90 - 94.
Englmann, J., Wasmuht, K., Influence of lautering on fermentation and
beer properties, Brauwelt International, 9, (1993), 111,206 - 210.
European Brewery Convention, Analytica EBC, 4. Edition, Brauerei und
Getranke-Rundschau, Zurich, 1987

208
Eyben, D., Hupe, J., Filterability of wort and beer and its relationship with
viscosity, EBC Symposium on the relationship between malt and beer,
Helsinki, 1980,201 - 212.
Ferenczy, L., Bendek,G., Untersuchung der Veranderung der
Wiirzeproteinzusammensetzung wahrend des Maischprozesses mit der
SDS-PAGE-Gelelektrophorese und deren EinfluB auf das Ablautern,
Monatsschrift fUr Brauwissenschaft, 44, (1991), 5, 191 - 200.
Fitch, B., Sedimentation process fundamentals, Am. Inst. Min. Met. & Petrol Engr.(Society of mining engineers), 223, (1962),6,129 - 137.
Graveland, A., Bongers, P., Bosveld, P., Extraction and fractionation of
wheat flour proteins, Journal of the science of food and agriculture, 30,
(1979), 71 - 84.
Greffin, W., KrauB, G., Schroten und Lautern, 11., Monatsschrift fUr
Brauerei, 31 (1978), 192 - 212.
Hermia, J., Eyben, D., Considerations sur les procede de filtration en
brasserie, EBC Proceedings of the 19. Congress, London, 1983, 209 -
224.
Hermia, J., Rahier, G., Designing a new wort filter, Filtration & Separation,
22, (1990), 11/12,421,422,424.
Herrmann, H., The state of technology in the brewhouse, Brauerei Journal, (1991), 27 - 30.
Herrmann, H., Kantelberg, B., Lenz, B., New lauter tuns, Engineering
practice - technology - field experience, Brauwelt International, 6 (1990), I,
22 - 28.
Heyse, U., Aktuelle Situation im Bereich des Sudhauses, Brauwelt, 133, (1993),13,573 - 574.
Home, S., Pietila, K., Sjoholm, K., Control of glucanolysis in mashing,
Journal of the ASBC, 51, (1993), 3, 108 - 113.
Horn, E.-M., Eindickung und Abscheidung von Feststoffen aus
Suspensionen im vertikal durchstromten Sedimentationsapparat,
Fortschr.-Ber. VDI Reihe 15, No. 62, Diisseldorf, 1988,

209
Hough, J.S., Briggs, D.E., Stevens, R., Young, TW., Malting and Brewing
Science, Vol.1 Malt and Sweet Wort, Chapman & Hall, London, 1986.
Hug,H., Anderegg, P. Mandli, H., Pfenninger, H., Zum EinfluB des
Sauerstoffs bei der WOrzebereitung-Halbstechnische Brauversuche unter
Extrembedingungen, Brauerei-Rundschau, 97, (1986), 6, 113 - 140.
Huige, N.J., Westermann, D.H., Effect of malt particle size distribution on
mashing and lautering performance, MBAA Technical Quarterly, 12,
(1975),1,31 - 40.
lOB, Recommended Methods of the Institute of Brewing, 1977
Jager, P., Damkohler, G. Winzig, K., POspok, J., Die Viscositat als
MaBstab fOr die Lautergeschwindigkeit, Mittteilungen der Versuchsstation
fOr das Garungsgewerbe in Wien, (1977), 5/6, 52 - 59.
Johnstone, J., Liquid solid separation in the brewhouse, MBAA Technical
Quarterly, 29, (1992), 1 - 5.
Kano, Y., Karakawa, T., Importance of residual starch in the spent grains
for wart run-off, Bulletin of Brewing Science, 25, (1979), 1 - 7.
Klotz, K., Dallmann, W., Die Mikroprozesse der Kuchenfiltration und ihre
gegenwartige theoretische Beschreibung, Chem. Techn. 36, (1984), 4,
152 - 156.
Koglin, B., EinfluB der Agglomeration auf die Filtrierbarkeit von
Suspensionen, Chemie Ingenieur Technik, 56, (1984), 2, 111 - 117.
Kolbach, P., Die Umrechnung von WOrze und Bier auf einen bestimmten
Extraktgehalt, Monatsschrift fOr Brauerei 13, (1960) 21.
KrauB, G., Schroten und Lautern, I., Monatsschrift fOr Brauerei, 26,
(1973),214 - 219.
Kynch, G.J., A theory of sedimentation, Transactions of the Faraday
Society, 48, (1952), 161 - 176.
Laing, H., Taylor, D.G., Factors affecting mash bed permeability, lOB
Austr. and N.Z., Adelaide, 1984, 109 -114.

210
Leberle, H., Schuster, K., Die Bierbrauerei, Volume 2: Die Technologie
des Sudhauses, Ferdinand Enke, Stuttgart, 1956.
Leedham, P.A., Savage, D.J., Crabb, D., Morgan, G.T., Materials and
methods of wort production that influence beer filtration, EBC Proceedings
of the 15. Congress, Nice, 1975,201-216.
Lewis, M.J., Wahnon, N.N., Precipitation of protein during mashing:
Evaluation of the role of calcium, phosphate, and mash pH, Journal of the
ASBC, 42, (1984), 159 - 163.
Lewis, M.J., Oh, S.S., Influence of precipitation of malt proteins in
lautering, MBAA Technical Quarterly, 22, (1985), 108 - 111.
Lewis, M.J., Robertson, I.C., Dankers, S.U., Proteolysis in the Protein Rest
of Mashing - An Appraisal, MBAA Technical Quarterly, 29, (1992), 4, 117 -
121.
Lewis, M.J., Serbia, JW., Aggregation of protein and precipitation by
polyphenol in mashing, Journal of the ASBC, 42 (1984), 40 - 43.
Lie, S., Grindem, T., Jabobsen, T., Oxygen absorbtion in the brewhouse, a
quantitative study, EBC Proceedings of the 16. Congress, Amsterdam,
1977,235 - 243.
LOers, H., Die wissenschaftlichen Grundlagen von Malzerei und Brauerei
Hans Carl, NOrnberg, 1950.
Marc, A., Engasser, J.-M., Moll, M., Flayeux, R., Kinetics and modelling of
starch hydrolysis during mashing, Util. Enzymes Technol. Aliment.
Symp.lnt. (1982), 115 - 119.
McCabe, W.L., Smith, J.C., Harriott, P., Unit operations of chemical
engineering, McGraw - Hill Book Company, London, 1985.
McFarlane, I.K., Mash conversion and preparation, Ferment, 6, (1993), 3,
177 - 183.
MEBAK, Mitteleuropaische Brautechnische Analysenkommission
. Brautechnische Analysenmethoden, Volume 11, Freising, 1987, 15 - 17.

211
Meddings, P.J., Potter, O.E., Physical and chemical processes in
mashing. Effect of particle size, J. Inst. Brew. 77, (1977), 246 - 252.
Michaels, A.S., Bolger, J.C., Settling rates and sediment volumes of
flocculated Kaolin suspensions, Ind. Eng. Chem. Fundam. 1 (1962), 24 -
33.
Moll, M., Baluais, G., Dodds, J. Leclerc, D., A process engineering and
technological approach to mash separation, MBAA Technical Quarterly,
28, (1991), 12 - 17.
Muts, G.C.J., Krakebeeke, M.G., Pesman, L., van den Berg R., Malt
characteristics and filtration, Proc. of the lOB, Austral. and N.Z. Section,
Adelaide,(1984), 115 -120.
Muts, G.C.J., Pesman, L., The influence of raw materials and brewing
process on lautertun filtration, EBC Monograph XI, Mafflier,1986, 25 - 35.
Narzir1, L., Die Bierbrauerei, Volume 2: Die Technologie der
WOrzebereitung, 6. Edition, Ferdinand Enke, Stuttgart, 1985.
Narzir1, L., Der Einflur1 der Sudhauseinrichtung auf die Qualitat von WOrze
und Bier, Brauwelt, 127, (1987),6,207 - 213.
Narzir1, L., Personal Information, 1990.
Narzir1, L., Das moderne Sudhaus mit besonderer BerOcksichtigung der
Ablauterung, Der Weihenstephaner, (1992), 1, 74 - 76.
Narzir1, L., Qualitative und quantitative Aspekte beim Maischen, Brauwelt,
132, (1992), 23, 1072 - 1091.
Narzir1, Reicheneder, E., Edney, M.J., The control of beta-glucan in the
brewery, Monatsschrift fOr Brauwissenschaft, 43, (1990), 2, 66 - 76.
Narzir1, L., Reicheneder, E., Farber, W., Freudenstein, L.,
Sauerstoffaufnahme beim Maischen, Brauwelt, 126, (1986), 1/2, 11 - 25.
Neumann, L., Zaake, S., Beta-Glucangehalt des Malzes, Viscositat der
80-Grad-Hartongmaische, Viscositat der Kongrer1wOrze und Filtrierbarkeit,
Monatsschrift fOr Brauerei, 33, (1980),6,214 - 218.

212
Nielsen, H., The importance of running clear lauter wort, MBAA Technical
Quarterly 10, (1973), 1, 11 - 15.
Perry, RH., Green, D., Chemical Engineers Handbook, Singapore,
McGraw-HiII Book, Inc., 1985.
Pierce, J.S., Influence of beta-glucan and beta-glucanase levels in barley
and malt on extract yield and run-off, EBC Symposium Barley and Malt,
Helsinki, 1980, 179 - 185.
Purchas, D.B., Wakeman, RJ., Proposals for unifying cake filtration tests,
in: Purchas, D.B., Wakeman, RJ., (Editors) Solid Liquid Separation Scale
Up, Uplands Press Ltd, London, 1986.
Richter, K., Reaktionsgeschwindigkeiten beim Maischen und Abtrennung
mit einem Dekanter, EBC Proceedings of the 24. Congress, Oslo,
1993,173 -182.
Robertson, J., Wort production, The Brewer, (1990), 3, 91 - 95.
Ruth, B.F., Correlating filtration theory with practice, Ind.Eng.Chem., 38, (1946),564.
Salzgeber, B., Zur freien Durchgangsflache des Senkbodens bei
Lauterbottichen, Brauwelt, 116 (1976), 42, 1368 - 1371.
Schoffel, F., RGhren der Maische, ein spezieller verfahrenstechnischer
Grundvorgang, Monatsschrift fUr Brauwissenschaft, 31, (1978), 1, 4 - 10.
Schur, F., Pfenninger, H.B., Anderegg, P., Nachteilige mechanische
Effekte auf dem Bierproduktionsweg, Proceedings of the 18. EBC
Congress, Copenhagen, 1981, 129 - 136.
Schur, F., Pfenninger, H., NarziB, L., Kinetische und energetische
Untersuchungen Gber den MaischprozeB, Schweizer Brauerei Rundschau,
86, (1975), 10, 193 - 216.
Schuster, K., NarziB, L., Kumada, J., Ober die Gummistoffe der Gerste
und ihr Verhalten wahrend der Malz- und Bierbereitung, I. Problemstellung
und Analysenmethoden, Monatsschrift fUr Brauwissenschaft, 20, (1967),
4, 125 - 135.

213
Schuster, K., Narzil1, L., Kumada, J., Ober die Gummistoffe der Gerste
und ihr Verhalten wahrend der Malz- und Bierbereitung, 11. Gummistoffe in
der Gerste und ihre Veranderungen beim Malzen und Maischen,
Monatsschrift fur Brauwissenschaft, 20, (1967), 5, 185 - 206.
Stippler, K., Advanced brewhouse technology taking oxygen under
consideration, MBAA Technical Quarterly, 25, (1988), 54 - 61.
Talmage , w.P., Fitch, E.B., Determing thickener unit areas, Ind. Eng.
Chem., 47, (1955), 1, 38 - 41.
Tiller, F.M., and Crump, J.R, Recent advances in compressible cake
filtration theory, in: Rushton, A., (Editor) Mathematical Models and Design
Methods in Solid-Liquid Separation, Martinus Nijhoff Publishers,
Dordrecht, 1985.
Uhlig, K., Vasquez, S., Measuring of shear effect during mashing,
Brauwelt International, 8, (1992), IV, 356 - 357.
Van den Berg, R, Muts, G.C.J., Drost, B.W., Graveland, A., Proteins from
barley to wort, EBC Proceedings of the 18. Congress, Copenhagen, 1981,
461 - 469.
Van Waesberghe, J.W.M., Shearing forces and air uptake during mashing,
Brauwelt International, 4, (1988), I, 50.
Vauck, W.RA, Muller, HA, Grundoperationen chemischer
Verfahrenstechnik, 4th revised Edition, Theodor Steinkopff, Dresden,
1974, Mechanisches Ruhren, 317 - 326.
Wackerbauer, K., Zufall, C., Holscher, K., Der Einflul1 von
Hammermuhlenschrot auf die Wurze- und Bierqualitat, Brauwelt, 132
(1992),29,1366 - 1374.
Wainwright, T., Update on I1-Glucans, Brewers Guardian, 119, (1990), 1, 9
- 13.
Wakeman, RJ., Filtration Post-Treatment Processes, Elsevier,
Amsterdam, 1975.
Wakeman, RJ., Filter Cake Washing, in: Svarovsky, L., (Editor) Solid
Liquid Separation, 2nd Edition, Butterworths, London, 1981.

214
Webster, RD.J., Prediction of the lautering performance of malt, J. Inst.
Brew., 87, (1981), 52 - 56.
Webster, RD.J., Raw materials-Effect on mash separation, Brewers
Guardian, 116, (1978), 7, 51 - 53, 56.
Zangrando, T. Ober den Einflui1 der Klarheit der UiuterwOrze auf die
Bierqualitat, Mitt. d. Versuchsstation f. d. Garungsgewerbe in Wien,
(1978), 9/10, 101 - 105.
Ziemann GmbH, Ludwigsburg, Exhibition Catalogue, Interbrau 1993,
Munich.
ZOrcher, Ch. Grui1, R, Oxygen uptake during mashing and lautering,
Brauwelt International, 5, (1989), IV, 350 - 355.

215
7.3. Glossary of Brewing Terms
Adjunct
Any brewing material, other than malted barley used for brewing as a
source of extract. (Le. cereals, sugar, starch etc.)
Barley
A cereal used for food and when germinated in malting gives malt, for the
production of fermented drinks such as beer.
Break
Precipitation of proteinaceous material and other components from wort,
occurring after boiling (hot break) and with cooling of the wort (cold break)
below temperatures of 60°C.
Brewhouse
The building, housing the wort production vessels and equipment
including mills, mashing vessels (mash cookers), mash tuns, lauter tuns,
coppers, wort coolers.
Cast wort
Wort after boiling.
Cleaning-In-Place (CIP)
An automatic system installed to clean large closed brewery vessels.
Cleaning fluid from a storage tank and wash water are circulated through
the vessel from spray heads, permanently fitted in it, or a portable rig.
There is no need to open the vessel since no worker need enter. This
system is now a normal feature in breweries which have installed large
vessels.
Cold break
Precipitate formed when wort is cooled to room temperatures. Also known
as the fine break since the material, which sediments is much finer and
less in quantity than that of the hot break.
Collection vessel
A measured vessel used to collect wort for the assessment of Excise duty.
Copper
The vessel in which wort is boiled with hops. Previously the vessels were

216
of copper but now many are in stainless steel. Also known as the wort
copper or wort kettle.
Decoction mashing method
Mashing procedure in which part of the mash is withdrawn, boiled, then
returned to the main mash to raise its temperature in steps. There are
several variations known as the one, two and three mash method. The
decoction mashing method is traditionally used in continental Europe for
lager brewing.
Degree Plato, (OPlato)
Expression of the wort extract as a percentage of sucrose in aqueous
solution (weighUweight).
Extract
The material solubilized in the wort during mashing of malt. Measured in percent (w/w) expressed as °Plato.
First runnings
The first small volume of wort (first wort), often turbid in appearance, run
from the lauter tun. It is sometimes returned to the lauter tun.
First wort
First filtrate (wort) drained off the lauter tun. The extract content of this
wort is directly depending on the water to grist ratio and the mashing
conditions.
Grist
Mixture of coarsely ground malt or raw cereals.
Grist case
Grist storage container originally situated above the mash vessel.
High gravity brewing
The practice of producing and fermenting wort at a higher original gravity
than is required to package. Normally the original gravity is adjusted by
dilution with water at the final filtration stage.
Holding time
Period of time at which a process such as the mashing process is
maintained under certain fixed conditions.

217
Hot break
Coagulum (trub). which appears soon after boiling wort begins to cool.
Sometimes called coarse break since the material settling is coarse in
appearance compared with that of the cold or ~fine break
Hot liquor tank
Vessel where water for mashing is heated and stored.
Infusion mashing
A mashing procedure in which hot water and malt grist are mixed to give a
defined temperature (i.e. 65°C). In single infusion mashing this
temperature is hold over a time of Y. to 1 Y. hours. In programmed mashing
different temperature steps, between 40 and 78°C are held.
Iodine test
A quick analytical test to determine whether undegraded starch, which
gives a blue colour with iodine solution, remains in the mash.
Last runnings
The last volume of low gravity (Iow extract) wort from the lauter tun.
Lauter tun
A filtration vessel used in modern mashing techniques, sometimes
partitioned and fitted with rakes.
Lautering
A filtration procedure for the separation of wort from spent grains in a
lauter tun. Lauter tuns are since long time the most widely used separation
devices.
Malt
Barley or other cereal produced for brewing or distilling by steeping,
germinating and kilning. In brewing, malt is assumed to be malted barley.
Malt mills
Traditionally malt mills are of the roll type with two, four or six revolving
rolls, with pairs spaced a short distance apart, crushing and milling the
malt fractions selectively. The aim is to preserve the husk in length wise
fragments which assists drainage of wort during mash separation in the
lauter tun, by forming a filter bed.

218
Malting
The process converting barley to malt
Mash
The mixture of crushed malt grist and hot liquor which yields wort.
Mash conversion
The action of malt enzymes in degrading and converting malt constituents
such as starch and protein during mashing.
Mash filter
Originally a frame and plate filter with a filter cloth either of cotton of
polypropylene, as an alternative for the lauter tun. The new type of mash
filters (since 1989) are filter presses using membrane-plates to compress
the cake and dewater it.
Mash (mixing) vessel
In this survey this container is a heatable vessel, containing the mash
during the infusion mashing procedure.
Mash thickness
The ration of grist weight to water in the mash. For dark beers ratios from
2.5 to about 3.2 are used, for pale Pilsner or Export type beers (Lager)
ratios of 3.0 to 4.0 are common.
Mashing
General expression for decoction or infusion mashing.
Mashing in
Mixing of grist and liquor in the mash vessel.
Modification
Describes the degree of conversion of malt kernels during malting. Malt
modification can be correlated mainly with the following laboratory
analyses: fine coarse extract difference, viscosity and friability
Original gravity (O.G.)
The specific gravity of the finished wort, at 20°C, before pitching with
yeast, on which Excise duty is paid.

- --- - ------
219
Pilsner or Pilsener
A pale lager beer having medium hoppy flavour. Originally brewed in
Pilsen in Czech Republic but now brewed elsewhere.
°Plato
Extract in wort
Protein rest
A temperature step at 52 - 55°C in the programmed infusion mashing
procedure. It enhances the action of proteolytic enzymes which degrade
insoluble proteinaceous material to water soluble, small peptides and
aminoacids.
Ru n-off rate
Rate of filtrate flux in the lauter tun
Saccharification
Enzymatic hydrolysation of starch by amyloytic enzymes producing low
molecular sugars with one, two or three glucose molecules.
Second wort
Weak wort obtained by sparging
Sparge arm
Specially designed revolving tubing distributing sparge liquor over spent
grains.
Sparge liquor
Hot brewing water used to wash wort from spent grains in a lauter tun.
Spent grains
Exhausted residue of malt grist remaining in the lauter tun after wort run
off and sparging. Mainly used as cattle feed.
Sweet wort
Unboiled wort before the addition of hops; also called unhopped wort.
Tun
Used to describe many vessels in the brewery.

220
Wort
The sugary liquid produced by mashing an infusion of malt which on fermentation gives beer.

221
7.4. Table of Figures
Figure 2.1: Flow Diagram and Functions of Brewhouse
Operations ................................................................................................... 4
Figure 2.2: Roller Mill .................................................................................. 5
Figure 2.3: Vortex Pre-masher, (McFarlane, 1993) ..................................... 8
Figure 2.4: Premasher System (Stippler, 1988) ...................... : .................... 8
Figure 2.5: Flow sheet of a mashing vessel (Briggs, 1993) ......................... 10
Figure 2.6: Concentration of gel-proteins and effects on
lautering performance .................................................................................. 12
Figure 2.7: Typical lauter tun with additional equipment
(Ziemann, 1993) ........................................................................................... 18
Figure 2.8: Mash Stirrer (Briggs, 1993) ........................................................ 22
Figure 2.9: Influence of stirring of mash on permeability ............................. 24
Figure 2.10: Heat transfer in a mashing vesseL ........................................... 29
Figure 2.11: Sedimentation curve (after Horn, 1988) ................................... 34
Figure 2.12: Settling of particles in closed systems ..................................... 35
Figure 2.13: Forces exerted on particles in compacted beds ...................... 38
Figure 2.14: Washing curve ......................................................................... 48
Picture 3.1: Mashing and lautering pilot plant .............................................. 58
Figure 3.1: Top view of the mashing rig ...................................................... 58
Figure 3.2: Flow rate and revolution rate vs. setting of the
frequency controller ..................................................................................... 59
Figure 3.3: Pressure measurement at the mashing flow-
loop .............................................................................................................. 60

Figure 3.4: Orifice plate with pressure tappings at a
distance of 0.5 x d and 1 x d from the plate. Discs with a
222
diameter do of 0.5,0.6,0.7,0.8, 0.9 x d were available .............................. 60
Figure 3.5: Mashing-in unit .......................................................................... 61
Figure 3.6: Calibration curve for the premasher timed water
dosage ......................................................................................................... 62
Figure 3.7: Lauter Tun Setup ....................................................................... 63
Figure 3.8: Bottom plate for the lauter tun ................................................... 64
Picture 3.2: Pilot lauter column with peristaltic pump, control
equipment and turbidimeter ......................................................................... 65
Figure 3.9: Calibration procedure for the lauter tun pump
control unit ................................................................................................... 66
Figure 3.10: Calibration curve for the setting 4.0 ......................................... 67
Figure 3.11: Example for a torque vs. time plot ........................................... 69
Figure 3.12: Bench scale experimental setup: Mash beaker
and stirrer ..................................................................................................... 70
Figure 3.13: Shear rates in bench scale experiments
calculated using the above assumptions ..................................................... 72
Figure 3.14: Bench scale mash filterability test 1 Pressure
Vessel supplying constant pressure of 100 mbar2 Millipore
Filter3 Digital Balance4 PrinterS Digital Stop Watch .................................... 74
Figure 3.15: dUdV versus V plot of reproducibility trials ............................... 76
Figure 3.16: Schematic of the laboratory roller mill ...................................... 78
Picture 3.3: Rollers of the mill ...................................................................... 78
Figure 3.17: Temperature programme for mashing ..................................... 79
Figure 3.18: Lautering graph for a standard run .......................................... 82
Figure 3.19: Falling ball viscometer ............................................................. 83

223
PiGture 3.4: Laser Sizer sample cell with laser diodes and
PIOS assembly ............................................................................................ 89
Figure 4.1: Sieve analysis for well modified malt ......................................... 96
Figure 4.2: Sieve analysis for malt grist milled with 0.75 mm
gap setting ................................................................................................... 97
Figure 4.3: Particle size distribution, grist in water sieved at
71 OlJm .......................................................................................................... 98
Figure 4.4: Sieve analysis for undermodified malt ....................................... 98
Figure 4.5: Particle size distribution of fine malt particles
after a dry sieve step at 150lJm. The legend gives the gap
sizes of the different mills ............................................................................. 99
Figure 4.6: Ory solids after mashing (average of 12 trials
with error bars ±1 SO) in three size classes ................................................. 100
Figure 4.7: Trial 66 PSO of the fine fraction (below 106 IJm
sieve) analysed with both Multisizer and Laser Sizer .................................. 102
Figure 4.8: Trial 66 at 80 and 95°C on both Multisizer and
Laser Sizer ................................................................................................... 102
Picture 4.1: Vertical cut of a spent grains filter cake .................................... 104
Figure 4.9: Particle size distributions in four different layers
of the spent grains cake ............................................................................... 1 05
Figure 4.10: Wet sieve analysis of spent grains cake bottom
layer. (5 analyses with error bars ±1 SO) ..................................................... 106
Figure 4.11: Change of particle size distribution of the sub
106 IJm sieved fraction of mash during mashing .......... : .......... " .......... """ ... 109
Figure 4.12: Particle breakdown in the 100IJm range with
enzymes ........................................................... : ........................................... 110
Figure 4.13: Viscosity in wort .... " ...... " .... """ ........ " .............. " .. "" ...... "" ..... 112

224
Figure 4.14: Viscosity related to temperature in water, sugar
solution and wort samples ........................................................................... 113
Figure 4.15: Variation of specific power input for different
brewhouses (Brewhouse A could not be displayed because
of the use of a decoction mashing procedure) ............................................. 115
Figure 4.16: Average specific power input in different
brewhouses .................................................................................................. 115
Figure 4.17: Specific work input over the entire mashing
time .............................................................................................................. 116
Picture 4.2: Flow loop at the mash vessel. ................................................... 118
Figure 4.18: Specific power input at the single seat valve ........................... 119
Figure 4.19: Extract and viscosity change with specific
power input in the liquid phase of mash samples ........................................ 120
Figure 4.20: Sieve analysis of mash ............................................................ 120
Figure 4.21: Change of MPS with increasing agitation ................................ 121
Figure 4.22: Change of extract content in wort with agitation ...................... 122
Figure 4.23: Turbidity increase with agitation ............................................... 123
Figure 4.24: Dry solids in wort with regards to specific
power input .................................................................................................. 123
Figure 4.25: Effect of agitation on lautering time .......................................... 124
Figure 4.26: Extract ratio (Extract in the mash I Extract in
the wort) ....................................................................................................... 125
Figure 4.27: Specific power loss at the vena contracta of
the orifices .................................................................................................... 127
Figure 4.28: Effect of different stirrer velocities (as tip
speed, vtip) on torque and power input in mash (420 ml
mash, concentration: 3.5 : 1) ....................................................................... 133
Figure 4.29: Effect of agitation on MPS ....................................................... 134

225
Figure 4.30: Effect of agitation on particle concentrations
below 1 06I.1m .................. : ............................................................................. 135
Figure 4.31: Effect of agitation on density in mash ...................................... 136
Figure 4.32: Density - viscosity correlation for small scale
agitation trials ............................................................................................... 136
Figure 4.33: Effects from agitation on viscosity ............................................ 137
Figure 4.34: Filterability of mash in relation to agitation ............................... 138
Figure 4.35: Effect of agitation on specific cake resistance ......................... 139
Figure 4.36: Correlation between MPS and filterability ................................ 139
Figure 4.37: Effects from MPS on totallautering time .................................. 142
Figure 4.38: Effect from mash temperature on MPS
(number distribution) .................................................................................... 144
Figure 4.39: PSD of mash (Volume distribution), Trial 66,
analysed on the Multisizer. .......................................................................... 145
Figure 4.40: Volumetric particle concentration of fines in the
analysis suspension ..................................................................................... 146
Figure 4.41: Dry solids concentration of fines «106I.1m
sieve step) in mash .......................................... " ................ " ........................ 147
Figure 4.42: Change of viscosity with temperature ...................................... 148
Figure 4A3: Viscosity at 65°C in the liquid phase of mash;
(samples taken at different mash temperatures) .......................................... 148
Table 4.7: Slopes for linear fits of density and extract vs.
mash temperature ........................................................................................ 149
Figure 4.44: Density (Extract) in the liquid phase of mash ........................... 150
Figure 4.45: Trial 67, dUdV vs. V plot with linear fits for data
points in accordance with cake filtration law ................................................ 151

Figure 4.46: Filterability measured in a Millipore filter cell
for different mashing temperatures (* and ** maximum
226
volume filtered per filter area before blockage occurred) ............................. 152
Table 4.8: Filterability increase between 65 and 78°C ................................. 152
Figure 4.47: Specific resistance of filter cakes with mashing
temperature .................................................................................................. 153
Figure 4.48: Specific cake resistance vs. MPS ............................................ 155
Figure 4.49: Effect of MPS on permeability of the spent
grains cake (R = 0.88) .................................................................................. 158
Figure 4.50: Effect of MPS on washing efficiency (R = 0.79) ....................... 159
Figure 4.51: Effect of MPS on turbidity in the filtrate (R = 0.83) ............................................................................................................. 159
Figure 5.1: MPS-temperature relationship ................................................... 162
Figure 5.2: Relationship between viscosities at 20°C and
70°C ............................................................................................................. 163
Figure 5.3: Viscosity-temperature relationship, with fitting
function covering the range from 65 to 95°C ............................................... 164
Figure 5.4: Sedimentation rate vs. MPS2. Linear
regression: with R = -0.93822 ...................................................................... 166
Figure 5.5: Measured data compared with calculated data
using the following equation for 0.42 m < HO < 0.53 m ................................ 167
Figure 5.6: Final permeability vs. MPS2 ...................................................... 168
Figure 5.7: Bench scale permeability for trials with agitation
and temperature variation. Pressure was constant at 100
mbar. Correlation coefficient R = 0.97 ......................................................... 169
Figure 5.8: Height of the cake before and after filtration .............................. 170
Figure 5.9: Effect of pressure on cake height .............................................. 171

227
Figure 5.10: Height of the bed vs. filtrate volume, trial data
with fitted exponential decay ........................................................................ 172
Figure 5.11: Decay constant, t vs. Lmin (R = 0.80) ...................................... 173
Figure 5.12: Permeability - height of the cake, after Lmin
=constant ..................................................................................................... 174
Figure 5.13: Permeability change as a function of cake height ........................................................................................................... 175
Figure 5.14: Washing curves of data and fitting functions
with ............................................................................................................... 177
Figure 5.15: Sigmoidal fitting curves on trials data ...................................... 178
Table 5.1: Parameters for the fitting curves of the above
examples ...................................................................................................... 179
Figure 5.16: Washing efficiency as a function of MPS ................................. 180
Figure 5.17: Width of the Sigmoidal fitting curve versus MPS
with linear correlation and upper and lower limits (2xSD) ............................ 181
Figure 5.18: Initial calculations to determine MPS and
viscosity at lautering temperature, initial and final cake
height ........................................................................................................... 183
Figure 5.19: Main part of the lautering model .............................................. 184
Figure 5.20: Trial 57 real (data points) and calculated data
(lines) ........................................................................................................... 191
Figure 5.21: Trial 30 real (data points) and calculated data
(lines) ........................................................................................................... 191
Figure 5.22: Trial 54 real (data points) and calculated data
(lines) ........................................................................................................... 192
Figure 5.23: Trial 79 real (data points) and calculated data
(lines) ........................................................................................................... 192

228
Figure 5.24: Predicted lautering time (dotted line) and
measured data (triangles) ............................................................................ 193
Figure 5.25: Trial carried out by Robin Thorn real (data
points) and predicted data (lines) ................................................................. 194

229
7.S. Pictures and Electron Micrographs
Filter cakes from two different cakes were analysed using scanning
electron microscopy. The samples were stored frozen at -20°C. The
analysis was carried out after deep freezing at -185°C. Prior to this the
samples were freeze etched at -60°C for a few seconds. Three different
layers were observed. Figure 1 shows a vertical cut through the cake with
different layers, Figure 2 is an enlarged part of the top section. The
different particle structures are clearly visible
Top
Middle
Bottom
Fig. 1: Vertical cut through a cake
Fig. 2 Enlarged area of the top section

Fig 3: Micrograph from top section (Trial 9, 2210s-1): general view showing husk and starch granules. Starch granules were very abundant together with parts of the husk and endosperm.
Fig 4: Starch granules in a glucan and starch matrix.

Fig. 5: Shows a holed structure in the glucan/starch matrix
Fig. 6: Large areas of husk evident.

Fig. 7: Area beneath the top layer: general view showing intact or broken grains.
Fig. 8: Husk surface and protein/glucan/starch matrix.

Fig 9: Large piece of fenestrated glucan/starch sheet
Fig 10: Starch and glucan matrix

Fig 11: Middle section: general view
Fig 12: Part of a grain that had lost nearly all the starch but had retained a protein/glucan matrix

Fig 13: A starchy area
Fig 14: Trial 10, (>5000 5-1) top layer: general view

Fig 15: Husk with aleurone, starch and glucan (fenestrated).
Fig 16: Large glucan sheets over starch

Fig 17: Middle layer: general view. This layer contained a lot of starch and glucan
Fig 18: Large glucan sheet

Fig 19: Detail of glucan matrix
Fig 20: Bottom layer. This layer was the same as the middle layer The preparations were, however, freeze etched longer to reveal the intricate cross-linking of the glucan/protein matrix.

Fig 21: Freeze etched sample .'r--_...,.,.,""-~-~-,

Fig. 23: Sample Trial 58 (Temperature Trials), 5SoC - irregular shaped particle
~~~~~
Fig. 24: Sample Trial 58, 5SoC - angular particle

Fig. 2S: Sample Trial 68, 6SoC - angular particle
Fig. 26: Sample Trial 68, 6SoC - smooth film

Fig. 27: Sample Trial 68, 75°C - smooth film
Fig. 28: Sample Trial 68, 75°C - larger smooth area

Fig. 29: Sample Trial 68, 80'C - smooth area
Fig. 30: Sample Trial 68, 80'C - a network of film-covered areas

Fig. 31: Sample Trial 68, 9S·C - film area with stronger three dimensional structure
Fig. 32: Sample Trial 68, 9S·C - 3-D structured film

Fig. 33: Sample Trial 68, 9SoC - a large three dimensional matrix

7.S. Publications
This section contains the following three publications:
1. Biihler, T.M., Matzner, G., Mckechnie, M.T., Agitation in mashing,
EBC Proceedings of the 25th Congress, Brussels, Oxford University
Press, 1995,293 - 300.
2. Biihler, T.M., Mckechnie, M.T., Wakeman, R.J., A model describing
the lautering process, Monatsschrift fOr Brauwissenschaft, 7/8, 1996, 226 - 233.
3. Biihler, T.M., Mckechnie, M.T., Wakeman, R.J., Temperature induced
particle aggregation in mashing and its effects on filtration
performance, Trans. Inst. Chem., Eng. 74, (1996) 12, 207 - 211.

---------- ---- - - - -- ----
34
Agitation in mashing
T.M. Biihler, G. Matzner & M.T. McKechnie
BRF International, Lyttel Hall, Coopers Hill Road, Nutfield, Redhill, Surrey RHl 4HY, United Kingdom
Descriptors Lautering, mashing conditions, particle size distribution
SUMMARY The effects of different mashing parameters (including mechanical energy
input and "mashing-off" temperatures) on particle size distribution in mash and wort run-off have been investigated. The mean size of particles of mash, measured using novel laser particle sizing, is reduced with increasing shear levels. Raising of mashing off temperature markedly increases mean particle size. It was shown that this particle. aggregation and not reduction in viscosity is the most important contributor to improved run off rates with higher mashing off temperatures. Highly significant correlations between the resistance of spent grains cakes and the mean particle size were found.
AGITATION AU BRASSAGE
Descripteurs Conditions de brassage, distribution de dimension de particules, separation de la maische en cuve filtre
RESUME L'effet de differents parametres de brassage (incluant l'energie mecanique
et la temperature d'empatage) sur la distribution de la dimension des particules dans la maische et la vitesse de filtration a ete etudie. La dimension moyenne des particules de la maische mesuree grace a un nouvel appareil de mesure de la taille des particules par laser est reduite lorsque les forces de cisaillement augmentent. L'augmentation des temperatures d'empatage augmente nettement la taille des particules. 11 est demontre que ce sont ces agregats et pas la reduction de viscosite qui contribuent le plus efficacement a l'amelioration de la vitesse de filtration lors d'empatage a temperature elevee. On a demontre qu' il existait une correlation hautement significative entre la resistance du gateau de dreche et la dimension moyenne des particules.
293

--- ----~- --- ----
DIE QUANTIFIZIERUNG VON MAISCHPARAMETERN FUR EINE OPTIMIERTE ABLAUTERUNG
Deskriptoren Ablautern (Lauterbottich), Korngrosseverteilung, HaischefUhrung
ZUSAMMENFASSUNG Die Auswirkungen unterschiedlicher Maischparameter (z.B. Eintrag
mechanischer Energie, Abmaischtemperaturen) auf die PartikelgroBenverteilung in Maische und die Ablautergeschwindigkeit wurden untersucht. Die mittlere PartikelgroBe von Maische, gemessen mit einem neuartigen Laserbeugungsspektrometer, verringert sich mit zunehmender Scherbelastung. Die Anhebung der Abmaischtemperatur hingegen erhoht die mittlere PartikelgroBe. Es konnte gezeigt werden, daB diese Aggregation von Partikeln der wichtigste EinfluBfaktor fUr eine verbesserte Ablautergeschwindigkeit mit hoheren Abmaischtemperaturen ist und nicht eine etwaige Verringerung der Viskositat. Hoch signifikante Korrelationen zwischen dem spezifischen Widerstand der Treber und der mittleren PartikelgroBe wurden aufgestellt.
294

... _._ ...... _ .. - -. _ .. ".;' .. -----
Introduction
Fine particles in mashes can impair rates of wort separation and wort quality. Various mashing parameters influencing the concentration, shape and size of such fines have been investigated. The two key parameters are agitation and maximum temperature to which the mash is taken. Sufficient agitation of mash is crucial for heat and mass transfer, however stirring or pumping causes particle attrition: shearsensitive material is broken up into smaller particles [1). Temperatures above 65°C can aggregate fines. It will be demonstrated that the size distribution of particles within the fines correlates with mash filterability. This is the key parameter determining mash separation performance.
Materials and Methods
Mashing trials were carried out in a pilot scale brewhouse, using two different qualities of malt: a highly modified malt (Trial 1 and 3) and an undermodified malt (Trial 2). The mash was kept at 6SoC for 45 minutes before the temperature was increased. The heating rate was 0.3°C/minute in Trials 1 and 2 and 1°C/minute in Trial 3. Samples of mash were taken at temperature intervals of SoC.
In agitation trials the mash was heated to 75°C at 0.3°C/min and held at this temperature for 10 minutes before mashing off.
Filterability of mash was analysed in a Millipore filter cell (60 ml volume) using a constant pressure of 100 mbar at 65°C. Wort flow was recorded as volume of wort collected with respect to time. Lautering performance was assessed in an automated pilot scale lauter tun (see Figure 1). In addition, the following analyses were performed: 1. particle size distribution, using a Coulter Electronics Laser Sizer, LS 130,
(the sample was wet sieved through a 106 IJm pore sieve before analysis); 2. dry solids concentration of mash; 3. extract, determined as specific gravity measured with a Paar Densitometer; 4. viscosity, measured with an automatic capillary suction viscometer. .
Filtration Theory
The run off rate of wort (filtration rate) can be described using Equation 1 [2):
dV = A2
1lp =~~ (1) dt 11ac V K V
where dVldf is the run off rate per unit filter area, 11 is the viscosity, a the specific resistance of the spent grains cake, c is the concentration of solids in the mash, IIp is the differential pressure across the filter cake.
The specific resistance a accounts for the structure of the spent grains bed (i.e. size of channels in the cake, tortuosity of the flow path, voidage etc.). It is directly affected by the particle diameter and the distribution of particle sizes. 1/K is the filterability, which describes the run off performance combining all filtration parameters.
Alternatively the run off rate can be described by Darcy's Law [2):
295

o oe"9s eee seee
dV = BA !1p dt 11 L
(2)
where B is the permeability of the cake, L the height of the cake and A is the filter area.
CIP
Sparging .... -;=45ffl Liquor
Grist
)i-oool-- Water
Flow-rate
Turbidimeter
Wort
Figure 1: Pilot scale brewhouse comprising a mashing vessel designed for agitation trials
and an automated lauter tun (scale: 15 litres of mash).
Results and Discussion
Temperature Effects
Aggregation of particles occurs with increasing final mash temperatures. Figure 2
shows the change in the particle size distributions of the fines, represented by the
mean particle size (MPS) of the number distribution. The increase in MPS is caused
by aggregation of fine particles, which is most likely due to precipitation of
proteinaceous material in conjunction with polyphenols and other components
[3], [4].
296

11
10
E 2- 9 ., N Vi ., 8 (3
t: 7 '" c..
c:
'" 6 ., :::;:
5
4 65
• Trial 1 • Trial 2 .. Trial3
70 75 80 85 90 95 100
Maximum temperature in mash rC]
Figure 2: Particle size changes with increasing maximum temperature in mash.
Filterability of mash improves with increasing final mash temperatures (see Figure 3). Since filtration trials were carried out at constant temperature, the effect from viscosity could therefore be excluded. This demonstrates that particle aggregation is the predominant effect in improving run off rates with higher mashingoff temperatures. The optimum filterability is dependent on the extent of malt modification.
6.0x10·,3.-------------------,
~ 3.0x10·'3
.0
'" ~ 2.0x10·'3 u.
:
• Trial 1 • Trial 2 .. Trial 3
..
65 70 75 80 85 90 95 100
Maximum temperature in mash ["Cl
Figure 3: Filterability of mash, raised to different temperatures.
Figure 4 shows a very significant correlation between MPS and specific resistance. The change of specific cake resistance with respect to temperature over
297

the practical range of mashing-off temperatures, can be explained solely by MPS changes. Clearly, particle aggregation controls lautering performance.
5.0x10'2
Ci 4.0x10 '2
~ ~
CD 3.0x10 '2
u c !!l ..
2.0x10'2 Ui 65'C CD Cl: • u -= '0 1.0x10 '2 CD Co en
0.0 4 5
65'C
•
85'C
6 7 8
• Trial 1 • Trial 2 .. Trial 3
90'C
9 10
Mean Particle Size [~m]
11
Figure 4: Specific resistance of mash filter cakes as a function of mean particle size.
Agitation Trials
Figure 5 shows that mechanical power dissipated in a mash causes particle attrition. This is demonstrated by the reduction of the mean particle size of the fines fraction: shear-sensitive material is broken up. Both pilot plant and laboratory scale trials showed this effect. Bench scale trials over the power input range used commercially revealed that damage occurs even with gentle stirring. Attrition cannot be avoided in any practical mashing procedure.
Power Input [W/I] (Pilot Scale) 0
6.5 5 10 15 20 25 30
6.0
E 5.5 2.
o Pilot Scale .. Bench Scale
CD N 5.0 en CD
"13 4.5 .~
a. c 4.0 '"
o CD ::;
3.5 o
3.0 0.0 0.5 1.0 1.5 2.0 2.5 3.0
Power Input [Wn] (Bench Scale)
Figure 5: Particle attrition due to agitation (measured as specific mechanical power input in W/L).
298

iI,sLLLLiY SilO SI a 9
Power input was determined in the pilot scale by measuring flow rate Q, and differential pressure loss !Jp, in the flow loop (Equation 3). In order to give a range of power dissipation, the differential pressure alone was varied. The flow rate was kept constant to enable a constant mixing in the vessel with a quiescent liquid gas interface, thus avoiding variations in the extent of oxygen pick-up between experiments.
P = Q l!.p (3)
In laboratory scale trials a stirrer with torque meter was used to control the mechanical power input. Power input can be calculated using Equation 4.
P=Wf (4)
Where W is the angular velocity and r is the torque at the stirrer. It can be shown that MPS affects mash filtration performance both in the lauter
tun and in bench scale trials (see Figure 6). A reduction of the MPS (due to agitation) causes filterability to decrease. A reduction of the MPS by 2.93 IJm resulted in an increase of the lautering time in the pilot lauter tun of 40 minutes.
1.6x10·" .,--------------------,2.2><10··
1.4xlO·"
o Pilot Scale (Lauter Tun) • Bendl Scale (Millipore)
• •
o • • • o
• o
o
o
2.OxlO··
1.Bx10·· :¥
1.BxlO·· ~ ,l1
1.4x10·. e:. 12><10'. 'E . ID ,.,
1.Ox10·· g 16
8.Ox10·' ~ t;;
6.Ox10·' Q.
o E 00 QP. 0 4.Ox10·' ~
o 0 0 :~ o 8 0 2.Ox10·' ::;
'boo Q) 0.0 +-~r-,......,...:::.,._.~_,_~.,_~~,........,,__._.~__r~-I 0.0
3.0 3.5 4.0 4.5 5.0 5.5 6.0 6.5 7.0 7.5 8.0
Mean Particle Size [~ml
Figure 6: Filtration performance in the lauter tun and in bench scale in relation to mean particle size.
Conclusions and Practical Implications
Fine particles in a mash are aggregated by heat, which is beneficial for lautering. Particle size increase with higher mashing temperatures is the most important factor in the improvement of run off rates. This effect is permanent unlike changes of viscosity with temperature: this means that the peak temperature in the mash has a direct influence on lautering performance. Particle attrition caused by agitation can be minimised, but some particle attrition cannot be avoided in industrial scale application.
299

Particle attrition in the brewhouse can now be quantified, enabling measures to reduce it to be developed.
Reduction in filterability caused by particle attrition can be partially rectified by applying higher mash temperatures.
Nomenclature
A: filter area [m2]
B: permeability of the spent grains cake [m2]
c: concentration of solids in the mash [kg/m3]
dV: differential volume of filtered wort [m3]
dt differential time [s]
L: height of the cake [m]
P: mechanical power dissipated in mash [WJ Q: flow rate [m3/s]
V: volume of filtrate (wort) [m3] a: specific resistance of the spent grains cake [m/kg]
Llp: differential pressure [Pal
1f dynamic viscosity [Pa s]
-r: torque [Nm]
m: angular velocity [S-1]
Acknowledgement
The Authors wish to thank the Director General of BRFI for the permission to publish
this paper.
References
[1] Leedham, P.A., Savage, D.J., Crabb, D., Morgan, G.T., Materials and
methods of wort production that influence beer filtration, Proc. Eur. Brew. Conv.,
Congo Nice, 1975,201 - 216.
(2) Hermia, J., Eyben, D., Considerations sur les procede de filtration en
brasserie, Proc. Eur. Brew. Conv., Congo London, 1983,209 - 224.
[3] Lewis, M.J., Oh, S.S., Influence of precipitation of malt proteins in lautering,
MBAA Technical Quarterly, 1985, 108 - 111.
(4) Lewis, M.J., Serbia, J.W., Aggregation of protein and precipitation by
polyphenol in mashing, J. Am. Soc. Brew. Chem., 1984,40 - 43.
300

SONDERDRUCK REPRINT
TIRE A PART

225 Heft 7/8, 1996
BC 033 Flow injection analysis/20t rubbers,glucanes/214dissolving features
This article describes the most common methods for the detennination of the cytolytic dissolving of brewing malts in current usage. On the basis of mailing tests and the study of trade malts. the authors assess the infonnation provided from the friabilimeter and calcofluoride method and the delenninalion of bel a glucanes in the congress wort using flow injection. The benefits and drawbacks of the various methods are compared.
Wackerbauer, K., Hardl, R., et Hirse, U.: Evaluation des proprietes de desagregation des malts au moyen du Friabilimetre, methode FIA indirecte au Calcofluor - Monalsschrift fOr Brauwissenschaft 49, No 7/8,220-225,1996
BC 033 Analyse par injection de flux/ 201 gommes, glucanesl 214 propriefes de desagregation
Oans le present travail on decrit les methodes actuelles les plus utiIisees pour la determination de la dcsagregation cytolitiques du malt. A partir d'essais de maltage ainsi que de revaluation de malts industriels, on a determine la valeur d'expression de la methode au Friabilimetre et du Calcofluor ainsi que du dosage des octa-glucanes solubles du mout du bmssin conventionncl par analyse par injection de flux. Les avantages et les inconvenients des differentes methodes sont confrontes.
6 Literatur
I. McCleary. B. v., und Glennie-Holmes, M.: "Enzymic Quantification of 1 ,3-1.4-~-0-Glucan in Barley and Malt", l. Inst Brew., 91, 285 - 295, 1985,
2. McCleary, B. V., und Nurthen, E.: "Measurement of 1 ,3-1,4-(-0-Glucan in Mult, Wortund Beer",l.lnst. Brew., 92.168-173, 1986.
3. Wood, P. l., und Fulcher, R. G.: "Interaction of some Dyes with Cereal p-Glucans", Cereal Chem" 55, 952 - 966,1978,
Monatsschrift fur Brauwissenschaft
4. Aastrup, S., Gibbson, G. C, und Munck, L.: "A Rapid Method for Estimating the Degree of Modification in Barley Malt by Measurement of Cell Wall Breakdown", Carlsberg Res. Commun., 46, 77 -86,1981,
5. Wackerbauer, K., Camielo, M., und Hardt, R.: "Video/lmage Analysis System for the Culcofluor Mult Modification Method'·, Proceedings of the 24th Congress of the European Brewery Convention, 479 - 486, Oslo 1993.
6. Carnielo, M., Foucaut, M.-A.. und Moll, M.: "Application ofa Test for Modificution in Green and Kilned Malts". Brauwiss., 35, 168-170, 1982,
7. Aastrup, S.: "A Review of Quick, Reliable und Simple Check Methods for Barley and Malt Based on the Carlsberg Seed Fixation System", ASBC Journal, 46, 37 -43, 1988,
8. Aastrup, S., und lorgensen, K. G.: "Application of the Calcofluor Flow Injection Analysis Method for Determination of ~-Glucun in Barley, Malt, Wort and Beer", ASBC Journal, 46, 76 - 81, 1988,
9. Baxler, E. D .. und Q'Farrell, D. D.: "Use of the Friabilimeter 10 Assess Homogeneity of Malt", 1. Inst. Brew., 89, 210- 214, 1983.
10. Giarratano, C. E., und Thomas, D. A.: " Rapid Malt Modification Analyses in a Production Malt House: Friabilimeter and Calcofluor Methodologies", ASBC Journal, 44, 95 - 97, 1986,
11. Jorgensen, K. G., und Aastrup, S.: "Analysisof~-Glucan in Wort", EBC Monograph XI, Symposium on Wort Production, 262 - 271, Maffliers, France 1986.
12. lorgensen, K. G., lensen, S. A., Hartlev, P., und Munck, L.: "The Analysis of ~-Glucan in Wort and Beer Using Calcofluor", Proceedings of the 20th Congress of the European Brewery Convention, 403 - 410, Helsinki 1985"
13. Wackerbauer, K., Anger, H.-M., und Kolsch, l.: "Zur Aussagekraft des Friabilimeter", Brauwelt, 125, 1758 - 1763, 1985.
14. Burbidge, M.: "Homogenitiit und Malzanalyse", Monatsschr. f. Brauwiss., 37, 4 - 9.1984.
15. Greif, P.: "Friabilimeterwerte nur abhungig von der Spelzenstarke?", Tagesz. f. Brauerei, 77, 66. 1980.
16. Sarx, H. G., und Rath, F.: "Filtration Risk·Analysis. New Method for Predicting Problems in Wort and Beer Filtration", Proceedings of the 25th Congress of the European Brewery Convention, 615 -620, Brussels 1995,
EUROPEAN BREWERY CONVENTION
EUROPEAN BREWERY CONVENTION MONOGRAPH XXIV
MONOGRAPH XXIV
E,B,C. - SYMPOSIUM
IMMOBILIZED YEAST APPLICATIONS
IN THE BREWING INDUSTRY
ESPOO ' FINLAND
OCTOBER 1995
Fachbuchhandlung Hans Carl Postfach 99 01 53 90268 NOrnberg Fax (0911) 9 52 85-47
E.B.C. - Symposium - Immobilized Yeast Applications in the Brewing Industry Espoo' Finland I October 1995 XIV/260 Seiten, zahlreiche Abb, u, Tabellen OM 88,Best-Nr, 749 (In englischer Sprache) zuzuglich Versandkosten
FAX-BESTELLUNG: 0911 /95285-47
Name Kunden-Nr.
Firma USL-Id,-Nr,
Stra Be PLZ/Orl
Datum Ste m pel/U nte rsch rift

Monatsschrift fur Brauwissenschaft Hett 7/8,1996 226
T. M. BOhler, M. T. McKechnie and R. J. Wakeman
A model describing the lautering process
This article describes modelling of the wort separation procedure in a lauter tun. It has been shown that viscosity and particle size distribution in the fines are the main parameters determining lautering performance when other raw material conditions are constant. MPS and viscosity can be varied with conditions such as temperature of the mash or agitation. The background of how these two parameters influence the sedimentation, filtration performance and washing efficiency of the cake has been described. A computer model has been established which enables prediction of the main process parameters: wort run off rate, wort extract and height of the spent grains cake. It has been shown that the model predicts existing data with good accuracy.
BC 202 Viscosity/222 Mashing intensity/223 Lautering procedure/ 223 Wort run-off/ 30 Modelling, models
(Descriptors EBC: Wort, wort production, lautering, mash filtration, mash separation conditions.
Deskriptoren EBC: WUrze. WUrzeherstellung. Ablliutern. Maischefiltration, Wiirzetrebertrennungsparameter.)
1 Introduction
The lautering process is substantially influenced by raw materials and processing conditions. In this paper physical influences on lautering performance are described. A computer model of lautering has been established which is based on the results of pilot scale trials. The parameters influencing lautering perfonnance were characterised and used as input variables.
In the literature mainly viscosity is reported as a key detenninant oflautering rates (1,2). Our previous report, however, (3) illustrates that particle size distribution within the fine fraction is a very important parameter determining lautering perfonnance. Changes in mashing conditions, such as agitation rate and temperature can greatly affect this parameter.
The model described in this paper is based on both viscosity and particle size distribution in the fines. Other parameters such as malt quality ormilling regimes have not yet been incorporated into the model, but their influence on lautering is likely to be via effects of viscosity and particle size.
Authors: T.M. BUhler and M.T. McKechnie. BRF International, Lyttel Hall. Nutfield, Surrey. UK; R.J. Wakeman, Department of Chemical Engineering, Loughborough University ofTechnology, Leicestershire, UK
2 Experimental
Trials were performed over a 10 - 50 litre range of pilot scale mashing and lautering. Different mean particle size (MPS) levels in the fines were created by means of agitation with a Mono pump and by heating of the mash. The lautering performance was analysed in a pilot scale jacketed glass column (see Fig. I). The differential pressure measured across the cake controlled the speed of a peristaltic pump. The setting of the pump flow controller followed equation:
dV . dr 1 = 1.65 x 10.6 - 5.32 X 10.10 L'>p - 4.66 x 10'" 8p' (I)
The lauter tun is filled from the bottom. After this the mash is allowed to settle for 10 minutes. Then wort was run off by the peristaltic pump until a total constant volume of II litres was collected. The removed wort was replaced by hot water, added on top of the liquid level. The design of the plant guaranteed the level to be constant.
Lautering performance was determined measuring fi Itrate volume over time, height of the cake, extract in the wort and the pressure across the cake. In addition, the turbidity of the mash was analysed in-line.
The particle size distribution in the fine fraction of the mash was measured using a Coulter Counter LS 130 Laser sizer with a sieve step at 106 ~m. The viscosity in the liquid fraction of the mash was measured using a falling ball viscometer after filtration through a pleated filter paper. Extract in the wart was measured externally by refraction or hydrometer.
3 Basic relationships between input variables and parameters of the filter cake
3.1 Particle size changes
The mean particle size (MPS) of the fine fraction of mash grows with increasing temperature. Different malts may vary in their MPS level, however, the proportional Change in MPS with temperature is similar fordifferent malts. This basic correlation is shown in Figure 2. Different heating rates do not appear to influence this relationship. Trials I and 3 were carried out with the same malt, but
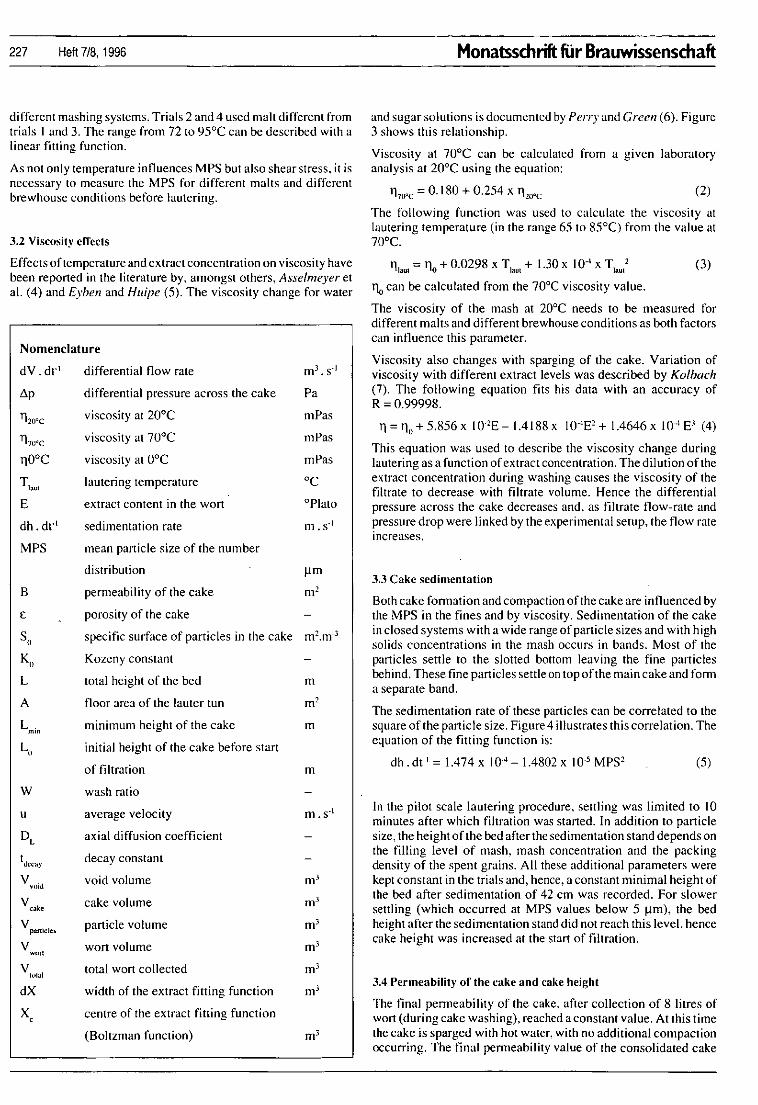
227 Hett 7/8, 1996
different mashing systems. Trials 2 and4 used malt different from trials I and 3. The range from 72 to 95'C can be described with a linear fitting function.
As not only temperature innuences MPS but also shear stress, it is necessary to measure the MPS for different malts and different brewhouse conditions before lautering.
3.2 Viscosity effects
Monatsschrift fur Brauwissenschaft
and sugar solutions is documented by Perry and Green (6). Figure 3 shows this relationship.
Viscosity at 70°C can be calculated from a given laboratory analysis at 200 e using the equation:
11 70'c = 0.180 + 0.254 x 11200c (2)
The following function was used to calculate the viscosity at lautering temperature (in the range 65 to 85'C) from the value at 70'C.
Effects oftemperature and extract concentration on viscosity have lllaul == 110 + 0.0298 X T1aul
+ 1.30 X 10⁻⁴ X Tlaut2 (3) been reported in the literature by. amongst others, Asselmeyer et al. (4) and Eyhen and Huipe (5). The viscosity change for water 110 can be calculated from the 70'C viscosity value.
Nomenclature
dV.dr' differential now rate
~p differential pressure across the cake
11 200 c viscosity at 200 e 11 7o'c viscosity at 700 e 110'C viscosity at ooe T
lau1 lautering temperature
E extract content in the wort
dh. dr' sedimentation rate
MPS mean particle size of the number
distribution
B penneability of the cake
£ porosity of the cake
So specific surface of particles in the cake
Ko Kozeny constant
L total height of the bed
A noor area of the lauter tun
Lmill minimum height of the cake
Lo initial height of the cake before start
of filtration
W wash ratio
u average velocity
DL axial diffusion coefficient
t decay decay constant
V ~()id
void volume
Vcake
cake volume
V panicle. particle volume
V .. "ort
wort volume
V rural
total wort collected
dX width of the extract fitting function
X centre of the extract fitting function , (Boltzman function)
m3 • S·l
Pa
mPas
mPas
mPas
°C
°Plato
m.s· l
!Im
m'
m2.m·3
m
m'
m
m
m.s· l
m'
rn'
m'
m'
rn'
m'
m'
The viscosity of the mash at 20°C needs to be measured for different malts and different brewhouse conditions as both factors can influence this parameter.
Viscosity also changes with sparging of the cake. Variation of viscosity with different extract levels was described by Kolhach (7). The following equation fits his data with an accuracy of R = 0.99998.
11=11,,+5.856x IO·'E-1.4188x 10"E'+ 1.4646 x IO-'E' (4)
This equation was used to describe the viscosity change during iautering as a function of extract concentration. The dilution of the extract concentration during washing causes the viscosity of the filtrate to decrease with filtrate volume. Hence the differential pressure across the cake decreases and, as filtrate flow-rate and pressure drop were linked by the experimental setup, the flow rate increases.
3.3 Cake sedimentation
Both cake fonnation and compaction of the cake are influenced by the MPS in the fines and by viscosity. Sedimentation of the cake in closed systems with a wide range of particle sizes and with high solids concentrations in the mash occurs in bands. Most of the particles settle to the slotted bottom leaving the fine particles behind. These fine particles settle on top of the main cake and fonn a separate band.
The sedimentation rate of these particles can be correlated to the square of the particle size. Figure4 illustrates this correlation. The equation of the fitting function is:
dh.dr'= 1.474 x IO·'-1.4802x JO"MPS' (5)
In the pilot scale lautering procedure, settling was limited to IQ minutes after which filtration was started. In addition to particle size. the height of the bed after the sedimentation stand depends on the filling level of mash, mash concentration and the packing density of the spent grains. All these additional parameters were kept constant in the trials and, hence, a constant minimal height of the bed after sedimentation of 42 cm was recorded. For slower settling (which occurred at MPS values below 5 !Im), the bed height after the sedimentation stand did not reach this level. hence cake height was increased at the start of filtration.
3.4 Permeability of the cake and cake height
The final penneability of the cake, after collection of 8 litres of wort (during cake washing), reached a constant value. At this time the cake is sparged with hot water. with no additional compact ion occurring. The final penneability value of the consolidated cake

Monatsschrift fur Brauwissenschaft
Hot Water Tank
T
~----------------- ----, ,
PlC
Mash
Wort Collector Tank
Fig. I Lauter tun setup with a floor area of the column or 0.0123 m'
also depends on the square of the MPS. The correlation is shown in Figure 5: the fitted line shows a distinct off-set on the x-axis from the origin. This is due to the characteristics of the laser sizer and the model used to calculate the size distribution. In the number distributions presented here, the limit of the MPS value was reached at approximately 3.6Ilm.
The cake height in the lauter tun is influenced by the differential pressure across the cake and the change of penneability with different particle size distributions in the fines. Small particles exert a higher resistance to flow, thus creating higher pressure drops leading, due to the compressibility of the cake, to greater compact ion of the bed. Consequently, the lower part of the bed also compacts and overall permeability decreases again.
The effects of compact ion and reduced porosity on penneability, B, of the cake can be described using the Kozeny equation (8):
2 B= E Ko
SI,(I-E)' (6)
11 0 Trial 1 0
0 0 Trial 2 10 ~ Trial 3 V
0 V Trial 4 v
9 - Fitting Function 0 0 e ~
E a QV e '" "' "- 7 V B " 0
• 6 ~
0 0
5 0
B ~ ~ ~
4 55 60 65 70 75 60 85 90 95 100 105 110
Maximum mash temperature [oCJ
Fig.2 ChangeofMPS with maximum mashing temperature
Heft 7/8, 1996 228
Since the total volume of solids is constant over filtration time. the porosity E should solely be a function of cake height L.
B = I' (_E3_) = f(L3 xL') = f(L') (I_E)'
(7)
This relationship was used to describe the change of porosity with height of the bed (Fig. 6). For the compacted cakes where porosity is lower (0.20 < E < 0.55) than the initial porosities (E"" = 0.68), a good correlation with experimental data was found. Initial permeabilities cannot be described by the model, mainly because liquid drains from the lower layers of the cake during compaction. This liquid does not flow through the entire length of flow channels in the cake and therefore causes a lower pressure drop.
The final permeability of the consolidated cake at sparging is also linked to the minimal cake height. The correlation, shown in Figure 7 was fitted with the following equation:
(8)
In Darcy's law, flow of liquid through a bed of particles is described as a function of penneability, the height of the bed and pressure drop across the cake. If viscosity is included, Oarcy's law can be written as follows:
(9)
With this equation, the above correlations and the fixed relationship between pressure across the cake and flow rate, it is possible to calculate the cake height, L . ,which will devclop atthe end of filtration during cake washing. C' will be affected by MPS, viscosity and the flow-rate pressure dr~p relationship. The height of the bed at sparging will represent an equilibrium between these parameters.
3.5 Cake compaction
The lauter tun cake compacts as wort is run off from the lauter tun. This compact ion is influenced by two main factors. Firstly, wort drains from the different sections of the cake, secondly, the cake exerts a resistance to flow through the bed. As the top laycr has the highest resistance, the bed is compressed and the overall resistance increases further.
4.0
35 -0- Trial Malt 1 --0-- Water (Perry and Green) [6]
3.0 V -A-- Sucrose (20 %) (Peny and Green) [6J
-v- Wert 1 (Asselmeyer et al.) [41 .. -0-- Wert 2 (Asselmeyer et al.) [41 ~ 2.5
~Q 1, ~ 2.0
'" .• 1.5 0
~ ~ :> 1.0
"----0 "---.::: ~ 0.5
~--o - 0
~-o-o
0.0 10 20 30 40 50 60 70 80 90
T lout lOG]
Fig. 3 Change of viscosity with temperature

229 Heft 7/8, 1996
0.0 •
.. • •
•
Fig. 4 Sedimentation rates in the lauter tun versus MPS'
These effects influence cake height and penneability simultaneously and are combined in the model. The change of the cake height-difference (between the height at each volume of filtrate and the final height at cake washing) with volume offiltratecan be described using a first order exponential decay function. The function is shown in the following equation:
I( )--CL) L = Lo + \ Lo - Lmin x CI,!ccay • (10)
t has been described as a function of L mm
t = 0.00247 - 0.0031 0 X Lm
;" - 0.00246 X Lm
;" (11)
3.6 Sparging - cake washing
Extract concentration in the lautered wort is dependent on mash concentration and the efficiency of filter cake washing. The lauter tun cake is washed by displacement washing (9): sparge liquor displaces residual wart as it flows through the pores. In displacement washing there are di fferent modes of operation apparent (10). Initially the wort entrained in the pores is directly displaced by the sparge liquor. (n the following stages extract is transferred from the pores of the cake and the malt grains into the hot water by different transfer processes.
Cake washing in lautering of hammer milled grist was described by Hermia and Railier (9) with the so called dispersion model. For washing of spent grains with pure water, and because there are no sorption effects of the cake. the model was simplified to the following equation:
cCo =~I +erf(~~)~j ( 12)
The suitability of this model has been tested using experimental data. For the comparison of these trials with the model. the total void volume of the cake was. calculated to be 1.5 X 10·' m' for 9.5 x 10.3 m3 of mash. It can be anticipated that milling. concentration of the malt and even the malt quality influence the volume of the
Monatsschrift fur Brauwissenschaft
2.0x10⁻¹⁰
~ 1.5xlO-1O • .~ • B • • 1.0xlO-'O E • • Q
" C • • ~ 5.0xl0·"
• • • 0.0
0 " 20 30 40 50 60
MPS2[lJm2]
Fig. 5 Final permeability \'S. MPS2
solids in the cake. The void volume of the cake at sparging can be determined as:
V.=V -V vmd L·ake partide'
( 13)
The void volume of the spent grains cake can be calculated using the individual height of the cake after consolidation and the filtration area of the cake. With these figures it is now possible to determine the volumes of wash liquor used per void volume of the cake. W.
Washing of the cake starts when all supernatant wort is drawn into the cake. The total volume of wort to be filtered before washing occurs is calculated using the equation:
V wort = V101al - [( Hu -Lmin) x Anher] ( 14)
The extract content per volume of filtrate was normalised by the maximum extract content in the filtrate. Figure 8 shows the result of this fitting process. It can be seen that the axial dispersion
5xlO-10
, _________________ ---,
o Trial 1
o Trial2 ~ Trial3 v Trial4 o Trial5
.< ... .
--'~~r ... ·· 0.001 0.002 0.003 0.004
(Bed height. L ~ Im1
0.005
Fig. 6 Change of permeability with bed height, L 5
0.006

Monatsschrift fur Brauwissenschaft
2.5xl0·10,-------------------,
• 0.20 0.25 0.30
Lm1n[m]
•
• •
•
0_35 0.40
Fig. 7 Final permeability versus final bed height
model, with the assumptions mentioned above, describes the washing of the spent grains quite well.
In addition, it could be shown that extraction of the cake is also affected by the MPS of the fines (see Fig. 9).
There are two reasons for this effect:
o a bigger particle size in the fines could increase permeability of the cake. The tortuosity of channels in the bed would be increased, because less pores would be blocked. This effect reduces the axial dispersion coefficient, D
L, resulting in a
better washing efficiency; D another important effect which influences washing efficiency
is the height of the consolidated bed. As described earlier, it is affected by the MPS of the fines. A higher bed level increases the last term in equation 12, with washing efficiency increasing.
These effects on extraction efficiency of the filter bed were incorporated into the mathematical model. To describe the extract
0.8
1jO 0.6
o '§
04
~ w
0.2
0.0
o Trial 1 1::. Trial2
'Q' Trial3 <> Trial4
0.0 0.2 0.4 0.6 0.8 1.0 1.2 1.4 1.6 1.8 2.0
Void volumes of wash [-)
Fig.8 Washing curves of data and. fitting functions
Hett7/8,1996 230
data over the filtrate volume directly, the following sigmoidal function was used.
E= Em<lx-E +Eo (15) I + exp V - Xc
dX
In the model dX was varied as a function of MPS to describe the change in the slope of the extract curve over volume of filtrate. The centre of the curve was set constant at dX = 0.78 X VIola! .
4 Computer model
In large scale lautering, run off rates are varied with differential pressure. This condition was also used in the experiments reported here. Because pressure and flow rate are variable, the required time to collect a pre-set volume ofwort (here VIOla! = 11 litres) was calculated by iteration. This makes the model very flexible for upscaling to industrial equipment. The flowcharts in Figure 10 and 11) show the individual parts of the computer algorithm.
The initial calculations detennine MPS and viscosity at lautering temperature. The next step ofthe programme calculates the height of the filter cake after sedimentation, before filtration starts. The initial height of the cake is affected by the sedimentation rate and reflects the size of the particles. Higher initial levels are related to smaller particle sizes. As smaller particles have lower penneability this also affects run off.
In the following calculation the final height of the bed after washing is detennined. It was found in the experiments that the final height of the cake for the trials depends only on the change of the permeability of the cake. The penneability of the cake is dominated by the penneability of the fines. The most influential factor was MPS.
The main part of the algorithm is shown in Figure 11. This part calculates the main parameters for the course of the filtration and washing process. As both flow-rate and differential pressure are variable, the process was calculated by iteration. The relationships shown above were used in this algorithm.
0.80,--------------------,
" ~ 0.78
~ ~ 0.76 .. i _ 0.74
~ .... .. ~ u c
0.72 • .... ·0
" • .... ~ c 0.70 :c ~ ;<
0.68 3 4 5 6 7
MPS [lJm]
Fig. 9 The influence of MPS on washing efficiency with prediction limits (0.95%)
8

231 Heft7/8,1996
~ ~
. "'~ H=Hnin ~
~
5 Prediction with the model
The model has been checked with existing data from the trials and with additionallautering data. In this article two comparisons of real and calculated data are presented (Figures 12 and 13). It can be seen that the model can predict the lautering process.
The iautering time observed in the trials was compared with data calculated from the model by varying MPS. Viscosity was set as constant. Figure 14 shows that the iautering time predicted from the model lies in the same range as the measured data.
The slope of the fitted curves with MPS are very similar. The relatively large variation in lautering time is mainly due to variations in viscosity.
Monatsschrift fur Brauwissenschaft
Zusammenfassung
Fig. 10 First part of the computer model which determines the final cake height, the MPS and viscosity at lautering temperature
8i.lhler, T. M., McKechnie, M. T., uDd Wakemann, R. J.: Ein Modell :wr Beschreibung des Abliiuterprozesses- Monatsschrift fUr Brauwis· senschaft 49. Nr. 7/8. 226 - 233.1996
BC 202 Viskositiitl 222 Maischintensitiitl 223 LiiuterarbeHl 223 Wurzeablaufl 30 Simulationen, Modelle
Dieser Artikel beschreibt ein Modellsystem fUr die AbJauterung im Uiuterbottich. Es konnte gezeigt werden, daB Viskositat und Partikelgro· Benverteilung in der Feinfraktion die beiden entscheidenden Parameter sind. wenn andere Bedingungen wie z.B. die Ausgangsmaterialien kon· Slant gehalten werden. Die mittlere PartikelgroBe und die ViskosiHit konnen durch Maischtemperatur oder durch das Riihren der Maische

Monat5schrift fur Brauwissenschaft
® , ~ ~ , ~~----------~
"'~1.~ __ ' ,
E~:]
Fig. 11 Second part of the computer model
3O'T--;::=======:;------;:::=====:;! " ~ Differential press.ure • Ca~e Height
! 25
j ,,. • • o Et 15
j.l0 l 5
~
Filtrate volume
Extrac1
0;,-
.,; , .;. I ;: :::::'.'~"~-~'~"~"~"~'~'~":"~':'~'.
.. ' ..... .... .. '
.' .. 1: . . ,
.',
'.5
, .
"
" ~ 0, .p.",.:c'"';::-:;::::;:::;-"".:;.-,.-,.,,.-,.,,-c:'''' 0:' ,,' .:' ~ • .:' .,.-~---r--..j " ,. 60 '" 100 1~ 1~ 100 1~
Time [min)
Fig.l2 Trial I with real (data points) and calculated data (lines)
Hett 7/8, 1996 232
beeinfluBI werden. Hier werden die Hintcrgrunde beschrieben. wie die beidcn Parameter die Sedimentation. den Durchsatz des Uiuterboltichs und die Auswaschung des Filtcrkuchens beeinflussen. Es wurde cin Computerprogramm erstellt. mil dcm eine Vorhersage dcr HauptprozcBparamelerbcim Ablllutem cnn5glicht wird. Beim Vergleich des Modells mit denexperimentellen Oaten wurde eine hoheGenauigkeit festgestellt.
Riihler, T. M., McKechnie, M. T., et Wake man, R. J.: Un modele de description du procede de filtration de la maische- Monatsschrift fur Brauwissenschaft No 7!8. 226 - 233. 1996
BC 202 Viscosite! 222 Intensite de brassage! 223 Travail de la filtration de la maische! 225 Ecoulement du mOllt! 30 Simulatinns, modeles
Cet article decrit une modelisation pour la filtration de la maische en cuve riltre. 11 a ete demontre que la viscosite et la repartition de la taille des particules dans la fraction fine etaienl les deux parametres dominants. a condition de maintcnirconstants les materiaux de depart, parexcmple. La taille moycnne des particules et la viscosite peuvcnt etre influencees par "agitation dc la maische ou sa temperature. On decrit les causes des deux parametres qui influeneentla sedimcntation. le debit de la cuve nitre e le lavage du gateau filtrant. Un logiciel pennettant de predire les parametres cie de la filtration de la maisehe a ete elabore. En comparant le modele avee les valeurs experimetales. on a pu constater une liaison etroite.
Acknowledgement
The authors thank the Director General of' RRF International for the permission to publish this paper, Prof. Charlie Ramforth for reviewing this article and the staff of RRFI for their support during the experimental phase of this work.
6 Literature
I. Luers, H,: Die wissenschaftlichen Grundlagen von Brauerei und Mlilzerei, Verlag H. CarL Nurnberg. 1950.
"',-;========;-----;======>l "
, ,.
Dll1erentiat pressure
Filtrate volume
Extract
" 60 " Time [min)
cake Height
'5
o.
0.3 ~ i
,2
"
Fig. 13 Trial 2 with real (data points) and calculated data (lines)

233
2.
3.
4.
5.
6.
7.
Heh 7/8, 1996
NarziB. L.: Die Bierbrauerei. Volume 2: Die Technologie der Wiirzebercitung. 6. Edition, Ferdinand Enkc, Stuttgan. 1985. BUhlcr, T. M .• Matzner. G .. and McKechnic. M. T.: .,Agitation in Mashing", EBC Proceedings of the 25th Congress, Brussels, Oxford University Press. Oxford. 1995.293 - 300. Asselmeyer, F.. Hohn, K .• and Issing. E.: "Die Temperaturabhangigkeit von Viskosillll und Dichte bci Biercn. Ausschlag- und Vorderwurlcn", Brauwissenschaft 26, 4, 93 - 101, 1973. Eybcn. D .. and Hupe. J.: "Filterability of Wort and Beer and its Relationship with Viscosity", EBC Symposium on the Rela-tionship between Malt and Beer, Helsinki. Verlag H. Carl. Niimberg, 1980,201-212. Perry, R. H., and Green. D.: Chemical Engineers Handbook. McGraw-HilI, SingaIX>re. 1985. Kolbach. P.: "Die Umrechnung von Wiirze und Bier auf cinen bestimmten Extraktgehalt". Monatsschrift fUr Brauerei 13,21 - 25. 1960.
8. Cannan. P. c.: "Fluid Flow Through Granular Beds", Transactions of the Institute of Chemical Engineers, 15. 150 - 166, 1937.
9. Hennia, J .. and Rahier. G.: "Designing a New Wort Filter"·, Filtr. and Sep. 11 /12, 421, 422, 424, 1990.
10. Wakcman. R. J.: .. Filtration Post-Treatment Processes". Elsevier. Amsterdam. 1975.
lie -.~ ..
European Brewery Convention Manual of Good Practice
Brewery Utilities
Prepared by the EBe Technology and Engineering Forum
with the support of the European Union AIR Programme
Fachbuchhandlung Hans Carl
Publi,hcd by G<-trUle-Fachcrlag H"", Catl
Poslfach 99 01 53
90268 Nurnberg
Fax (091 1) 9 52 85-47
Monatsschrift fur Brauwissenschaft
165
160
155
150 • " I 145
• E 140 i= .§ 135
~ 130 , • • ~ 125
120
115
110 3.0 35
1 • Experimentallautering tjme I 1----- Predjcted lautering tjme
• . .......•
• .•... ~.. .
4.0
•........•.• •• • ...... . • .. . ... :. .....•..
4.5 5.0 55
MPS fiJmi
• 6.0 6.5
Fig. 14 Predicted lautering lime (dotted line and square points) and measured data (full line and triangles)
IN VORBEREITUNG MANUAL OF GOOD PRACTICE Vol. 2: Brewery Utilities "Technology und Engineering Forum" of the Europeon Brewery Convention (Hg.) ca.150 Seiten, DIN A 4, 40 Abbildungen und Diagramme. Price: OM 75,- (zuzuglich Versandkosten) Bestell-Nr.: 756
WEITERER TlTEL: Manual of Good Practice VoL 1: Beer Pasteu risation 148 Seiten., DIN A 4, zahlreiche IIlustrationen und Diagramme. OM 75,- zuzugl. Versandkosten} Bestell-Nr.: 748
FAX-BESTELLUNG: 0911 /9 52 85-47
...... Ex. Manual of Good Practice Vol. 2: Brewery Uti I ities
...... Ex. Manual of Good Practice Vol. 1: Beer Pasteurisation
Name Kunden-Nr.
Firma USt.-ld.-Nr.
Stra!3e PLZ/Or'
Datum Ste m pel/U n t ersch r·lft

Monatsschrift fur Brauwissenschaft Heft7/8,1996 234
K.-J. Huller und S. Muller
Biomonitoring der Betriebshefen in praxi mit fluoreszenzoptischen Verfahren
IV. Mitteilung: Zellzyklus und 3~-Hydroxysterolgehalt
Zu den wesentlichen intrazelluliiren Parametern der Saccharomyces-Hefen ziihlen der DNS-Gehalt sowie die Gehalte an Neutrallipiden, Enzymen und membrangebundenen 3~-Hydroxysterolen. Sie haben grollen Einflull auf die Physiologie der Betriebshefen. Ein Biomonitoring der Giirung und Reifung mull neben der Proliferations-Kontrolle auch die Funktionalitat der Hefezellen einbeziehen. Die 3~-Hydroxysterole iibernehmen zwei Schliisselfunktionen wiihrend des Wachstums und der Vermehrung der Hefe. Die "sparking function" wird als das auslosende Moment fUr die Proliferation (Zellzyklusinitiierung) der Hefezellen angesehen. Die "bulk membrane function" nimmt Einnu8 allr die Permeabilitat, Fluiditat oDd Stabilitiit der Hefemembran. Das Zusammenspiel zwischen Umweltbedingungen und Signaliibertragung durch die Hefezelle, ob die vorgegebenen 8edingungen ausreichen, einen Zellzyklus zu beginnen bzw. das Wachstum uod die Vermehrung voriibergehend einzustellen, sind fUr den Ablauf der Giirung von groller Bedeutung. Mit fluoreszenzoptischen Analysen konnen die Zellzyklusphasen und die verschiedenen Zellzustiinde in einer Population wiihrend des Wachstums statistisch signifikant bestimmt werden.
BC 033 Fluoreszenzanalysel 41 Glirfahigkeitl 41 Giirleistungl 43 Lebensftihigkeitsbestimmung
(Deskriptoren EBC: Hefe. Glirfahigkeit. Hefeanalyse (Methode zur). Garkraft (Methode zur Bestimmung der).
Descriptors EBC: Yeast, yeast fermentative ability, yeast cell analysis. fermentability (method for determination of).
1 Einleitung
Flir das Monitoring biotechnischer Prozesse werden Methoden, wie etwa die Fluoreszenzmikroskopie mit ihren Weiterentwicklungen, z.B. der automatisierten Bildanalyse und der Laser Scanning Mikroskopie und darUber hinaus der FluBzytometrie, zur Charakterisierung des physiologischen Zustandes mikrobieller Populationen zunehmend unverzichtbar. Dies ist besonders im Hinblick auf die Garaktivitat und Gargeschwindigkeit der Betriebshefen von Bedeutung. da es bisher keine zufriedenstellende M6glichkeit gibt, urn die geschlossene. zylindrokonische Garung beginnend mit der Propagation, der Giirung und Reifung und der Hefelagerung verfahrenstechnisch zu kontrollieren.
Von den Heferassen und Hefestammen. die in biotechnologischen Prozessen verwendet werden. wird fast immer angenommen, daB die eingesiiten Zellen sich alle im gleichen Zustand (Wachstumsund morphologischem Zustand) befinden. Daraus schlieBt man. daB diese Zellen auch die gleiche Leistung erbringen.
Autoren: Dr.-lng. K.-J. Hutter. Int Hassel22. 69221 Dossenheim, und Dr. rer. nat. S. MUlier. Umweltforschungszentrum Leipzig! Halle GmbH, PermoserstraBe 15,03418 Leipzig.
Wahrend der Garung wachsen und vennehren sich die Betriebshefen jedoch nicht unler synchronisierten Bedingungen, vielmehr flihrtjede Hefezelle ihren individuellen Zellzyklus durch. Dieses individuelle Wachsturn, dasjeweils mit derGeburt einerTochterzelle (SproBzelle) abgeschlossen wird. unterliegt einer variablen Abhangigkeit, die gepragt ist von den Nahrstoffbedingungen, metabolischen Aktivitaten der Zellen, den Umweltbelastungen (z.B. Athanolzunahme). den Temperaturbedingungen oder intrazellulliren Zustandsfomlender MakromolekUle (wie DNS-, RNSund Proteingehalte, Enzyme, Reservestoffe, Hormone etc.) der Hefen (3. 4).
Das Zusammenspiel zwischen Umweltbedingungen und SignalUbertragung durch die Hefezelle, ob die vorgegebenen Konditionen ausreichen. einen Zellzyklus zu initiieren. sind fUr einen Ablauf der Garung von erninenter Bedeutung und konnen mit fluoreszenzoptischen Kontrollen erkannt werden. Die Fluoreszenzmikroskopie und die RuBzytometrie sind geeignet, verschiedene Zellzustlinde in der Population statistisch signifikant nachzuweisen (4. 12, 14).
Die Mischungsverhaltnisse irn ZGK sind oft sehr heterogen. Dies liegt einmal darin, daB Fehler beim Drauflassen des Zeugs gemacht werden. zum anderen keine Moglichkeit besteht, ohne groBere Schaumbildung zu rUhren. Somit konnen sich Subpopulationen bilden, die wiederurn eigenen, zellkinetischen Ablaufen unterliegen (1,11).
Auf der Suche geeigneter Parameter fUr ein Biomonitoring der Betriebshefe wird in diesem Beitrag der tluBzytometrische Nachweis der 3~-Hydroxysterole beschrieben, die durch ihre Doppelfunktion in der Hefezelle zunachst eine "sparking function" besitzen. Diese wird als auslosendes Moment fUr die Proliferation der Hefezellen angesehen. Zurn zweiten haben die Sterole mil der .,bulk membrane function" einen EintluB auf die Permeabilitat, Fluiditlit und Stabilitat der Hefemembranen. Zu den 3~-Hydroxysterolen ziihlt das Ergosterol, welches unter den etwa 20 bekannten Sterolen der Hefe eine Schltisselposition einnimmt.

IChemE 0960-3085/96/$07.00 + 0.00 © Institution of Chemical Engineers
TEMPERATURE INDUCED PARTICLE AGGREGATION IN MASHING AND ITS EFFECT ON FILTRATION
PERFORMANCE T. M. BUHLER, M. T. McKECHNIE and R. J. WAKEMAN (FELLOW)"
BRF International, Redhill. Surrey, *Department o/Chemical Engineering, Loughborough University. UK
T his paper reports on changes in particle size distribution in a mash which occur with increasing temperature, and th~ir effects on filtration. In large scale deep bed filtratIOn, the mash slurry sedlments In two phases. The fine particle fraction, in the
range. from sub micron to approximately 150 I'm, forms a top layer which determines filtratIOn performance. By measuring particle size distribution in this fine particle fraction of mash, it was possible to show that particles aggregate with increasing temperature and that thIS parameter is dominant in influencing filtration performance.
Keywords: brewing; brewhouse; mashing; temperature; lautering;jiltration; particle sizing; vlSCOSlIy
INTRODUCTION
In beer brewing, the mashing process is one of the initial operations in the brewhouse and has to solubilize the contents of malt in water. To enhance extraction malt is crushed using a roller mill and mixed with hot w~ter in a mash vessel. This slurry of malt and water is called the mash. During the solubilization process, a variety of different enzymes from the malt are active and the activity of each can be controlled by adjusting the temperature in the mash. Starch, the main constituent of malt, gelatinizes at mashing temperatures and is broken down by enzymes into mono-, di-, tri- and oligo-saccharides. a-amylase and /1-amylase are the main enzymes involved in this conversion. Malt-a-amylase has the highest inactivation temperature of all starch degrading enzymes in the mash; it is active up to temperatures of 78°C and at 80°C a rapid decline in activity occursl.
In practice, temperatures close to the upper activity limit are employed, because mash filtration performance is found to improve with higher temperatures2 Operations with temperatures above the limit have been proposed, but have not found widespread application. The only explanation for the improved filterability (defined as a shorter run time) given in the literature is the reduction of viscosity with increasing temperature"'. This article reports on the changes in particle size distribution in the fine particle fraction in mash that occur with increasing temperature and which are shown to be dominant in determining filtration performance.
MATERIALS AND METHODS Mashing
A mash waS prepared from different mal ts in pilot scale mash vessels (l5-50£), at water-to-ground-malt
207
ratios of 3.5 to I by mass, using a single incubation temperature of 65°C over a time period of 45 minutes. After this time, the entire mash was heated to 100°C. The heating rates for the entire mashes were 0.3 (Trial I and 2) and 1.0°C.min -I (Trial 3). During this heating, mash was sampled at 5°C intervals. Thus, individual samples were obtained at temperatures of65, 70, 75, 80, 85, 90, 95 and 100°C. These samples were then analysed and the parameter investigated was described as, maximum mash temperature', referring to the maximum temperature of each individual sample.
Two different malt qualities were examined: Trials I and 3 employed highly modified malt in which most cell wall material (consisting of carbohydrates such as /1-glucan, pentosan and dextrins) was broken down during the malting process of barley into oligosaccharides. Trial 2 used undermodified malt which still contained large amounts of undegraded, branched carbohydrates from cell walls-this malt had a much shorter germination period during malting compared with the well modified malt sample. These substrates are not broken down entirely during mashing at temperatures above 65°C, as suitable de-branching enzymes are not available. Table 1 shows that the milling of the undermodified malt creates coarser particles and that this malt has a higher viscosity after extraction in the laboratory. This reflects the presence of high molecular weight cell wall material.
Sample Analysis
The mash samples were analysed for all parameters affecting filtration performance. The following analyses were carried out:
• particle sizing was carried out by diffraction laser light scattering with a Coulter LS 130 (Coulter Electronics). The sample was wet classified through a 106 I'm sieve

208 BUHLER et al.
Table 1. Comparison of key parameters of the two malt samples.
Highly modified malt Undermodified malt
Mean size after milling (0.75 mm gap setting, sieve analysis)
Viscosity (Laboratory standard analysis)
before analysis, in order t6 enhance the resolution in the small particle range of the mash. This was necessary because the overall particle range is very wide (up to 4000/lm) (see Table I); • particle concentrations in the sub-l06 /lm-sieve fraction were determined gravimetrically on a dry weight basis; • density of the liquid phase of the mash (called wort) was determined using an automated V-tube densitometer; • viscosity of the liquid phase of the mash was measured using an automated capillary suction viscometer; • filtration tests were carried out at constant pressure in a 200 ml filter cell, driven by an air pressure of 104 Pa. Filtration temperature was 65°C. The filtrate flow was measured over a time of 10 minutes using a digital balance with printer. A Whatman GF/D filter disk was used as the filter medium.
Processing of Analysis Data
Cake filtration in the Millipore filter cell can be described using the basic filtration equation':
I dV At!.p A -d-t = -1)(;-a-c7V'-+--"--A:-:R'"""m"7) (I)
(A Rm) has been determined in pre-trials to be much smaller than (acV), hence the filter medium term is neglected. Thus, equation (I) can be simplified to:
(2)
The filterability IlK was determined from the slope of dt/d V versus V plots. If data deviated from the cake filtration law with time during filtration, only data in the linear range was fitted. If zero flowrate occurred during the filtration cycle, the maximum volume of filtrate achieved, before blockage occurred, was reported.
EXPERIMENTAL RESULTS AND DISCUSSION
Small particles in the mash (fines) which consist of large amounts of protein are known to affect the filterability of a mash considerably",7. The change of particle size distribution in the fine particle fraction (smaller than a 106/lm sieve size) with maximum mash temperature of the individual samples is shown in Figure I for Trial l. It can be seen that the number distribution is shifted towards larger sizes with increasing
IISlpm I 344 JLm
1.50mPas 2.00mPas
mash temperature, and the width of the size distribution is increased with temperature.
To describe this effect with only one number, the geometric mean particle size (M PS) of a number distribution has been calculated using:
[I:(n, x log So]
MPS = antilog I:>, (3)
where:
S, = the median size of a channel (in total 100 channels are logarithmically spaced from 0.1 to 900/lm) and n, = the percentage of particles in each channel.
Figure 2 shows the change of MPS with maximum temperature in the mash. It was possible to identify a significant change of the MPS for both malt qualities and with different heating rates. The two malt qualities show different initial sizes. However, the increase of MPS with temperature of the undermodified malt is similar to the well modified malt trials. This size change is caused by the aggregation of proteinaceous material in the presence of polyphenols at higher temperatures8,9,1O
Comparison of the results from Trials I and 3 suggests that the heating rate had little effect on the particle size distribution.
Concentration of Fine Particles
The analysis of particle size distributions by laser diffraction does not allow the determination of total particle concentrations, as the sample volume in the LS 130 is unknown. Therefore, particle concentrations were
2345 10 20 304050 100
- .... 1""1 Figure 1. Effect of maximum mash temperature on particle size distribution (number) for Trial I (well modified malt, heating rate O.3°C.min- l
) (each data point represents a size channel).
Trans ICbemE, Vol 74, Part C, December 1996

TEMPERATURE INDUCED PARTICLE AGGREGATION IN MASHING 209
",-----,---,------....,...---, 10
9
• Trial 1 • Trial2
.. Trial3
.... 0 ............ .
..•
.... •... ,< .
Figure 2. Change of MPS with maximum mash temperature of the sample.
detennined separately as dry solids. This analysis indicated that the solids percentage does not change with increasing mash temperature (the concentration was 0.35 g dry solid e-' of mash for all trials). This suggests that no additional fine particles are created during the heating step from 65°C to the maximum temperature and that the change of the MPS with time is a true shift in the distribution, and not caused by the formation of new, larger particles from solution. The total concentration of mash solids (relative to the filtrate volume), including those above 106 "m, was also constant over the temperature increase and did not vary between the trials. It was detennined to be 132 kg wet solids m-3
Viscosity and Density of Mash
The viscosity of the liquid phase of mash has been measured for all samples at 65°C which was the same temperature used for the filterability trials. Figure 3 shows that for the highly modified malt (Trials I and 3), the viscosity does not change to a great extent. The different levels of Trials I and 3 are caused by different densities in the aqueous phase (see density analysis).
The viscosity of Trial 2, using undennodified malt, shows a strong increase with mashing temperature. As the density values are only slightly increasing (see Figure 4), it can be concluded that the drastic increase is due to
1.'"
1.3) • Trial 1
1.<0 • Tr1aI2 .. Trial 3
1."
~ tal • ~ 1.10
1'00 . '" ~ ...
.'"
.70 • , o •
•... .0 • , ,
0.0)
" ro ~ 00 ~ ro ~ ~
Maldmum ternpB"ature in mash rcJ
Figure 3. Change of viscosity in the liquid phase of mash, measured at 65°C, with maximum temperature.
Trans IChemE, Vol 74, Part C, December 1996
" 70 75 11) as 00 95 100 M<Ddmum temperature in rrash rcJ
Figure 4. Density of mash liquid phase at 20°C with maximum temperature.
solubilization of higher molecular weight branched carbohydrates. These substances are leached out of the solids, and their concentration and chemical structure increases the suspension viscosity. As no enzymes are present to break these substances down, viscosity increases as these higher molecular weight carbohydrates are leached.
The density in the liquid phase of the mash samples was measured at 20°C (see Figure 4). Trials 1 and 3 were mashed at different ground malt/water ratios and the different amounts of soluble material caused the variation in the density levels. The undennodified malt in Trial 2 and the well modified malt release similar amounts of soluble material into the aqueous phase and the density increase with higher mashing temperature is similar for all trials. However, the properties of the materials released and their effect on viscosity are considerably different.
FilterabiIity of Mash
Filterability was determined at 65°C. This temperature was chosen to avoid additional effects on particle aggregation by higher temperatures and 'cold trub' fonnation ('cold trub' are fine proteinaceous particles below 10 "m in diameter which precipitate at temperatures below 60°C').
Filterability I/Kwas detennined for each sample from the linear range of dt/dV vs V plots at the individual maximum mash temperatures. If filtration curves deviated from cake filtration laws in the later stages, the maximum volume filtered under conditions of cake filtration was noted for the data point.
The variation of filterability with temperature is displayed in Figure 5. It can be seen that filterability increases dramatically with the maximum temperature in the mash sample. The differences in malt quality are also visible: Trial 2 exhibits the lowest filterability level and the peak filterability is reached at a lower temperature . This can be explained by the higher wort viscosity for this malt, arising from the increasing carbohydrate leaching, which counteracts any improvement in filterability that might have otherwise been obtained with higher temperatures. Trials I and 3 show a very similar shape of curve: the curves are displaced relative to one another

210 BUHLER e/ al.
of 40..11),13
g 3.o..url3
i ~ 2.00:10"13
• Trial 1 • Trial 2 • TtiII3
"
•
•.. ~ .......... -.
.' . ,,': Ii .~ ...
100
Figure 5. Filterability for different mashing temperatures (indices on data points indicate maximum volume filtered, per unit area, before filtration law deviated from cake filtration law: (a) < O.OI7m3m-2
,
(b) < O.006m3m-2, (c) < O.OO5m3m-2
, d<O.006 m3m·2 , for data
points without index, no blockage was observed).
by a fairly constant amount. This is largely accounted for by the different viscosity levels between Trials 1 and 3.
Specific Resistance of the Cake
To show that filtration properties of the cake change with increasing temperature, it is useful to investigate the variation of specific resistance of the cake with this parameter (see Figure 6). Trials 1 and 3 show no difference in specific resistance. The different incubation times up to the maximum temperatures (caused by the different heating rates) have no major effect on the specific resistance of the cake. The strong change in specific resistance with the maximum mashing temperature accounts for the changes in filterability: it is the predominant parameter which determines mash filtration performance.
Correlation Between Specific Resistance and Mean Particle Size
The specific resistance to filtration is mainly dependent on the square of the particle specific surface and the
5.OK1012 .. ----------------~_,
• Trial 1 • Trial2 ... Trial3
." ...... •
"'L,-,...,..--r--.-:==~~::;::!~~ " 70 75 fI) B5 00 'iJj 100
r.t:om.m terrparature n rrash ("Cl
Figure 6. Specific resistance of the cake with maximum temperature in the mash.
packing density (f3) function of the particles in the cake". Specific surface is indirectly proportional to the square of the mean particle size, and hence:
f(f3) a 0< MPS' (4)
The change of the specific resistance of the cake can be plotted against the shift of the particle size distribution observed in this investigation. In such a plot of specific resistance vs MPS-', see Figure 7, it can be seen that the decrease in specific resistance is related almost linearly, with high significance (R = 0.91 to 0.95), to the change in MPS-'.
The packing density functionf(f3) also varies with the mashing temperature; this is shown in Figure 8 by plotting (a MPS') vs maximum mash temperature. The change of f(f3) with temperature suggests that there is a corresponding change in cake porosity as temperature is increased. However, this change is smaller than the changes in specific resistance a. The major factor controlling cake specific resistance during filtration is therefore the mean particle size. The chan~es in specific resistance a, filterability IlK and (a M PS ) are listed in Table 2.
It shows that:
(i) a is a better filter scale-up parameter than IlK since changes in Q: with process conditions are smaller,
SIlw.10t2 ,------.,.-------,----,_-,
, , / , , . ,
,
.. .. ... / .. ,/
, , ., ,
, /
• Trial 1 • Trial2 .. Trial3
}'~ O.O+-_-i-..:=T'-_~-.--_.~__,~_.~...,.~_I
0.005 0.010 0.015 o.<m o.C125 o.COO 0.0:35 0.040 0.06 O.(5)
fJl'S'211n1'~
Figure 7. Correlation between specific resistance and M PS-2.
1.8lI:10"T":---:-----;====;-:---:----:-l 1.e.10'·
~ 1.2r10W
, '7 ,.0:0:10"
§. 8 ()::1013 '1;' ~ 8.(ll1013
"
• ..
-~ e
•
• •
• • ... "r :=:;< . • • ., ro 75 ., " .. " 100
o.o.Li--c:---:-:---:-:---:-:--T'-T'--i:-' Maxrnum mash temperature I'Cl
Figure 8. Plot of (0: M pS-) against maximum mash temperature.
Trans IChemE, Vol 74, Part C, December 1996
, .

TEMPERATURE INDUCED PARTICLE AGGREGATION IN MASHING 211
Tahle 2. Maximum changes over the temperature range investigated.
Trial I Trial 2 Trial 3
factor for filterability, IlK·
change
6.2 2.8 9.S
factor for resistance. 0-
change
6.9 6.S 7.9
factor for (n.MPS2) change
2.52 2.36 2.92
(ii) (0 M PS') is almost independent of the malt type, (iii) changes of f({3) with temperature and malt type are smaller than changes in resistance and, hence, the particle packing density is little affected by these parameters.
CONCLUSION
This work shows that previous assumptions about the improvement of mash filterability with mash temperature have not taken the importance of the change of particle size distributions into account. In the brewing literature4
.l2.13 , the viscosity reduction due to tempera
ture increase is given as the only explanation for improved lautering performance. In contrast with any viscosity changes with temperature, particle size changes due to the described temperature effect are permanent, which will have further implications on brewing technology.
The particle size distribution of the fines has been identified as the predominant parameter affecting mash filtration performance. It can now be used to predict specific resistance of the filter cake and anticipate the filtration performance of the mash.
dV dl V A c,p c ry V Rm IlK
NOMENCLATURE differential volume. m) differential time. s volume, m 3
area. m2
pressure difference. Pa concentration of solids. per unit volume of filtrate. kg m-J
viscosity. x IO-J Pas volume of filtrate. m3
resistance of the filter medium. m-I filterability. m6 s- 1
Trans IChemE, Vol 74, Part C, December 1996
o
fJ. specific resistance. kgm- I
packing density. -s,. n,.
median size of a channel. !'lm percentage of particles in each channel. %
REFERENCES I. Moll. M. and de Blauwe. J.1. 1994. Beers and Coolers. (Intersept.
Andover). 2. Briggs. D. E .. Hough. J. 5 .. Stevens. R. and Young. T. W .. 1986.
Malting and Brewing Sdence. Vol I. Malt and Sweet Wort (Chapman & Hall. New York).
3. Schaus. O. 0 .. 1972. Elevated temperature lautering. Master BreI\" Assoc of the Americas. Tech Quart. 9. (4): 192-194.
4. Luers. H .. 1950. Die wissenschaftlichen Grund/agen l'on Miil=erei and Brauerei (Hans Carl. Nurnberg).
5. Ruth. B. F .. 1946. Correlating filtration theory with practice. InJ Eng Chem. 38: 564.
6. Muts. G. C. 1. and Pesman. L. 1986. The influence of raw materials and brewing process on lautertun filtration. EBC Monograph XI. Majjfier, 25-35 (Hans Carl, Nurnberg).
7- Webster. R. D. J. and Portno, A. D .• 1981, Analytical prediction of lautering performance. Proc Eur Brew Conv. Copenhagen. 153-160 (Hans Carl. Nurnberg).
8. Lewis. M. 1. and Nelson-Wahnon. N .. 1984, Precipitation of protein during mashing: evaluation of the role of calcium. phosphate. and mash pH. Am Soc BrelV Chem, 42 (4): 159-163.
9. Lewis. M. 1. and Oh. S. S., 1985. Influence of precipitation of malt proteins in lautering. Master Brew Assoc of the Americas. T eeh Qua'l, 22 (3): lOS-I I \.
10. Lewis. M. 1. and Serbia. 1. W .. 1984. Aggregation of protein and precipitation by polyphenol in mashing. Am Sue BreII' Chem. 42 ( I): 40-43.
11. Coulson, 1. M., Richardson. 1. F .. Backhurst. 1. R. and Harker. 1. H .. 1978. Chemical Engineering Vulume 2. (Pergamon. London).
12. NarziB. L., 1985. Die Bierbrauerei, Volume 2: Die Technologie der Wiir=ebereilung. 6th edition (Ferdinand Enke. Stuttgart).
13. Scimus, O. 0 .. 1972. Elevated temperature lautering. MBAA Tech Qua". 9 (4): 192-194.
ACKNOWLEDGEMENT The authors acknowledge the Director of BRF International for
permission to publish this paper.
ADDRESS Correspondence concerning this paper should be addressed to Mr T.
Suhler, Bergfriedstrasse 8. D·91207 Lauf. Germany.
The manuscript was receh'ed 29 December 1995 and accepted for publication after revision /9 August /996.

j
j
j
j
j
j
j
j
j
j
j
j
j
j
j
j
j
j
j
j
j
j
j
j
j
j
j
j
j
j
j
j
j
I j
j