EFFECTS OF PERIODICAL CICADA EMERGENCES ON … · We used 37 years of North American Breeding Bird...
10
Ecok~p, 8h(7), 2005, pp. B 2005 by the Ecological 1873-1882 Society of America EFFECTS OF PERIODICAL CICADA EMERGENCES ON ABUNDANCE AND SYNCHRONY OF AVIAN POPULATIONS WALTER D. KOENIG'.~ AND ANDREW M. L~EBHOLD~ 'Hastings Natural History Reservation, University qf California, Berkeley, 38601 E. Carmel Valley Road, Carmel Valley, California 93924 USA 2USDA Forest Service, Northeastern Research Station, 180 Canj5eld Streef, Morganfown, West YiPginia 26505 USA Abstract. We used 37 years of North American Breeding Bird Surveys to test for effects of periodical cicada (Magicicada spp.) emergences on the abundance and spatial synchrony of 24 species of avian predators in hardwood forests of the eastern United States. Fifteen (63%) of the bird species exhibited numerical changes in abundance apparently associated with emergences of the local periodical cicada brood, and intraspecific spatial synchrony of bird abundance was significantly greater between populations sharing the same cicada brood than between populations in the ranges of different broods. Species exhibited at least four partially overlapping temporal patterns. (1) Cuckoos (Coccyzus spp.) occurred in high numbers only during emergence years and subsequently declined in abun- dance. (2) Red-bellied Woodpeckers (Melanerpes carolinus), Blue Jays (Cyanocitta rris- tata), Common Orackles (Quiscalus quiscula), and Brown-headed Cowbirds (Molothrus ater) increased significantly 1-3 years following emergences and then declined. (3) Red- headed Woodpeckers (Melanerpes erythrocephalus), American Crows (Cowus hrachyryn- chos), Tufted Titmice (Baeolophus hicolor); Gray Catbirds (Dumetella carolinensis), and Brown Thrashers (Toxostoma mfum) were found in significantlylow numbers during emer- gence years, underhrent significant numerical increases in the following year, and then stabilized. (4) Wood Thrushes (Hylocichla rnustelina), Northern Moclsingbirds (Mimuspo- ZygIottos), Northern Cardinals (Cardinalis cardinalis), and House Sparrows (Passer do- mesticus) exhibited significantlydeviant population numbers 1-2 years prior to emergences, below the long-tern meaa in the first two species and above the long-term mean in the latter hyO" These results suggest that the pulses of resources available at 13- or 17-year intervals when periodical cicadas emerge have significant demographic effects on key avian predators, mostly during or immediately after emergences, but in some cases apparently years following emergence events. Key words: hlrd populations; Breeding Bird Survey; eastern North America; hardwood,forests; Magicicada; periodical cicadas; predation; predator satiation; pulsed resources; spatial synchrony. The ecosystem importance of pulsed resources that occur as episodic events at long, multiyear intervals has recently begun to be appreciated as more long-term studies have documented the ecological consequences of pulsed phenomena (Ostfeld andKeesing 2000). Such pulses can have cascading effects as the relatively large amount of energy made ephemerally available maltes its way both up and down the food chain (Pace et al. 1999). Widespread examples include mast-fruiting by seed-bearing trees andnvariouskinds of insect and ro- dent outbreaks. A particularly dramatic pulsed phenomenon is the emergence of periodical cicadas of the genus Magici- cada in hardwood forests of eastern North America (Yang 2004). These insects exhibit one of the most extraordinary life cycles of any insect. Nymphs de- Manuscript received 26 July 2004; revised 1 December 2004; accepted 10 December 2004. Corresponding Editor: K. L. Cottingham. E-mail: l<[email protected] velop underground for either 13 or 17 years, after which adults emerge from the ground and climb into the can- opy, where they feed, mate, oviposit on twigs. and die, all within a period of 3-4 weeks. Several weeks later, first-instar nymphs hatch from the eggs, descend to the forest floor, burrow into the soil, and start the process once again. Such periodicity is rare, and of known pe- riodical species, no others come close to matching the cycle length of Magicicada (Heliovaara et al. 1994). Periodical cicada populations are divided into de- velopmentally synchronized, temporally isolated co- horts known as broods, each composed of three or four syrnpatric species. Populations of 12 of these broods require 17 years to complete development, whereas three broods require 13 years (Williams and Simon .1995, Marshall and Cooley 2000). Over most of their range, broods are allopatric; thus all individuals at a given location generally emerge synchronously during the same year. Emphasizing the potential significance of emergenc- es is the fact that periodical cicadas are among the most
Transcript of EFFECTS OF PERIODICAL CICADA EMERGENCES ON … · We used 37 years of North American Breeding Bird...
E c o k ~ p , 8 h ( 7 ) , 2005, pp. B 2005 by the Ecological
1873-1882 Society of America
EFFECTS OF PERIODICAL CICADA EMERGENCES ON ABUNDANCE AND SYNCHRONY OF AVIAN POPULATIONS
WALTER D. KOENIG'.~ AND ANDREW M. L~EBHOLD~
'Hastings Natural History Reservation, University qf California, Berkeley, 38601 E. Carmel Valley Road, Carmel Valley, California 93924 USA
2USDA Forest Service, Northeastern Research Station, 180 Canj5eld Streef, Morganfown, West YiPginia 26505 USA
Abstract. We used 37 years of North American Breeding Bird Surveys to test for effects of periodical cicada (Magicicada spp.) emergences on the abundance and spatial synchrony of 24 species of avian predators in hardwood forests of the eastern United States. Fifteen (63%) of the bird species exhibited numerical changes in abundance apparently associated with emergences of the local periodical cicada brood, and intraspecific spatial synchrony of bird abundance was significantly greater between populations sharing the same cicada brood than between populations in the ranges of different broods. Species exhibited at least four partially overlapping temporal patterns. (1) Cuckoos (Coccyzus spp.) occurred in high numbers only during emergence years and subsequently declined in abun- dance. (2) Red-bellied Woodpeckers (Melanerpes carolinus), Blue Jays (Cyanocitta rris- tata), Common Orackles (Quiscalus quiscula), and Brown-headed Cowbirds (Molothrus ater) increased significantly 1-3 years following emergences and then declined. (3) Red- headed Woodpeckers (Melanerpes erythrocephalus), American Crows (Cowus hrachyryn- chos), Tufted Titmice (Baeolophus hicolor); Gray Catbirds (Dumetella carolinensis), and Brown Thrashers (Toxostoma mfum) were found in significantly low numbers during emer- gence years, underhrent significant numerical increases in the following year, and then stabilized. (4) Wood Thrushes (Hylocichla rnustelina), Northern Moclsingbirds (Mimuspo- ZygIottos), Northern Cardinals (Cardinalis cardinalis), and House Sparrows (Passer do- mesticus) exhibited significantly deviant population numbers 1-2 years prior to emergences, below the long-tern meaa in the first two species and above the long-term mean in the latter hyO" These results suggest that the pulses of resources available at 13- or 17-year intervals when periodical cicadas emerge have significant demographic effects on key avian predators, mostly during or immediately after emergences, but in some cases apparently years following emergence events.
Key words: hlrd populations; Breeding Bird Survey; eastern North America; hardwood,forests; Magicicada; periodical cicadas; predation; predator satiation; pulsed resources; spatial synchrony.
The ecosystem importance of pulsed resources that occur as episodic events at long, multiyear intervals has recently begun to be appreciated as more long-term studies have documented the ecological consequences of pulsed phenomena (Ostfeld andKeesing 2000). Such pulses can have cascading effects as the relatively large amount of energy made ephemerally available maltes its way both up and down the food chain (Pace et al. 1999). Widespread examples include mast-fruiting by seed-bearing trees andnvarious kinds of insect and ro- dent outbreaks.
A particularly dramatic pulsed phenomenon is the emergence of periodical cicadas of the genus Magici- cada in hardwood forests of eastern North America (Yang 2004). These insects exhibit one of the most extraordinary life cycles of any insect. Nymphs de-
Manuscript received 26 July 2004; revised 1 December 2004; accepted 10 December 2004. Corresponding Editor: K. L. Cottingham.
E-mail: l<[email protected]
velop underground for either 13 or 17 years, after which adults emerge from the ground and climb into the can- opy, where they feed, mate, oviposit on twigs. and die, all within a period of 3-4 weeks. Several weeks later, first-instar nymphs hatch from the eggs, descend to the forest floor, burrow into the soil, and start the process once again. Such periodicity is rare, and of known pe- riodical species, no others come close to matching the cycle length of Magicicada (Heliovaara et al. 1994).
Periodical cicada populations are divided into de- velopmentally synchronized, temporally isolated co- horts known as broods, each composed of three or four syrnpatric species. Populations of 12 of these broods require 17 years to complete development, whereas three broods require 13 years (Williams and Simon .1995, Marshall and Cooley 2000). Over most of their range, broods are allopatric; thus all individuals at a given location generally emerge synchronously during the same year.
Emphasizing the potential significance of emergenc- es is the fact that periodical cicadas are among the most
1874 WALTER D. KOENIG AND AND& M. LIEBHOLD Ecology, Vol. 86, No. 7
abundant of all forest insects, reaching 2.6 X 10Qi- cadadha (Lloyd and Dybas 1966a, h, Karban 1980). Adults are large, nontoxic, easily captured, and readily consumed by a variety of predators (Dybas and Davis 1962, Lloyd and Dybas 19666, Williams and Simon 1995). This combination of abundance, lack of natural defenses, and extraordinary synchrony within a region can result in periodical cicadas being consumed in large numbers d&g emergences; predators, in turn, have been observed to annihilate small populations of pe- riodical cicadas (Marlatt 1907, Alexander and Moore 1958). In contrast, predators are generally unable to consume more than a fraction of the periodical cicadas during emergences when cicadas are abundant (Karban 1982, Williams et al. 1993). These results support the widely held assumption that much of the life-history evolution of periodical cicadas has been driven by pred- ator satiation, and that their extraordinarily long life cycle has evolved to escape the numerical responses of predators (Williams and Simon 1995).
Periodical cicada adults have an immediate negative impact on the radial growth of host trees, depressing growth of hardwoods on a regional scale by -4% in emergence years (Koenig and Liebhold 2003). How- ever, the carcasses of dead aduit cicadas, present in large numbers in emergence years, provide a significant nutrient resource pulse to forest soils, increasing mi- crobial biomass and nitrogen availability (Yang 2004). Given fhis pulse of energy and nutrients, one would expect that important "bottom-up" effects in the form of higher populations of predators would be relatively easy to detect. Sqrisingly, this has not proven to be the case. Although numerous species have been ob- served eating penodical cicadas, we are aware of only a handful of studies reporting demographic effects of periodical cicadas on potential predators, none of which has reported effects outside of emergence years.
Three of these studies have been on bitds. Nolan and Thompson (1975) reported several apParent differences in the breeding of Yellow-billed and Black-billed Cucl- oos (for scientific names, see Table 1) in southern In- diana, USA, during an emergence of Brood X, includ- ing increased numbers of nests, earlier breeding, and larger clutches. More quantitatively, Anderson (1977) compared reproduction in House Sparrows (Passer do- mesticus) and European Tree Sparrows (Passer mon- tanus) near St. Louis, Missouri, USA in 1972 during emergence of Brood XIX with four non-emergence years, finding significantly larger clutch sizes and shorter interclutch intervals in Ewopean Tree Sparrows and significantly higher fledging success and increased nestling body mass in House Sparrows during the emer- gence year. Strehl and White (1986) studied Red- winged Blackbirds (Agelaius phoeniceus) during an emergence of Brood XXIII in southern Illinois, USA, and reported several differences including increased nestling body*mass and survival compared to non- emergence years.
We are aware of only one study that has addressed the effects of periodical cicada emergences on a non- avian taxon. Krohne et al. (1991) studied small mam- mals in west-central Indiana during an emergence of Brood X and found no apparent effect on white-footed mice (Peromyscus leucopus), but a fourfold increase in the numbers of short-tailed shrews (Blarina hrevi- cauda).
Here we take a new approach to the challenge of detecting demographic effects of pulsed periodical ci- cada emergences on avian populations. Using avian census data from the North American Breeding Bird Survey, we matched sites with appropriate cicada brood emergence years to explore effects of emergences on regional abundance of 24 bird species known or lilcely to eat periodical cicadas. Our working hypothesis was that periodical cicadas are an important pulsed resource that is likely to have strong "bottom-up" consequences for their communities, and that the long-term, regional data provided by the Breeding Bird Survey would yield considerably more power to detect those consequences than the approaches to this issue used in previous stud- ies.
The North American Breeding Bird Survey (BBS) consists of a series of censuses performed once a year in the spring. Each census consists of a 3-minute ob- servation at a series of 50 stops 0.8 km apart along a road transect (Bystrack 1981). We downloaded surveys performed for the 37 breeding seasons from 1966 to 2002, inclusive (available online).4 From these, we ex- tracted data for 24 species of terrestrial birds (Table 1) that are known or likely (based on size, distribution, and diet) to eat periodical cicadas. Thus, our analyses were exploratory in that they included species for which there exist no prior published data regarding their propensity to eat cicadas. We expected a priori that populations of at least some species that we tested would not exhibit any relationship to periodical cicada emergences.
Each BBS site was matched to the local cicada brood based on county-level maps of brood distributions (Marlatt 1907, Simon 1988) using a geographical in- formation system. In order to eliminate complications arising from areas of apparent syrnpatry among dif- fereht broods, data from the few counties with records of two or more broods or with low-density emergences were discarded. Thus, only BBS sites unambiguously located within the range of a single brood of periodical cicadas emerging in abundant densities were included in the analyses. In total, 356 sites were used; 127 of these were within the range of 13-year cicada broods and 229 were within the range of 17-year broods (Fig. 1). However, not all sites yielded data for analyses of

July 2005 PERIODICAL CICADAS AND BIRD POPULATIONS
TABLE I. Species of birds and number of Breeding Bird Surveys (BBS) used in the analyses.
No. surveys within range of cicada broods
Species Scientific name Code 13-year 17-year References?
American Kestrel Falco sparverius AMKE Black-billed Cuckoo Coccyzus erythropthalmus BBCU
Yellow-billed Cuckoo
Red-headed Woodpecker
Red-bellied Woodpecker Red-eyed Vireo Blue Jay
American Crow Carolina Chickadee Tufted Titmouse Whiteibreasted Nuthatch Wood Thrush American Robin
Gray Catbird Northern Mockingbird Brown Thrasher European Starling
Eastern Towhee Northern Cardinal Red-winged Blackbird
Common Grackle
Brown-headed Cowbird
Baltimore Oriole House Sparrow
Coccyzus americanus
Melanerpes eryrhrocephalus
Melanerpes carolinus Vireo olivaceus Cyanociffa cristata
Corvus hrachyrynchos Poecile carolinensis Baeolophus hicolor Sitta carolinensis Hylocichla mustelina Turdus migratorius
Dumetelh carolinensis Mimus polyglofro~ Toxostoma rufum Sturnus vulgaris
Pkilo erythrophthalmus Cardinalis cardinalis Agelaius phoeniceus
Molothrus ater
Icterus galhula Passer domesticus
YBCU
RHWO
RBWO REV1 BLJA
AMCO CACH TUTI WBNU WOTH AMRO
GRCA NOMO BRTH EUST
EAT0 NOCA RWBL
COGR
BHCO
BAOR HOSP
Riis (1940) Riis (1940); Nolan and
Thompson (1 975) Riis (1940); Nolan and
Thompson (1975) Howard (1937); Riis
(1940)
Kellner et al. (1990) Riis (1940); Karban
(1982) Riis (1940)
Kellner et al. (1990)
Karban (1982) Howard (1937); Karban
(1982)
Howard (1937); Riis (1940); Karban (1982)
Strehl and White (1986); Steward et al. (1988)
Howard (1937); May (1979); Karban (1982)
Howard (1937); &is (1940)
Howard (1937); Riis (1 940); Anderson (1977) -
f References are listed for those species known to eat periodical cicadas or whose demography has been shown to be affected by periodical cicada emergences.
all species, and thus sample sizes were often smaller than these values (Table 1).
Data were manipulated as follows. First, we log- transformed the number of birds counted during each year of the survey (log [number of birds counted + 11) in order to help equalize variances and normalize the data. Given the short duration of most of the time series (mean = 26 years) relative to the length of the cicada cycles, using anythmg besides a linear regression to remove long-term trends was not feasible. Thus, we detrended each site X year series using a linear re- gression and then standardized to mean = 0 and SD =
1. For each year, we then determined the length of time since the last emergence of the coincident cicada brood (YEAR). YEAR varied from 0 (an emergence year) to 12 or 16 years, depending on whether the local brood was a 13-year or1. 17-year form. However, in order to combine populations living within the ranges of 13- year and 17-year broods, we analyzed the four years
prior to emergences (YEAR '4 to YEAR - 1, corre- sponding to YEAR 9 to YEAR 12 for populations with- in the range of 13-year broods and YEAR 13 to YEAR 16 for populations within the range of 17-year broods), the emergence year (YEAR 01, and the eight years fol- lowing emergences (YEAR 1 to YEAR 8).
For analyses testing for overall effects of emer- gences, we calculated the mean standardized popu- lation size for all values of YEAR within a series. That is, if the BBS data for a particular species X site series encompassed two emergence years (for exam- ple, 1973 and 1990 for a survey conducted within the range of Brood XIII), we averaged the standardized population abundance estimates for those two years. This procedure yielded a single set of population es- timates for each species x site series. Only sites for which at least one survey was performed for all years of the appropriate cicada brood cycle were included in the analyses.

WALTER D. KOENIG AND ANDREW M. LIEBHOLD Ecology, Vol. 86, No. 7
Fro. 1. The eastern United States, showing in g a y the geographic range of (a) 13-year and (b) 17-year periodical cicada broods. Black circles represent localities of Breeding Bird Surveys used in the analyses.
Differences in the mean population size of each spe- cies v i s -h i s YEAR were tested with SPSS (1999) us- ing repeated-measures general linear models. Statisti- cal significance was based on linearly independent pair- wise comparisons among the estimated marginal means. We also specifically targeted the effect of emer- gences on population size by statistically comparing size in YEAR - 1 with that in YEAR 0, and YEAR 0 with that in YEAR 1, using paired mean standardized populauon values (one set for each species X site data set) and Wilcoxon signed-ranks tests.
Analyses of spatial synchrony (Bjemstad et al. 1999, Koenig 1999, Liebhold et al. 2004) were performed by calculating the Pearson correlation coefficient between the log-transformed and detrended population esti- mates of each bird species, comparing time series from all sites in a pairwise fashion. All years of data were used. Contrasts were then made first by binning pairs according to the geographic distance separating sites (<I00 km, 100 to <250 km, 250 to <500 km, 500 to
<I000 l a , and 1000-2500 km), and then according to whether pairs of sites were within the range of the same brood of periodical cicadas or within the range of different cicada broods. For each distance category, the mean distance was equalized between within- and between-brood sites by randomly eliminating between- brood sites relatively far apart until the means were the same. Among sites not sharing the same brood, pair- wise comparisons between different broods of the same periodicity (both 13-year or both 17-year) and those of different periodicity (13-year vs. 17-year) were com- bined. For estimates of the overall influence of cicadas on avian synchrony, we averaged the mean correlation coefficients of sites within and between the range of cicada broods for each distance category across species and tested for significance between the within- and be- tween-brood values with paired Wilcoxon signed-ranks tests.
Population abundance.--Of the 24 species consid- ered, 12 (50%) exhibited significant differences (P 5 0.05) among years based on the general linear models and 13 (54%) exhibited significant differences between YEAR -1 and YEAR 0, YEAR 0 and YEAR 1, or both (Table 2). Ten of 12 (83%) species significant by the general linear models also exhibited a significant change in abundance between emergence years and the year following emergences. Altogether, 15 (63%) of the species exhibited numerical changes in abundance, apparently associated with emergences of the local pe- riodical cicada brood.
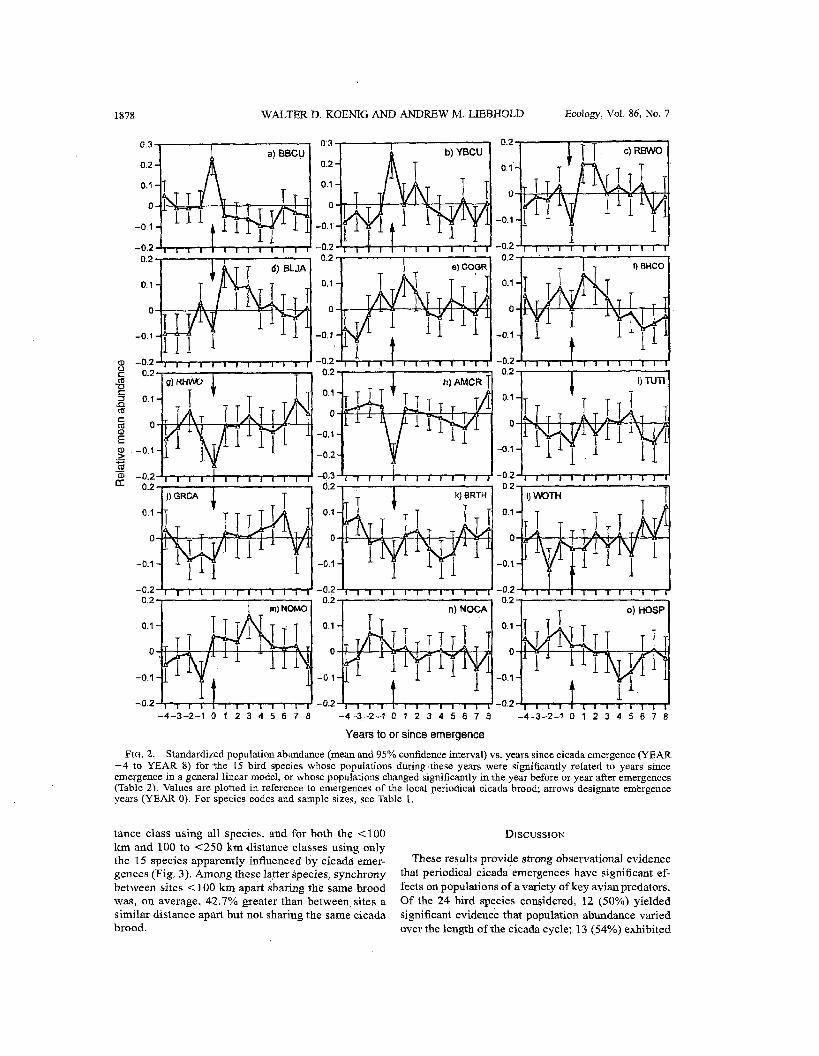
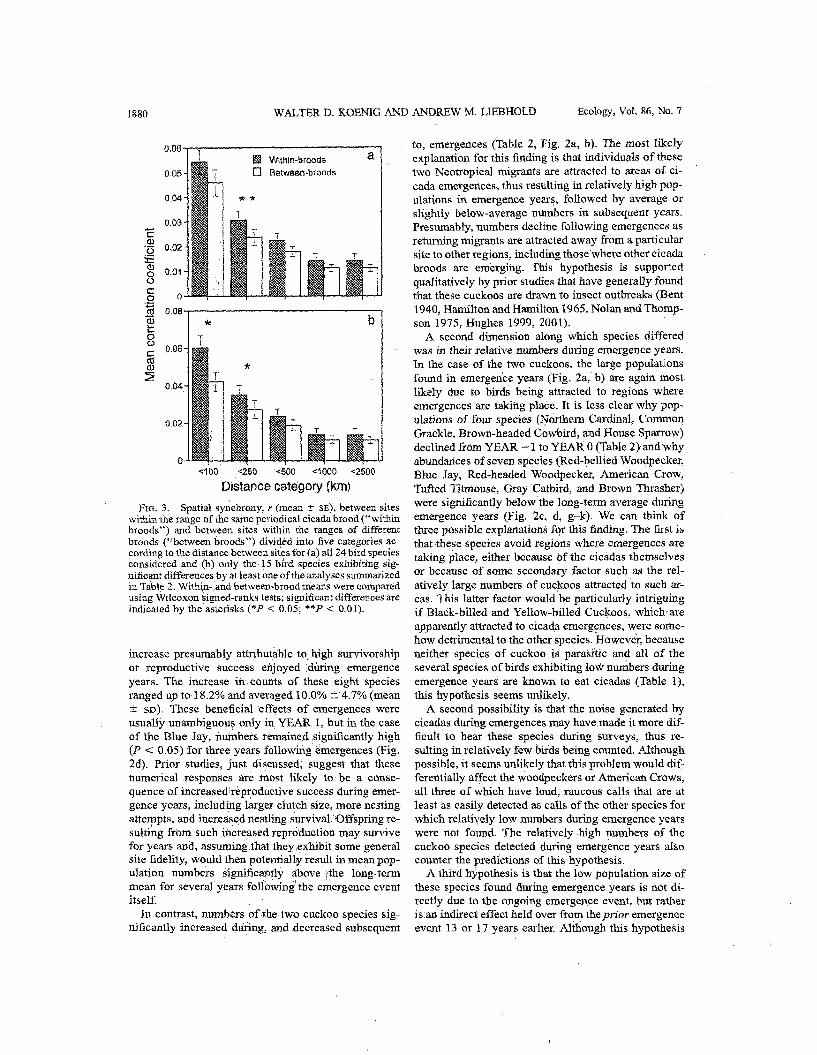
Plots of the estimated marginal means vs. years to or since emergence for these 15 species suggest at least four major patrems (Fig. 2). See Table 1 for all sci- entific names. The first, exhibited by the two cuclcoos (Fig. 2a, b), involved population abundances that jumped to significantly high levels in emergence years and subsequently declined to average, and by YEAR 5 below-average, values. In both cases, the declines following emergence were supported by the strong in- crease in birds counted in YEAR 0 compared to YEAR: - 1 and subsequent highly significant decrease in birds counted in YEAR 1 compared to YEAR 0, with the changes being >40% for the ~iack-billed and 17% for the Yellow-billed Cuckoo (Table 2). The two species declined an average of 29.4% from YEAR 0 to YEAR 1.
In the second pattern, exhibited by the Red-bellied Woodpecker (Fig. 2c), Blue Jay (Fig. 2d), Commqn Grackle (Fig. 2e), and Brown-headed Cowbird (Fig. 2f), populations were average or below average in the year prior to emergences and increased in YEAR 1 to values that were significantly above the long-term mean. Abundance then remainpd significantly above average in all species, exceptUthe Common Grackle, through YEAR 2 and, in the case of the Blue Jay, through YEAR 3, after which they declined to average
July 2005 PERIODICA~. CICADAS AND BIRD POPULATIONS 1877
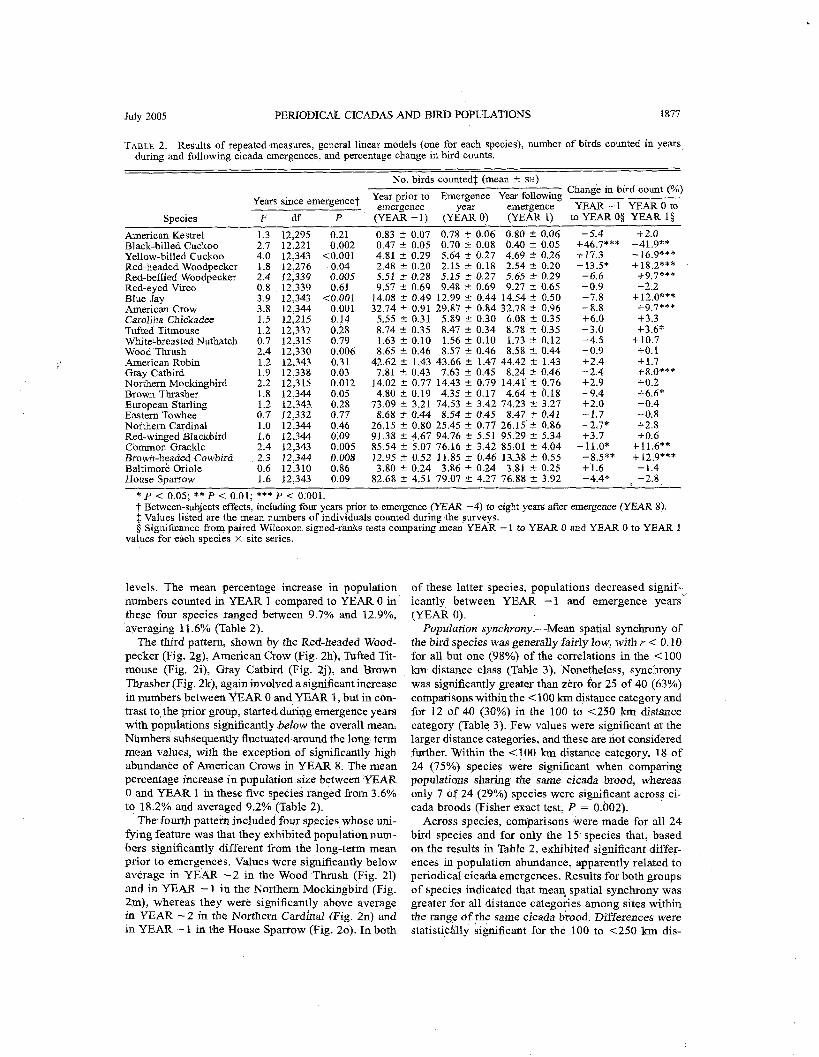
TABLE 2. Results of repeated-measures, general linear models (one for each species), number of birds counted in years during and following cicada emergences, and percentage change in bird counts.
No. birds countedi (mean t SE) . . Changk in bird count (%)
Years since emergence+ Year prior to Emergence Year following emergence yeaf emergence YEAR - 1 YEAR 0 to
American Kestrel 1.3 12,295 0.21 Black-billed Cuckoo 2.7 12,221 0.002 Yellow-billed Cuckoo 4.0 12,343 <O.OOl Red-headed Woodpecker 1.8 12,276 0.04 Red-bellied Woodpecker 2.4 12,339 0.005 Red-eyed Vireo 0.8 12,339 0.61 Blue Jay 3.9 12,343 <0.001 American Crow 3.8 12,344 0.001 Carolina Chickadee 1.5 12,215 0.14 Tufted Titmouse 1.2 12,337 0.28 White-breastedNuthatch 0.7 12,315 0.79 Wnnd Thrush 2.4 12.330 0.006 . - - - .- .. . -. American Robin 1.2 i2:343 0.31 42.62 t 1.43 43.66 + 1.47 44.42 2 1.43 +2.4 +1.7 Gray Catbird 1.9 12,338 0.03 7.81 5 0.43 7.63 t 0.45 8.24 2 0.46 -2.4 +KO*** Northern Mockingbird 2.2 12,315 0.012 14.02 t 0.77 14.43 t 0.79 14.41 t 0.76 +2.9 +0.2 - Brown Thrasher 1.8 12.344 0.05 4.80 + 0.19 4.35 t 0.17 4.64 2 0.18 -9.4 i6.6' European Starling 1.2 12,343 0.28 73.09 t 3.21 74.53 + 3.42 74.23 2 3.27 +2.0 -0.4 Eastern Towhee 0.7 12,332 0.77 8.68 + 0.44 8.54 2 0.45 8.47 r 0.41 -1.7 -0.8 Northern Cardinal 1.0 12,344 0.46 26.15 t 0.80 25.45 + 0.77 26.15 2 0.86 -2.7* +2.8 Red-wmnged Blackbird 1.6 12,344 0.09 91.38 t 4.67 94.76 t 5.51 95.29 t 5.34 i3.7 +0.6 Common Grackle 2.4 12,343 0.005 85.54 t 5.07 76.16 t 3.42 85.01 r 4.04 -11.0* +11.6** Brown-headed Cowbird 2.3 12,344 0.008 12.95 t 0.52 11.85 2 0.46 13.38 t 0.55 -8.5** +12.9*** Baltimore Oriole 0.6 12,310 0.86 3.80 + 0.24 3.86 t 0.24 3.81 t 0.25 +1.6 -1.4 House Sparrow 1.6 12,343 0.09 82.68 t 4.51 79.07 t 4.27 76.88 t 3.92 -4.4* * -2.8
* P < 0.05; ** P < 0.01; *** P < 0.001. 7 Between-subjects effects, including four years prior to emergence (YEAR -4) to eight years after emergence (YEAR 8). $ Values listed are the mean numbers of individuals counted during the surveys. (i Significance from parred Wilcoxon s~gned-ranks tests comparing mean YEAR -1 to YEAR 0 and YEAR 0 to YEAR 1
values for each species X site series.
levels. The mean percentage increase in population numbers counted in YEAR 1 compared to YEAR 0 in these four species ranged between 9.7% and 12.9%, averaging 1 1.6% (Table 2)
The third pattern, shown by the Red-headed Wood- pecker (Fig. 2g), American Crow (Fig. 2h), Tufted Tit- mouse (Fig. 2i), Gray Catbird (Fig. 2j), and Brown Thrasher (Fig. 2k), again involved a significant increase in numbers between YEAR 0 and YEAR 1, but in con- trast to the prior group, started during emergence years with populations significantly below the overall mean. Numbers subsequently fluctuated around the long-term mean values, with the exception of significantly h~gh abundance of American Crows in YEAR 8. The mean percentage increase in population size between YEAR 0 and YEAR 1 in these five species ranged from 3.6% to 18.2% and averaged 9.2% (Table 2).
The fourth pattern includea four species whose mi- fying feature was that they exhibited population nurn- bers significantly different from the long-term mean prior to emergences. Values were significantly below average in YEAR -2 in the Wood Thrush (Fig. 21) and in YEAR - 1 in the Northern Mockingbird (Fig. 2m), whereas they were significantly above average in YEAR -2 in the Northern Cardinal (Fig. 2n) and m YEAR - 1 in the House Sparrow (Fig. 20). ln both
of these latter species, populations decreased signif-, icantly between YEAR -1 and emergence years (YEAR 0).
Population synchrony.-Mean spatial synchrony of the bird species was generally fairly low, with r < 0.10 for all but one (98% of the correlations in the <I00 lun distance class (Table 3). Nonetheless, synclhrony was significantly greater than zero for 25 of 40 (63%) comparisons within the < 100 km distance category and for 12 of 40 (30%) in the 100 to <250 Ian distance category (Table 3). Few values were significant at the larger distance categories, and these are not considered further. Within the <I00 km distance category. 18 of 24 (75%) species were significant when comparing populations sharing the same cicada brood, whereas only 7 of 24 (29%) species were significant across ci- cada broods (Fisher exact test, P = 0.002).
Across species, comparisons were made for all 24 bird species and for only the 15 species that, based on the results in Table 2, exhibited significant differ- ences in population abundance, apparently related to periodical cicada emergences. Results for both groups of species indicated that mean spatial synchrony was greater for all distance categories among sites within the range of the same cicada brood. Differences were statistidlly significant for the 100 to <250 km dis-
1878 WALTER D. KOEMG AND ANDREW M. LIEBHOLD Ecology, Vol. 86, No. 7
Years to or since emergence
Frcr. 2. Standardized population abundance (mean and 95% confidence interval) vs. years since cicada emergence (YEAR -4 to YEAR 8) for the 15 bird species whose populations during these years were significantly related to years since emergence in a general linear model, or whose populations changed significantly in the year before or year after emergences (Table 2). Values are plotted in reference to emergences of the local periodical cicada brood; arrows designate emergence years (YEAR 0). For species codes and sample sizes, see Table 1.
tance class using all species, and for both the <lo0 km and 100 to <250 km distance classes using only the 15 species apparently influenced by cicada emer- gences (Fig. 3). Among these latter species, synchrony between sites < 100 km apart sharing the same brood was, on average, 42.7% greater than between sites a similar distance apart but not sharing the same cicada brood.
These results provide strong observational evidence that periodical cicada emergences have significant ef- fects on populations of a variety of key avian predators. Of the 24 bird species considered, 12 (50%) yielded significant evidence that population abundance varied over the length of the cicada cycle; 13 (54%) exhibited
July 2005 PERIODICAL CICADAS AND BIRD POPULATIONS 1879
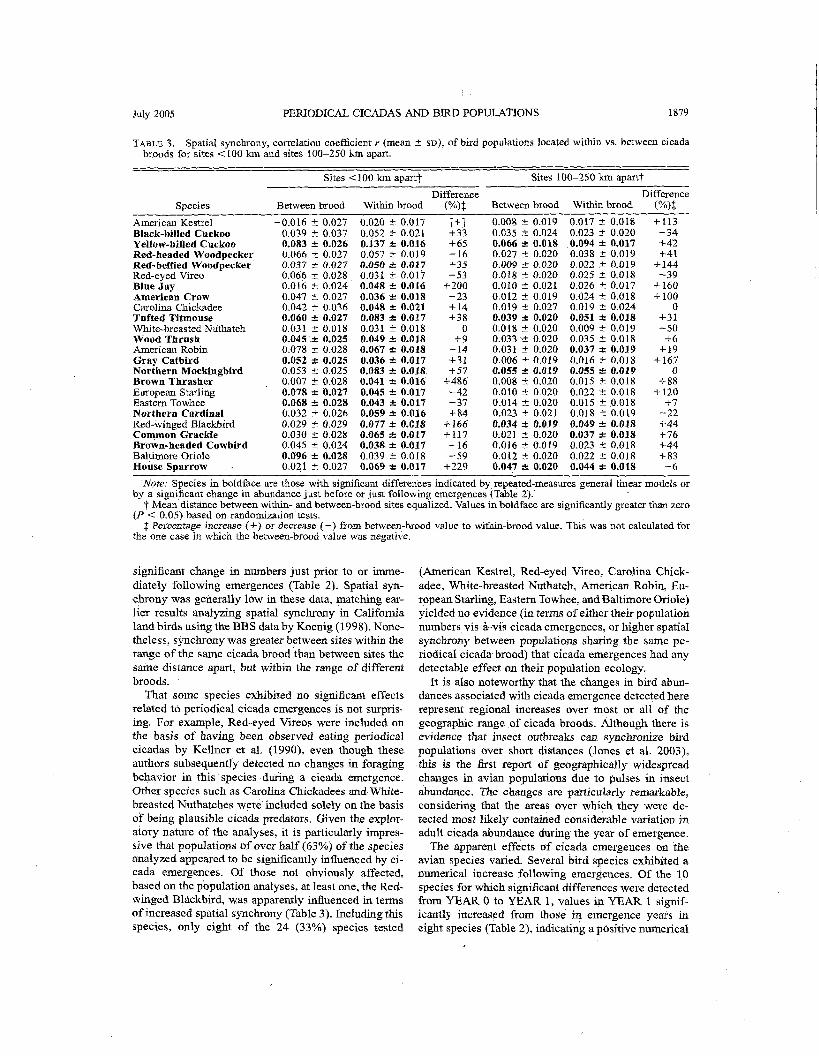
TABLE 3. Spatial synchrony, correlation coefficient r (mean t SD), of bird populations located within vs. between cicada broods for sites <I00 km and sites 100-250 km apart.
Sites 4 100 km apart? Sites 100-250 km apartt
Difference Difference Species Between brood Within brood (O/n)$ Between brood Within brood (%)f
American Kestrel -0.016 t 0.027 0.020 2 0.017 [+] 0.008 r 0.019 0.017 + 0.018 +I13 Black-billed Cuckoo 0.039 rt 0.037 0.052 rt 0.021 +33 0.035 t 0.024 0.023 1'- 0.020 -34 Yellow-billed Cuckoo 0.083 + 0.026 0.137 + 0.016 +65 0.066 k 0.018 0.094 * 0.017 +42 Red-headed Woodpecker 0.066 rt 0.027 0.057 t 0.019 -16 0.027 C 0.020 0.038 2 0.019 +41 Red-bellied Woodpecker 0.037 2 0.027 0.050 & 0.017 +35 0.009 2 0.020 0.022 ? 0.019 4-144 Red-eyed Vireo 0.066 + 0.028 0.031 + 0.017 -53 0.018 2 0.020 0.025 2 0.018 -39 Blue Jay 0.016 + 0.024 0.048 r 0.016 +200 0.010 t 0.021 0.026 t 0.017 +I60 American Crow 0.047 2 0.027 0.036 r 0.018 -23 0.012 C 0.019 0.024 t 0.018 +I00 Carolina Chickadee 0.042 t 0.036 0.048 k 0.021 +14 0.019 + 0.027 0.019 t 0.024 0 Tufted Titmouse 0.060 & 0.027 0.083 + 0.017 +38 0.039 + 0.020 0.051 + 0.018 +31 White-breasted Nuthatch 0.031 2 0.018 0.031 t 0.018 0 0.018 t 0.020 0.009 rt 0.019 -50 Wood Thrush 0.045'r 0.025 0.049 + 0.018 +9 0.033.a 0.020 0.035 rt 0.018 +6 American Robin 0.078 + 0.028 0.067 & 0.018 -14 0.031 % 0.020 0.037 * 0.019 4.19 Gray Catbird 0.052 -c 0.025 0.036 & 0.017 +31 0.006 ? 0.019 0.016 2 0.018 +I67 Northern Mockingbird 0.053 t 0.025 0.083 & 0.018 +57 0.055 +. 0.019 0.055 % 0.019 0 Brown Thrasher 0.007 t 0.028 0.041 * 0.016 +486 0.008 2 0.020 0.015 2 0.018 +88 European Starling 0.078 + 0.027 0.045 + 0.017 -42 0.010 2 0.020 0.022 t 0.018 +I20 Eastern Towhee 0.068 + 0.028 0.043 + 0.017 -37 0.014 -C 0.020 0.015 C 0.018 +7 Northern Cerdinal 0.032 t 0.026 0.059 + 0.016 +84 0.023 It 0.021 0.018 t 0.019 -22 Red-winged Blackbird 0.029 2 0.029 0.077 + 0.018 +I66 0.034 + 0.019 0.049 & 0.018 +44 Common Grackle 0.030 t 0.028 0.065 + 0.017 +I17 0.021 2 0.020 0.037 & 0.018 +76 Brown-headed Cowbird 0.045 t 0.024 0.038 2 0.017 -16 0.016 +- 0.019 0.023 t 0.018 +44 Baltimore Oriole 0.096 -c 0.028 0.039 2 0.018 -59 0.012 2 0.020 0.022 t 0.018 +83 House Sparrow 0.021 + 0.027 0.069 r 0.017 +229 0.047 -c 0.020 0.044 2 0.018 -6
Note: Species in boldface are those with significant differences indicated by repeated-measures general linear models or by a significant change in abundance just before or just following emergences (Table 2).'
7 Mean distance between within- and between-brood sites equalized. Values in boldface are significantly greater than zero (P < 0.05) based on randomization tests.
$ Percentage increase (+) or decrease (-) from between-brood value to within-brood value. This was nbt calculated for the one case in which the between-brood value was negative.
significant change in numbers just prior to or imme- diately following emergences (Table 2). Spatial syn- chrony was generally low in these data, matching ear- lier results analyzing spatial synchrony in California land buds using the BBS data by Koenig (1998). None- theless, synchrony was greater between sites within the range of the same cicada brood than between sites the same distance apart, but within the range of different broods.
That some species exhibited no significant effects related to periodical cicada emergences is not surpris- ing. For example, Red-eyed Vireos were included on the basis of having been observed eating periodical cicadas by Kellner et al. (1990), even though these authors subsequently detected no changes in foraging behavior in this species during a cicada emergence. Other species such as Carolina Chickadees and White- breasted Nuthatches were included solely on the basis of being plausible cicada predators. Given the explor- atory nature of the analyses, it is particularly impres- sive that populations of over half (63%) of the species ahalyzed appeared to be significantly influenced by ci- cada emergences. Of those not obviously affected, based on the population analyses, at least one, the Red- winged Blhclcbird, was apparently influenced in terms of increased spatial synchrony (Table 3). Including this species, only eight of the 24 (33%) species tested
(American Kestrel, Red-eyed Vireo, Carolina Chick- adee, White-breasted Nuthatch, American Robin, Eu- ropean Starling, Eastern Towhee, and Baltimore Oriole) yielded no evidence (in terms of either their population numbers vis-8-vis cicada emergences, or higher spatial synchrony between populations sharing the same pe- riodical cicada brood) that cicada emergences had any detectable effect on their population ecology.
It is also noteworthy that the changes in bird abun- dances associated with cicada emergence detected here represent regional increases over most or all of the geographic range of cicada broods. Although there is evidence that insect outbreaks can synchronize bird populations over short distances (Jones et al. 2003), this is the first report of geographically widespread changes in avian populations due to pulses 1 h insect abundance. The changes are particularly remarkable, considering that the areas over which they were de- tected most likely contained considerable variation in adult cicada abundance during the year of emergence.
The apparent effects of cicada emergences on the avian species varied. Several bird species exhibited a numerical increase following emergences. Of the 10 species for which significant differences were detected from YEAR 0 to YEAR 1, values in YEAR 1 signif- icantly increased from those $ emergence years in eight species (Table 2), indicating a positive numerical
WALTER D. KOENIG AND ANDREW M. LIEBHOLD Ecology, Vol. 86, No. 7
Distance category (km) Fre. 3. Spatial sy~chrony, r (mean 2 SE), between sites
within the range of the same periodical cicada brood ("within broods") and between sites within the ranges of different broods ("between broods") divided into five categories ac- cording to the distance between sites for (a) all 24 birdspecies considered and (b) only the 15 bkd species exbibiting sig- nificant differences by at least one of the amlyses summarized in Table 2. within-land between-broodmeans were compared using Wilcoxon 'signed-ranks tests; significant differences are indicated by the asterisks (*P < 0.05; **P < 0.01).
increase presumably attributable to high survivorship or reproductive success enjoyed during emergence years. The increase in counts of these eight species rangedup to 18.2% and averaged 10.0% 1 4.7% (mean F SD) These beneficial effects of emergences were usually unambiguous only in m A R 1, but in the case of the Blue Jay, numbers remained significantly high (P < 0.05) for three years following emergences (Fig. 2d). Prior studies, just discussed, suggest that these numerical responses are most likely to be a conse- quence of increased reproductive success during emer- gence years, includmg larger clutch size, more nesting attempts, and increased nestling survival. Offspring re- sulting from such increased reprotluction may survive for years and, assuming that they {exhibit some general site fidelity, would then potentially result in mean pop- ulation numbers significwtly above ,the long-term mean for several years following the emergence event itself.
In contrast, numbers of the two CUC~COO species sig- nificantly increased dding, and )decreased subsequent
to, emergences (Table 2, Fig. 2a, b). The most likely explanation for this finding is that individuals of these two Neotropical migrants are attracted to areas of ci- cada emergences, thus resulting in relatively high pop- ulations in emergence years, followed by average or sIightly below-average nmbers in subsequent years. Presumably, numbers decline following emergences as returning migrants are attracted away from a particular site to other regions, including those where other cicada broods are emerging. Tbis hypothesis is supported qualitatively by prior studies that have generally found that these cuckoos are drawn to insect outbreaks (Bent 1940, Hamilton and Hamilton 1965, Nolan and Thomp- son 1975, Hughes 1999, 2001).
A second dimension along which species differed was in their relative numbers during emergence years. In the case of the two cuclcoos, the large populations found in emergence years (Fig. 2a, b) are again most likely due to birds being attracted to regions where emergences are taking place. It is less clear why pop- Illations of four species (Northern Cardinal, Common Grackle, Brown-headed Cowbird, and House Sparrow) declined from YEAR - 1 to YEAR 0 (Table 2) and why abundances of seven species (Red-bellied Woodpecker, Blue Jay, Red-headed Woodpecker, American Crow, Tufted Titmouse, Gray Catbird, and Brown Thrasher) were significantly below the long-term average during emergence years (Fig. 2c, d, g-lc). We can think of three possible explanations for this finding. The first is that these species avoid regions where emergences are taking place, either because of the cicadas themselves or because of some secondary factor such as the reY- atively large numbers of cucl<oos attracted to such ar- eas. This latter factor would be particularly intriguing if Black-billed and Yellow-billed Cuckoos, which are apparently attracted to cicada emergences, were some- how detrimental to the other species. However, because neither species of cuckoo is parasitic and all of the several species of birds exhibiting low numbers during emergence years are known to eat cicadas (Table l), this hypothesis seems unlikely.
A second possibility is that the noise generated by cicadas during emergences may have made it more dif- ficult to hear these species during surveys, thus re- sulting in relatively few birds being counted. Although possible, it seems unlikely that this problem would dif- ferentially affect the woodpeckers or American Crows, all three of which have loud, raucous calls that are at least as easily detected as calls of the other species for which relatively low numbers during emergence years were not found. The relatively high numbers of the cuckoo species detected during emergence years also counter the predictions of this hypothesis.
A third hypothesis is that the low population size of these species found during emergence years is not di- rectly due to the ongoing emergence event, but rather is an indirect effect held over from the prior emergence event 13 or 17 years earlier, Although this hypothesis
July 2005 PERIODICAL CICADAS AND BIRD POPULATDNS 1881
is speculative, it is worth considering that the primary adaptive benefit of the extraordinary life cycle of pe- riodical cicadas is presumably to decrease predation on adults (Lloyd and Dybas 1966h, Hoppensteadt and Kel- ler 1976, Bulmer 1977, May 1979, Karban 1982, Wil- liams and Simon 1995, It6 1998), and that this goal would be most effectively achieved if the cicada life cycle not only eliminated the opportunity for predators to track cycles, but also initialed a long-term population cycle in predators themselves that culminated in rela- tively low numbers 13 or 17 years later, when the next emergence took place.
However, even with the data considered here, it ap- pears that the demographic consequences of emer- gences may persist for several years, and are detectable both in the abundance and population synchrony of a large percentage of the terrestrial avifauna. In the case of the Blue Jay, this takes the form of relatively high numbers 1-3 years post-emergence (Fig. 2d). In the case of at least the two cuclcoos, high numbers either during or just after emergences are followed by de- clining populations and relatively low numbers 4-7 years post-emergence (Fig. 2a, b). These results indi- cate that, at least in some species, the effects of cicada emergences are detectable years after the event itself. The large pulse of microbial biomass and nitrogen po- tentially provided by cicada carcasses to forest soils following emergences provides a plausible mechanism for such persistent "bottom-up" effects (Yang 2004).
These results are surprising, to the extent that prior studies have generally failed to detect evidence that cicada emergences affect the behavior or demography of other species in their communities. For example, a detailed study of an emergence of brood XIX in the Ozarks found little change in the foraging behavior of insectivorous birds attributable to the emergence (Kell- ner et al. 1990), and the emergence failed to result in any detectable ecological release among other arthro- pod prey within the forest (Stephen et al. 1990). This same study estimated that periodical cicadas contrib- uted <1% to the total nutrient flux of the ecosystem (Wheeler et al. 1992), although higher densities of ci- cadas can clearly represent much higher nutrient fluxes (Yang 2004).
More recently, Koenig and Liebhold (2003) found the effects of periodical cicadas on growth of the oaks on which they feed to be significant during emergence years, decreasing radial growth by 4% on a regional scale. This "top-down" effect of cicada emergences is modest compared to the "bottom-up" effect on avian predators found here, where emergences were followed by increases in populations of eight bird species by an average of 10.1%, and decreases in the two cuckoo species by an average of 29.4%.
Also significant were the effects of periodical cicada emergences on spatial synchrony. Although synchrony was generally low, it was nonetheless significantly greater than zero in the majority (75%) of bird species
between sites <lo0 km apart when comparing sites sharing the same cicada brood. Such sites were 4.3% more synchronous, on average, than sites within the range of different broods, when comparing the 15 spe- cies that otherwise provided some evidence of being influenced by cicada emergences (Fig. 3). Spatial syn- chrony previously has been documented in a vkriety of avian populations (Small et al. 1993, Ranta et al. 1995a, h, Koenig 1998, 2001a, h, Paradis et al. 2000, Bellamy et al. 2003, Jones et al. 2003), 'where it has, in many cases, been attributed to synchronous fluctu- ations in the availability of food, including insects. Although other factors, particularly environmental syn- chrony (the Moran effect), may in many cases be an important synchronizing force (Hudson and Cattadori 1999, Koenig 2002, Liebhold et al. 2004), the results found here support the hypothesis that food can be responsible for significant fraction of observed syn- chrony in at least some avian populations.
In summary, periodical cicada emergences are a pulsed resource with significant consequences both to their hosts down, and to their predators up, the food chain. Clearly, emergences should be taken into ac- count when measuring and interpreting long-term trends of several of the most common bird species with- in the range of periodical cicadas, because observed trends are likely to be driven, at least in part, by emer- gences and their ecological aftermath.
We thank K. Cottingham and the reviewers for their com- ments, E. Luzader for technical assistance, and all those who have contributed to the Breeding Bird Survey, without which these analyses would not have been possible. This work was partially conducted as part of the Masting Dynamics Working Group supported by the National Center for Ecological Anal- ysis and Synthesis, a center funded by the National Science Foundation and the University of California, Santa Barbara, California, USA.
Alexander, R. D., and T. E. Moore. 1958. Studies on the acoustical behavior of seventeen-year cicadas (Homoptera: Cicadidae: Magicicada). Ohio Journal of Science 58: 107- 127.
Anderson, T. R. 1977. Reproductive responses of s'parrows to a superabundant food supply. Condor 79:205-208.
Bellamy, P. E., P. Rothery, and S. A. Hinsley. 2003. Syn- chrony of woodland bird populations: the effect of land- scape structure. Ecogaphy 26:338-348.
Bent, A. C. 1940. Life histories of North American cuckoos, goatsuckers, hummingbirds and their allies. U.S. National Museum Bulletin 176.
Bjerrnktad, 0. N., R. A. Ims, and X. Lambin. 1999. Spatial population dynamics: analysing patterns and processes of population synchrony. Treilds in Ecology 'and Evolution 14: 427-43 1.
Bulmer, M. G. 1977. Periodical insects. American Naturalist 111: 1099-11 17.
Bystrack, D. 1981. The North American breeding bird sur- vey. Studies in Avian Biology 6:34-41.
Dybas, H. S., and D. D. Davis. 1962. A population census of seventeen-year periodical cicadas (Homoptera: Cicadi- dae: Magicicada). Ecology 43:432-443.
1882 WALTER D. KOENIG AND A N D R Y M. LIEBHOLD Ecology, Vol. 86, No. 7
Hamilton, W. J., 111 and M. E. Hamilton. 1965. Breeding characteristics of yellow-billed cuclcoos in .Arizona. Pro- ceedines of the California Academy of Sciences 32:405- - 432.
Heliovaara, K., R. Vaisanen, and C. Simon. 1994. Evolu- tionary ecology of periodical insects. Trends in Ecology and Evolution 9:475-480.
Hoppensteadt, F. C., and J. B. Keller. 1976. Synchronization of periodical cicada emergences. Science 194:335-337.
Howard, W. J. 1937. Bird behavior as a result of emergence of seventeen-year locusts. Wilson Bulletin 49:43-44.
Hudson, P. J., and I. M. Cattadori. 1999. The Moran effect: a cause of population synchrony. Trends in Ecology and Evolution 14: 1-2.
Hughes, J. M. 1999. Yellow-billed cuclcoo (Coccyzus amer- icanus). In A. Poole and F. Gill, editors. The birds of North America, Number 418. The Birds of North America, Phil- adelphia, Pennsylvania, USA,
Hughes, J. M. 2001. Black-billed cuclcoo (Coccyzur erythrop- thalmus). In A. Poole and F. Gill, editors. The birds ofNorth America, Number 587. The Birds of North America,,Phil- adelphia, Pennsylvania, USA.
It& Y. 1998. Role of escape from predators in periodical cicada (Homoptera: Cicadidae) cycles. Annals of the En- tomological Society of America 91:493-496.
Jones, J., P. J. Doran, and R: T. Holmes. 2003. Climate and food synchronize regional forest bird abundances. Ecology 84:3024-3032.
Karban, R 1'980. Periodical cicadanymphs imposeperiddical oak tree wood accumulation. Nature 287:326-327.
Karban, R. 1982. Increased reproductive success ,at high den- sities and predator satiation for periodical cicadas. Ecology 63:321-328.
Kellner, C. J., K. G. Smith, N. G. Willcinson, andb. A. James. 1990. Influence of periodical cicadas on foraging behavior of insectivbrous birds ia an Ozark forest. Studies in Avian Biology 13;375-380.
Koenig, W. D. 1998. Spatial autocorrelation in California land birds. Conservation Biology 12:612-620.
Koenig, W. D. 1999. Spatial autocorrelation of ecological phenomena. Trends in Ecology and Evolution 14:22-25.
Kctenig, W. D. 2001~. Spatial autocorrelation and local dis- appearances in wintering North American birds. Ecology 82:2636-2644.
Koenig, W. D. 2001b. Synchrony andperiodicity of eruptions by boreal birds. Condor 103:725-735.
Koenig, W. D. 2002. Globalpatterns of environmental syn- chrony and the Moran effect. Ecography 251283-288.
Koenig, W. D., and A. M. Liebhold. 2003. Regional impacts of periodical cicadas on oak radial increment. Canadian Journal of'forest Research 33:1084-1089.
KroNe, D. T., T.%J. Couillard, and J. C. Riddle. 1991. Pop- ulaiion responses of Peromy.~cu.s leucopus and Blarina brevicauda to emergence of periodical cicadas. American Midland'Naturalist.126:3 17-31 1.
Liebhold, A. M., W. D. Koenig, and 0. N. Bjmnstad. 2004. Spatial synchrony in population dynamics. Annual Review of Ecology, Evolution, and Systematics 35:467-490.
Lloyd, M., and H. S. Dybas. 1966a. The periodical cicada problem. I. Population~ecology. Evolution 20:133-149.
Lloyd, M., and H. S. Dybas. 19666. The periodical cicada problem. 11. Evolution. Evolution 20:466-505.
Marlatt, C. L. 1907. The periodical cicada. Bulletin of the USDA Bureau of Entomology 71: 1-181.
Marshall, D. C., and J. R. Cooley. 2000. Reproductive char- acter displacement and speciation in periodical cicadas, with description of a new species, 13-year Mugicicada neo- tredecim. Evolution 54: 13 13-1325.
May, R. M. 1979. Periodical cicadas. Nature 277:347-349. Nolan, V., and C. F. Thompson. 1975. The occurrence and
significance of anomalous reproductive activities in two North American non-parasitic cuckoos. Ibis 117:496-503.
Ostfeld, R S., and F. Keesing. 2000. Pulsed.resources and hommunity dynamics of consumers in terrestrial ecosys- tems. Trends in Ecology and Evolution 15:232-237.
Pace, M. L., J. J. Cole, S. R. Carpenter. and J. F. KitcheUl. 1999. Trophic cascades revealed in diverse ecosystems. Trends in Ecology and Evolution 14:483-488.
Paradis, E., S. R. Baillie, W. J. Sutherland, andR. D. Gregory. 2000. Spatial synchrony in populations of birds: effects of habitat, population trend, and spatial scale., Ecology 81: 2112-2125.
Ranta, E., V. Kaitala, J. Lindstrom, and H. Lindin. 1995a. Synchrony in population dynamics. Proceedings of the Royal Society of London, Series B 262: 113-1 18.
Ranta, E., J. Lindstrom, and H. Lindbn. 19956. Synchrony in tetraonid population dynamics. Journal of Animal Ecol- ogy 64: 767-776.
Riis, P. B. 1940. "Undesirable" birds and seventeen-year locust. Audubon Bulletin 35: 10-13.
Simon, C. 1988. Evolution of 13- and 17-year periodical cicadas (Homoptera: Cicadidae: Magicicada). Bulletin of the Entomological Society of America 34: 163-176.
Small, R. J., V. Marcstrom, and T. Willebrand. 1993. Syn- chronous and nonsynchronous population fluctuations of some uredators and their urev in central Sweden. Ecoera-
A .
phy 1;:360-364. -
SPSS. 1999. SPSS Base 10.0 applications guide. SPSS, Chi- - - - cage, Illinois, USA.
Stephen, F. M., G. W. Wallis, and K. G. Smith. 1990. Bird predation on periodical cicadas in Ozarlcforests: ecological release for other canoov arthrooods? Studies in Avian Bi- -. ology 13:369-374.
Steward, V. B., K. G. Smith, and F. M. Stephen. 1988. Red- winged blackbird predation on periodicA cicadas (Cicad- ~dae: Magicicada spp.): bird behavior and cicadaresponses. Oecolog~a 76:348-352.
Strehl, C . E., and J. White. 1986. Effects of superabundant food on breeding success and behavior of the red-winged blackbird. Oecologia 70: 178-186.
Wheeler, G. L., K. S. Williams, and K. G. Smith. 1992. Role of periodical cicadas (Homoptera: Cicadidae: Mugicicada) in forest nutrient cycles. Forest Ecology and Management 51:339-346.
Williams. K. S.. and C. Simon. 1995. The ecoloev. behavior. and evolution of periodical cicadas. Annual ~ K i e w of tomology 40:269-295.
Williams, K. S., K G. Smith, and F. M. Stephen. 1993. Emer- gence of 13-yr periodical cicadas (~icadidae: Magicicada): phenology, mortality, and predator satiation. Ecology 74: 1143-1 152.
Yang, L. H. 2004. Periodical cicadas as resource pulses in North American forests. Science 306: 1565-1 567.