Effects of mussel farming on sedimentation rates, oxygen ... · Sedimentation rates Sedimentation...
17
Linda Svanberg Degree project for Master of Science (One Year) in Biology 30 hec Department of Marine Ecology University of Gothenburg Contribution number 354 Effects of mussel farming on sedimentation rates, oxygen consumption and carbon content in the underlying sediment ‐ a case study
Transcript of Effects of mussel farming on sedimentation rates, oxygen ... · Sedimentation rates Sedimentation...
Linda Svanberg
Degree project for Master of Science (One Year) inBiology30 hec
Department of Marine EcologyUniversity of Gothenburg
Contribution number 354
Effects of mussel farming on sedimentationrates, oxygen consumption and carbon
content in the underlying sediment‐ a case study

This master thesis has been carried out at the University of Gothenburg, in collaboration with the Royal Swedish Academy of Sciences, at the Sven Lovén Centre for Marine Sciences – Kristineberg. Supervisor: Docent Odd Lindahl at the Royal Swedish Academy of Sciences Examiner: Professor Susanne Baden at the University of Gothenburg
1
Table of Contents Abstract ............................................................................................................................................... 2
Introduction......................................................................................................................................... 2
Background ............................................................................................................................................... 2
Mussels and mussel farming..................................................................................................................... 2
Benthic mineralization of organic material............................................................................................... 3
Aims of the study ...................................................................................................................................... 3
Materials and methods........................................................................................................................ 4
Sampling sites ........................................................................................................................................... 4
Sedimentation rates.................................................................................................................................. 4
Benthic oxygen fluxes ............................................................................................................................... 5
Sediment profile images ........................................................................................................................... 6
Enrichment of organic material ................................................................................................................ 6
Results................................................................................................................................................. 7
Sedimentation rates.................................................................................................................................. 7
Benthic oxygen fluxes ............................................................................................................................... 7
Sediment profile images ........................................................................................................................... 8
Enrichment of organic material ................................................................................................................ 8
Discussion............................................................................................................................................ 8
Sedimentation rates.................................................................................................................................. 8
Benthic oxygen fluxes ............................................................................................................................. 11
Enrichment of organic material .............................................................................................................. 12
Conclusions........................................................................................................................................ 12
Acknowledgements................................................................................................................................. 13
References .............................................................................................................................................. 14
2
Abstract The effect of long line mussel farms on sedimentation rates and oxygen consumption in
the underlying sediments was investigated in the autumn of 2006, at two locations in the Lysekil archipelago. The mussels gave rise to an increased organic load to the benthic system through egestion of faeces and pseudo‐faeces. The average total carbon sedimentation rate was 3,7 times higher than at the reference sites. This resulted in higher oxygen consumption in the sediment as well as higher nutrient effluxes from the sediment to the water column. At one of the farm sites, the oxygen consumption was 4,5 times higher than at the associated reference site and the sediment was reduced all the way to the surface. This indicates that the site might not be well suited for extensive mussel farming. As for the other mussel site, it had had less of an impact on the underlying sediment compared to the reference site, with an oxygen consumption 2,2 times higher than the reference and a well oxidised sediment. However, due to a large difference in mussel stock between the farms, the relative suitability of the sites could not be evaluated.
Introduction Background
The anthropogenic input of nitrogen and phosphorus to the Swedish seas has increased two‐fold and four‐fold respectively since the mid 19th century (Andersen et al. 2001). The increase has resulted in eutrophication, a phenomenon first acknowledged in the 1960s, with symptoms such as massive algal blooms and development of littoral mats of filamentous algae suffocating and decreasing the expansion of Fucus and eel grass beds (reviewed by Boesch et al. 2006). Actions have been taken to lower both point and diffuse inputs of anthropogenic nutrients and progress has been made. However, the problem is further complicated by the fact that the Swedish oceans have different properties and therefore require different, sometimes opposite, measures. The east coast is in desperate need of reduced levels of phosphorous in order to subdue the massive blooms of cyanobacteria that has been plaguing the Baltic Proper during summer in recent years. The West Sea, with Kattegatt and Skagerrak, on the other hand cries for reduced nitrogen loads (Boesch et
al. 2006). This makes the development of individual regional solutions as important as large scale national projects.
The County Administrative Board of Västra Götaland set a goal of lowering the amount of waterborne nitrogenous effluents to the Swedish coastal waters of Skagerrak to 18 % of the 1995 level before 2010 (Lindahl et al. 2005). One of the point sources in this region is Långevik sewage treatment plant in Lysekil which in 2006 released 39 t of nitrogen per year. As an alternative to expanding the nitrogen removal steps in this plant, Lysekils community, in a large scale pilot project, engaged a mussel farming company, Nordic Shell Production AB, to harvest 3900 t of blue mussels, Mytilus edulis, per year. Since nitrogen content in a live mussel is roughly 0,8 %, (ww, including shell) the potential removal would be 39 t of nitrogen (Lindahl, 2005). Mussels and mussel farming
Mussels are filter feeders and eat seston
of a wide size range. An 18‐month old blue mussel can filter 5 L of sea water in one hour, clearing it of particles ranging between 0,002 and 0,5 mm in size (Petersen
3
and Loo, 2004), and Lehane and Davenport (2006) recorded mussels feeding on zooplankton as big as 6 mm in size. Since mussel farming does not depend upon the adding of food pellets, but rather makes use of nutrients already available in the water column, mussel farms are considered to be less damaging to the environment than e.g. fish or shrimp farms. One ha of mussel farm, producing 300 t of mussels in 14‐18 months, consumes the primary production of a 25 ha area, thereby lowering the sedimentation of that area (Lindahl and Kollberg, 2009). The recruitment of new mussel stock is also non invasive since the larvae do not have to be reared or collected but are supplied naturally by advection. But despite this and even though the harvesting of mussels may result in an overall removal of nitrogen from the sea, the farms can through the egestion of faeces and pseudo‐faeces still give rise to an increased load of organic material to the local environment (e.g. Dahlbäck and Gunnarsson, 1981; Harstein and Stevens, 2005).
Benthic mineralisation of organic material
The particulate organic material that reaches the ocean floor can be decomposed either by aerobic or anaerobic oxidation. As oxygen is by far the most energy‐yielding electron acceptor, all breakdown of organic matter occur by aerobic respiration in the presence of oxygen (Canfield et al., 2005). The oxygen is transported into the sediment by way of diffusion or by irrigation and bioturbation by benthic fauna. However, shallow marine sediments are reducing environments and oxygen will only penetrate a couple of mm into the sediment. This is where the aerobic microorganisms are active and where most
of the oxygen consumption in the sediment takes place.
If the bottom water is well oxygenated, oxygen will be the ultimate electron acceptor of all oxidation of organic matter in the sediment. Even if most of the material will be oxidised anaerobically, almost all of the inorganic metabolites produced will be reoxidised within the sediment. Therefore, the benthic uptake of oxygen can be regarded as equivalent to the total sediment metabolism (Canfield et al. 2005).
Below the oxic surface layer degradation of organic material is performed by anaerobes using electron acceptors other than oxygen. As anaerobic decomposition rates are less efficient the organic material might escape microbial mineralisation and be buried. The extent to which aerobic oxidation occurs in marine sediments depend on factors such as sedimentation rates, depth of the water column, temperature and the degree of stratification and oxygenation of the water column. If the currents are insufficient to supply oxygenated water fast enough, the sediment surface will become anoxic and anaerobes such as the sulphur reducing bacteria Beggiatoa spp., will be the ones conducting the degradation of organic matter. An increase in organic load combined with insufficient water exchange could therefore lead to increased burial of organic carbon and associated nutrients (Canfield et al. 2005).
Aims of the study
The effects of mussel farms on sedimentation rates and biogeochemistry and faunal activity in the underlying sediment varies a great deal in different studies. Dahlbäck and Gunnarsson (1981) is
4
a classic example of a mussel farm inducing increased organic load and sulphur reduction in an underlying sediment, while Danovaro et al. (2004) found no effect on either sediment composition or oxygen penetration of the sediment under the mussel‐lines. Also, changes in nutrient fluxes in the sediment do not necessarily mean that the ecosystem is effected (Baudinet et al., 1990).
The effects of the mussel farms in Lysekil on the local environment were monitored by a research team, the Mussel Project, based at Sven Lovén Centre for Marine Sciences ‐ Kristineberg. From before the farms were established in May 2005, up till September 2006, the Mussel Project measured the changes in dissolved nutrients and oxygen fluxes in the benthic community at three farm sites with associated control areas. However, in order to calculate a nitrogen budget, and to get a clear picture of what actually caused the changes observed in the sediment, the input of organic material had to be quantified.
The aim of this study was to measure the increased sedimentation underneath the farms and see if a clear pattern could be discerned regarding the impact on oxygen consumption in the underlying sediment and the changes in quantity and quality of the organic content of the sediment. Materials and methods Sampling sites
Two mussel farms and associated reference sites monitored by the Mussel Project were chosen as study sites.
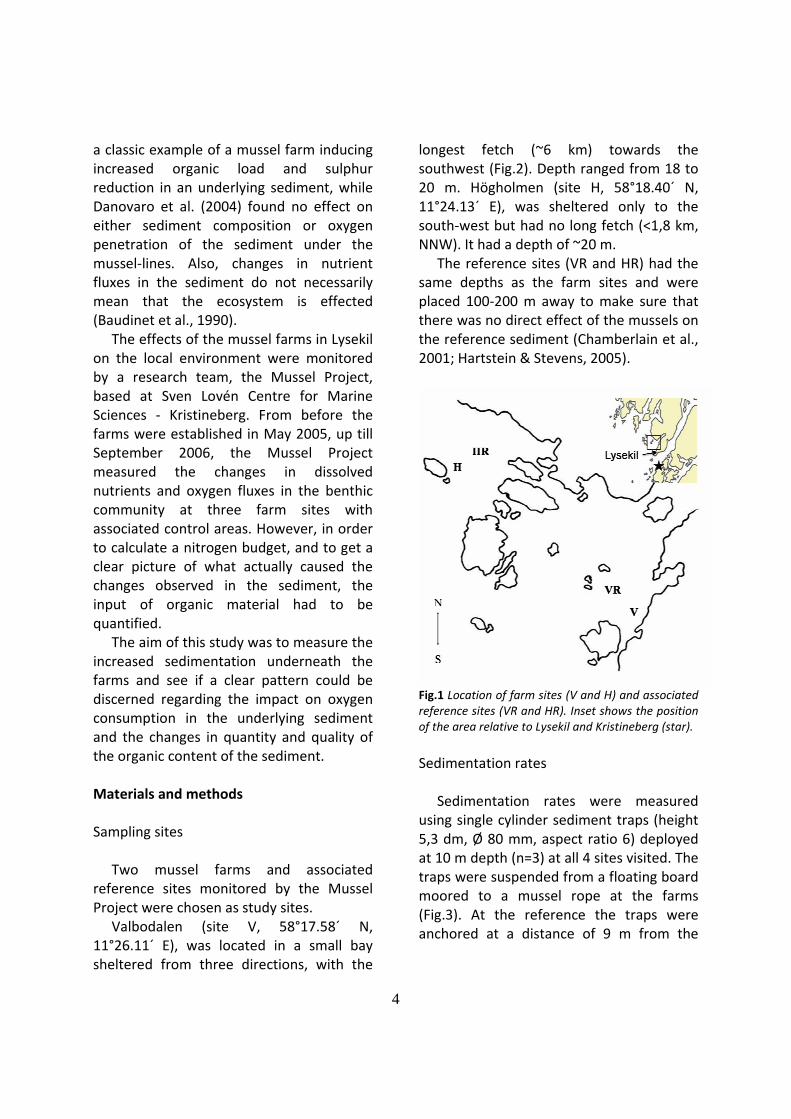
Valbodalen (site V, 58°17.58´ N, 11°26.11´ E), was located in a small bay sheltered from three directions, with the
longest fetch (~6 km) towards the southwest (Fig.2). Depth ranged from 18 to 20 m. Högholmen (site H, 58°18.40´ N, 11°24.13´ E), was sheltered only to the south‐west but had no long fetch (<1,8 km, NNW). It had a depth of ~20 m.
The reference sites (VR and HR) had the same depths as the farm sites and were placed 100‐200 m away to make sure that there was no direct effect of the mussels on the reference sediment (Chamberlain et al., 2001; Hartstein & Stevens, 2005).
Fig.1 Location of farm sites (V and H) and associated reference sites (VR and HR). Inset shows the position of the area relative to Lysekil and Kristineberg (star). Sedimentation rates
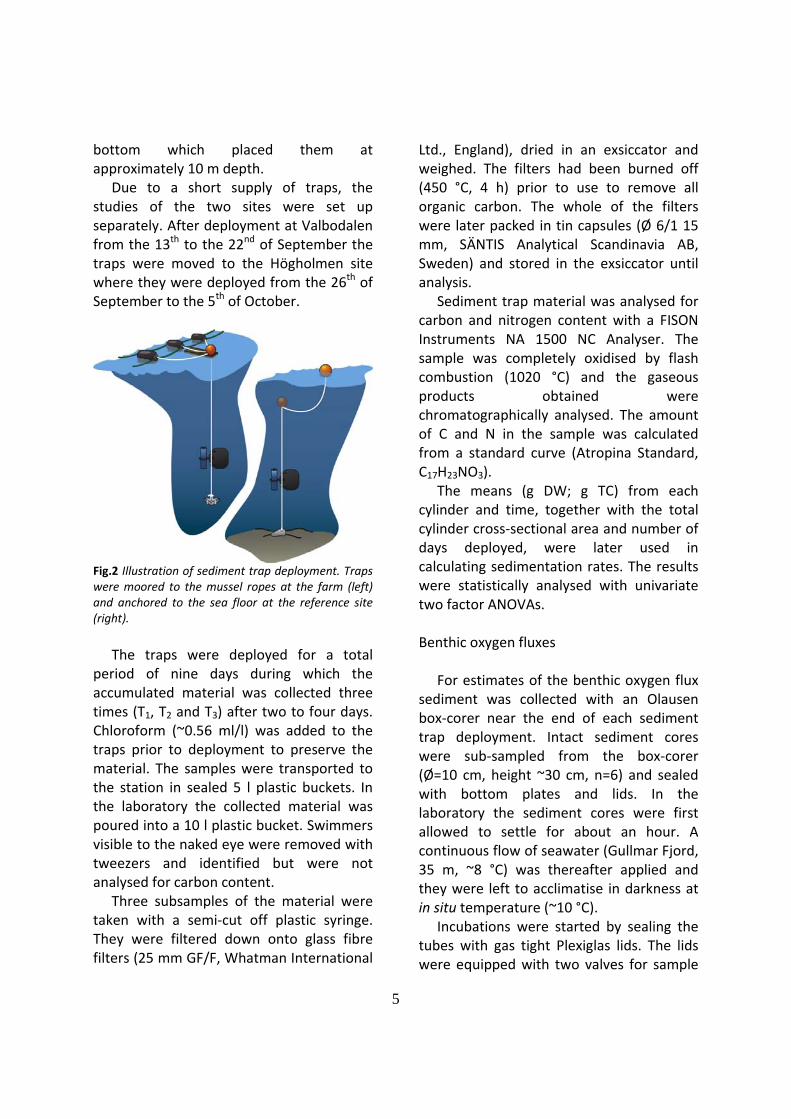
Sedimentation rates were measured using single cylinder sediment traps (height 5,3 dm, Ø 80 mm, aspect ratio 6) deployed at 10 m depth (n=3) at all 4 sites visited. The traps were suspended from a floating board moored to a mussel rope at the farms (Fig.3). At the reference the traps were anchored at a distance of 9 m from the
5
bottom which placed them at approximately 10 m depth.
Due to a short supply of traps, the studies of the two sites were set up separately. After deployment at Valbodalen from the 13th to the 22nd of September the traps were moved to the Högholmen site where they were deployed from the 26th of September to the 5th of October.
Fig.2 Illustration of sediment trap deployment. Traps were moored to the mussel ropes at the farm (left) and anchored to the sea floor at the reference site (right).
The traps were deployed for a total
period of nine days during which the accumulated material was collected three times (T1, T2 and T3) after two to four days. Chloroform (~0.56 ml/l) was added to the traps prior to deployment to preserve the material. The samples were transported to the station in sealed 5 l plastic buckets. In the laboratory the collected material was poured into a 10 l plastic bucket. Swimmers visible to the naked eye were removed with tweezers and identified but were not analysed for carbon content.
Three subsamples of the material were taken with a semi‐cut off plastic syringe. They were filtered down onto glass fibre filters (25 mm GF/F, Whatman International
Ltd., England), dried in an exsiccator and weighed. The filters had been burned off (450 °C, 4 h) prior to use to remove all organic carbon. The whole of the filters were later packed in tin capsules (Ø 6/1 15 mm, SÄNTIS Analytical Scandinavia AB, Sweden) and stored in the exsiccator until analysis.
Sediment trap material was analysed for carbon and nitrogen content with a FISON Instruments NA 1500 NC Analyser. The sample was completely oxidised by flash combustion (1020 °C) and the gaseous products obtained were chromatographically analysed. The amount of C and N in the sample was calculated from a standard curve (Atropina Standard, C17H23NO3).
The means (g DW; g TC) from each cylinder and time, together with the total cylinder cross‐sectional area and number of days deployed, were later used in calculating sedimentation rates. The results were statistically analysed with univariate two factor ANOVAs. Benthic oxygen fluxes
For estimates of the benthic oxygen flux sediment was collected with an Olausen box‐corer near the end of each sediment trap deployment. Intact sediment cores were sub‐sampled from the box‐corer (Ø=10 cm, height ~30 cm, n=6) and sealed with bottom plates and lids. In the laboratory the sediment cores were first allowed to settle for about an hour. A continuous flow of seawater (Gullmar Fjord, 35 m, ~8 °C) was thereafter applied and they were left to acclimatise in darkness at in situ temperature (~10 °C).
Incubations were started by sealing the tubes with gas tight Plexiglas lids. The lids were equipped with two valves for sample
6
removal and water replacement. An external motorised magnet rotated a Teflon coated stirring bar suspended from the lid, keeping the water in the cores well mixed.
Water samples (~56 ml, exact volume recorded) were taken from each core six times (t0‐t5) in predetermined intervals. The withdrawn water was replaced by filtered (0.3 µm) seawater (Gullmar Fjord, 35 m) with known oxygen concentration. Oxygen concentrations in the cores were never allowed to fall more than 20 % of the original concentration.
Samples were transferred to 12 ml gas tight glass vials (Exetainer, Labco, High Wycombe, UK) and immediately precipitated. Oxygen concentrations were determined by modified Winkler titration within 24 hours (SIS 1975).
Results were statistically analysed with Students t‐test. Sediment profile images
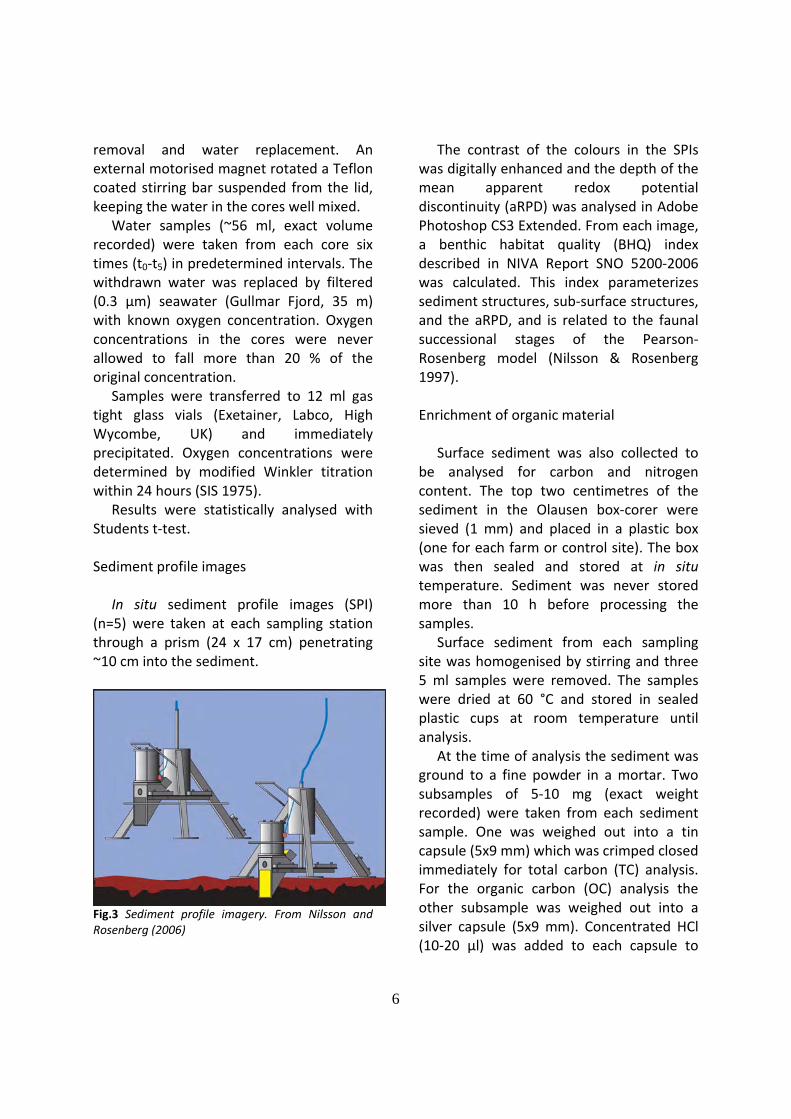
In situ sediment profile images (SPI) (n=5) were taken at each sampling station through a prism (24 x 17 cm) penetrating ~10 cm into the sediment.
Fig.3 Sediment profile imagery. From Nilsson and Rosenberg (2006)
The contrast of the colours in the SPIs was digitally enhanced and the depth of the mean apparent redox potential discontinuity (aRPD) was analysed in Adobe Photoshop CS3 Extended. From each image, a benthic habitat quality (BHQ) index described in NIVA Report SNO 5200‐2006 was calculated. This index parameterizes sediment structures, sub‐surface structures, and the aRPD, and is related to the faunal successional stages of the Pearson‐Rosenberg model (Nilsson & Rosenberg 1997). Enrichment of organic material
Surface sediment was also collected to be analysed for carbon and nitrogen content. The top two centimetres of the sediment in the Olausen box‐corer were sieved (1 mm) and placed in a plastic box (one for each farm or control site). The box was then sealed and stored at in situ temperature. Sediment was never stored more than 10 h before processing the samples.
Surface sediment from each sampling site was homogenised by stirring and three 5 ml samples were removed. The samples were dried at 60 °C and stored in sealed plastic cups at room temperature until analysis.
At the time of analysis the sediment was ground to a fine powder in a mortar. Two subsamples of 5‐10 mg (exact weight recorded) were taken from each sediment sample. One was weighed out into a tin capsule (5x9 mm) which was crimped closed immediately for total carbon (TC) analysis. For the organic carbon (OC) analysis the other subsample was weighed out into a silver capsule (5x9 mm). Concentrated HCl (10‐20 µl) was added to each capsule to
7
Table 1. Sedimentation rate of total particulate matter (TPM; g DW m‐2 d‐1) measured at farms and reference sites at sampling times T1, T2 and T3. Molar C:N ratios obtained from total carbon (TC) sedimentation rates. Values are means ± SE.
drive off the carbonates, after which they were heated in an oven at 80 °C to drive off residual HCl and water. The capsules were then crimped closed and analysed in the NC Analyzer.
The Mussel Project collected samples twice a year for two years (May and September, 2005 and 2006) using the same method. The whole time series was analysed in this study. Results Sedimentation rates
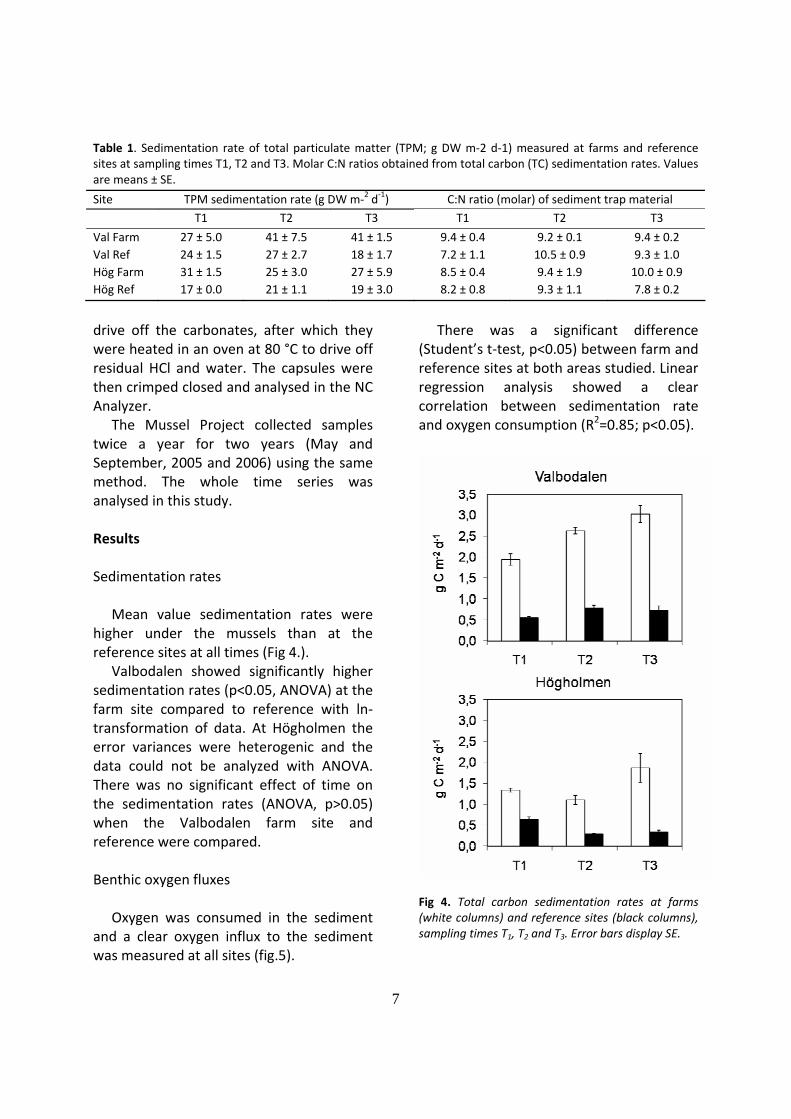
Mean value sedimentation rates were higher under the mussels than at the reference sites at all times (Fig 4.).
Valbodalen showed significantly higher sedimentation rates (p<0.05, ANOVA) at the farm site compared to reference with ln‐transformation of data. At Högholmen the error variances were heterogenic and the data could not be analyzed with ANOVA. There was no significant effect of time on the sedimentation rates (ANOVA, p>0.05) when the Valbodalen farm site and reference were compared. Benthic oxygen fluxes
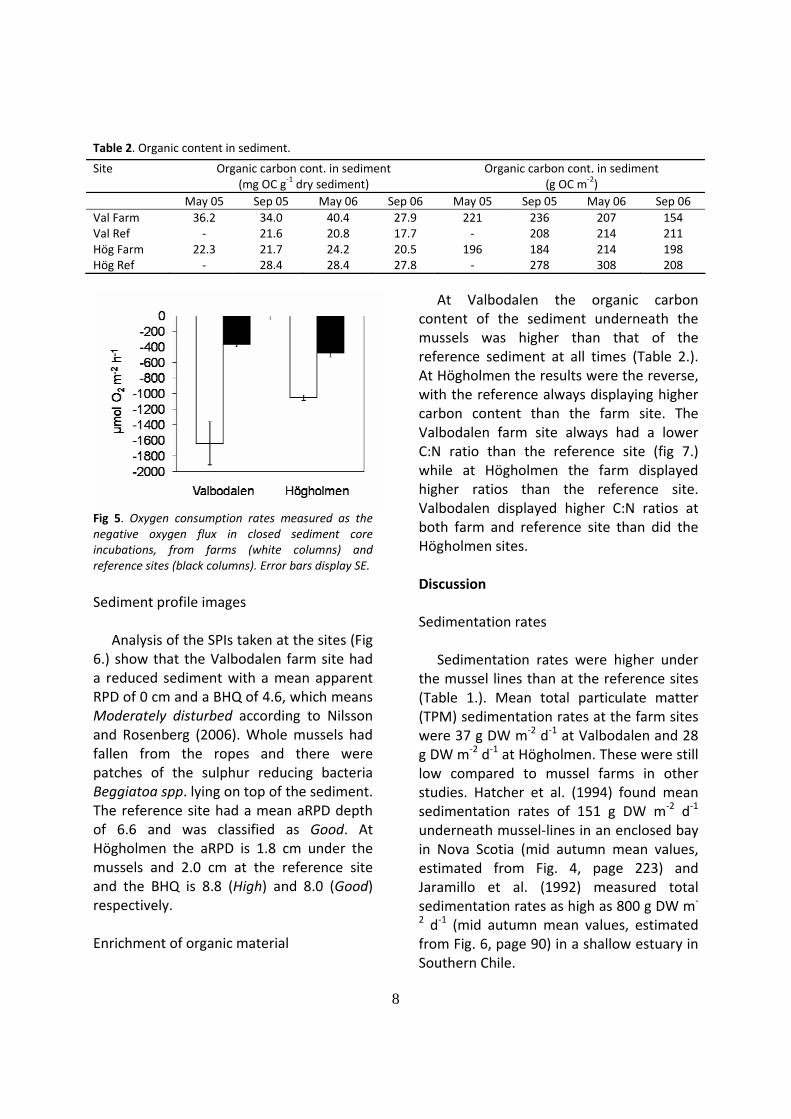
Oxygen was consumed in the sediment and a clear oxygen influx to the sediment was measured at all sites (fig.5).
There was a significant difference (Student’s t‐test, p<0.05) between farm and reference sites at both areas studied. Linear regression analysis showed a clear correlation between sedimentation rate and oxygen consumption (R2=0.85; p<0.05).
Fig 4. Total carbon sedimentation rates at farms (white columns) and reference sites (black columns), sampling times T1, T2 and T3. Error bars display SE.
Site TPM sedimentation rate (g DW m‐2 d‐1) C:N ratio (molar) of sediment trap material
T1 T2 T3 T1 T2 T3
Val Farm 27 ± 5.0 41 ± 7.5 41 ± 1.5 9.4 ± 0.4 9.2 ± 0.1 9.4 ± 0.2 Val Ref 24 ± 1.5 27 ± 2.7 18 ± 1.7 7.2 ± 1.1 10.5 ± 0.9 9.3 ± 1.0 Hög Farm 31 ± 1.5 25 ± 3.0 27 ± 5.9 8.5 ± 0.4 9.4 ± 1.9 10.0 ± 0.9 Hög Ref 17 ± 0.0 21 ± 1.1 19 ± 3.0 8.2 ± 0.8 9.3 ± 1.1 7.8 ± 0.2
8
Table 2. Organic content in sediment.
Fig 5. Oxygen consumption rates measured as the negative oxygen flux in closed sediment core incubations, from farms (white columns) and reference sites (black columns). Error bars display SE. Sediment profile images
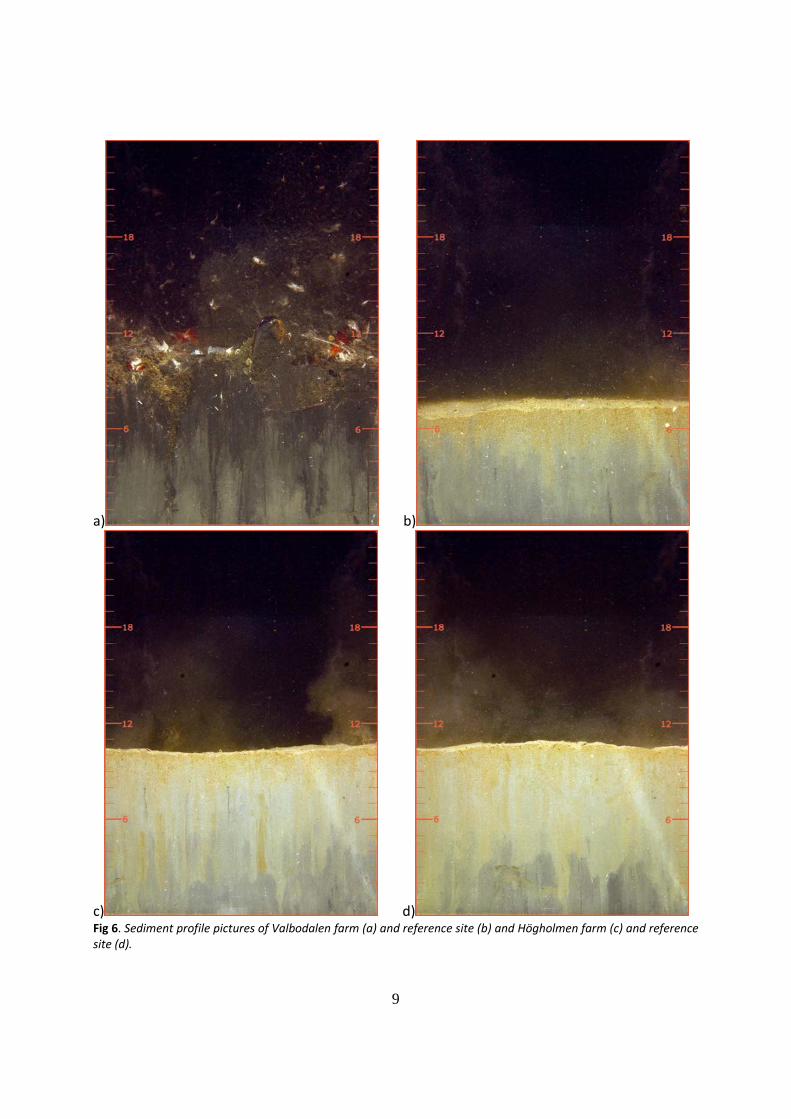
Analysis of the SPIs taken at the sites (Fig 6.) show that the Valbodalen farm site had a reduced sediment with a mean apparent RPD of 0 cm and a BHQ of 4.6, which means Moderately disturbed according to Nilsson and Rosenberg (2006). Whole mussels had fallen from the ropes and there were patches of the sulphur reducing bacteria Beggiatoa spp. lying on top of the sediment. The reference site had a mean aRPD depth of 6.6 and was classified as Good. At Högholmen the aRPD is 1.8 cm under the mussels and 2.0 cm at the reference site and the BHQ is 8.8 (High) and 8.0 (Good) respectively. Enrichment of organic material
At Valbodalen the organic carbon content of the sediment underneath the mussels was higher than that of the reference sediment at all times (Table 2.). At Högholmen the results were the reverse, with the reference always displaying higher carbon content than the farm site. The Valbodalen farm site always had a lower C:N ratio than the reference site (fig 7.) while at Högholmen the farm displayed higher ratios than the reference site. Valbodalen displayed higher C:N ratios at both farm and reference site than did the Högholmen sites. Discussion Sedimentation rates
Sedimentation rates were higher under the mussel lines than at the reference sites (Table 1.). Mean total particulate matter (TPM) sedimentation rates at the farm sites were 37 g DW m‐2 d‐1 at Valbodalen and 28 g DW m‐2 d‐1 at Högholmen. These were still low compared to mussel farms in other studies. Hatcher et al. (1994) found mean sedimentation rates of 151 g DW m‐2 d‐1 underneath mussel‐lines in an enclosed bay in Nova Scotia (mid autumn mean values, estimated from Fig. 4, page 223) and Jaramillo et al. (1992) measured total sedimentation rates as high as 800 g DW m‐
2 d‐1 (mid autumn mean values, estimated from Fig. 6, page 90) in a shallow estuary in Southern Chile.
Site Organic carbon cont. in sediment (mg OC g‐1 dry sediment)
Organic carbon cont. in sediment (g OC m‐2)
May 05 Sep 05 May 06 Sep 06 May 05 Sep 05 May 06 Sep 06 Val Farm 36.2 34.0 40.4 27.9 221 236 207 154 Val Ref ‐ 21.6 20.8 17.7 ‐ 208 214 211 Hög Farm 22.3 21.7 24.2 20.5 196 184 214 198 Hög Ref ‐ 28.4 28.4 27.8 ‐ 278 308 208
9
a) b)
c) d) Fig 6. Sediment profile pictures of Valbodalen farm (a) and reference site (b) and Högholmen farm (c) and reference site (d).
10
Sedimentation rate measurement with sediment traps is a method whose accuracy has always been under discussion. Design issues such as aspect ratio (ratio of trap height to diameter), whether to have a fixed trap or one suspended in a gyro to allow for orientation with the currents and whether or not to use conservatives are just some of the questions that have been under debate over the year. Some of the biggest problems with the method stems from the resuspension of already settled material.
Turbulence caused by water currents or macro faunal movements can induce redistribution of material settled on the sediment floor. This can lead to an overestimation of sedimentation rate. It can be avoided by placing the trap at a distance from the sediment surface, but it must be weighed against the risk of mismeasurement of the sedimentation rate due to the reduced water column height.
Another issue is the resuspension of already trapped material. As current velocity increases, eddies are formed in the mouth of the trap and spread down towards the bottom. If the chain of eddies reaches the bottom of the trap, there is a risk of losing material and thus underestimating the sedimentation rate. Bloesch and Burns (1980) showed that the aspect ratio, i.e. the ratio between the height of the trap and its diameter, is very important in avoiding resuspension. They found that a ratio higher than 10 is required for turbulent waters and that an aspect ratio of 5 or less would lead to occasional losses of material.
An explanation as to why the rates of this study were so much lower than Hatcher et al. (1994) and Jaramillo et al. (1992) could be that the aspect ratio of the traps was lower than 10, which might have lead to an underestimation of the sediment rate.
It could also be that the studies in Nova Scotia and Chile were done in areas with high tidal flux and shallow depth, in relation to the Valbodalen and Högholmen sites, and that the sediment traps in those studies were placed directly on the ocean floor, thus increasing the exposure of the traps to material resuspended from the sediment surface. Furthermore Jaramillo et al. (1992) did not use the actual mussel farms but placed mussels directly into the top of the traps, thereby catching all faecal pellets produced.
The differences in sampling methods make it hard to compare the studies. One cannot simply compare the absolute values but must also take into account the natural conditions in the areas. However, if the mussel farm site to reference site ratios (F:R) are calculated, this ratio may provide a more accurate overview of the impact the mussels can have. Hatcher et al. (1994) and Jaramillo et al. (1992) found mid autumn mussel rates that were approximately 2.2 and 1.6 higher than those of the references respectively. This means that the farms in this present study, which had a mean farm site rate 1.5 times greater than the reference, had only slightly less of an impact, despite the much lower absolute sedimentation rate.
The rate of TPM sedimentation is a measurement of all material that falls to the seafloor. However, the composition of that total material fluctuates rapidly and is affected by e.g. changes in water runoff from land or seasonal successions in plankton communities. TPM sedimentation rates say nothing of the quality of the material, such as the size of the organic and inorganic fractions. Therefore it gives no indication of how much or in what way the material will affect the receiving benthic systems. To get a better understanding one
11
must do further analyses of the material. There are a wide variety of parameters that can be explored and an equally wide range of methods to do it. Ash free dry weight is one way to quantify the total organic content of the material, but to get a better estimate of the amount of carbon and nitrogen the system receives, elemental analyses must be done. This allows e.g. for carbon‐nitrogen (C:N) ratios to be calculated which gives further insight into the composition of the sedimenting material. C:N ratios are widely used as a way of evaluating the quality of the sediment, though many feel that it says little on its own.
Total carbon (TC) sedimentation rates varied greatly with time at both sites but were always higher underneath the mussel‐lines than at the reference sites. On average the F:R ratio for TC sedimentation rate was 3.6 at Valbodalen and 3.8 at Högholmen. These results correspond well with that of Dahlbäck and Gunnarsson (1981) at a mussel farm further up the coast where they measured a sedimentation rate of 3 g C m‐2 d‐1 and an F:R ratio of nearly 3. They found C:N ratios of 12‐14 in the trap material under the farm, which was a higher ratio than those of the Valbodalen and Högholmen. However, like the present study, Dahlbäck and Gunnarsson (1981) found no difference between farm and reference site. As for having a higher C:N ratio, they, like Hatcher et al. (1994), who found no difference between mussel‐lines and reference either, placed their traps directly on the sediment surface. The potentially higher fraction of resuspended material would have raised the C:N ratio, as it would have contained older material which generally has a higher C:N ratio than fresh organic material. The ratios in the present study were 9 and 8.5 at Valbodalen
and Högholmen respectively, which fall within the range of C:N ratio for mussel faecal matter (Giles et al., 2006, Giles and Pilditch, 2006). The similarities between farm and reference found at both areas could indicate that the sedimenting material at the reference sites also consisted of mainly faecal matter, as the zooplankton population peaks in the autumn, but it also points to the inadequacy of using a C:N ratio on its own. A supplement of chlorophyll a and phaeopigment measurements as well as lipid and protein analysis would increase the understanding of the TPM composition. Benthic oxygen fluxes
The strong correlation between sedimentation rates and oxygen consumption rates suggest a direct response of the underlying sediment to an increased supply of organic matter. Mineralisation of organic matter that reaches the sediment is quick and under the farms it may also get an extra boost by the intestinal bacteria egested with the faecal pellets (Grenz et al., 1990).
As an effect of the increased sedimentation rates, the oxygen consumption was higher under the farms than at the reference sites. The Högholmen site had an oxygen influx to the sediment that was 2.2 times greater than that of the reference site, which is approximately in the same range as Hatcher et al. (1994) (F/R: 2.0) and Giles et al. (2006) (F:R: 1.8). At Valbodalen on the other hand the oxygen influx to the sediment under the mussel‐lines was 4.5 times higher than to the reference sediment. In a study done in a eutrophic coastal lagoon in northern Italy, Nizzoli et al. (2005) found oxygen consumptions of 11.4 mmol m‐2 h‐1, i.e. 7
12
times as high as those at Valbodalen. Since this was one of the highest rates ever recorded, it made them question the general idea that farming of filter feeders has less of an impact on the underlying sediment than fish‐farming. However, again, one must take into consideration the natural conditions of the area, and given this, the F:R ratio shows that mussel farm studied by Nizzoli et al. (2005) still only had an oxygen influx rate 1.4 times higher than the reference sediment. This could mean that the system in the lagoon probably is quite robust to high oxygen demand and have a water exchange rate to support it. However, the SPI from Valbodalen (Fig. 6.a) showed that the sediment was reduced all the way to the surface, which is a sign that the currents at this site were unable to supply oxygen fast enough. The high flux at the Valbodalen farm site relative to Högholmen is probably due to the decomposition of the large quantities of dropped mussels seen in the image, which would deplete the oxygen reserves rapidly (Lomstein et al., 2006). Enrichment of organic material
The amount of organic carbon delivered to the sediment depends on a variety of factors, e.g. primary production and water depth (Tyson, 2001). Underneath a mussel farm there are also the added factors of e.g. mussel filtration, which depends on quantity and quality of seston (Hawkins et al. 1996; Defossez and Hawkins, 1997) and assimilation rates, which varies with season (Cranford and Hill, 1999). Several previous studies have found higher organic matter content and C:N ratios underneath the farms compared to the reference sites (e.g. Nizzoli et al., 2005) but there are also studies, such as Kaspar et al. (1985) where
no difference in C:N has been detected. Hartstein and Rowden (2004) and Hartstein and Stevens (2005) found higher C:N ratios under the mussel‐lines at the same two sheltered sites, but no difference at another more exposed site, even though the latter study also measured a significantly higher sedimentation rate under that farm.
The top 2 cm of the sediment is generally made up of the freshest organic material and when pooled the minute changes in composition would be hard to detect. To accurately evaluate the impact of the farm on the biogeochemistry of the sediment and establish the fate of the carbon, depth profiles must be analysed. Also, as with the sediment trap material, more parameters should be studied, e.g. lipids and proteins.
Since the sampling in this study was done in such a way that did not allow for depth profile analyses, the long term burial of organic carbon could not be discerned. It is, however interesting to note that the C:N ratio of the sediment is higher than that of the material in the traps. This points to a higher mineralisation rate of nitrogen compared to carbon. That there is high remineralisation of nitrogen is supported by the high effluxes of ammonia and DON measured in the oxygen flux cores, but those effluxes are also due to the disrupted coupled nitrification‐denitrification under the mussel‐lines (pers com. Pia Engström). Grenz et al. (1990) found a high exoproteasic activity directly after mussel biodeposit enrichment of a sediment core. They hypothesised that this was due to bacteria from the digestive tract being egested with faecal pellets, which lead to an early hydrolysis of proteins, the carbohydrate degradation not increasing until after several days. Conclusions
13
Given that the farms were in the later
stage of the production cycle, the biomass should be the largest and thus also the downward flux, as both size and sinking velocity of the faecal pellets increase with the size of the mussel (Giles and Pilditch, 2004). As the mussels get harvested, the downward flux of faecal matter will lessen again. The decrease of carbon and nitrogen input would restore the balance with the oxygen demand of the sediment and the systems would have a chance to recover somewhat during this brief respite. However, the question is if this short period will be enough. Rosenberg et al (2002) found that benthic systems in the Gullmar Fjord needed two years to recover after a period of oxygen deficiency. The time needed is of course dependent on the degree of disturbance and how quickly the oxygen supply is restored, but the Valbodalen site would probably need more than a few months to return to the state it was in prior to the establishment of the mussel farm.
If only looking at the sedimentation and oxygen fluxes it would be logical to assume that the Högholmen site had a larger export of organic material from the farm site area and therefore was better suited as a farm site. However, due to a lower settling of mussel spat at Högholmen from the beginning of the project the mussel stock was much lower than at Valbodalen. This confounded any comparisons made between the two sites and conclusions on relative sustainability of the systems could not be drawn simply from this study without calculating the organic material contribution per mussel as well as collecting more site specific data on water exchange and currents. Interesting and complex models to evaluate the suitability of a site
for farming mussels are being developed, e.g. in New Zealand, where mussel farming is a growing industry. In these models relative contributions of initial dispersal, erosion (including resuspension) and decay of the biodeposits are taken into consideration, as well as general distribution and intensity of biodeposition.
The mussel farms at Valbodalen and Högholmen had, through enhanced sedimentation during the two years since the initial establishment, already had an impact on the underlying sediments. The oxygen demand had increased 4‐fold and 2‐fold, respectively, and levels of release of both ammonia and DON from the sediments had risen as well. A system of crop rotation, with some farm sites always lying fallow would perhaps increase the sustainability of the sites. Acknowledgements
I would like to thank my supervisor Odd
Lindahl, Mr Mussel himself; you’re a man with infinite patience. I’m extremely grateful to Lars Ljungqvist and Pia Engström for all their help with... everything. Many thanks to Stina Lindqvist, Peter Tiselius, Karl Norling and Matilda Haraldson for discussions about and help with statistics and to Bodil Hernroth for being an unfathomable well of knowledge, and situated just down the hall. Thank you, Gerhard Gunnarsson and Christer Gren for all practical help with setting up my field sampling. Thanks also to everyone else at the station who’ve put up with endless questions and bad moods and to Hannah and all my wonderful friends who show compassion even when I’ve brought things on myself. Lastly, I thank my loving and beloved family.
14
References Andersen I., Berge J.A., Andersen J.H., Berntsson I., Danielssen D., Foverskov S., Fyrberg L., Gjøsæter J., Granmo Å., Green N., Schou Hansen O., Hylland K., Håkansson B., Johannessen T., Karlson B., Knutsen J.A., Knutzen J., Magnusson J., Molvaer J., Pedersen B., Sjöberg B., Szaron J., Torstensen E., Tveite S. and Ærtebjerg G. 2001. “The Skagerrak – environmental state and monitoring prospects” Göteborg: SMHI. ISBN 91‐89507‐04‐5 Baudinet D., Alliot E., Berland B., Grenz C., Plante‐Cuny M.‐R., Plante R. and Salen‐Picard C. 1990. “Incidence of mussel culture on biogeochemical fluxes at the sediment‐water interface” Hydrobiologia. Vol. 207: 187‐196 Bloesch J. and Burns N.M. 1980. “A critical review of sedimentation trap technique l)” Aquatic Sciences. Vol. 42: 15‐55 Boesch D., Hecky R., O’Melia C., Schindler D., Seitzinger S. 2006. ”Eutrophication of Swedish seas” Stockholm: Naturvårdsverket. ISBN 91‐620‐5509‐7/ISSN 0282‐7298 Canfield D.E., Thamdrup B. and Kristensen E. Aquatic Geomicrobiology 2005. Advances in Marine Biology Vol. 48. San Diego. Elsevier Academic Press. ISBN 0‐12‐158340‐6 Chamberlaine J., Fernandes T.F., Read P., Nickell T.D. and Davies I.M. 2001.” Impacts of biodeposits from suspended mussel (Mytilus edulis L.) culture on the surrounding surficial sediments” ICES Journal of Marine Science. Vol 58: 411‐416 Cranford P.J. and Hill P.S. 1999. “Seasonal variation in food utilization by the suspension‐feeding bivalve molluscs Mytilus edulis and Placopecten magellanicus” Marine Ecology Progress Series. Vol. 190: 223‐239 Dahlbäck B., and Gunnarsson L.Å.H. 1981. “Sedimentation and Sulfate Reduction Under a
Mussel Culture” Marine Biology. Vol 63: 269‐275 Danovaro R., Gambi C., Luna G.M. and Mirto S. 2004. “Sustainable impact of mussel farming in the Adriatic Sea (Mediterranean Sea): evidence from biochemical, microbial and meiofaunal indicators” Marine Pollution Bullentin. Vol. 49: 325‐333 Defossez J.‐M. and Hawkins A.J.S. 1997. “Selective feeding in shell®sh: size‐dependent rejection of large particles within pseudofaeces from Mytilus edulis, Ruditapes philippinarum and Tapes decussates” Marine Biology. Vol. 129:139‐147 Giles H. and Pilditch C.A. 2004. “Effects of diet on sinking rates and erosion thresholds of mussel Perna canaliculus biodeposits” Marine Ecology Progress Series. Vol. 282: 205‐219 Giles H. and Pilditch C.A. 2006. “Effects of mussel (Perna canaliculus) biodeposit decomposition on benthic respiration and nutrient fluxes” Marine Biology. Vol. 150: 261‐271 Giles H., Pilditch C.A. and Bell D.G. 2006. “Sedimentation from mussel (Perna canaliculus) culture in the Firth of Thames, New Zealand: Impacts on sediment oxygen and nutrient fluxes” Aquaculture. Vol. 261: 125‐140 Grenz C., Hermin M‐N., Baudinet D. and Daumas R. 1990. “In situ biochemical and bacterial variation of sediments enriched with mussel biodeposits” Hydrobiologia. Vol 207: 153‐160 Harstein N.D. and Rowden A.A. 2004. “Effect of biodeposits from mussel culture on macroinvertebrate assemblages at sites of different hydrodynamic regime” Marine Environmental Research. Vol. 57: 339‐357
15
Hartstein N.D. and Stevens C.L. 2005. “Deposition beneath long‐line mussel farms” Aquacultural Engineering. Vol 33: 192‐213 Hatcher A., Grant J. and Schofield B. 1994. “Effects of suspended mussel culture (Mytilus spp.) on sedimentation, benthic respiration and sediment nutrient dynamics in a coastal bay” Marine Ecology Progress Series. Vol. 115: 219‐235 Hawkins A.J.S., Smith R.F.M., Bayne B.L. and Héral M. 1996. “Novel observations underlying the fast growth of suspension‐feeding shellfish in turbid environments: Mytilus edulis” Marine Ecology Progress Series. Vol. 131:179‐190 Jaramillo E., Bertrán C. and Bravo A. 1992. “Mussel biodeposition in an estuary in southern Chile” Marine Ecology Progress Series. Vol. 82: 85‐94 Kaspar H.F., Gillespie P.A., Boyer I.C. and MacKenzie A.I. 1985. “Effects of mussel aquaculture on the nitrogen cycle and benthic communities in Kenepuru Sound, Marlborough Sounds, New Zealand” Marine Biology. Vol. 85: 127‐136 Lehane C. and Davenport J. 2006 “A 15‐month study of zooplankton ingestion by farmed mussels (Mytilus edulis) in Bantry Bay, Southwest Ireland” Estuarine, Coastal and Shelf Science. Vol 67: 645‐652 Lindahl O., Hart R., Hernroth B., Kollberg S., Loo L.‐O., Olrog L., Rehnstam‐Holm A.‐S., Svensson J,. Svensson S. and Syversen U. 2005. “Improving marine water quality by mussel farming – A profitable measure for Swedish society” Ambio. Vol. 34, No. 2: 131‐138. Lindahl, O. and Kollberg, S. 2009. Can the EU Agri‐Environmental Aid Program be Extended
into the Coastal Zone to Combat Eutrophication?” Hydrobiologica. (https://www.e‐proof.sps.co.in/springer/ja.asp?rfp=authtbvtlqnuy Lomstein B.A., Guldberg B.L. and Hansen J. 2006. ” Decomposition of Mytilus edulis: The effect on sediment nitrogen and carbon cycling” Journal of Experimental Marine Biology and Ecology. Vol. 329: 251‐264 Nilsson H.C. and Rosenberg R. 1997. “Benthic habitat quality assessment of an oxygen stressed fjord by surface and sediment profile images” Journal of Marine Systems. Vol 11:249‐264 Nizzoli D., Welsh D.T., Bartoli M. and Viaroli P. 2005. Impacts of mussel (Mytilus galloprovincialis) farming on oxygen consumption and nutrient recycling in a eutrophic coastal lagoon” Hydrobiologia. Vol 550: 183‐198 Petersen, J.K. and Loo, L‐O. 2004. Miljøkonsekvenser af dyrkning af blåmuslinger. Unpublished. Rosenberg R., Agrenius S., Hellman B., Nilsson H.C. and Norling K. 2002. “Recovery of marine benthic habitats and fauna in a Swedish fjord following improved oxygen conditions” Marine Ecology Progress Series. Vol. 234: 43‐53 Svensk Standard. 1975. Sveriges standardiseringskommission standarkommitten för miljömätteknik. SIS 028114. Tyson R.V. (2001) “Sedimentation rate, dilution, preservation and total organic carbon: some results of a modelling study” Organic Geochemistry. Vol. 32: 333‐33