EFFECTS OF MICROWAVE ENERGY TREATEMENT … · The South African Institute of Mining and Metallurgy...
30
The South African Institute of Mining and Metallurgy The Third Southern African Conference on Base Metals A F Mulaba – Bafubiandi and J M L Lewis _____________________________________________________________________ Page 485 EFFECTS OF MICROWAVE ENERGY TREATEMENT ON VALUE LIBERATION FROM Zn AND Co-Cu ORES Antoine F Mulaba – Bafubiandi and John M L Lewis Abstract In the irradiation of ore particles by microwave energy preferential absorption of this energy occurs in minerals having specific dielectric properties (Bradshaw, 1999). This leads to a selective heating of the various components of within the ore particle matrix. The result is a differential thermal expansion of such components and the resulting induced stresses become ideally concentrated at mineral grain boundaries (Kingman et al., 2000). Dependent upon the relative composition of absorbent, opaque and reflective components this may lead to enhancement of the inter-granular fracture of the ore particles in the initial comminution process (Fandrich et al., 1997). The potential is thus a greater proportion of free mineral grain within the fractured ore particle that may lead to improvement in subsequent mineral separation processes. As the composition of the ore dictates the result of such a treatment (Kingman et al., 2000) it is essential to evaluate the response of each ore sample on an individual basis. This paper reports on results obtained from two ore samples: the one being the zinc ore from the Black Mountain mine (South Africa) and the other a pre-concentrated sample of handpicked cobalt–copper mixed oxide ore from the Gecamines (DRC). The equipment and methods used to simulate the comminution of the samples and evaluate the level of the value liberation will be described along with the results obtained. Using King (1975), Kanellopoulous and Ball (1975), and Gungor and Atalay (1998), a comparison between the behaviour upon microwave irradiation of sulphide and mixed oxide ores leads to conclude that while the technique (i.e. microwave irradiation) is appropriate to the zinc sulphide ore, it does not seem to lead to exceptional results for the oxide.
Transcript of EFFECTS OF MICROWAVE ENERGY TREATEMENT … · The South African Institute of Mining and Metallurgy...

The South African Institute of Mining and Metallurgy The Third Southern African Conference on Base Metals
A F Mulaba – Bafubiandi and J M L Lewis
_____________________________________________________________________ Page 485
EFFECTS OF MICROWAVE ENERGY TREATEMENT ON VALUE LIBERATION FROM Zn AND Co-Cu ORES
Antoine F Mulaba – Bafubiandi and John M L Lewis
Abstract
In the irradiation of ore particles by microwave energy preferential absorption of this
energy occurs in minerals having specific dielectric properties (Bradshaw, 1999). This
leads to a selective heating of the various components of within the ore particle matrix.
The result is a differential thermal expansion of such components and the resulting
induced stresses become ideally concentrated at mineral grain boundaries (Kingman et
al., 2000). Dependent upon the relative composition of absorbent, opaque and reflective
components this may lead to enhancement of the inter-granular fracture of the ore
particles in the initial comminution process (Fandrich et al., 1997). The potential is thus a
greater proportion of free mineral grain within the fractured ore particle that may lead to
improvement in subsequent mineral separation processes. As the composition of the ore
dictates the result of such a treatment (Kingman et al., 2000) it is essential to evaluate the
response of each ore sample on an individual basis. This paper reports on results obtained
from two ore samples: the one being the zinc ore from the Black Mountain mine (South
Africa) and the other a pre-concentrated sample of handpicked cobalt–copper mixed
oxide ore from the Gecamines (DRC). The equipment and methods used to simulate the
comminution of the samples and evaluate the level of the value liberation will be
described along with the results obtained. Using King (1975), Kanellopoulous and Ball
(1975), and Gungor and Atalay (1998), a comparison between the behaviour upon
microwave irradiation of sulphide and mixed oxide ores leads to conclude that while the
technique (i.e. microwave irradiation) is appropriate to the zinc sulphide ore, it does not
seem to lead to exceptional results for the oxide.

The South African Institute of Mining and Metallurgy The Third Southern African Conference on Base Metals
A F Mulaba – Bafubiandi and J M L Lewis
_____________________________________________________________________ Page 486
1. Introduction
The effect upon ores of microwave irradiation includes the heating by means of energy
transfer from the wave in addition to a possible reaction or phase transformation within
the material. The principle of generalised heating of ore particles both to reduce the
energy required in comminution has long been acknowledged but has not been proved to
the economic in practice. This as a consequence the thermal energy requirements to heat
the total material being in excess of the energy saved in the comminution process.
When the effect of heat prior to comminution is considered from the aspect of mineral
liberation Geller and Tervo (1975) noted that mineral grains were liberated at coarser
sizes follow a sequence of heating and quenching when compared to conventional
comminution treatment and also cited the findings of Brown, Gaudin and Loeb (1958) on
liberation of Feldspar from Granite, these investigations focusing upon the milling aspect
of comminution.
Investigations by Kanellopoulos and Ball (1975) demonstrated the reduction in strength
under compressive forces of quartzite materials heated beyond the α to β phase transition
temperature. They noted that stresses could be produced by both volume changes and
anisotropic thermal expansion.
The advantage to be gained from microwave energy is to generate a differential heating
of the various components comprising the ore particle matrix as a consequence of the
difference in dielectric properties of the mineral components in the ore particle matrix.
This in turn leads the development of internal stresses through differential thermal
expansion of the components within the particle holding the prospect of improved
mineral liberation at lower energy requirements.
The South African Institute of Mining and Metallurgy The Third Southern African Conference on Base Metals
A F Mulaba – Bafubiandi and J M L Lewis
_____________________________________________________________________ Page 487
Due to the known limitations in power availability in the domestic microwave oven used
in this investigation single particle treatment was indicated and it was decided to study
the effect in relation to crushing under conditions where compressive stress was
emphasized as per Kingman and Bradshaw (1998). The development of the equipment
for this was carried out on the zinc sulphide ore sample.
2. Background on microwave assisted value liberation
A more comprehensive coverage on the use of microwaves in minerals processing is
found in the literature (Kingman and Rowson (1998), Patnaik and Rao (2004) and
Bradshaw (1999)).
The effects that microwave irradiation have upon the ores investigated are induced as a
consequence of the energy transfer between the microwaves and the mineral species
present.
The effects on the minerals result from the differences in their dielectric properties. As
with any energy form microwaves may be absorbed, reflected or transmitted by materials.
When they are absorbed the internal dipoles of the structure attempt to align with the
fluctuating magnetic field of the wave. Due to the high frequency of the waves this
attempted alignment results in rapid vibration of such dipoles creating internal friction
within the structure that in turn leads to the generation of heat. This heat then results
through internal heat transfer into thermal expansion of the absorbent materials, the
reflective and opaque components being affected to significantly lesser extent. The result
of this differential heating being the generation of internal stresses as a consequence of
alteration in the dimensions of components within the ore particle matrix. The internal
stresses should consequently be maximised at mineral grain boundaries. Such stresses can
therefore result in decrease in the cohesive strength of the particle. As the stresses are
focused at mineral grain boundaries, when external forces are applied to disrupt the
The South African Institute of Mining and Metallurgy The Third Southern African Conference on Base Metals
A F Mulaba – Bafubiandi and J M L Lewis
_____________________________________________________________________ Page 488
particle matrix, fragmentation should occur preferentially at such boundaries holding the
prospect of improved free mineral grain liberation.
The magnitude of the developed stresses is a function the composition of the material
under investigation. Composition in this context relating to the following components:
Mineral species present (opaque, reflective, absorbent), their grain size and proportionate
dispersion through the particle matrix. Thus whilst the principles are generally accepted
and some work has been reported on numerical modeling of particle breakage taking
these factors into account, Whittles et. al (2003) and other investigators e.g. Gungor and
Atalay (1998) found the energy absorbance of the species present in their test materials
inadequate to generate a reduction in the measured breakage. It is thus suggested that
each ore sample must be examined and evaluated on its individual response to such
processing.
3. Experimental 3.1. Materials Two dissimilar materials one a sulphide and the other an oxide both of African origin,
one of which is from a current production operation within RSA, the other from the DRC
not currently commercially exploited are reported upon.
3.1.1. The sulphide sample.
This is derived from the Black Mountain sulphide ore body currently exploited in the
Northern Cape and has been in operation for a number of years producing by means of a
flotation process concentrates containing lead (Pb), zinc (Zn) and copper (Cu). Its
mineralogy and genesis are described in Beck and Chamart (1980). The mineralogy of
the sample material was confirmed by XRD analysis of selected specimens the results of
which are shown in section 4.

The South African Institute of Mining and Metallurgy The Third Southern African Conference on Base Metals
A F Mulaba – Bafubiandi and J M L Lewis
_____________________________________________________________________ Page 489
3.1.2. The high grade cobalt oxide sample.
This is a handpicked pre-concentrated material, extremely high grade imported in the
country for further commercial transactions. Its mineralogical composition was
determined by stereo-optical microscopy and XRD examination the results of which are
shown in section 4.
3.2. Methodology / Techniques employed.
One of the first aspects to consider is how to assess the mineral or value liberation. This
boils down to firstly identify what the effect of conventional crushing has upon this factor
before attempting to evaluate the effects of the microwave irradiation.
As the comminution process is designed to reduce the size of particles in order to liberate
the particle components for processing, determination of particle size distribution prior to
and post irradiation is of significance. This is carried out using standard screen analysis
equipment in the form of calibrated screens and a sieve shaker.
The actual particle breakage aspect of this has been handled in two ways: The zinc
sulphide ore sample was conventionally crushed through three stages of laboratory
comminution equipment in the form of Jaw, Roll and Cone crushers to 100% less than 4
mm to provide a reference sample Particle Size Distribution (PSD) suitable for
application of the value separation processes to be used for evaluation of the effects of
the microwave irradiation.
As the high grade cobalt oxide sample (~n30 % Co) already presented a wide PSD such
treatment was not required in this case.
The microwave equipment used was a 900 W, 2.45 GHz, multimode cavity. It was thus
considered that treatment of single particles of up to 50 mm screen size was the only
feasible solution to this limitation.

The South African Institute of Mining and Metallurgy The Third Southern African Conference on Base Metals
A F Mulaba – Bafubiandi and J M L Lewis
_____________________________________________________________________ Page 490
This then required the identification of a comminution technique for handling single
particle breakage under the desired compressive loading. The basic design of the crushing
chamber is detailed somewhere else (Lewis, 2005) and the development of the technique
and the equipment used is described as follows.
This comprises basically two components, the one item comprising the various
compression chamber elements containing the sample materials and the other being the
mechanism used to apply and control the rate of loading. The compression chamber
components were fabricated from BMS in the basic form of cylindrical pistons and
anvils.
For single particle tests the cylindrical components were machined with an internal
clearance of 0.5 mm to fit neatly within a 50mm internal diameter (ID) steel pipe section
that contained the fragments generated.
A variety of profiles for both anvil and piston faces were tested to locate the particles
which had irregular shapes as near as feasible with the centre line of the piston.
For testing of packed bed particles a piston and cup with an ID of 80mm and wall
thickness of 5mm were machined from BMS to match. The piston was fitted with a 40
mm shaft treaded into the centre of the piston and was machined to give a clearance of
200microns relative to the internal diameter of the cup.
Both the shaft of the cup design and the piston of the single particle test unit had a recess
machined to take a ball used for connection to the loading test unit.
The equipment used to apply the load to the sample materials were standard units of
California Ball Ratio (CBR) used for the testing of building materials (concrete and soil).

The South African Institute of Mining and Metallurgy The Third Southern African Conference on Base Metals
A F Mulaba – Bafubiandi and J M L Lewis
_____________________________________________________________________ Page 491
The equipment identified was in the form of a load frame of the form used in the standard
CBR (California Ball Ratio) test as used for concrete and soil tests.
The one unit had a load frame capacity of 50kN, a load cell of capacity of 100 kN and a
mechanical drive. The load cell is fitted with a transducer linked to the software
programme controlling the rate of travel, displacement and load measurement limit to
within the capacity of the load frame.
The other unit had a load frame capacity of 200 kN and was driven hydraulically under
control of the same software programme.
The basic programmed parameters used were as per a standard CBR with the rate of
piston displacement set at 1.27mm/min and a displacement limit of 10mm. On the
mechanically driven unit a load limit of 40kN was also incorporated in the software
programme to eliminate the risk of damage to the load frame.
The low rate of piston displacement was selected to generate conditions of slow
compression and the displacement limit with the requirement of a small reduction ratio.
These requirements being those regarded as an approach to ideality for compressive
comminution.
To gain insights on the effects of microwave irradiation upon value distribution in
addition to that of fragmentation selected size interval fractions from both original and
product PSD’s were partitioned with a heavy liquid. The liquid selected was
Tetrabromoethane with a density of 2.95. It is recognized that this may not be a suitable
density to partition the heavy minerals but would prove adequate for gangue minerals
separation from the value bearing constituents of the particle matrix. This however is not
the only motivation for the selection as factors such as cost and availability are also
significant and the use of heavier solutions such as those generated with the use of
Thallium salts were discounted on the basis of toxicity.

The South African Institute of Mining and Metallurgy The Third Southern African Conference on Base Metals
A F Mulaba – Bafubiandi and J M L Lewis
_____________________________________________________________________ Page 492
As the valuable minerals identified within the sample materials are all of relatively high
density the measurement of densities on particles was also applied within the various
testing procedures. Coarse particles densities being determined by a simple wet
volumetric displacement technique and finer fraction with the use of a micrometrics
multi-volume Pyknometer model 1305.
Analytical techniques in the form of acid digestion and Atomic Absorption Spectrometry
(AAS) were used for elemental determination upon the high grade cobalt sample and
carbonate peroxide fusion followed by AAS used for the Black Mountain sample. XRF
was additionally used on selected samples.
4. Results and Discussion.
4.1. Zinc bearing sulphide ore.
Based on their apparent weights, two specimens selected from the coarse material of the
zinc sulphide bearing ore (Black Mountain ore) were examined by means of XRD. The
identification of the major mineral contents was found to be in agreement with the
literature (Beck and Chamant, 1980), Table 1, revealed that the material with a higher
density (4.11) showed the anticipated heavy minerals content whilst the one with the
lower density (2.73) comprises mainly gangue minerals. The content of the high density
sample material comprise, quartz, galena, pyrite, magnetite, sphalerite and pyrrhotite and
that of the low density sample being Quartz, muscovite, microcline and clinochlore. The
samples were additionally analysed for their elemental contents by both AAS and XRF.

The South African Institute of Mining and Metallurgy The Third Southern African Conference on Base Metals
A F Mulaba – Bafubiandi and J M L Lewis
_____________________________________________________________________ Page 493
Table 1: Identification of major mineral contents in the zinc sulphide ore sample
Sample Density AAS XRD XRF %
Cu % Pb
% Zn
% Cu
% Pb
% Zn
% SiO2
% Al2O3
Light 2.73 0.57 2.18 0.46 Quartz, muscovite, microcline
and clinochlore
0.61 1.14 0.2 60.5 17.4
Heavy 4.11 0.70 37.30 2.50 Quartz, galena, pyrite,
magnetite, sphalerite
and pyrrothite
0.39 30.40 3.70 26.30 1.50
Whilst the figures from AAS and XRF analytical techniques are not identical, they
nevertheless give confirmation of the composition and value distribution. The PSD of the
crushed Black Mountain sample used for reference purposes is shown in table 2 below.
Table 2: Particle Size Distribution of the crushed zinc sulphide ore
Size mm % mass Cum % mass Pass Cum % mass Ret. Size mm % mass Cum % mass Pass Cum % mass Ret.
4 6 94.2 6 0.355 1.5 13.1 87.1 2.8 19 75.2 25 0.3 1.7 11.4 88.8 2 24.9 50.3 49.9 0.212 2.4 9 91.2
1.4 14.7 35.6 64.6 0.15 2.2 6.8 93.4 1 8.4 27.2 73 0.106 1.8 5 95.2
0.85 3.4 23.8 76.4 0.075 1.3 3.7 96.5 0.71 2.6 21.2 79 0.053 0.9 2.8 97.4 0.6 2.4 18.8 81.4 0.038 0.8 2 98.2 0.5 2.6 16.2 84 -0.038 2
0.425 1.6 14.6 85.6 100.2
The graphical representation of this data is shown in figure 1 and the value of the
correlation coefficient against linearity confirms that this distribution conforms to that
which is conventionally anticipated from a crushing comminution operation.

The South African Institute of Mining and Metallurgy The Third Southern African Conference on Base Metals
A F Mulaba – Bafubiandi and J M L Lewis
_____________________________________________________________________ Page 494
Black Mt Crushed Product
y = 0.8073x - 0.958
R2 = 0.9976
0.0
0.2
0.4
0.6
0.8
1.0
1.2
1.4
1.6
1.8
2.0
1.0 1.5 2.0 2.5 3.0 3.5 4.0
Log Aperture (µm)
Lo
g P
erce
nta
ge
Pas
sin
g
Crushed Product
Figure 1: Particle Size Distribution of the crushed zinc sulphide ore.
The particle size range intervals selected for the heavy liquid separation were those
within which the particles would settle rapidly under a standard gravitational field only
the ranges coarser than 500µm were tested. As each size range interval will contain
particles of varying composition it is assumed that those composed of predominantly
gangue minerals would float at the density selected for the separation. However to
evaluate the effect of density separation some indication of the initial value content of the
size range interval is considered to be valuable information in such an evaluation. Thus
the size range intervals between 2000µm and 500µm were analysed for their elemental
content. The results for these determinations are shown in table 2.
Along with these determinations the densities of the size interval contents were measured
on the Pyknometer using the 5ml cell.

The South African Institute of Mining and Metallurgy The Third Southern African Conference on Base Metals
A F Mulaba – Bafubiandi and J M L Lewis
_____________________________________________________________________ Page 495
Here it can be seen that the densities of the various fractions are very similar as would be
anticipated on the basis of the similarity of the analyses. This absence of any discernable
trends being anticipated when the errors in both the analyses and the density
determinations are considered. Having the initial densities and the analyses for these size
fraction intervals the investigation proceeds to identify what composition variations may
be identified within them based upon a density difference by partitioning with the heavy
liquid, Table 3.
Table 3: Size fraction interval densities and elemental (AAS) analysis of conventionally
crushed zinc sulphide ore fines. Mass partitioning is there added.
Size mm Density %Cu %Pb %Zn %
mass sink Density
sink %
mass float Density
float 2 3.23 0.53 4.62 0.88 44.0 3.84 56.0 2.72
1.4 3.38 0.42 1.89 1.13 50.9 4 49.1 2.75 1 3.47 0.4 0.93 1.06 53.4 4 46.6 2.81
0.85 3.45 0.35 0.75 0.77 54.3 4.1 45.7 2.74 0.71 3.48 0.37 1.58 0.75 51.1 4.2 48.9 2.72 0.6 3.36 0..32 1.33 0.78 52.9 4.3 47.1 2.87 0.5 3.36 0.38 1.47 0.83 51.0 4.3 49.4 2.76
As expected a significant density difference is observed between the float fraction
materials and those that sink. It is also evident that they are both different to the values
determined for the composite contents of the corresponding size interval fractions and
also to the liquid density used in the separation. These differences become even more
evident when the data is presented in a graphical format as shown in figure 2.

The South African Institute of Mining and Metallurgy The Third Southern African Conference on Base Metals
A F Mulaba – Bafubiandi and J M L Lewis
_____________________________________________________________________ Page 496
Black Mt HLS
2.5
2.7
2.9
3.1
3.3
3.5
3.7
3.9
4.1
4.3
0.5 1.0 1.5 2.0 2.5
Size (mm)
Den
sity
Figure 2: Heavy Liquid Separation curve for the zinc sulphide ore
The differences in density between the product and the partitioning density are less
pronounced for the float materials than the sink products, possibly due to the proximity of
gangue mineral densities to the partitioning density. This will depend upon the relative
content of the various minerals present in the specific sample as the densities of the
components identified by XRD are clinochlore (2.75), muscovite (2.93) and quartz
(2.65).
An attempt to interpret this difference in density in terms of value content lead to the
analysis of the float products for their elemental content and the following results
obtained as shown in table 4.

The South African Institute of Mining and Metallurgy The Third Southern African Conference on Base Metals
A F Mulaba – Bafubiandi and J M L Lewis
_____________________________________________________________________ Page 497
Table 4: Analysis of float fractions from zinc sulphide ore
Size microns % Cu % Pb % Zn 2000 0.07 0.07 0.18 1400 0.02 0.13 0.29 1000 0.02 0.12 0.38 850 0.01 0.10 0.31 710 0.02 0.15 0.28
It is seen that as anticipated the heavy mineral content of these fractions is low based
upon the above analyses.
Here it may be appropriate to consider in more detail the relation between density and the
mineral content. If we examine the analytical results for the coarse sample materials
shown in tables 1 and 2 and translate these into mineral content of the major components
identified by XRD on the basis of the elemental content of the mineral compositions, a
semi quantitative estimate of the respective mineral content of the particle can be made.
From the known physical properties of the minerals specifically their densities an
estimate can be made for the density of the composite particle. The details of this
procedure are shown in the following examples related to the samples identified in tables
1 and 2.
In the high density sample the following minerals are identified galena, sphalerite,
chalcopyrite and quartz. The elemental composition of these is taken to be galena (PbS),
sphalerite (ZnS), chalcopyrite (Cu2S.Fe2S3) and their respective densities as PbS (7.5), ZnS
(4) and Cu2S.Fe2S3 (4.2) the quartz density being taken as 2.65 and their elemental
contents are respectively 86.6%Pb, 67.1% Zn and 34.8% Cu.
Taking the analytical values for the AAS the contents can be calculated as shown below.
% lead mineral = 27.3/0.866 = 31.5%
% zinc mineral = 2.54/0.671 = 3.8%
% copper mineral = 0.7/0.384 = 1.8%
% quartz by difference = 62.9%
From these % mass contents the composite density is calculated,

The South African Institute of Mining and Metallurgy The Third Southern African Conference on Base Metals
A F Mulaba – Bafubiandi and J M L Lewis
_____________________________________________________________________ Page 498
Composite density = 0.315 x 7.5 + 0038 x 4 + 0.018 x 4.2 +0.629 x 2.65 = 4.26.
The difference against the measured value is thus 0.15 units or as a % against the
computed value 3.6%. Considering the crude method used for the original density
determination this difference is insignificant. Using the XRF analysis in the same manner
the density computed is 4.44 which is 7.4 % difference again considered as insignificant.
When the figures for the lower density sample are considered, the results for the AAS
figures generate a computed value of 2.81 against a measured value of 2.73 a %
difference of 2.9% and with the XRF values computed 2.72 against measured 2.73 the
difference here definitely being insignificant. It is therefore suggested that the use of
density measurements can be a valid pre-assessment procedure to identify potential value
liberation upon this sample material. The acceptance of this assumption will lead to a
reduction in cost by selection of those materials upon which the more costly and time
consuming techniques such as XRD and fusion analysis are to be applied.
The next stage was to evaluate the compression comminution technique and equipment
performance upon the sample. As previously noted the testing of individual particles has
been chosen as the appropriate method for the reasons given relating to power limitations
of the microwave equipment. Using the equipment previously described a particle was
tested and the results of the load versus displacement response are shown in tabular and
graphical format following.
Table 5: Load versus displacement for a zinc sulphide ore sample.
Disp. mm Load kN Disp.mm Load kN 0.64 1.01 5.72 9.96 1.27 4.92 6.35 10.74 1.91 6.15 6.99 15.66 2.54 11.86 7.62 14.65 3.18 17.11 8.26 17.9 3.81 13.2 8.89 7.27 4.45 15.80 9.3 9.96 5.08 8.95
It is observed that particle fracture is taking place by increments as a consequence of the
inherent flaws (micro cracks) yielding under the increasing stress applied. To compare

The South African Institute of Mining and Metallurgy The Third Southern African Conference on Base Metals
A F Mulaba – Bafubiandi and J M L Lewis
_____________________________________________________________________ Page 499
the fragmentation generated from this procedure with that anticipated from a crusher the
products were taken for sieve analysis and the results are shown in table 6.
Black Mountain load vs displacement
0
2
4
6
8
10
12
14
16
18
20
0 2 4 6 8 10 12
displacement mm
load
kN
Series1
Figure 3: Load versus displacement in zinc sulphide ore
.
Table 6: Size grading of products from the compression test on the zinc sulphide ore.
Size mm % mass retained 11.2 77.2
8 6.2 5.6 2.1 4 3.9
1.4 3.7 -1.4 6.9
To confirm that the distribution corresponds with that from a crushing application the
data is plotted in figure 4. The approach to linearity of the plot confirms that the test was
a fair simulation of a crushing environment. The linear correlation coefficient being 0.97
which considering the limited data base is reasonable.

The South African Institute of Mining and Metallurgy The Third Southern African Conference on Base Metals
A F Mulaba – Bafubiandi and J M L Lewis
_____________________________________________________________________ Page 500
log Cum % mass passing
0
0.2
0.4
0.6
0.8
1
1.2
1.4
1.6
0 0.5 1 1.5 2 2.5 3 3.5 4 4.5
log size microns
log
cu
m %
mas
s p
assi
ng
siz
e
log Cum % mass passing
Figure 4: Product size distribution from compression test for the zinc sulphide ore.
To confirm this result and obtain a preliminary view of the effect of microwave
irradiation upon this aspect of the investigation a number of coarse particles were
selected and exposed to microwave irradiation prior to the compression test and their
product gradings examined. Data relating to the particles irradiated is shown in table 7.
Table 7: Some measurements on particles used in microwave irradiation prior to
compression.
Sample Irradiation time secs Maximum surface temp Density Mass gms A22 0 18 3.53 77.7 A46 30 65 2.86 48.6 A49 60 150 4.24 63.6 A45 90 205 3.51 70.1 A33 90 231 3.72 137.8
It is observed that relatively short exposure times (up to 90 seconds) are effective in
heating the particles even with the limited power available (900 W). The load versus
displacement response for the particles listed in table 7 is shown in figure 5.

The South African Institute of Mining and Metallurgy The Third Southern African Conference on Base Metals
A F Mulaba – Bafubiandi and J M L Lewis
_____________________________________________________________________ Page 501
Load vs displacement
0
5
10
15
20
25
30
35
40
45
0 2 4 6 8 10 12
Displacement mm
Lo
ad k
N
A22
A46
A49
A45
A33
Figure 5: Load versus displacement response of particles in table 6
Although a complete critical evaluation of this data has not yet been conducted it is
apparent that the non irradiated particle does not break as easily as those that have been
microwaved, and even the highest mass particle breaks more easily. The resultant product
size analysis is shown in table 8.
Table 8: Size analysis of compression tested samples from table 7.
Sample % mass retained on 16 mm
% mass retained on 11.2 mm
% mass retained on 8.0 mm
% mass retained on 6.7 mm
% mass retained on 5.6 mm
% mass passing 5.6 mm
A22 28.0 15.2 17.5 3.9 4.4 30.9 A46 15.9 21.7 12.3 4.6 7.3 38.2 A49 13.4 8.8 12.8 5.4 6.3 53.3 A45 68.7 5.9 5.3 1.6 1.9 16.6 A33 70.9 7.8 2.2 1.8 3.0 14.3
A critical examination of this data is still to be undertaken but it is immediately apparent
that the smallest % of – 5.6 mm is produced from the largest particle even though the
greatest amount of fines are generated from the particle with the highest density. This
may be a consequence of a greater content of microwave absorbing minerals which

The South African Institute of Mining and Metallurgy The Third Southern African Conference on Base Metals
A F Mulaba – Bafubiandi and J M L Lewis
_____________________________________________________________________ Page 502
cannot be identified from surface temperature measurements but may be inferred from
the previous consideration of composition related to density.
4.2. Microwave assisted liberation of cobalt bearing minerals.
On the basis of the observations on the zinc sulphide ore that density can be a precursor
indication of value content, density determinations were made upon coarse and fine
particles from a cobalt-copper mixed oxide ore. It was observed that the sample material
suggested low densities and was friable. In an attempt to identify competent particles
suitable for the compression testing, it was decided to examine coarse particles generated
from an attritioning process applied to coarse particles from the original sample. The
product size grading from the attritioning test is shown in table 9 and both products
shown graphically in figure 6. Coarse samples from the attritioned product were tested
for their densities by the same simple wet displacement method. During this exercise it
was observed that the particles were porous as evidenced by gaseous evolution during
tests. 65 particles were tested in this manner and the average density found to be 2.57.
Considering that the sample was of high grade (~30 % Co) and the cobalt mineral density
is 4.32 such a value can only result as a consequence of porosity.
Table 8: Particle size distribution of original cobalt–copper mixed oxide ore sample.
Mesh % Mass Cum. Cum. Mesh % Mass Cum. Cum. mm % Mass % Mass mm % Mass % Mass
Passing Retained Passing Retained 40 20.35 79.63 20.35 0.85 0.63 12.42 87.56 25 37.14 42.49 57.49 0.71 1.07 11.35 88.63 19 11.05 31.44 68.54 0.6 0.55 10.8 89.18 14 1.53 29.91 70.07 0.5 0.88 9.92 90.06
11.2 4.70 25.21 74.77 0.425 0.52 9.4 90.58 8 2.18 23.03 76.95 0.355 0.57 8.83 91.15
6.7 0.93 22.1 77.88 0.3 0.74 8.09 91.89 5.6 1.18 20.92 79.06 0.212 1.07 7.02 92.96 4 1.63 19.29 80.69 0.15 1.32 5.7 94.28
3.35 0.68 18.61 81.37 0.106 0.93 4.77 95.21 2.8 0.92 17.69 82.29 0.075 0.58 4.19 95.79 2 1.55 16.14 83.84 0.053 0.77 3.42 96.56
1.4 1.60 14.54 85.44 0.038 1.10 2.32 97.66 1 1.49 13.05 86.93 -0.038 2.32 99.98

The South African Institute of Mining and Metallurgy The Third Southern African Conference on Base Metals
A F Mulaba – Bafubiandi and J M L Lewis
_____________________________________________________________________ Page 503
In an attempt to determine how far down the size range spectrum the porosity persisted,
density determination measurements were made upon the fine sizes from the screening
analysis or both the original sample and the attritioned product. Here the value for the 40
sample portions examined was generally in excess of 3.4. The particle size distributions
determined for both the original sample and the attritioned material are shown in the
following tables 8 and 9, and figure 6.
Table 9: Particle Size Distribution of attritioned cobalt bearing mixed oxide ore material
Mesh % Mass Cum. Cum. Mesh % Mass Cum. Cum. mm % Mass % Mass mm % Mass % Mass
Passing Retained Passing Retained 40 20.75 79.25 20.75 0.85 1.30 78.13 21.87 25 28.92 50.33 49.67 0.71 2.34 80.47 19.53 19 5.70 44.63 55.37 0.6 1.05 81.52 18.48 14 2.73 41.90 58.10 0.5 2.53 84.05 15.95
11.2 3.08 38.82 61.18 0.425 0.68 84.73 15.27 8 1.22 37.60 62.40 0.355 0.69 84.52 14.58
6.7 0.99 36.61 63.39 0.3 0.88 86.30 13.70 5.6 1.27 35.34 64.66 0.212 1.54 87.84 12.16 4 1.81 33.53 66.47 0.15 1.83 89.67 10.33
3.35 1.03 32.50 67.50 0.106 1.35 91.02 8.98 2.8 0.99 31.51 68.49 0.075 1.84 92.86 7.14 2 1.48 30.03 69.97 0.053 1.77 94.63 5.37
1.4 4.24 25.79 74.21 0.038 0.96 95.59 4.41 1 2.62 23.17 76.83 -0.038 4.41 100.00
Apart from the earlier comments about low density and friability the format of this
presentation draws attention to the unusual nature of this sample material. The format of
presentation used for the above figure is that conventionally associated with materials
that have been subjected to crushing comminution stage. That a sample reputedly to be
hand picked should match such a format is to say the least anomalous and that the
attritioned product should also conform to the same format suggests an ore that cannot be
regarded as competent and of a different genesis from the sulphide ore.

The South African Institute of Mining and Metallurgy The Third Southern African Conference on Base Metals
A F Mulaba – Bafubiandi and J M L Lewis
_____________________________________________________________________ Page 504
High Grade Cobalt: Original vs Attritioned
y = 0.3961x - 0.115R2 = 0.9649
y = 0.3546x + 0.2285R2 = 0.9998
0.0
0.2
0.4
0.6
0.8
1.0
1.2
1.4
1.6
1.8
2.0
1.0 1.5 2.0 2.5 3.0 3.5 4.0 4.5 5.0
Log Aperture (µm)
Lo
g P
erce
nta
ge
Pas
sin
g
Original Attritioned
Figure 6: Paticle Size Distribution for original and attritioned material.
Coarse samples were selected for stereo-optical mineralogical examination and XRD
analysis to identify the major minerals present. These were identified as heterogenite
Co2O3.H2O, malachite Cu2(CO3)(OH)2, pecoraite Ni3SiO5(OH)4 only minor quantities
of gangue minerals were noted amongst which limonite Fe2O3.3H2O was identified. Such
findings confirmed the high grade nature of the sample material. The coarse sample
submitted for XRD examination were also analysed for their elemental content by means
of AAS and XRF and the results are shown tables 10 to 14.
Table 10: XRF analysis of coarse high grade samples.
Sample %Co %Cu %Ni %Fe2o3 %Sio2 %Al2O3 %Fe(calc) ATT 35.6 9.1 22.0 10.0 19.4 0.4 7.0 OR 56.3 10.0 11.1 7.8 8.6 1.1 5.5
Table 11: AAS analysis of coarse high grade samples
Sample %Co %Cu %Ni %Fe ATT 32.1 6.9 13.4 3.7 OR 40.7 6.6 6.3 2.6

The South African Institute of Mining and Metallurgy The Third Southern African Conference on Base Metals
A F Mulaba – Bafubiandi and J M L Lewis
_____________________________________________________________________ Page 505
To determine the elemental distribution of values within the size ranges that might be
anticipated in the products of a comminution process, representative aliquots from size
range intervals for both the original sample and the attritioned product were analysed, this
being by means of acid digestion and AAS analysis of the resultant solutions. From the
residual solids an estimate a gravimetric estimate was made of the gangue content of the
corresponding size intervals. These are shown in tables 12, 13 and 14.
Table 12: Analysis of fine fractions of original sample
Size µm % Co %Cu %Fe %Ni -38 8.8 8.04 7.66 11.86 38 11.21 7.95 6.26 10.45 53 13.23 8.19 6.56 9.53 75 15.87 8.65 6.22 8.91
106 18.52 9.09 6.21 8.67 150 21.83 9.08 5.57 8.23 212 23.67 9.29 4.41 8 300 25.38 9.43 4.44 7.88 355 24.69 9.05 3.59 4.31 425 25.01 9.02 3.13 4.27 500 25.54 9.36 4.00 7.53 600 25.34 9.55 3.95 6.42 710 26.39 9.44 3.92 7.36 850 27.06 9.12 3.46 10.15 1000 26.03 9.63 4.10 5.81 1400 27.64 9.24 3.83 7.00
Table 13: Analysis of fines from attritioned material.
Size microns % Co %Cu %Fe %Ni
-38 13.43 12.74 6.37 9.49
38 17.6 12.73 6.97 7.12
53 19.82 13 7.13 6.55
75 20.52 13.43 7.16 6.27
106 23.08 13.84 6.28 5.87
150 25.72 13.91 4.87 5.45
212 26.82 13.66 4.44 5.55
300 29.44 14.5 4.25 7.09
355 29.65 14.55 3.57 7.43
425 31.28 13.47 3.65 7.13
500 30.12 12.97 3.40 7.19
600 31.02 12.23 2.78 6.67
710 32.31 11.71 2.91 6.33
850 33.15 10.31 3.98 6.92
1000 33.92 11.19 2.74 6.86
1400 34.68 10.03 2.92 6.72

The South African Institute of Mining and Metallurgy The Third Southern African Conference on Base Metals
A F Mulaba – Bafubiandi and J M L Lewis
_____________________________________________________________________ Page 506
Table 14: Acid insoluble residuals of fine fractions
Size microns Original ore Attritioned material
-38 30.47 19.69
38 30.16 15.88
53 25.58 13.16
75 19.55 9.51
106 15.65 9.05
150 12.92 7.93
212 10.82 7.53
300 9.55 7.5
355 9.88 7.17
425 9.65 6.39
500 10.43 6.18
600 9.87 6.37
710 9.78 6.56
850 7.78 6.02
1000 9.31 5.92
1400 7.57 5.29
From these analyses it is clear that the attritioning has had no major effect upon the value
distribution of any of the elements analysed within the size ranges investigated. Also only
two of the components show any trend relative to size variation, the cobalt value showing
an increase with increasing particle size whilst the acid insolubles increase with
decreasing size. These trends are even more evident when the data is presented in
graphical format as in fig 11 for the acid insolubles and in figures 12 and 13 for the cobalt
and other elements.

The South African Institute of Mining and Metallurgy The Third Southern African Conference on Base Metals
A F Mulaba – Bafubiandi and J M L Lewis
_____________________________________________________________________ Page 507
acid insolubles in fine fractions
0
5
10
15
20
25
30
35
-200 0 200 400 600 800 1000 1200 1400 1600
size microns
% c
on
ten
t
original insolsAttritioned Insols
Figure 7: Acid insolubles versus size.
Attritioned fines analysis
0
5
10
15
20
25
30
35
40
-200 0 200 400 600 800 1000 1200 1400 1600
Size microns
% c
on
ten
t
% Co
% Cu
% Fe
% Ni
Figure 8: Attritioned fines analysis

The South African Institute of Mining and Metallurgy The Third Southern African Conference on Base Metals
A F Mulaba – Bafubiandi and J M L Lewis
_____________________________________________________________________ Page 508
original fines elemental analysis
0
5
10
15
20
25
30
-200 0 200 400 600 800 1000 1200 1400 1600
size microns
% c
on
ten
t % Co
% Cu
% Fe
% Ni
Figure 9: Original fines analysis
The form of the variation of the cobalt value with size suggests an approximation to a
logarithmic expression and an attempt was made to fit this data to a logarithmic curve.
The observed correlation coefficient corresponding was only 0.91 for the equation y = -
2.98x4.5 for the original sample material but when used to extrapolate to the size of the
coarse particles analysed initially projected a value of 45% Co. In the case of the
attritioned the correlation coefficient was 0.99 for an equation y = 0.58x4.55 and
extrapolated to a value of 53.4% Co. In a similar manner for the zinc bearing sulphide
ore, selected size interval fractions were partitioned with the heavy liquid for both the
original and attritioned materials. The mass partitioning results for this are shown in table
15.

The South African Institute of Mining and Metallurgy The Third Southern African Conference on Base Metals
A F Mulaba – Bafubiandi and J M L Lewis
_____________________________________________________________________ Page 509
Table 15: Mass partitioning of fine fractions.
Original Original attritioned Attritioned Size mm % Mass Float % Mass sink % Mass Float % Mass sink
1.4 34.31 65.69 9.71 90.29 1 39.20 60.80 9.02 90.98
0.85 26.79 73.21 9.10 90.90 0.71 37.23 62.77 8.53 91.47 0.60 30.84 69.16 8.86 91.14 0.50 22.12 77.88 4.95 95.05 0.425 19.05 80.95 5.48 94.52 0.355 18.06 81.94 6.49 93.51 0.30 18.92 81.08 6.52 93.48
From these results it is evident that the simple attritioning of the coarse material has
caused a major alteration in the mass partitioning on a density basis within all the size
fraction interval examined. The low mass of the float fraction may be interpreted as a
further indication of the high grade nature of the sample material. However as porosity
may be present in these materials the presentation of density values against partitioning
density is unlikely to be reliable and so the products were analysed for their base metal
contents. The results are shown in the tables 16-18.
Table 16: Original TBE float fraction analyses
Size µm % Co % Cu % Ni % Fe % insols. >1400 24.60 8.31 7.62 5.02 14.87 >1000 24.84 9.11 4.91 5.97 16.4 ..>850 23.46 8.42 5.23 6.01 19.08 >710 21.62 8.27 8.49 5.55 20.35 >600 22.02 8.30 5.40 5.98 20.83 >500 17.89 9.66 10.17 6.17 27.93 >425 10.18 4.94 4.56 4.20 27.59 >355 13.10 5.08 4.73 5.20 33.3 >300 15.50 5.64 8.02 5.36 28.83
Table 17: Original TBE sink fractions
Size µm % Co % Cu % Ni % Fe % insols. >1400 35.78 9.20 6.56 3.19 5.03 >1000 37.10 10.62 6.30 2.85 4.67 ..>850 39.14 10.77 6.00 2.60 4.00 >710 36.45 10.13 6.77 2.98 4.90 >600 34.13 9.68 6.85 3.05 5.09 >500 33.88 9.99 6.99 3.44 5.84 >425 34.25 9.66 4.20 2.88 4.74 >355 33.02 9.62 4.22 3.24 3.94 >300 35.26 9.85 6.89 3.14 4.33

The South African Institute of Mining and Metallurgy The Third Southern African Conference on Base Metals
A F Mulaba – Bafubiandi and J M L Lewis
_____________________________________________________________________ Page 510
Table 18: Attritioned TBE float fractions
Size µm % Co % Cu % Ni % Fe % insols. >1400 25.69 7.49 7.39 3.99 17.44 >1000 21.26 8.64 5.44 4.94 21.53 ..>850 19.30 10.03 5.99 5.52 22.80 >710 17.62 9.06 6.60 6.75 24.58 >600 16.52 9.07 6.15 5.46 26.19 >500 9.23 5.42 9.07 9.25 40.50 >425 13.44 7.27 8.40 4.78 34.16 >355 11.72 7.46 9.47 5.23 32.99 >300 10.77 6.34 9.10 4.61 38.22
Table 19: Attritioned TBE sink fractions
Size µm % Co % Cu % Ni % Fe % insols. >1400 36.26 9.04 6.65 2.81 3.38 >1000 35.00 11.40 6.35 2.55 4.11 ..>850 34.20 12.10 6.30 2.25 4.15 >710 34.60 12.70 6.30 2.55 4.82 >600 34.10 12.81 6.30 2.65 4.31 >500 32.84 12.74 6.70 2.84 3.60 >425 31.80 13.66 7.24 3.62 4.34 >355 27.63 14.34 6.96 3.87 5.10 >300 30.11 14.35 7.31 4.25 5.30
Although there are significant elemental content differences between sink and float
fractions within none of the size interval fractions is there any relatively barren material.
This may be a consequence of the liberation size being below the size investigated or due
to the porosity. When the irradiation with microwave energy is considered the same
method was used as applied to the Black Mountain sample in that particles were exposed
for varying times and the surface temperature measured. Results are shown in table 20.
Table 20: Response of high grade materials to irradiation.
sample H2 H3 H12 H15 H24 H38 H50 H58 H62
Time
sec
Deg
C
Deg C
Deg C
Deg C
Deg C
Deg C
Deg C
Deg C
Deg C
30 182 156 100 127 94 112 131 156 91
60 234 200 187 160 183 183 178 212 176
Here it is clear that the sample material is responding as anticipated for the presence of
high cobalt content. When the load versus displacement response of samples to
compressive loading is examined the format of the results shows no indication of the
The South African Institute of Mining and Metallurgy The Third Southern African Conference on Base Metals
A F Mulaba – Bafubiandi and J M L Lewis
_____________________________________________________________________ Page 511
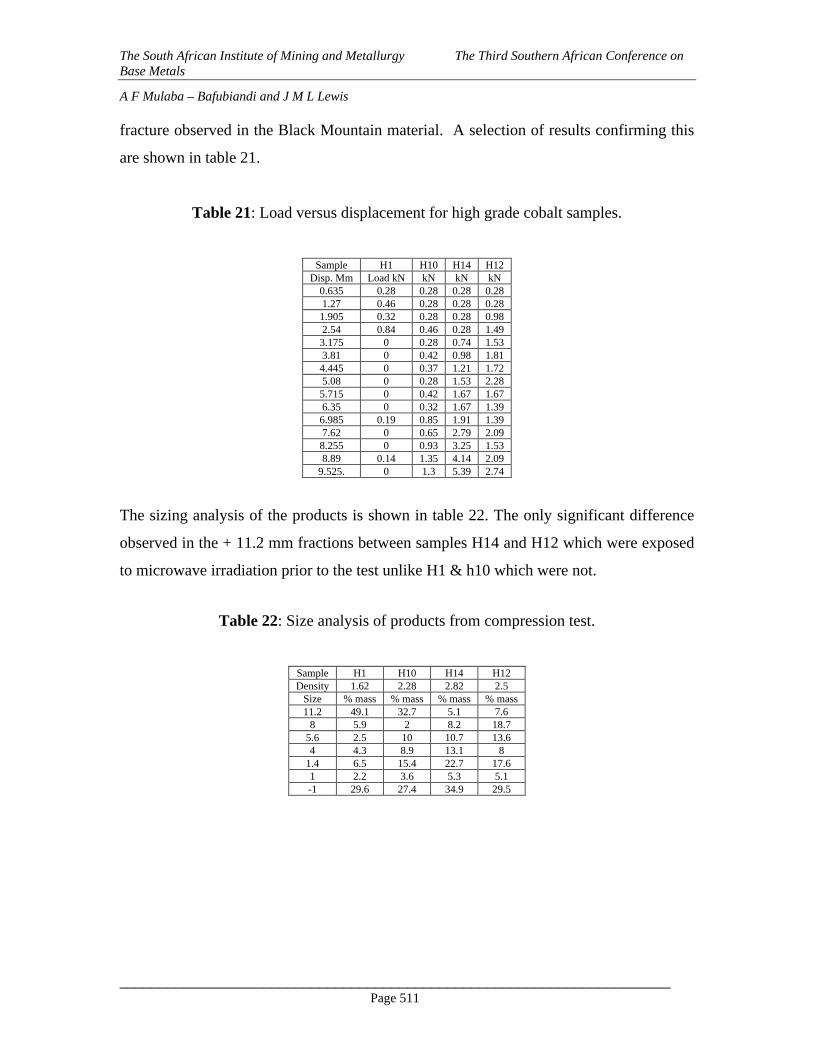
fracture observed in the Black Mountain material. A selection of results confirming this
are shown in table 21.
Table 21: Load versus displacement for high grade cobalt samples.
Sample H1 H10 H14 H12 Disp. Mm Load kN kN kN kN
0.635 0.28 0.28 0.28 0.28 1.27 0.46 0.28 0.28 0.28 1.905 0.32 0.28 0.28 0.98 2.54 0.84 0.46 0.28 1.49 3.175 0 0.28 0.74 1.53 3.81 0 0.42 0.98 1.81 4.445 0 0.37 1.21 1.72 5.08 0 0.28 1.53 2.28 5.715 0 0.42 1.67 1.67 6.35 0 0.32 1.67 1.39 6.985 0.19 0.85 1.91 1.39 7.62 0 0.65 2.79 2.09 8.255 0 0.93 3.25 1.53 8.89 0.14 1.35 4.14 2.09
9.525. 0 1.3 5.39 2.74
The sizing analysis of the products is shown in table 22. The only significant difference
observed in the + 11.2 mm fractions between samples H14 and H12 which were exposed
to microwave irradiation prior to the test unlike H1 & h10 which were not.
Table 22: Size analysis of products from compression test.
Sample H1 H10 H14 H12 Density 1.62 2.28 2.82 2.5
Size % mass % mass % mass % mass 11.2 49.1 32.7 5.1 7.6
8 5.9 2 8.2 18.7 5.6 2.5 10 10.7 13.6 4 4.3 8.9 13.1 8
1.4 6.5 15.4 22.7 17.6 1 2.2 3.6 5.3 5.1 -1 29.6 27.4 34.9 29.5
The South African Institute of Mining and Metallurgy The Third Southern African Conference on Base Metals
A F Mulaba – Bafubiandi and J M L Lewis
_____________________________________________________________________ Page 512
5. Conclusions and recommendations.
Both sample materials were shown to be heated by the microwave energy even at the low
power levels of the microwave oven (900 W). The high cobalt sample responding more
effectively than the sulphide. When the fracture under compression is examined all the
zinc sulphide ore materials showed similar characteristics, whilst the high cobalt oxide
sample gives no indication of such structural failure.
Examination of the products from heavy liquid partitioning shows that the zinc sulfide
material has a tendency to release gangue components from the particle matrix even
without microwave irradiation. No indication of a favourable response to value liberation
has been observed for the high grade cobalt oxide materials. It is also recognized that the
use of the heavy liquid method of assessment may not be appropriate to this sample as a
consequence of the identified particle porosity.
The hand picked high grade cobalt oxide sample having very little gangue content has no
requirement for any enhancement of value liberation and is of such a physical
composition that knowledge gained from its examination is unlikely to be valid for cobalt
oxide ores of a more conventional composition (1-3%Co) and structure. However in view
of the known and demonstrated response of the cobalt mineral to the microwave heating
an ore of more realistic composition should be tested.
The zinc sulphide ore material on the other hand already shows potential for liberation
which it is anticipated can be enhanced with the use of microwaves. The present results
show that the techniques applied in this investigation yield indicators relative to mineral
liberation.
It is suggested that the work on the zinc sulphide ore continues and that the techniques
developed be tested upon other ore samples as a means of preliminary assessment of
microwave potential applications.

The South African Institute of Mining and Metallurgy The Third Southern African Conference on Base Metals
A F Mulaba – Bafubiandi and J M L Lewis
_____________________________________________________________________ Page 513
6. References.
Beck, R.D., and Chamart, J.J., (1980). The Broken Hill Concentrator of Black Mountain
Mineral development Company (Pty) Limited South Africa, The South African Institute
of Mining and Metallurgy, Conference on Complex Sulphide ores, Oct. 1980. pp 88-99.
Bradshaw S.M., (1999).Applications of Microwave heating in mineral processing, South
African Journal of Science 95, September 1999, pp 394 – 396.
Fandrich R.G., Bearman R.A., Boland J., Lim W., (1997). Mineral Liberation by Particle
Bed breakage, Minerals Engineering, vol 10, No 2, pp 175 – 187, 1997.
Güngor A., Atalay Ü., (1998). Microwave processing and grindability, 7th Int. Min. Proc.
Symp. (comminution, classification and sizing) Istambul 1998, pp13 – 16.
Kanellopoulous A., Ball A., (1975). The fracture and thermal weakening of quartzite in
relation to comminution, JSAIMM, vol 76, Oct 75, pp45 – 52.
Kingman S.W., Vorster W., Rowson N.A., (2000). The effect of microwave radiation on
the processing of Palabora Copper ore, JSAIMM., vol 100, No 3, May/June 2000, pp 197
– 204.
Kingman S.W., Vorster W., Rowson N.A., (2000). The influence of mineralogy on
microwave assisted grinding, Minerals Engineering, vol 13, No 3, pp 313 – 327.
Lewis, J, (2005), An investigation on Microwave assisted comminution, M-Tech
dissertation, University of Johannesburg.
Patnaik N., Rao R.B., (2004). Microwave Energy in Mineral Processing – A Review, IE
(I) Jornal – MN, Vol 84, February 2004, pp 56 – 61.

The South African Institute of Mining and Metallurgy The Third Southern African Conference on Base Metals
A F Mulaba – Bafubiandi and J M L Lewis
_____________________________________________________________________ Page 514