Effects of Microbial Transglutaminase and Fermentation ...
14
10.22037/afb.v6i3.24359 http://dx.doi.org/ Research Article APPLIED FOOD BIOTECHNOLOGY, 2019, 6 (3):151-164 Journal homepage: www.journals.sbmu.ac.ir/afb pISSN: 2345-5357 eISSN: 2423-4214 Effects of Microbial Transglutaminase and Fermentation Type on Improvement of lysine Availability in Wheat Bread: A Response Surface Methodology Neda Mollakhalili Meybodi 1 , Amir Mohammad Mortazavian 2* , Leila Mirmoghtadaie 2 *, Seyede Marzieh Hosseini 2 , Seyyed Ali Yasini 3 , Mohammad Hossein Azizi 4 , Somayeh Mousavi Nodoushan 5 1-Department of Food Science and Technology, Student Research Committee, National Nutrition and Food Technology Research Institute, Faculty of Nutrition Science and Food Technology, Shahid Beheshti University of Medical Sciences, Tehran, Iran. 2- Department of Food Science and Technology, National Nutrition and Food Technology Research Institute, Faculty of Nutrition Science and Food Technology, Shahid Beheshti University of Medical Sciences, Tehran, Iran. 3- Department of Food Science and Technology, Islamic Azad University, Yazd, Iran. 4- Department of Food Science and Technology, Agriculture Collage, Tarbiat Modares University, Tehran, Iran. 5- Laboratory of Food, Cosmetic and Hygiene control, Shahid Sadoughi University of Medical science, Yazd, Iran. Abstract Background and objective: Lysine-glutamine crosslink formation catalyzed by microbial transglutaminase is supposed to affect improvement of lysine availability in wheat bread. Present study is done to investigate the effect of microbial transglutaminase and fermentation type in improvement of the lysine availability of wheat bread. Material and methods: Lysine-fortified wheat breads were formulated using response surface methodology with composite-face central design. Statistical models were used to predict the impact of defatted soy flour level (0-50% w w -1 ), microbial transglutaminase level (0-1.6% w w -1 ) and fermentation type (yeast or mixed fermentation based on sourdough). Further information was provided on the individual role of independent variables in nutritional and structural characteristics of optimized formulation and blank and control samples. Experiments were carried out in triplicate and the mean values were analyzed using one-way analysis of variance and Tukey’s test. Results and conclusion: The suggested formula contained 26.64% w w -1 of defatted soy flour and 0.55% w w -1 of microbial transglutaminase, which was fermented using sourdough-based mixed fermentation and provided 0.16 mg 100 g -1 of available lysine and 2.09 cm 3 g -1 of specific volume. The highest lysine chemical score (22.79±0.16), essential amino acid index (35.31±0.37) and biological value (26.79±0.02) and the lowest lysine loss during the baking process seen in optimized formulation verified the effectiveness of microbial transglutaminase in lysine fortification of defatted soy flour/wheat breads (P ≤0.05). Considering rheology parameters and textural analysis, microbial transglutaminase treatment increased elastic modulus and β-sheet structure. These structural changes decreased final products digestibility, which can increase using mixed fermentation based on sourdough. Conflict of interest: The authors declare no conflict of interest. Article Information Article history: Received 17 Feb 2019 Revised 6 Apr 2019 Accepted 20 Apr 2019 Keywords: ▪ Fermentation ▪ Fortification ▪ Lysine ▪ Transglutaminase ▪ Soy flour ▪ Wheat breads *Corresponding authors: Amir Mohammad Mortazavian* Leila Mirmoghtadaie** Department of Food Science and Technology, National Nutrition and Food Technology Research Institute, Faculty of Nutrition Sciences and Food Technology, Shahid Beheshti University of Medical Sciences, Tehran, Iran. *E-mail: [email protected] **E-mail: [email protected] 1. Introduction Bread is the main foodstuff consumed worldwide. It is usually prepared using flour (mainly wheat flour), water, yeast and salt as its major ingredients. The distinctive characteristic of wheat protein to form a three dimensional, viscoelastic network (gluten) is recognized considerably important in proliferating various types of breads [1]. Indeed, the quality of wheat flour in baking breads is affected by its gluten quality and quantity. In general, the nutritional quality of wheat flour is poor (53 out of 100) regarding its low essential amino acid (EAA) contents, especially lysine contents [2]. Furthermore, the Maillard reaction during the baking process aggravates wheat lysine deficiency by decreasing its availability in food matrices. Nowadays, people are greatly concerned about their diets and know that appropriate diets are sources of (amino acids, minerals and vitamins as well as delivered energy sources. Despite frequency of protein deficiency in world especially in developing countries (due to the extensive use
Transcript of Effects of Microbial Transglutaminase and Fermentation ...
10.22037/afb.v6i3.24359http://dx.doi.org/
Research Article
APPLIED FOOD BIOTECHNOLOGY, 2019, 6 (3):151-164 Journal homepage: www.journals.sbmu.ac.ir/afb
pISSN: 2345-5357
eISSN: 2423-4214
Effects of Microbial Transglutaminase and Fermentation Type on Improvement of lysine Availability in Wheat Bread: A Response Surface Methodology
Neda Mollakhalili Meybodi1, Amir Mohammad Mortazavian2*, Leila Mirmoghtadaie2*, Seyede Marzieh Hosseini2, Seyyed Ali Yasini3, Mohammad Hossein Azizi4, Somayeh Mousavi Nodoushan5
1-Department of Food Science and Technology, Student Research Committee, National Nutrition and Food Technology Research Institute,
Faculty of Nutrition Science and Food Technology, Shahid Beheshti University of Medical Sciences, Tehran, Iran.
2- Department of Food Science and Technology, National Nutrition and Food Technology Research Institute, Faculty of Nutrition Science
and Food Technology, Shahid Beheshti University of Medical Sciences, Tehran, Iran.
3- Department of Food Science and Technology, Islamic Azad University, Yazd, Iran.
4- Department of Food Science and Technology, Agriculture Collage, Tarbiat Modares University, Tehran, Iran.
5- Laboratory of Food, Cosmetic and Hygiene control, Shahid Sadoughi University of Medical science, Yazd, Iran.
Abstract
Background and objective: Lysine-glutamine crosslink formation catalyzed by microbial
transglutaminase is supposed to affect improvement of lysine availability in wheat bread.
Present study is done to investigate the effect of microbial transglutaminase and
fermentation type in improvement of the lysine availability of wheat bread.
Material and methods: Lysine-fortified wheat breads were formulated using response
surface methodology with composite-face central design. Statistical models were used to
predict the impact of defatted soy flour level (0-50% w w-1
), microbial transglutaminase
level (0-1.6% w w-1
) and fermentation type (yeast or mixed fermentation based on
sourdough). Further information was provided on the individual role of independent
variables in nutritional and structural characteristics of optimized formulation and blank and
control samples. Experiments were carried out in triplicate and the mean values were
analyzed using one-way analysis of variance and Tukey’s test.
Results and conclusion: The suggested formula contained 26.64% w w-1
of defatted soy
flour and 0.55% w w-1
of microbial transglutaminase, which was fermented using
sourdough-based mixed fermentation and provided 0.16 mg 100 g-1
of available lysine and
2.09 cm3
g-1
of specific volume. The highest lysine chemical score (22.79±0.16), essential
amino acid index (35.31±0.37) and biological value (26.79±0.02) and the lowest lysine loss
during the baking process seen in optimized formulation verified the effectiveness of
microbial transglutaminase in lysine fortification of defatted soy flour/wheat breads (P
≤0.05). Considering rheology parameters and textural analysis, microbial transglutaminase
treatment increased elastic modulus and β-sheet structure. These structural changes
decreased final products digestibility, which can increase using mixed fermentation based on
sourdough.
Conflict of interest: The authors declare no conflict of interest.
Article Information
Article history:
Received 17 Feb 2019
Revised 6 Apr 2019
Accepted 20 Apr 2019
Keywords:
▪ Fermentation
▪ Fortification
▪ Lysine
▪ Transglutaminase
▪ Soy flour
▪ Wheat breads
*Corresponding authors:
Amir Mohammad Mortazavian*
Leila Mirmoghtadaie**
Department of Food Science and
Technology, National Nutrition
and Food Technology Research
Institute, Faculty of Nutrition
Sciences and Food Technology,
Shahid Beheshti University of
Medical Sciences, Tehran, Iran.
*E-mail: [email protected]
**E-mail:
1. Introduction
Bread is the main foodstuff consumed worldwide. It is
usually prepared using flour (mainly wheat flour), water,
yeast and salt as its major ingredients. The distinctive
characteristic of wheat protein to form a three dimensional,
viscoelastic network (gluten) is recognized considerably
important in proliferating various types of breads [1].
Indeed, the quality of wheat flour in baking breads is
affected by its gluten quality and quantity. In general, the
nutritional quality of wheat flour is poor (53 out of 100)
regarding its low essential amino acid (EAA) contents,
especially lysine contents [2]. Furthermore, the Maillard
reaction during the baking process aggravates wheat lysine
deficiency by decreasing its availability in food matrices.
Nowadays, people are greatly concerned about their diets
and know that appropriate diets are sources of (amino
acids, minerals and vitamins as well as delivered energy
sources. Despite frequency of protein deficiency in world
especially in developing countries (due to the extensive use

Neda Mollakhalili Meybodi, et al __________________________________________________________________________________________________
152_______________________________________________________________________________________ Appl Food Biotechnol, Vol. 6, No. 3 (2019)
of low-protein plant-based diets), the major concern seems
not to be the overall protein requirements but the specific
quantitative needs of EAAs and their balanced ratios [2].
Considering ubiquitous consumption of wheat breads with
a poor nutritional quality, fortification of breads with
lysine-rich sources have been reported in many studies
[3,4]. Legumes are known as appropriate complementary
to cereals due to their high lysine contents [5]. Therefore,
special attentions have been devoted to soy flour,
considering its high lysine proportions and improved
protein efficiency ratios (PER) [6]. Notwithstanding
suggested positive effects of lysine-rich source
incorporation to wheat breads, it is not however so
practical. Since lysine is highly susceptible to lose its
availability via Maillard reaction, this is definitely
developed, resulting a higher reactant availability [7].
Sensory characteristics of fortified products are also
adversely affected, regarding wheat gluten dilution effects
[8]. Transglutaminase enzymes seem appropriate to solve
these problems.
Transglutaminase enzymes (e.g. protein-glutamine γ-
glutamyltransferase EC 2.3.2.13) are naturally originated
from mammalian tissue/blood, invertebrate, plant and
microbial cells. However, microbial originated trans-
glutaminase enzymes are preferred in food sciences due to
their high mass production rates, activation independency
to cofactors and no adverse effects on final products [9].
Transglutaminase enzymes isolated from microbial cells
(microbial transglutaminase, MTG), as extracellular
enzymes from various Streptomyces mobaraensis, are
well-known for catalyzing two types of reactions of
transamidation and deamidation. In fact, MTG catalyzes
transamidation reactions to introduce new crosslinks; in
which, the ɤ-carboxyamide groups of peptide-bound
glutamine residues act as donors and primary amines as
acceptors. Formation of new crosslinks is however
efficient to improve rheological and textural characteristics
of the fortified wheat breads [10]. Therefore, this may help
improve availability of lysine in human body by keeping
lysine as an endogenous amino acids and preventing its
loss via Maillard reaction. Fermentation can affect MTG
activity by either acidity change or substrate availability
[11]. Hence, adding a mixture of defatted soy flour (DSF)
(as a lysine-rich source) and MTG enzyme to wheat flour
fermented by various processes seems an interesting
approach to improve nutritional quality of wheat breads.
Considering importance of wheat breads in human diets
especially in developing countries, the poor nutritional
quality of these breads due to low contents of the EAA of
lysine and the necessity of preserving availability of lysine
and sensory characteristics of the fortified wheat breads,
the aim of this research was to develop lysine fortified
wheat breads optimized by response surface methodology,
using a combination of MTG enzyme, defatted soy flour
and fermentation type based on evaluating the effect-
iveness of MTG in improvement of lysine availability,
specific volume and lysine bioavailability in final product.
2. Materials and methods
2.1. Bread ingredients
Defatted soy flour (8.56% w w-1
moisture and 22.54% w
w-1
protein) was purchased from Top Soy (Tabriz, Iran),
Wheat flour (12.2% w w-1
moisture and 11.07% w w-1
protein) from Roshan (Yazd, Iran), Microbial
transglutaminase enzyme from Dor-Shimi-Marjan (Tehran,
Iran), salt and sugar from Pars Namak Kaveh (Tehran,
Iran); sunflower oil from Behshahr Industrial (Tehran,
Iran), and dried instant yeast was obtained from Khuzestan
Yeast (Dezful, Iran).
2.2. Bread preparation
A multi factorial based experimental design approach
was set up to study and optimize the fermentation type and
the level of MTG and defatted soy flour addition for the
quality of bread-baking and improvement of lysine
availability. Various levels of MTG and defatted soy flour
were tested in a standard bread recipe used in industries.
These breads were fermented either via yeast starter
fermentation or mixed fermentation based on sourdough
(MF-SD). The bread formulations were coded as
summarized in Table 1. The amount of water is determined
by similar consistency measured by farinograph
(Brabender, Germany) [12].
2.2.1. Sponge-dough bread
Sponge-dough bread with a proportion of 60:40 was
provided according to AACC Method 10.11.01. Two types
of fermentation were used to prepare dough as follow [13].
2.2.1.1. Yeast starter fermentation
Sponge was obtained by 540 g wheat-soy flour (various
ratio according to the formula), 60% of water (based on
farinograph data) and 2.2 g 100 g-1
of flour active dry
yeast. This was mixed in a bowl and kept for 4 h inside the
fermentation cabinet set at 29±0.5C. Dough formulation is
also determined as 360 g of wheat-soy flour (various ratio
according to the formula), MTG (based on the formula),
4.5 g of sugar (0.5% w w-1
flour basis), 9 g of salt (1% w
w-1
flour basis), 27 g of canola oil (3% w w-1
flour basis)
and the other portion of water. After mixing the dough
ingredients for 2 min, the sponge was added in three
separate fractions with continuous mixing for at least 5
min. The mixture is then placed at fermentation cabinet set
at 29±0.5C for 30 min. Afterward, the dough was divided
into 900 g portions, sheeted, shaped and putted in baking
pans with a temperature of 29±0.5C for 30 min. Then the
baking process is done in a convection oven (Model PFB-
2, Duke manufacturing Company, St Louis, MO, USA) for
30 min at 220C. The appropriate baking time was
____________Lysine availability improvement of the wheat breads _______________________________________________________________________
Appl Food Biotechnol, Vol. 6, No. 3 (2019) _______________________________________________________________________________________153
reported based on the bread stickiness and ability to easily
detach from the pan edges [13].
2.2.1.2. Mixed fermentation based on sourdough (MF-
SD)
Sour-dough breads with a 60:40 proportion of sour to
dough were provided by overnight fermentation. The sour
was prepared by 540 g wheat-soy flour and 60% w w-1
water based on farinograph data. After mixing the
ingredients for 2 min, it is putted in a bowl and held for 20
h in the fermentation cabinet with a temperature of
29±0.5C. Then dry yeast were added at 2.2 g 100 g-1
flour
and incubated for 4 h at 29±0.5C. The dough preparation
and baking process were similar to processes previously
described [13].
2.3. Bread evaluation and optimization
2.3.1. Specific volume
Determination of breads specific volumes (which is
calculated based on volume to weight ratio) were done in
triplicate by seed displacement methodology (AACC
Method 10-05.01), nearly 1h after leaving the oven [14].
2.3.2. Available lysine
Dried samples (powdered form) were mixed with 6% of
aqueous sodium dodecyl sulphate (25 mg 3 ml-1
). The
solution is then incubated for 30 min (with stirring for 30 s
at every 10 min) and filtrated through filter (Wathman
No.40, USA). Available lysine content was measured in
filtrates using O-Phthalaldehyde assay. This assay
estimates the level of lysine blockage via transglutaminase
activity or baking process (Maillard reaction). The f assay
was carried out as previously described by Michalska et al.
[15]. The mixture containing 0.5 ml sample, 1 ml O-
Phthalaldehyde reagent and 1 ml water was incubated for 3
min and its fluorescence readings were determined at λEx =
340 and λEm= 455 nm, respectively. The quantification was
carried out using the method of external standard and a
calibration curve of Na-acetyl-L-lysine at the range of 10 -
250 mM. Data (expressed as mg kg-1
protein) were the
mean values of three replications.
The loss rate of the available lysine during dough
preparation and bread baking (respectively indicating
lysine cross-linked by MTG and lysine loss via Maillard
reaction respectively) was calculated using the following
formula [16].
Available lysine loss rate (%) = (Available lysine in dough/bread-available lysine in flour/dough)×100
Available lysine in flour
2.4. Nutritional characterization
2.4.1. In vitro protein digestibility (IVPD)
The IVPD determination of samples was done based on
a modified pepsin-pancreatin digestion method. Bread
samples (1 g each) were incubated with pepsin solution (1
mg pepsin is dissolved in 10 ml of 0.1 M HCl) at 37°C for
3h and neutralized using 2M NaOH. Then, the pancreatin
solution obtained by dissolving 4 mg pancreatin in
phosphate buffer solution with a constant pH of 8 (7.5 ml)
was added to the samples and left for 24 h at 37°C adjusted
incubator. To prevent microbial growth, 1 ml of toluene
was added to the samples. After 24 h, enzyme was
inactivated using trichloroacetic acid (10 ml, 20% w v-1
),
and precipitation of undigested protein using centrifugation
at 5000 ×g for 20 min. The protein content of precipitate
was extracted and determined. The IVPD was reported as
the total protein fraction solubilized after enzyme
hydrolysis. The supernatant, was used for amino acids
profiling using a modified method of AOAC 982.30a [17].
2.4.2. Amino acid content
The amino acids contents were assessed using Amino
Acid Analyzer (Biochrom 30 Series, Cambridge, UK). The
supernatant provided by 1g of the sample was exposed to
5.7 M HCl (with a proportion of 1 ml 10 mg-1
of proteins)
under nitrogen flow (to prevent amino acids degradation).
This was and incubated for 24 h at 110°C. The solvent was
vaporized using vacuum rotary and re-suspended in
sodium citrate buffer with adjusted pH of 2.2 and filtered
via 0.22 mm pore size filter (Millipore, USA). All amino
acids were assessed individually. However, tryptophan
quantification was not possible by this method. The amino
acids content (mg 16 g-1
N) was calculated by considering
amino acids and protein content of bread.
Chemical score described samples protein quality
regarding its essential amino acid content compared to
reference protein (hen’s egg). The EAAs with the lowest
chemical score are considered as limited essential amino
acids. The chemical score of the most limiting EAA is
considered as the protein score [17]. The essential amino
acids index (EAAI) estimate the assessed proteins quality
by considering the EAA ratio of the test and reference
protein as follow:
𝐸𝐴𝐴𝐼 = √(𝐸𝐴𝐴1 × 100)(𝐸𝐴𝐴2 × 100) … . . (𝐸𝐴𝐴𝑛 × 100)[𝑆𝑎𝑚𝑝𝑙𝑒]
(𝐸𝐴𝐴1 × 100)(𝐸𝐴𝐴2 × 100) … . . (𝐸𝐴𝐴𝑛 × 100)[𝑅𝑒𝑓𝑒𝑟𝑒𝑛𝑐𝑒]
𝑛
The biological value (BV) shows consumable fraction
of the test proteins. This was calculated using the
following equation:
BV = [1.09 × EAAI] -11.70
The PER estimates the nutritional quality of the proteins
based on the amino acids profile of the samples after
hydrolysis. The PER was calculated using a model
developed by Ihekoronye [18] as follows:
PER= -0.468 + (0.454 × leucine) - (0.105 × tyrosine)

Neda Mollakhalili Meybodi, et al __________________________________________________________________________________________________
154_______________________________________________________________________________________ Appl Food Biotechnol, Vol. 6, No. 3 (2019)
Nutritional index (NI) which shows qualitative and
quantitative characteristics of the test proteins was
calculated based on the following formula:
NI = EAAI × protein (%)/100
2.5. Fundamental rheological measurement
Oscillatory shear characterizations of samples were
carried out using controlled shear/stress rheometer (Anton
Paar MCR301, GmbH, Germany) and parallel plate
geometry at 30°C. A sample was collected from the dough
and was permitted to rest for 45 min on the plate. Strain
sweep test was carried out to determine the linear
viscoelastic region. Since, results indicated the linear
behavior of dough at strain lower than 0.1%, frequency
sweep test was carried out at a range of (0.1-100 Hz at
constant strain (0.01%). Parameter damping factor (tan δ)
and complex modulus (G*) were calculated respectively
using the following formula [19]:
tan δ =G′′
G′ ; G*=√G′2 + G′′2
2.6. Textural characteristics of breads
Instrumental texture parameters were calculated using
texture profile analyzer (Stable Micro Systems Ltd.,
Surrey, UK) according to a modified AACC Approved
Method 74-09 (2000). A piece of the crumb (20×20×25
mm) was pressed to 50% of its original height at speed of 1
mm s-1
with a 36 mm cylinder probe using 5 kg load cell.
The analysis was carried out in six replicates at 25±3C̊ on
the bread slices. Hardness, cohesiveness, springiness and
chewiness of the crumb were calculated by means of
resulting Texture profile analysis curves [20].
2.7. Fourier transform infrared (FTIR)
The FTIR spectra was measured by Fourier transform
spectrophotometer (PerkinElmer, West Midlands, UK)
using potassium bromide (KBr, 200 mg) pellet method
with KBr as control. Determination of each sample is done
at 25°C using 16 scans in the range of 4000-400 cm−1
(with
a resolution of 4 cm-1
). The curve-fitting analysis of amide
I region was done by PeakFit software version 4.12 (SPSS
Inc., Chicago, IL, USA), and its corresponding peak area
was calculated [21].
2.8. Statistical analysis
All the experiments were carried out in three
replications. One-way analysis of variance and Tukey’s
test was used to identify significant differences in
treatment means. Furthermore, determining the linear
correlations were reported. The adequacies of models were
also investigated by variance analysis (F test), R2 values,
lack-of-fit tests and normal and residual plots. P≤0.05 is
considered statistically significant. Data were processed
using SPSS statistical software (SPSS Statistics 23.0,
Chicago, IL, USA).
3. Results and discussion
Twenty-six samples were produced based on the
experimental design and parameters of specific volume and
available lysine of the samples were calculated (Table 1).
Data were analyzed using specific software to validate
suggested formulations of ‘sequential model sum of
squares’ and ‘lack of fit’. The lack-of-fit P-value, factor P-
value, R2
(R-squared) and adjusted R2of the suggested
model were calculated for each function (Table 2). The
P≤0.05 was considered statistically significant. Linear
function for specific volume and quadratic function for
available lysine were approved using specific software (P
≤0.05). Final equations with coded independent variables
(A, defatted soy flour; B, microbial transglutaminase; C,
fermentation type) were as following:
SV = 2.29 − 0.68 × A − 0.18 × B − 0.23 × C
AL = 0.12 + 0.0241 × A − 0.0062 × B + 0.0425 × C − 0.0001
× AB + 0.0018 × AC0.0037 × BC − 0.0180 × A2 − 0.0181
× B2
Numerical optimization was used to show precise
values for independent variables providing the desired
response. The available lysine (AL) and specific volume
(SV) were calculated together. In general, 100 solutions
were suggested by the software and the first suggestion
(desirability value 1) was chosen. The suggested formula
included 26.64% w w-1
DSF, 0.55% w w-1
MTG and MF-
SD to provide 0.16 mg 100 g-1
of AL and 2.09 cm3
g-1
of
SV. Optimized levels of DSF, MTG and fermentation type
were used to prepare breads in three replicates. The SV and
AL values of optimized breads were calculated and the
average and predicted values from the model were
compared using one sample T-test. The verification results
are presented in Table 3. No statistically significant
differences (P>0.05) were observed between the values
from validations. This indicates prediction effectiveness of
the model achieved from optimization. The optimized
bread, which is called F1, was compared with blank and
control samples to provide additional information on the
individual roles of independent variables (DSF, MTG and
fermentation type) on nutritional, textural and structural
characteristics of the samples. These formulations were
described as follows: Blank 1: MTG=0.55% w w-1
,
DSF=0, yeast fermentation; Blank 2: MTG=0,
DSF=26.64% w w-1
and sourdough fermentation; Control
1: DSF=0, MTG=0 and sourdough fermentation; and
Control 2: DSF=0, MTG=0 and yeast fermentation); also
called F2, F3, F4 and F5, respectively.

____________Lysine availability improvement of the wheat breads _______________________________________________________________________
Appl Food Biotechnol, Vol. 6, No. 3 (2019) _______________________________________________________________________________________155
Table 1. Properties of different formulation of soy-wheat breads as suggested by mixture experimental design
Trial Component proportion in
lysine fortified wheat bread
Properties
X1 X2 X3 Formula Weight (g) Volume
(cm3)
Specific
volume
(cm3 g-1)
Available
lysine
(mg 100 g-1)
1 42.68 0.23 S S4T2 (S) 749.06 1033.70 1.38 0.15
2 25 0.8 S S3T3 (S) 673.98 1253.60 1.86 0.15
3 25 0.8 Y S3T3 (Y) 698.23 1864.27 2.67 0.08
4 0 0.8 S S1T3 (S) 694.67 1778.36 2.97 0.06
5 42.68 0.23 Y S4T2 (Y) 721.08 1348.42 1.87 0.07
6 42.68 1.37 Y S4T4 (Y) 719.76 1504.30 2.09 0.03
7 25 0.8 Y S3T3 (Y) 683.17 1796.74 2.63 0.10
8 7.32 1.37 S S2T4 (S) 649.63 1663.05 2.56 0.11
9 25 0.8 Y S3T3 (Y) 703.16 1800.08 2.56 0.08
10 25 0.8 S S3T3 (S) 689.38 1482.17 2.15 0.13
11 25 0.8 S S3T3 (S) 706.62 1441.51 2.04 0.15
12 50 0.8 S S5T3 (S) 765.78 666.23 0.87 0.16
13 7.32 0.23 Y S2T2(Y) 694.63 2396.47 3.45 0.03
14 0 0.8 Y S1T3 (Y) 685.14 2315.77 3.28 0.02
15 25 0 Y S3T1 (Y) 694.63 2396.47 3.45 0.03
16 25 0.8 Y S3T3 (Y) 707.56 1967.02 2.78 0.09
17 25 0.8 S S3T3 (S) 671.75 1323.35 1.97 0.14
18 25 1.6 S S3T5 (S) 694.62 1201.69 1.73 0.14
19 7.32 1.37 Y S2T4 (Y) 701.87 2056.48 2.93 0.005
20 25 1.6 Y S3T5 (Y) 715.78 1488.82 2.08 0.02
21 50 0.8 Y S5T3 (Y) 765.23 795.84 1.04 0.10
22 25 0.8 S S3T3 (S) 717.12 1635.03 2.28 0.14
23 25 0 S S3T1 (S) 701.69 1564.77 2.23 0.15
24 42.68 1.37 S S4T4 (S) 764.75 1404.71 1.79 0.15
25 42.68 0.23 S S4T2 (S) 749.06 1033.70 1.38 0.15
26 7.32 0.23 S S2T2 (S) 675.39 2154.49 3.01 0.12
X1= defatted soy flour, X2= microbial transglutaminase enzyme, X3= fermentation type (Y=yeast starter, S= mixed fermentation based on sourdough)
Table 2. Statistical parameters of RSM optimization; considering available lysine and specific volume as dependent variables
and A, B, C as independent ones
Dependent parameter AL SV
Model selection Quadratic Linear
Model p value <0.0001 <0.0001
Lack of fit p-value 0.0567 0.072
Factors p-value
A
B
C
AB
AC
BC
A2
B2
0.0004
0.2403
<0.0001
0.99
0.73
0.47
0.02
0.01
<0.0001
0.03
0.0028
-
-
-
-
R2 0.91 0.84
Adjusted R2 0.86 0.81
P≤0.05 was considered statistically significant. AL: available lysine; SV: specific volume
A: defatted soy flour, B: microbial transglutaminase and C: fermentation type
Table 3. Comparison of optimum point verification test results with the estimated values from the model
Response Predicted value Experimental results Prediction error (%) p-value
AL (mg 100 g-1) 0.16b 0.15±0.02b 6.25 0.22
SV (cm3 g-1) 2.09a 2.07±0.06a 0.96 0.36
P≤0.05 was considered statistically significant.
AL: available lysine; SV: specific volume
Neda Mollakhalili Meybodi, et al __________________________________________________________________________________________________
156_______________________________________________________________________________________ Appl Food Biotechnol, Vol. 6, No. 3 (2019)
3.2. Nutritional analysis
Proteins (qualitative and quantitative) are normally
described as the key components in nutritional value
characteristics of the breads. Therefore, nutritional
characteristics of soy-wheat breads were assessed in the
current study using bread protein fractions to investigate
effects of DSF and MTG additions and various
fermentation types on bread quality. Generally, quality of
proteins is predictable using their amino acids
compositions and limiting ones. Lysine is considered as the
first limiting amino acids in breads not only due to its
small quantity, but also as a result of nutritional
availability loss induced by the Maillard reaction [7].
Lysine, as an EAA, is a primary amine that is available
when its ε-amino group is free [15].
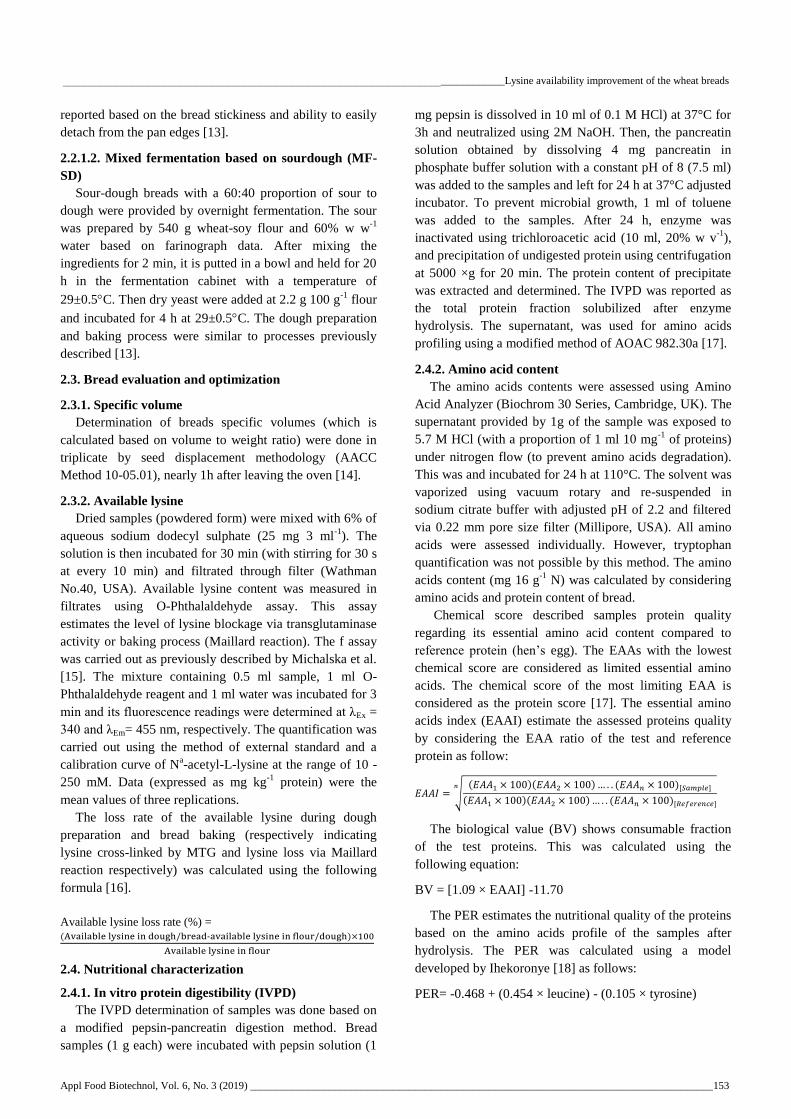
3.2.1. Loss of available lysine
Blockage of the lysine ε-amino group by Maillard
reaction or MTG-mediated crosslink results in available
lysine loss [22]. In this study, available lysine contents in
flour, dough and breads were calculated (Figure 1). It has
been suggested that differences in available lysine contents
of flour and dough were mainly affected by the
fermentation process and MTG enzyme activity. However,
breads significantly differed from doughs in available
lysine contents because of the Maillard reaction during the
baking process [16]. Results indicated that DSF inclusion
significantly increased the available lysine content of flour
(P≤0.05). The value of AL in formulations substituted with
26.64% w w-1
DSF increased from 0.412 to 0.992 mg 100
g-1
; possibly due to its higher protein and lysine contents
[23]. The loss rate in available lysine was assessed during
dough preparation to investigate effects of the MTG
enzyme as it introduced new crosslinks between glutamine
and lysine residues [9,15]. Results demonstrated that MTG
inclusion remarkably decreased AL content of the
formulations. Nearly 65.42% lysine loss (between flour
and dough) were observed in samples containing 0.55% w
w-1
MTG while no lysine losses were seen in controls (F4
and F5). The AL content of dough is also affected by the
fermentation type as AL contents of dough significantly
increased in F4 sample which is fermented by MF-SD,
compared to that of yeast fermented samples (F5).
Estimation of available lysine contents of doughs and
breads and their differences were considered as available
lysine loss via Maillard reaction [16]. The highest lysine
loss ratio was seen in DSF fortified wheat breads in
absence of MTG (F3); estimated nearly 69.97% compared
to 50% in controls (absence of DSF). The higher lysine
loss ratio in DSF substituted wheat breads was linked to its
higher substrate availability. In fact, the lysine loss ratio
increased significantly by DSF substitution and decreased
significantly by MTG incorporation (P≤0.05). These
possibly occurred because of their effects on substrate
availability of Maillard reaction [7,22]. However, MTG
addition with DSF substitution seems a good strategy to
preserve chemical availability of lysine; a factor that is
necessary to be monitored respecting is its subsequent
biological availability.
Figure 1. Comparison of available lysine content in flour (AL1), dough (AL2) and bread (AL3) of treatments
0
0.2
0.4
0.6
0.8
1
1.2
1.4
F1 F2 F3 F4 F5
Avai
lab
le l
ysi
ne
(mg 1
00
g-1
)
Samples
AL1
AL2
AL3

____________Lysine availability improvement of the wheat breads _______________________________________________________________________
Appl Food Biotechnol, Vol. 6, No. 3 (2019) _______________________________________________________________________________________157
3.2.2. Amino acid profile
The protein content and amino acids profile of
treatments were monitored to investigate their nutritional
quality. Addition of DSF at 26.64% w w-1
increased wheat
bread protein content from 10.86 to 14.65% of dry matter.
The amino acids compositions of the optimized breads
with blank and control samples are shown in Table 4.
Considering effects of fermentation type, it was illustrated
that formulations with MF-SD included higher amino acids
contents, compared to that yeast leavened formulations did.
Indeed, amino acids profiles of the formulations prepared
by MF-SD process improved significantly, which was
associated to higher proteolytic activity catalyzed by lactic
acid bacteria and their further effective amino acids
production rates [24,25]. In the present study, contents of
EAAs, especially lysine, increased significantly in MF-SD
fermented formulations. However, protein quantity and
amino acids profile are described as indices to investigate
nutritional statuses of the food products. These indices in
combination with protein digestibility provide further
precise information on nutritive values.
In vitro protein digestibility (IVPD) provides
information on how protein hydrolysates endure digestive
processes [17]. In the current study, the highest IVPD was
reported for F3 (treatment substituted with DSF and
fermented by MF-SD in absence of MTG). Comparing
treatments of F3 and F4 which differed only by their DSF
contents, a small enhancement was observed in IVPD
values by DSF addition which could be linked to effects of
DSF on gluten weakening effects [26]. Considering the
effects of fermentation type and DSF addition and MTG
treatment on IVPD of the wheat breads, it was revealed
that although MTG decreased IVPD of soy-wheat breads,
MF-SD increased the value more successfully than that the
yeast fermentation did. Moreover, the lowest IVPD was
seen in F2 (containing 0.55% MTG in absence of DSF
fermented based on yeasts). The remarkably improved
digestibility by MF-SD might be associated to proteolysis
by sourdough lactic acid bacteria and activation of
proteolysis by wheat/soy enzymes under acidic conditions
of the sourdough fermentation [24]. The decreased IVPD
seen in MTG treated samples verified the reverse
correlation of food compactness and digestibility [27]. This
result was similar to results by Giosafatto et al. from a
study on digestibility of transglutaminase treated
ovalbumin [28]. It is noteworthy that introduction of new
bonds involved in β-sheet secondary structures resulted in
further resistant structures to tryptic hydrolysis [29].
In contrast to lysine that entered the Maillard reaction,
those involved in MTG mediated crosslinks are
biologically available. The major difference between these
two reaction products is that Maillard induced crosslinks
are acid stable while MTG mediated crosslinks are not
[30]. Therefore, lysine chemical scores can be helpful in
effectiveness assessment of MTG enzyme performance. In
this study, EAA profiles and their associated chemical
scores were calculated based on EAA reference patterns
(Table 4).
Table 4. Nutritional indices of breads made with optimized, block and control formulation
Properties Trial
F1 F2 F3 F4 F5
Protein content (%) 14.65±0.03a 10.86±0.07b 14.16±0.02a 11.05±0.03b 10.97±0.05b
In vitro protein digestibility 65.27±0.17b 51.11±0.16f 73.27±0.30a 70.26±0.16 a 58.24±0.17d
Chemical score (%)
Thr 56.10±0.16e 25.05±0.05d 31.05±0.14c 40.95±0.01e 10.09±0.02b
Val 37.68±0.10d 18.28±0.18c 21.42±0.13b 33.83±0.21d 48.82±0.12d
Met 12.19±0.41a 7.92±0.31a 6.47±0.08a 12.34±0.13b 5.41±0.18a
Ile 38.35±0.17d 43.83±0.17e 34.81±0.19c 37.49±0.01de 41.34±0.04c
Leu 40.85±0.14d 31.57±0.09c 41.25±0.20b 36.56±0.02d 39.52±0.16b
Tyr+Phe 60.99±0.01f 61.85±0.34f 63.80±0.12e 52.40±0.15f 47.30±0.07d
His 35.79±0.13d 43.07±0.12e 42.63±0.06d 41.79±0.09e 39.92±0.02c
Lys 22.79±0.16b 3.90±0.07a 10.21±0.18a 6.79±0.16 a 1.63±0.13a
Protein score (%) 12.19±0.41 7.92±0.31 6.47±0.08 6.79±0.16 1.63±0.13
Essential amino acid index 35.31±0.37a 21.84±0.12bc 25.36±0.02b 27.72±0.01b 18.59+0.08 c
Biological value 26.79±0.02 a 12.11±0.03c 15.94±0.01b 18.51±0.09b 8.57±0.07 c
Protein efficiency ratio 4.64±0.12 b 3.07±0.08 d 5.50±0.09 a 4.16±0.02c 4.66±0.01b
Nutritional index 5.17±0.01a 2.37±0.04d 3.59±0.09b 3.06±0.03c 2.03±0.06e
Data are reported as average ± standard deviation
Different letters in each row means significantly different (P≤0.05) except chemical score data, which are compared in column (different letter in each
column are significantly different (P≤0.05))
(F1 (DSF: 26.64%, MTG: 0.55% and MF-SD), F2 (MTG=0.55%, DSF= 0, YSF); F3 (MTG=0, DSF=26.64%, MF-SD); F4 (DSF: 0, MTG: 0, MF-SD); F5
(DSF: 0, MTG: 0 and YSF) Thr: Threonine, Val: Valine, Met: Methionine, Ile: Isoleucine, Leu: Leucine, Tyr: Tyrosine, Phe: Phenylalanine, His: Histidine,
Lys: Lysine

Neda Mollakhalili Meybodi, et al __________________________________________________________________________________________________
158_______________________________________________________________________________________ Appl Food Biotechnol, Vol. 6, No. 3 (2019)
To assess effects of treatments on digestibility,
supernatants (digestible protein fractions) were used after
enzyme hydrolysis. While lysine was the first limiting
amino acids in control and DSF substituted samples, this
amino acid was second in optimized formulations (DSF
substituted samples fermented by MF-SD and treated with
MTG). The EAA and BV indices, as the major quality
determining factors of the food proteins, were significantly
the highest in breads prepared with optimized formulation
of F1 (P≤0.05). The PER of the treatments ranged 3.07-
5.50. Based on the data from Table 4, it is obvious that the
PER quantity was changed significantly due to DSF
addition, MTG treatment and fermentation type.
Comparing treatments of F3 and F4, DSF increased PER
significantly (P≤0.05). Moreover, MTG decreased PER,
compared to treatments of F1 and F3. The lowest PER was
reported for F2, which was treated with MTG and yeast
fermentation in absence of DSF. The PER is highly
dependent on sample digestibility; as reported by other
studies [18]. However, MTG treatment decreased PER as
the major indicator of protein quality. Use of MTG in
fortified wheat breads is popular due to its positive effects
on lysine chemical score as the first limiting amino acid.
Lysine chemical score significantly increased in samples
treated with MTG, which could be attributed to lysine
blockage in ε-(γ-glutamyl) lysine moiety catalyzed by
MTG. Lysine was categorized as the second limiting
amino acid in DSF fortified formulations prepared via
MTG treatment fermented by MF-SD; based on the sample
amino acid scores of this study.
Nutritional index (NI), showing qualitative and
quantitative factors, was markedly higher in fortified
samples prepared with MTG (F1) (Table 4). The NI
effectively increased in fortified samples because of
increased protein contents of the fortified samples.
However, MTG treatment decreased digestibility of the
proteins and consequently their bioavailability. Relatively,
MF-SD can be considered as a modulating treatment to
solve this problem. Regarding preventive effects of MTG
on lysine EAA, the highest NI was seen in fortified
samples prepared with MF-SD and treated with MTG. A
negative correlation was seen between the lysine chemical
score and lysine loss ratio via Maillard reaction (R=-0.71,
P≤0.05). In fact, MTG treatment increased the lysine
chemical score by preventing the amino acid loss via
Maillard reaction. A negative correlation was observed
between the biological value and lysine loss via Maillard
reaction (R=-0.68, P≤0.05) since blocked lysine via
Maillard reaction was no longer bioavailable [31].
Considering importance of digestibility in nutritional
quality determination of the final products and its
significant dependency to the structure as affected by the
fermentation type, DSF addition and MTG treatment, the
rheological, textural and structural characteristics of the
samples were provided to the best of the authors'
knowledge.
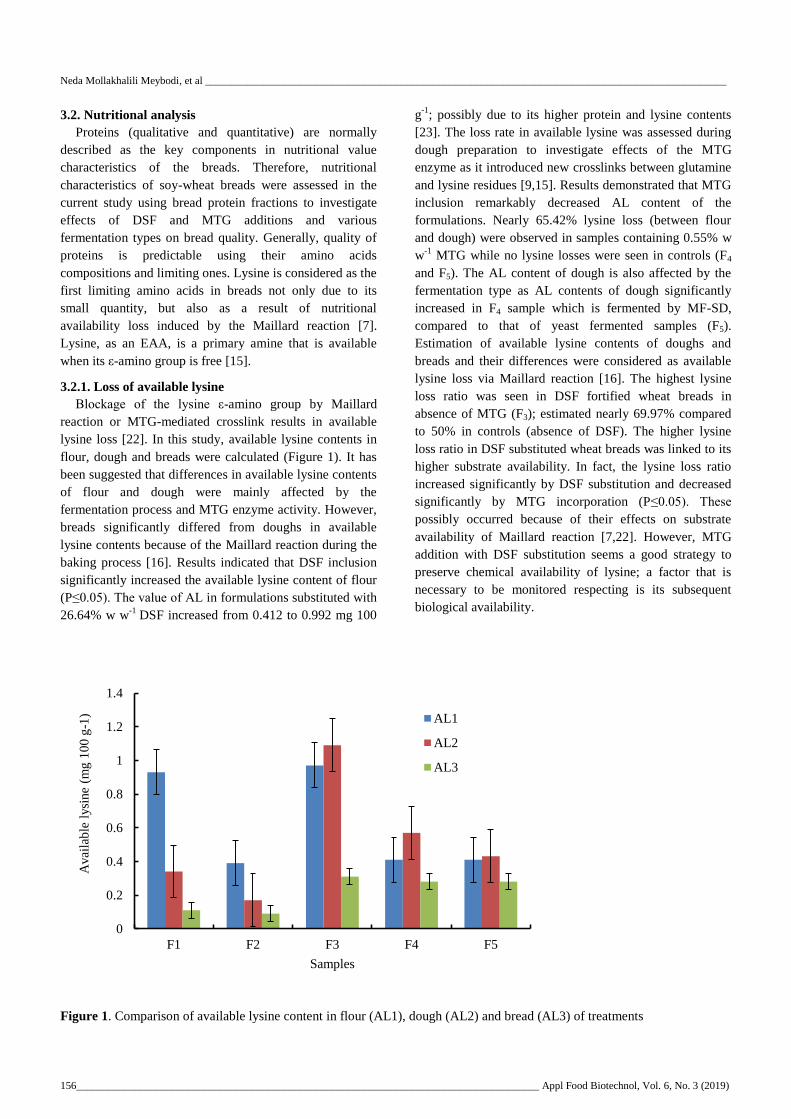
3.3. Dough rheology
Effects of MTG and fermentation type on dynamic
viscoelastic characteristics of wheat dough supplemented
with DSF was investigated using oscillatory test with a
frequency sweep of 0.01–10 Hz. Results showed that
elastic and viscose moduli (G’ and G”) were frequency
dependent and elastic modulus was higher than viscose
modulus at all frequency ranges. Consequently, a solid,
elastic-like structure was observed in dough (data not
shown). Viscoelastic characteristics and deformation
resistance of formulations were assessed using complex
modulus (G*) and damping factor (tan δ) (Figures 2a, b).
Elastic and viscose parameters are known as quality
determination factors in wheat dough since poor quality
wheat doughs are less elastic and more viscous than high
quality wheat doughs. The complex modulus and damping
factor provided valuable information on the strength of
samples, considering elasticity and the viscosity of the
materials [19]. The optimized complex modulus must be
considered in formulations since high complex moduli are
too rigid to allow growth of gas bubbles needed in
fermentation. Furthermore, low complex moduli produce
poor quality doughs unable to restore gases [32]. The
highest complex modulus were seen for dough samples
prepared in absence of DSF and subjected to MTG
treatment and yeast fermentation (F2) and the lowest for
samples fermented using sourdough in absence of DSF and
MTG (F4). The lowest and highest damping factors were
seen for F2 and F3, respectively. Increased complex
modulus and decreased damping factor were observed in
F1treatments, compared to F3. Increased complex modulus
and dough stability by MTG treatment is believed to
induce by increased elastic and viscous characteristics of
the doughs. Decreased tan δ indicated that elastic modulus
increased more relatively [19]. Indeed, the protein
crosslinking reaction catalyzed by MTG treatment seems
to be resulted in network structure and consequently
changes in viscoelasticity characteristics of the composite
doughs. Similar results were achieved from laccase treated
oat doughs [32]. Comparing F4 and F5, it was revealed that
MF-SD considerably decreased firmness and elasticity,
regarding decreased complex modulus and increased
damping factor. The elasticity decrease induced by
sourdough is possibly induced by protein degradation
effects of organic acids and higher protease activities as
shown by other researchers [24]. In DSF addition,
increased complex modulus and similar damping factors
were observed in F3 (containing DSF), compared to F4.
This behavior is assumed to be induced by the gluten
weakening effects and its lower water incorporation [33].
Water molecules in high-moisture doughs usually behave
as inert fillers, which decrease elastic and viscous moduli
and consequently the complex modulus.
____________Lysine availability improvement of the wheat breads _______________________________________________________________________
Appl Food Biotechnol, Vol. 6, No. 3 (2019) _______________________________________________________________________________________159
Figure 2a, b. Complex modulus (|G*|) and phase angle (tan δ) parameters of the investigated formula dough
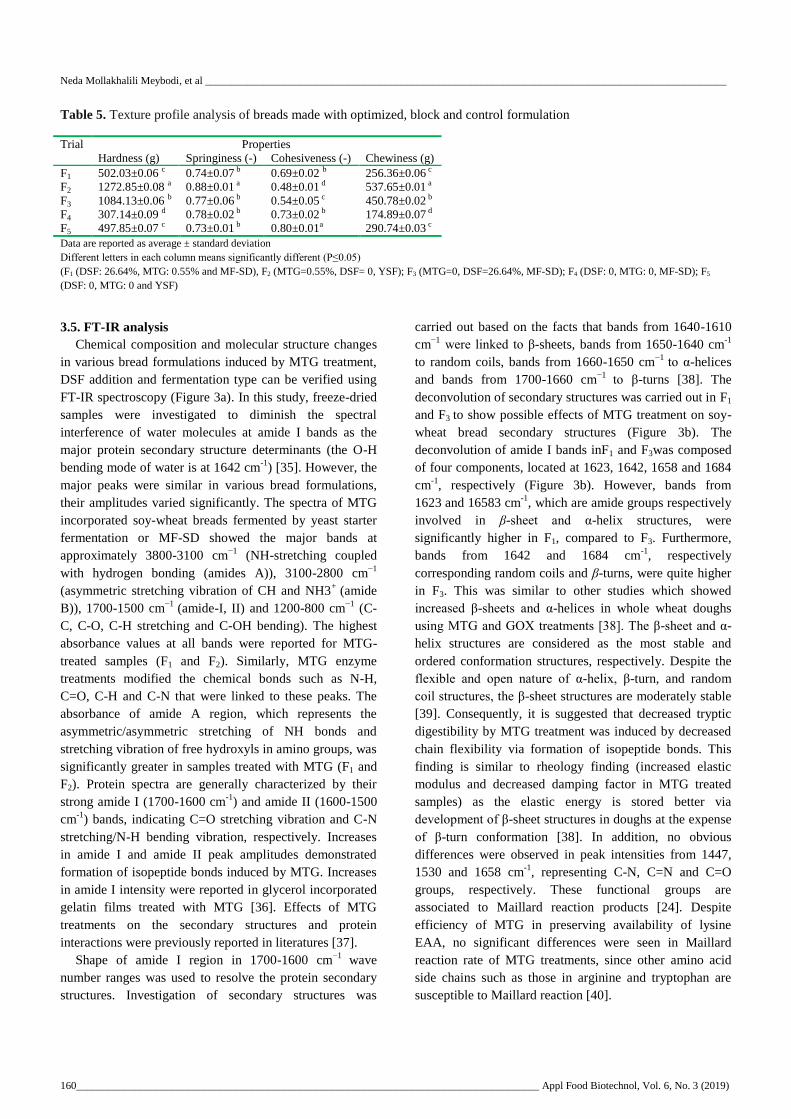
3.4. Texture profile analysis
Texture profile analysis includes two reciprocating
compressions of samples; similar to jaw action. Textural
characteristics of the highlighted treatments verified
significant effects of DSF addition, MTG treatment and
fermentation type (Table 5). The lowest and highest
hardness values were observed in F4 and F2, respectively.
As previously stated, DSF increased sample hardness
significantly (P≤0.05), which increased by MTG (F1
hardness was lower than F3 hardness). In fact, improving
effects induced by MTG treatment depended on the type of
flour, which resulted in further hardness in samples
without DSF. High levels of cohesiveness and springiness
are favored in wheat breads since these parameters
characterize a lower disaggregation during the mastication.
Gluten is well known to be responsible for cohesiveness
and viscoelastic characteristics of the wheat breads. Hence,
defatted soy flour can negatively affect the product
cohesiveness [34]. However, MTG treatment improved the
detrimental effects induced by DSF (comparison of F1 with
F3) and negatively affected wheat bread cohesiveness in
absence of DSF (F2). The MF-SD significantly decreased
cohesiveness (P≤0.05) in accordance with protein network
hydrolysis by the sourdough fermentation directly or pH
mediated activation of proteolytic enzymes of the cereals
[24]. No significant differences in cohesive contents of the
optimized formulations (F1) and control samples (F4)
verified synergic benefits of MF-SD in combination with
MTG in DSF incorporated samples. Springiness which is
also called elasticity indicated the recovery rate of a
deformed material to its initial state after removal of
deforming force. The highest springiness contents found in
F2revealed the increased elasticity of gluten networks
induced by MTG [33]. No statistically significant
differences were reported in springiness contents of other
formulations (P>0.05). Chewiness, as an indicator of
required energy to change a solid-state food to its
swallowable form, shows food hardness, cohesiveness and
springiness together. In the current study, the chewiness
value was changed similar to hardness; as previously
shown by Abdelghafor et al. [35].
10000
100000
1000000
1 10 100
Co
mp
lex m
od
ulu
s (P
a)
Frequency (Hz)
F1 F2 F3 F4 F5
0.1
1
10
1 10 100
Dam
pin
g f
acto
r
Frequency (Hz)
F1 F2 F3 F4 F5
b
a
Neda Mollakhalili Meybodi, et al __________________________________________________________________________________________________
160_______________________________________________________________________________________ Appl Food Biotechnol, Vol. 6, No. 3 (2019)
Table 5. Texture profile analysis of breads made with optimized, block and control formulation
Properties Trial
Chewiness (g) Cohesiveness (-) Springiness (-) Hardness (g)
256.36±0.06 c 0.69±0.02 b 0.74±0.07 b 502.03±0.06 c F1
537.65±0.01 a 0.48±0.01 d 0.88±0.01 a 1272.85±0.08 a F2
450.78±0.02 b 0.54±0.05 c 0.77±0.06 b 1084.13±0.06 b F3
174.89±0.07 d 0.73±0.02 b 0.78±0.02 b 307.14±0.09 d F4
290.74±0.03 c 0.80±0.01a 0.73±0.01 b 497.85±0.07 c F5
Data are reported as average ± standard deviation
Different letters in each column means significantly different (P≤0.05)
(F1 (DSF: 26.64%, MTG: 0.55% and MF-SD), F2 (MTG=0.55%, DSF= 0, YSF); F3 (MTG=0, DSF=26.64%, MF-SD); F4 (DSF: 0, MTG: 0, MF-SD); F5
(DSF: 0, MTG: 0 and YSF)
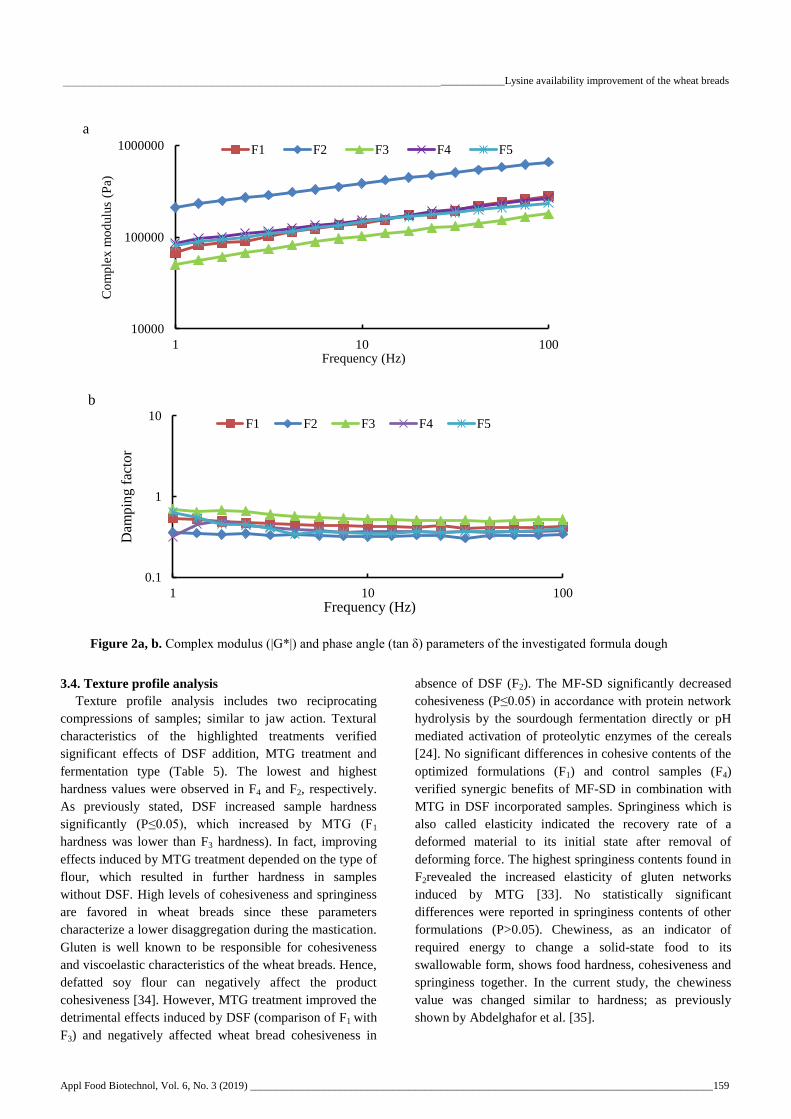
3.5. FT-IR analysis
Chemical composition and molecular structure changes
in various bread formulations induced by MTG treatment,
DSF addition and fermentation type can be verified using
FT-IR spectroscopy (Figure 3a). In this study, freeze-dried
samples were investigated to diminish the spectral
interference of water molecules at amide I bands as the
major protein secondary structure determinants (the O-H
bending mode of water is at 1642 cm-1
) [35]. However, the
major peaks were similar in various bread formulations,
their amplitudes varied significantly. The spectra of MTG
incorporated soy-wheat breads fermented by yeast starter
fermentation or MF-SD showed the major bands at
approximately 3800-3100 cm−1
(NH-stretching coupled
with hydrogen bonding (amides A)), 3100-2800 cm−1
(asymmetric stretching vibration of CH and NH3+
(amide
B)), 1700-1500 cm−1
(amide-I, II) and 1200-800 cm−1
(C-
C, C-O, C-H stretching and C-OH bending). The highest
absorbance values at all bands were reported for MTG-
treated samples (F1 and F2). Similarly, MTG enzyme
treatments modified the chemical bonds such as N-H,
C=O, C-H and C-N that were linked to these peaks. The
absorbance of amide A region, which represents the
asymmetric/asymmetric stretching of NH bonds and
stretching vibration of free hydroxyls in amino groups, was
significantly greater in samples treated with MTG (F1 and
F2). Protein spectra are generally characterized by their
strong amide I (1700-1600 cm-1
) and amide II (1600-1500
cm-1
) bands, indicating C=O stretching vibration and C-N
stretching/N-H bending vibration, respectively. Increases
in amide I and amide II peak amplitudes demonstrated
formation of isopeptide bonds induced by MTG. Increases
in amide I intensity were reported in glycerol incorporated
gelatin films treated with MTG [36]. Effects of MTG
treatments on the secondary structures and protein
interactions were previously reported in literatures [37].
Shape of amide I region in 1700-1600 cm−1
wave
number ranges was used to resolve the protein secondary
structures. Investigation of secondary structures was
carried out based on the facts that bands from 1640-1610
cm−1
were linked to β-sheets, bands from 1650-1640 cm-1
to random coils, bands from 1660-1650 cm−1
to α-helices
and bands from 1700-1660 cm−1
to β-turns [38]. The
deconvolution of secondary structures was carried out in F1
and F3 to show possible effects of MTG treatment on soy-
wheat bread secondary structures (Figure 3b). The
deconvolution of amide I bands inF1 and F3was composed
of four components, located at 1623, 1642, 1658 and 1684
cm-1
, respectively (Figure 3b). However, bands from
1623 and 16583 cm-1
, which are amide groups respectively
involved in β-sheet and α-helix structures, were
significantly higher in F1, compared to F3. Furthermore,
bands from 1642 and 1684 cm-1
, respectively
corresponding random coils and β-turns, were quite higher
in F3. This was similar to other studies which showed
increased β-sheets and α-helices in whole wheat doughs
using MTG and GOX treatments [38]. The β-sheet and α-
helix structures are considered as the most stable and
ordered conformation structures, respectively. Despite the
flexible and open nature of α-helix, β-turn, and random
coil structures, the β-sheet structures are moderately stable
[39]. Consequently, it is suggested that decreased tryptic
digestibility by MTG treatment was induced by decreased
chain flexibility via formation of isopeptide bonds. This
finding is similar to rheology finding (increased elastic
modulus and decreased damping factor in MTG treated
samples) as the elastic energy is stored better via
development of β-sheet structures in doughs at the expense
of β-turn conformation [38]. In addition, no obvious
differences were observed in peak intensities from 1447,
1530 and 1658 cm-1
, representing C-N, C=N and C=O
groups, respectively. These functional groups are
associated to Maillard reaction products [24]. Despite
efficiency of MTG in preserving availability of lysine
EAA, no significant differences were seen in Maillard
reaction rate of MTG treatments, since other amino acid
side chains such as those in arginine and tryptophan are
susceptible to Maillard reaction [40].

____________Lysine availability improvement of the wheat breads _______________________________________________________________________
Appl Food Biotechnol, Vol. 6, No. 3 (2019) _______________________________________________________________________________________161
Figure 3a. FTIR spectra of optimized bread (F1), block (F2, F3) and control (F4, F5) samples
Figure 3b. Examples of FT-IR deconvolution of Amide I region of F1 and F3 (estimate as secondary structure area/total
amide I band area)
4. Conclusion
In general, the aim of this study was to investigate the
effectiveness of microbial transglutaminase enzymes in
lysine fortification of the wheat breads substituted by
defatted soy flour as a lysine-rich source fermented by
yeast starter fermentation or sourdough-based mixed
fermentation. Results demonstrated that EAA and
nutritional indices increased significantly in optimized
formulations, containing 26.64% w w-1
defatted soy flour
and0.55% w w-1
microbial transglutaminase and fermented
by sourdough-based mixed fermentation (F1), compared to
blank and control samples. The highest chemical score of
lysine was seen in F1. However defatted soy flour is a
lysine-rich source, its addition increased the lysine loss
ratio during baking process; improved by microbial
transglutaminase incorporation. Biological values of the
blocked lysine were however assessed by digestibility of
the final products. Considering the rheological, textural
and structural characteristics, it was revealed that the novel
crosslinks introduced by the microbial transglutaminase
increased β-sheet structures and consequently decreased
their flexibility and tryptic digestibility. The microbial
transglutaminase anticipated compactness was developed
using sourdough-based mixed fermentation. In conclusion,
the highest biological value, lysine chemical score and
nutritional and amino acid indices and the lowest available
lysine loss during baking process were observed in F1,
containing defatted soy flour and microbial
transglutaminase and fermented using sourdough-based
mixed fermentation.
0.1
0.15
0.2
0.25
0.3
0.35
0.4
40080012001600200024002800320036004000
Ab
sorb
ance
(A
U)
Wavenumber (cm-1)
F1 F2 F3 F4 F5
33.58
27.22
21.17
18.03
F1
β-sheet
α-helix
β-turn
random coil
30.16
23.17
25.98
20.69
F3
β-sheet
α-helix
β-turn
random coil

Neda Mollakhalili Meybodi, et al __________________________________________________________________________________________________
162_______________________________________________________________________________________ Appl Food Biotechnol, Vol. 6, No. 3 (2019)
5. Acknowledgements
This study was supported by the National Nutrition and
Food Technology Research Institute of Shahid Beheshti
University of Medical Sciences. The manuscript was a part
of a PhD thesis at Shahid Beheshti University of Medical
Sciences, Tehran, Iran.
6. Conflict of interest
The authors declare no conflict of interest.
References
1. CauvainSP. Breadmaking: Improving Quality.Elsevier,
Australia, 2012: 35-48.
2. Albert C, Gombos S, Salamon R, Csiki Z, Prokisch J, Csapo J.
Production of highly nutritious functional food with the
supplementation of wheat flour with lysine. Acta Univ
Sapientiae Aliment. 2017; 10(1): 5-20.
doi: 10.1515/ausal-2017-0001.
3. Alamu EO, Popoola I, Maziya Dixon B. Effect of soybean
(Glycine max (L.) Merr.) flour inclusion on the nutritional
properties and consumer preference of fritters for improved
household nutrition. Food Sci Nutr. 2018; 6(7): 1811-1816.
doi: 10.1002/fsn3.751.
4. Kolapo AL, Sanni MO. A comparative evaluation of the
macronutrient and micronutrient profiles of soybean-fortified
Gari and tapioca. Food Nutr Bull. 2009; 30(1): 90-94.
doi: 10.1177/156482650903000110.
5. Yamsaengsung R, Schoenlechner R, Berghofer E. The effects
of chickpea on the functional properties of white and whole
wheat bread. Int J Food Sci Tech. 2010; 45(3): 610-620.
doi: 10.1111/j.1365-2621.2009.02174.x.
6. Angioloni A, Collar C. High legume-wheat matrices: An
alternative to promote bread nutritional value meeting dough
viscoelastic restrictions. Eur Food Res Technol. 2012; 234(2):
273-284.
doi: 10.1007/s00217-011-1637-z.
7. Corke H, De Leyn I, Nip WK, Cross N. Bakery Products:
Science and Technology: John Wiley and Sons, USA, 2008:
301-381.
8. Eduardo M, Svanberg U, Ahrne L. Effect of hydrocolloids and
emulsifiers on the shelf-life of composite cassava-maize-
wheat bread after storage. Food Sci Nutr. 2016; 4(4): 636-
644.
doi: 10.1002/fsn3.326.
9. Yokoyama K, Nio N, Kikuchi Y. Properties and applications of
microbial transglutaminase. Appl Microbiol Biotechnol.
2004; 64(4): 447-454.
doi: 10.1007/s00253-003-1539-5.
10. Heil A, Ohsam J, van Genugten B, Diez O, Yokoyama K,
Kumazawa Y, Pasternack R, Hils M. Microbial trans-
glutaminase used in bread preparation at standard bakery
concentrations does not increase immune-detectable amounts
of deamidatedgliadin. J Agr Food Chem. 2017; 65(32): 6982-
6990.
doi: 10.1021/acs.jafc.7b02414.
11. Nore S, Eva Van der M, Sami H, Joran V, Kevin JV,
Christophe MC. Bread dough and baker’s yeast: An uplifting
synergy. Compr Food Sci Food Saf. 2017; 16: 850-867.
doi: 10.1111/1541-4337.12282
12. Linlaud NE, Puppo MC, Ferrero C. Effect of hydrocolloids on
water absorption of wheat flour and farinograph and textural
characteristics of dough. Cereal Chem. 2009; 86(4): 376-382.
doi: 10.1094/CCHEM-86-4-0376.
13. Gamel TH, Abdel Aal ESM, Tosh SM. Effect of yeast-
fermented and sour-dough making processes on
physicochemical characteristics of β-glucan in whole
wheat/oat bread. LWT Food Sci Technol. 2015; 60(1): 78-85.
doi: 10.1016/j.lwt.2014.07.030.
14. Gerrard JA, Brown PK, Fayle SE. Maillard crosslinking of
food proteins III: The effects of glutaraldehyde, formaldehyde
and glyceraldehyde upon bread and croissants. Food Chem.
2003; 80(1): 45-50.
doi: 10.1016/S0308-8146(02)00233-9.
15. Michalska A, Amigo Benavent M, Zielinski H, Del Castillo
MD. Effect of bread making on formation of maillard
reaction products contributing to the overall antioxidant
activity of rye bread. J Cereal Sci. 2008; 48(1): 123-132.
doi: 10.1016/j.jcs.2007.08.012.
16. Lopez EP. Influence of the addition of lupine protein isolate
on the protein and technological characteristics of dough and
fresh bread with added brea gum. Food Sci Technol. 2014;
34: 195-203.
doi: 10.1590/S0101-20612014005000016.
17. Rizzello CG, Lorusso A, Montemurro M, Gobbetti M. Use of
sourdough made with quinoa (Chenopodium quinoa) flour
and autochthonous selected lactic acid bacteria for enhancing
the nutritional, textural and sensory features of white bread.
Food Microbial. 2016; 56: 1-13.
doi: 10.1016/j.fm.2015.11.018
18. Ihekoronye A. A rapid enzymatic and chromatographic
predictive model for the In-vivo rat-based protein efficiency
ratio. Int J Food Sci Technol. 1981; 21(1): 81-87.
doi: 10.1111/j.1365-2621.1986.tb01933.x
19. Upadhyay R, Ghosal D, Mehra A. Characterization of bread
dough: Rheological properties and microstructure. JFood
Eng. 2012; 109(1): 104-113.
doi: 10.1016/j.jfoodeng.2011.09.028
20. Katina K, Heinio RL, Autio K, Poutanen K. Optimization of
sourdough process for improved sensory profile and texture
of wheat bread. LWT Food Sci Technol. 2006; 39(10): 1189-
1202.
doi: 10.1016/j.lwt.2005.08.001
21. Luo Y, Li M, Zhu KX, Guo XN, Peng W, Zhou HM. Heat-
induced interaction between egg white protein and wheat
gluten. Food Chem. 2016; 197: 699-708.
doi: 10.1016/j.foodchem.2015.09.088
22. Fu L, Wang C, Wang J, Ni S, Wang Y. Maillard reaction with
ribose, galacto-oligosaccharide or chitosan-oligosaccharide
reduced the allergenicity of shrimp tropomyosin by inducing
conformational changes. Food Chem. 2019; 274: 789-795.
doi: 10.1016/j.foodchem.2018.09.068.
23. Serrem CA, de Kock HL, Taylor JRN. Nutritional quality,
sensory quality and consumer acceptability of sorghum and
bread wheat biscuits fortified with defatted soy flour. Int J
Food Sci Technol. 2011; 46(1): 74-83.
doi: 10.1111/j.1365-2621.2010.02451.x.
24. Huma N, Shahid M. Impact of mixed lactic acid bacterial
(lab) culture on flavoring profile and quality attributes of
____________Lysine availability improvement of the wheat breads _______________________________________________________________________
Appl Food Biotechnol, Vol. 6, No. 3 (2019) _______________________________________________________________________________________163
spring wheat sourdough bread. Pak J Agr Sci. 2016; 53(1):
225-231.
doi: 10.21162/PAKJAS/16.4599.
25. Thiele C, Ganzle MG, Vogel RF. Contribution of sourdough
lactobacilli, yeast, and cereal enzymes to the generation of
amino acids in dough relevant for bread flavor. Cereal Chem.
2002; 79(1): 45-51.
doi: 10.1094/CCHEM.2002.79.1.45
26. Rajiv J, Lobo S, Jyothi Lakshmi A, Venkateswara Rao G.
Influence of green gram flour (Phaseolus aureus) on the
rheology, microstructure and quality of cookies. J Texture
Stud. 2012; 43(5): 350-360.
doi: 10.1111/j.1745-4603.2012.00346.x.
27. Romano A, Giosafatto CVL, Di Pierro P, Romano R, Masi P,
Mariniello L. Impact of transglutaminase treatment on
properties and In vitro digestibility of white bean (Phaseolus
vulgaris L.) flour. Food ResInt. 2016; 88: 239-246.
doi: 10.1016/j.foodres.2016.02.014.
28. Giosafatto CVL, Rigby NM, Wellner N, Ridout M, Husband
F, Mackie AR. Microbial transglutaminase-mediated
modification of ovalbumin. Food Hydrocoll. 2012; 26(1):
261-267.
doi: 10.1016/j.foodhyd.2011.06.003
29. Tang CH, Sun X, Yin SW, Ma CY. Transglutaminase-
induced cross-linking of vicilin-rich kidney protein isolate:
Influence on the functional properties and In vitro
digestibility. Food Res Int. 2008; 41(10): 941-947.
doi: 10.1016/j.foodres.2008.07.015.
30. Gan CY, Cheng LH, Azahari B, Easa AM. In-vitro
digestibility and amino acid composition of soy protein
isolate cross-linked with microbial transglutaminase followed
by heating with ribose. Int J Food Sci Nutr. 2009; 60(7): 99-
108.
doi: 10.1080/09637480802635090.
31. Wada Y, Lonnerdal B. Effects of different industrial heating
processes of milk on site-specific protein modifications and
their relationship to In vitro and In vivo digestibility. J Agr
Food Chem. 2014; 62(18): 4175-4185.
doi: 10.1021/jf501617s.
32. Flander L, Holopainen U, Kruus K, Buchert J. Effects of
tyrosinase and laccase on oat proteins and quality parameters
of gluten-free oat breads. J Agr Food Chem. 2011; 59(15):
8385-8390.
doi: 10.1021/jf200872r.
33. Ndayishimiye JB, Huang WN, Wang F, Chen YZ, Letsididi
R, Rayas Duarte P, Tang XJ. Rheological and functional
properties of composite sweet potato - wheat dough as
affected by transglutaminase and ascorbic acid. J Food Sci
Technol. 2016; 53(2): 1178-1188.
doi: 10.1007/s13197-015-2004-z.
34. Boukid F, Carini E, Curti E, Bardini G, Pizzigalli E, Vittadini
E. Effectiveness of vital gluten and transglutaminase in the
improvement of physico-chemical properties of fresh bread.
LWT. 2018; 92: 465-470.
doi: 10.1016/j.lwt.2018.02.059.
35. Abdelghafor RF, Mustafa AI, Ibrahim AM, Krishnan PG.
Quality of bread from composite flour of sorghum and hard
white winter wheat. Adv J Food Sci Technol. 2011; 3(1): 9-
15.
doi: 10.1.1.1028.2394.
36. Zhang X, Wenhang, Wang W, Wang Y, Wang Y, Wang X,
Gao G, Chen G, Liu A. Effects of nanofiber cellulose on
functional properties of heat-induced chicken salt-soluble
meat protein gel enhanced with microbial transglutaminase.
Food Hydrocoll. 2018; 84: 1-8.
doi: 10.1016/j.foodhyd.2018.05.046.
37. Rostamzad H, Paighambari SY, Shabanpour B, Ojagh SM,
Mousavi SM. Improvement of fish protein film with nanoclay
and transglutaminase for food packaging. Food Packaging
Shelf. 2016; 7: 1-7.
doi: 10.1016/j.fpsl.2015.10.001.
38. Niu M, Xiong L, Zhang B, Jia C, Zhao S. Comparative study
on protein polymerization in whole-wheat dough modified by
transglutaminase and glucose oxidase. LWT. 2018; 90: 323-
330.
doi: 10.1016/j.lwt.2017.12.046.
39. Song CL, Ren J, Chen JP, Sun XH, Kopparapu NK, Xue YG.
Effect of glycosylation and limited hydrolysis on structural
and functional properties of soybean protein isolate. J Food
Meas Charact. 2018; 12(4): 2946-2954.
doi: 10.1007/s11694-018-9910-5.
40. Van Boekel M. Formation of flavour compounds in the
Maillard reaction. Biotechnol Adv. 2006; 24(2): 230-233.
doi: 10.1016/j.biotechadv.2005.11.004.

10.22037/afb.v6i3.24359http://dx.doi.org/
Research Article
APPLIED FOOD BIOTECHNOLOGY, 2019, 6 (3): 151-164 Journal homepage: www.journals.sbmu.ac.ir/afb
pISSN: 2345-5357
eISSN: 2423-4214
گندم:روش گلوتامیناز میکروبی و نوع تخمیر بر بهبود دسترسی به لیزین در ناناثرات ترانس
سطح پاسخ
، 4، محمد حسین عزیزی3یاسینی، سید علی 2مرضیه حسینی هسید،*2لیلا میرمقتدایی، *2امیرمحمد مرتضویان ،1میبدیندا ملاخلیلی
5سمیه موسوی ندوشن
دانشکده علوم تغذیه و صنایع غذایی، دانشگاه علوم پزشکی شهید ،انستیتو تحقیقات تغذیه ای و صنایع غذایی کشور، کمیته تحقیق دانشجویی، گروه علوم و صنایع غذایی، -1
.بهشتی، تهران، ایران
.تحقیقات تغذیه ای و صنایع غذایی کشور، دانشکده علوم تغذیه و صنایع غذایی، دانشگاه علوم پزشکی شهید بهشتی، تهران، ایرانگروه علوم و صنایع غذایی، انستیتو -2
گروه علوم و صنایع غذایی، دانشگاه آزاد اسلامی، واحد یزد، یزد، ایران. -3
.ایرانگروه علوم و صنایع غذایی، دانشکده کشاورزی، دانشگاه تربیت مدرس، تهران، -4
.بهداشتی،دانشگاه علوم پزشکی شهید صدوقی یزد، یزد، ایران آزمایشگاه کنترل مواد غذایی، آرایشی و -5
تاریخچه مقاله
2019 فوریه 17دریافت
2019 آپریل 6 داوری
2019 آپریل 20 پذیرش
چکیده
آندزی تدرانگ گلوتامینداز لیزین کاتالیز شدده توسد -به نظر می رسد ایجاد اتصال عرضی گلوتامین سابقه و هدف:
میکروبی جهت بهبود دسترسی به لیزین در نان گندم تاثیر داشته باشد. هدف از این مطالعه بررسی اثر آنزی تدرانگ
گلوتامیناز میکروبی و نوع تخمیر در بهبود دسترسی لیزین نان گندم است.
با طراحی مرکب مرکزی فرمولده شددند. از های گندم غنی شده با لیزین به روش سطح پاسخ نان مواد و روش ها:
وزندی،، سدطح آندزی -درصدد وزندی 50تا 0مدل های آماری برای پیش بینی تأثیر سطح آرد سویای چربی گرفته )
وزنی، و نوع تخمیر )با مخمر یا تخمیر ترکیبی بر پایه خمیر ترش، -درصد وزنی 6/1تا 0ترانگ گلوتامیناز میکروبی )
ای فرمدول های سداختاری و تغذیده لاعات براساس نقش متغیرهای مستقل به تنهایی بر ویژگیاستفاده شد. سایر اط
های واریانگ یک ها با استفاده از آزمونها در سه بار تکرار انجام و میانگینآزمون بهینه و نمونه های کنترل تهیه شد.
طرفه و توکی بررسی آماری شدند.
55/0وزندی آرد سدویای بددون چربدی، -درصدد وزندی 64/26هادی دارای ل پیشدن فرمدو گیری:: و نتیجهها یافته
لیزین در دسترس و g100، mg 16/0) -1 وزنی آنزی ترانگ گلوتامیناز میکروبی به منظور فراه نمودن-درصد وزنی1-
cm3 g 09/2 .انددیگ آمیندو اسدید ضدروری 79/22 ±16/0ایی لیدزین ) یبداتترین نمدره شدیم حج ویدژه بدود ،،
، و کمترین میزان افت لیزین طدی فرآیندد پخدت در فرموتسدیون 79/26 ±02/0) ، و ارزش زیستی31/35 37/0±)
سازی گندم حاوی آرد سویای چربی گرفته با لیدزین را تاییدد بهینه، کارآیی آنزی ترانگ گلوتامیناز میکروبی در غنی
هدای ، تیمار بدا تدرانگ گلوتامینداز میکروبدی مددول های رئولوژیکی و آزمون بافت،. با توجه به شاخص≥05/0Pکرد )
اتستیک و ساختار صفحه ای بتا را افزایش داد. این تغییرات ساختاری قابلیت هض محصول نهایی را کاهش داد، که
تواند با استفاده از روش تخمیر ترکیبی بر پایه خمیر ترش افزایش یابد. می
.ندارند مقاله این انتشار با مرتب منافعی تعارض نوع هیچ که کنند می اعلام نویسندگان تعارض منافع:
واژگان کلید:
تخمیر ▪
غنی سازی ▪ لیزین ▪
آرد سویا▪
ترانگ گلوتامیناز ▪
نان گندم ▪
نویسنده مسئول*
امیرمحمد مرتضویان*
لیلا میرمقتدایی**
گروه علوم و صنایع غذایی، انستیتو
غذایی تحقیقات تغذیه ای و صنایع
کشور، دانشکده علوم تغذیه و صنایع
غذایی، دانشگاه علوم پزشکی شهید
.بهشتی، تهران، ایران
پست الکترونیک:*[email protected]
پست الکترونیک:**[email protected]