Effects of LTP on Response Selectivity of Simulated Cortical Neurons
16
Effects of LTP on Response Selectivity of Simulated Cortical Neurons Karl Kilborn, Gary Lynch, and Richard Granger University of California, Irvine Abstract ∎ We report here on specific ways in which synaptic long- term potentiation (LTP) affects the response selectivity of pri- mary sensory cortical cells. LTP increases synaptic efficacy by incremental "steps," up to a "ceiling" at which additional bursts of afferent stimulation cause no further potentiation. Endoge- nous and exogenous agents have been shown to modulate these two paramenters of LTP, raising the question of the functional implications associated with the sizes of steps and ceiling. We provide an analytical treatment of the effects of these two physiological LTP parameters on the behavior of simulated olfactory (piriform) cortex target cells in response INTRODUCTION Long-term potentiation (LTP) has been shown to occur in hippocampal archicortex (Bliss & Lomo, 1973), olfac- tory paleocortex (Jung, Larson, & Lynch, 1990) and neo- cortex (Kanter & Haberly, 1990; Iriki, Pavlides, Keller, & Asanuma, 1989; Kirkwood & Bear, 1994). Given that it ap- pears to be a common characteristic of cortical architec- tures, the question arises as to the effects that LTP might have on cortical processing of sensory signals. Input to a network selectively activates some target cells more than others, on the basis of connectivity of the active inputs with the targets. Afferent stimulation patterns are "similar" to the extent that they share axons, which, when repetitively activated, can potentiate their target synapses. With repeated training, synapses shared among different inputs become more potentiated than unshared synapses. After training on a number of similar instances, this differential potentiation of shared synapses will cause the target cell that responds to one such instance to respond to others as well, since the contribution from the (familiar) shared, potentiated synapses will outweigh the contributions from the (novel) unshared, weaker synapses. With learning, then, target network responses to similar inputs will tend to become increasingly similar to each other. From the point of view of a given target cell participating in these responses, its receptive field is broadening, since it is responding after potentiation to inputs that it would not have responded to before. It is worth noting that if these responses are the © 1996 Massachusetts Institute of Technology to a range of inputs. A target cell's receptive field, i.e., the set of input patterns to which the cell responds, is broadened with potentiation of the cell's synapses, and is broadened more when the LTP step size is smaller, and when the LTP ceiling is higher. Moreover, the effects of step size and ceiling interact, and their joint relationship to receptive field breadth is non- linear. Values of step size and ceiling are identified that balance the tradeoff between learning rate and receptive field breadth for particular sensory recognition tasks, and these model values are compared to corresponding known and inferred physi- ological values. ∎ representations of the inputs passed to other brain re- gions, the inputs will be treated as though they were more similar than they actually are; an effective learned broadening of the generalization gradient around inputs (reminiscent of the well-known psychological effects of input space distortion (Shepard, 1987) and categorical perception (Smith & Medin, 1981; Harnad, 1987)). How- ever, the sensory and psychological interpretations of neural responses are remote, and it is unknown how generalization of cell population responses may be re- lated to generalization of the organism's overall behav- ioral response to a stimulus. A neuron's response can be described more neutrally in terms of its receptive field, defined simply as the set of inputs to which it responds. For cell fields receiving topographic afferents, such as layer IV of primary visual, auditory and somatosensory cortices, the receptive field of a neuron has the addi- tional property of preserving adjacency relations among the stimuli to which it responds. Nonetheless the no- tion of receptive field is equally well defined in non- topographic populations such as olfactory cortex (Jiang & Holley, 1992; Ezeh, Wellis, & Scott, 1993). Slight changes to an input will still tend to recruit responses from many of the same target cells, whereas very differ- ent inputs will not; the receptive field of those target cells thus includes the former inputs and excludes the latter. In this paper we provide a theoretical treatment of the LTP parameters of step and ceiling in the context of a target layer of cortical pyramidal cells, analytically deriv- Journal of Cognitive Neuroscience 8:4, pp. 328-343
Transcript of Effects of LTP on Response Selectivity of Simulated Cortical Neurons

Effects of LTP on Response Selectivity ofSimulated Cortical Neurons
Karl Kilborn, Gary Lynch, and Richard GrangerUniversity of California, Irvine
Abstract∎ We report here on specific ways in which synaptic long-term potentiation (LTP) affects the response selectivity of pri-mary sensory cortical cells. LTP increases synaptic efficacy byincremental "steps," up to a "ceiling" at which additional burstsof afferent stimulation cause no further potentiation. Endoge-nous and exogenous agents have been shown to modulatethese two paramenters of LTP, raising the question of thefunctional implications associated with the sizes of steps andceiling. We provide an analytical treatment of the effects ofthese two physiological LTP parameters on the behavior ofsimulated olfactory (piriform) cortex target cells in response
INTRODUCTION
Long-term potentiation (LTP) has been shown to occurin hippocampal archicortex (Bliss & Lomo, 1973), olfac-tory paleocortex (Jung, Larson, & Lynch, 1990) and neo-cortex (Kanter & Haberly, 1990; Iriki, Pavlides, Keller, &Asanuma, 1989; Kirkwood & Bear, 1994). Given that it ap-pears to be a common characteristic of cortical architec-tures, the question arises as to the effects that LTP mighthave on cortical processing of sensory signals. Input toa network selectively activates some target cells morethan others, on the basis of connectivity of the activeinputs with the targets. Afferent stimulation patterns are"similar" to the extent that they share axons, which,when repetitively activated, can potentiate their targetsynapses. With repeated training, synapses shared amongdifferent inputs become more potentiated than unsharedsynapses. After training on a number of similar instances,this differential potentiation of shared synapses willcause the target cell that responds to one such instanceto respond to others as well, since the contribution fromthe (familiar) shared, potentiated synapses will outweighthe contributions from the (novel) unshared, weakersynapses. With learning, then, target network responsesto similar inputs will tend to become increasingly similarto each other. From the point of view of a given targetcell participating in these responses, its receptive field isbroadening, since it is responding after potentiation toinputs that it would not have responded to before.
It is worth noting that if these responses are the
© 1996 Massachusetts Institute of Technology
to a range of inputs. A target cell's receptive field, i.e., the setof input patterns to which the cell responds, is broadened withpotentiation of the cell's synapses, and is broadened morewhen the LTP step size is smaller, and when the LTP ceiling ishigher. Moreover, the effects of step size and ceiling interact,and their joint relationship to receptive field breadth is non-linear. Values of step size and ceiling are identified that balancethe tradeoff between learning rate and receptive field breadthfor particular sensory recognition tasks, and these model valuesare compared to corresponding known and inferred physi-ological values. ∎
representations of the inputs passed to other brain re-gions, the inputs will be treated as though they weremore similar than they actually are; an effective learnedbroadening of the generalization gradient around inputs(reminiscent of the well-known psychological effects ofinput space distortion (Shepard, 1987) and categoricalperception (Smith & Medin, 1981; Harnad, 1987)). How-ever, the sensory and psychological interpretations ofneural responses are remote, and it is unknown howgeneralization of cell population responses may be re-lated to generalization of the organism's overall behav-ioral response to a stimulus. A neuron's response can bedescribed more neutrally in terms of its receptive field,defined simply as the set of inputs to which it responds.For cell fields receiving topographic afferents, such aslayer IV of primary visual, auditory and somatosensorycortices, the receptive field of a neuron has the addi-tional property of preserving adjacency relations amongthe stimuli to which it responds. Nonetheless the no-tion of receptive field is equally well defined in non-topographic populations such as olfactory cortex (Jiang& Holley, 1992; Ezeh, Wellis, & Scott, 1993). Slightchanges to an input will still tend to recruit responsesfrom many of the same target cells, whereas very differ-ent inputs will not; the receptive field of those targetcells thus includes the former inputs and excludes thelatter.
In this paper we provide a theoretical treatment of theLTP parameters of step and ceiling in the context of atarget layer of cortical pyramidal cells, analytically deriv-
Journal of Cognitive Neuroscience 8:4, pp. 328-343

ing relationships between these biological parametersand their receptive field characteristics.
Input and ResponsePhysiological and Anatomical CharacteristicsModeledTable 1 lists the physiological and anatomical featuresincorporated into the simulations used. Points 1-3 in thetable constitute induction rules for LTP: the familiar"Hebbian" requirement for coactivity of afferent and tar-get, together with the important extra constraint thatmost cell spiking will not induce potentiation: rather, thesignificantly higher (NMDA receptor) threshold must beexceeded for potentiation to be induced. The relativelystringent requirements for LTP induction ensure thatmost synapses do not become potentiated under mostcircumstances despite continuous cell spiking; rather,burst activity must occur in the presence of weakened
Table 1. Physiological and Anatomical FeaturesIncorporated into LTP Parameter SimulationsLTP induction
1. Potentiation requires coactivity of afferent and target2. Potentiation requires exceeding a threshold above that
of the spiking threshold3. Potentiation can be elicited by a single induction
episode
LTP increment rule4. Equally sized increments in efficacy occur in response
to each induction episode5. Increment size can be manipulated pharmacologically6. Increment size can be manipulated endogenously (by
NE, Ach)
LTP ceiling rule7. After a fixed number of increments, further
stimulation offers almost no increase in efficacy8. Ceiling level can be manipulated pharmacologically9. Ceiling level can be manipulated endogenously
(by 5HT)
Local circuit anatomy10. Sparse connectivity of afferents to targets11. No apparent topography (e.g., LOT to olfactory cortex)12. Short electrotonic length of excitatory cell dendrites
Time courses13. Inputs arrive within relative synchrony with theta14. Once consolidated, potentiation is not reversible
inhibition of the target neurons, as occurs with theta-burst stimulation. Numbers 4-6 and 7-9 specify thephysiological details of LTP increments and the LTPceiling, respectively, and their manipulation by endoge-nous and exogenous factors. These issues will be goneinto in more detail. Items 10-12 describe the anatomiesinto which the synapses undergoing potentiation areembedded. Number 13 states the assumption, based onboth in vivo recordings of freely moving, learning ani-mals and in vitro studies of LTP induction, that duringlearning, inputs become relatively synchronized to thetheta rhythm throughout the olfactory-hippocampalpathway.
Point 14 raises the issues of LTP reversal and LTD(Staubli & Lynch, 1987; Larson, Xiao, & Lynch, 1993; Bear& Malenka, 1994), neither of which is considered in thepresent treatment. Any form of synaptic reduction raisesthe more general question of capacity: i.e., can a systemin which synapses only increase suffice as a memory?The obvious intuition, shared by many experimental andcomputational neuroscientists, is that what goes up mustcome down. It is clear that if all synapses are allowed toincrease without some form of decrease or normaliza-tion, eventually all synapses will become saturated attheir ceiling value, thus not only preventing any furtherlearning, but also eliminating existing memories, sincethe differences among synaptic weights were the em-bodiment of those memories. A concomitant questionrarely asked is when such saturation will occur-this isa question of capacity, which underlies that of synapticsaturation: how many "memories" can be stored via sy-naptic strengthening before saturation? In a particularformulation, an increase-only model has been shown tohave very large capacity, which is a linear function of thesize of the network. In that model, synapses increasewithout ever decreasing, and the system will thus inevi-tably saturate, but saturation does not occur until a verylarge number of memories are stored-such a large num-ber that any reasonable lifetime of the organism wouldbe long over before the limit was approached (Granger,Whitson, Larson, & Lynch, 1994). Thus the function ofany LTD mechanism might not be directly related tocapacity.
Physiological InterpretationConsider a cortical network in which a set of inputaxons makes sparse nontopographic synaptic contactwith the dendrites of a set of target cells, as in theolfactory (piriform) cortex (Price, 1973; Haberly, 1985;Lynch, 1986). Input activity is assumed to correspond tothe stereotypical physiological activity found throughoutthe olfactory corticohippocampal pathway during learn-ing and exploration (Macrides, 1975; Hill, 1978; Otto,Eichenbaum, Weiner, & Wible, 1991), consisting of briefrelatively synchronized bursts of activity, on a sparsesubset of the input lines. Inputs can thus be depicted as
Kilborn et al 329

Figure 1. Each cell has N po-tential synaptic locations andS actual synapses. Inputs con-sist of some active linesunique to one pattern or theother (NA and NB), some linesthat are shared between bothpatterns (Nshar), and somelines that do not signify eitherpattern (Nneither ). Noise( Inoise) displaces some of theinputs in these shared and pat-tern-specific regions to eitherthe other pattern's region orsomewhere else along thecell. Note that these regionsare depicted as contiguous forconvenience only-inputs rep-resenting one pattern or theother may be distributed any-where along the cell.
a set of active input lines arriving at target cells as inFigure 1. In general, inputs will be spatially distributedacross the input lines. For simplicity, the illustrationshere depict inputs consisting primarily of contiguousaxons, as they would be if generated by stimulatingelectrodes rather than by environmental input; in themathematics, no assumptions are made about axon dis-tribution. Pictured are two distinct inputs, A and B, whichcan be presumed to be generated by two different stimu-lating electrodes. The spatial pattern of activation gener-ated by a given electrode will differentially activate thetarget cells, as a function of the connectivity of theinputs to the cells. In particular, cells having more syn-apses with those axons active in input pattern A will bemore depolarized in response to that input. The figureillustrates two target cells, one of which is better con-nected to the active axons in pattern A (CA), and one tothe active inputs in B (CB). Thus cell CA will be moredepolarized in response to input A, via activation ofstimulating electrode A, and vice versa for cell CB.
Note that although the responses of only two cells totwo different input patterns are considered in this ex-periment, Figure 2 illustrates how this analysis treats oneaspect of a larger distributed representation. In general,we assume that the relative activity of primary respond-ing cells is significant, as in a patch of laterally inhibitedcells where the cells with the highest activation will bethe only ones to fire (Coultrip, Granger, & Lynch, 1992).
330 Journal of Cognitive Neuroscience
If these two inputs always occurred in the same way,then LTP simply causes the depolarization from the cellsto become stronger, and the response to become morereliable. If, however, we make the more realistic assump-tion that the inputs are "noisy" in that some variationoccurs from presentation to presentation, then LTP hasa more complex effect, and its physiological inductionparameters come into play in a nonintuitive fashion. Thisrandom variation within an input consists of prob-abilistic activation of afferents with components of omis-sion and of commission: some synapses stimulated byelectrode A will fail to become active on any given trial,and some synapses not stimulated by electrode A willspontaneously become active. Noise affects the reliabil-ity of the target cell response, and the step incrementand ceiling level of potentiation during LTP both modu-late the extent of this effect.
Geometric InterpretationInputs of this kind can be viewed as points or vectorsin a space whose dimensionality is that of the totalnumber of input lines. If every input made synapticcontact with every target cell, then the dendrites oftarget cells could be viewed as vectors in that samespace. Actual targets correspond to vectors in a subspaceof the input space, dictated by the sparseness of connec-tivity of the inputs with the target. Figure 3 illustrates the
Volume 8, Number 4
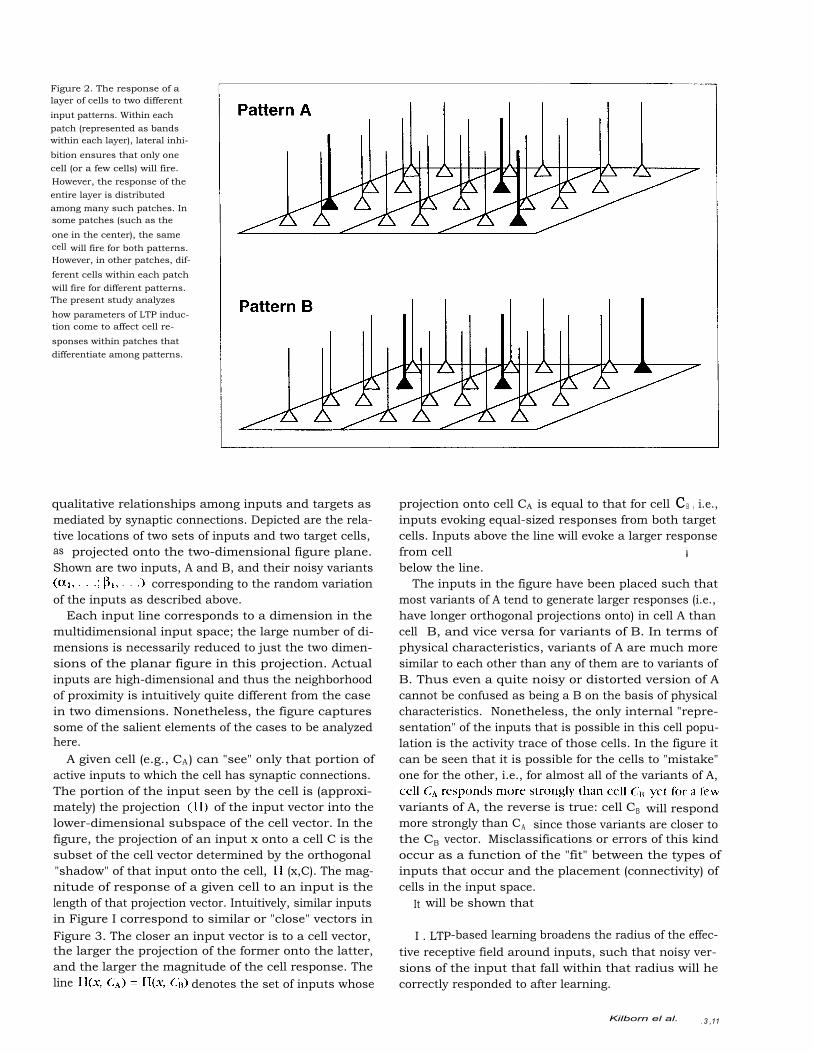
Figure 2. The response of alayer of cells to two differentinput patterns. Within eachpatch (represented as bandswithin each layer), lateral inhi-bition ensures that only onecell (or a few cells) will fire.However, the response of theentire layer is distributedamong many such patches. Insome patches (such as theone in the center), the samecell will fire for both patterns.However, in other patches, dif-ferent cells within each patchwill fire for different patterns.The present study analyzeshow parameters of LTP induc-tion come to affect cell re-sponses within patches thatdifferentiate among patterns.
qualitative relationships among inputs and targets asmediated by synaptic connections. Depicted are the rela-tive locations of two sets of inputs and two target cells,as projected onto the two-dimensional figure plane.Shown are two inputs, A and B, and their noisy variants
corresponding to the random variationof the inputs as described above.
Each input line corresponds to a dimension in themultidimensional input space; the large number of di-mensions is necessarily reduced to just the two dimen-sions of the planar figure in this projection. Actualinputs are high-dimensional and thus the neighborhoodof proximity is intuitively quite different from the casein two dimensions. Nonetheless, the figure capturessome of the salient elements of the cases to be analyzedhere.
A given cell (e.g., CA ) can "see" only that portion ofactive inputs to which the cell has synaptic connections.The portion of the input seen by the cell is (approxi-mately) the projection of the input vector into thelower-dimensional subspace of the cell vector. In thefigure, the projection of an input x onto a cell C is thesubset of the cell vector determined by the orthogonal"shadow" of that input onto the cell, (x,C). The mag-nitude of response of a given cell to an input is thelength of that projection vector. Intuitively, similar inputsin Figure I correspond to similar or "close" vectors inFigure 3. The closer an input vector is to a cell vector,the larger the projection of the former onto the latter,and the larger the magnitude of the cell response. Theline denotes the set of inputs whose
projection onto cell CA is equal to that for cell C B , i.e.,inputs evoking equal-sized responses from both targetcells. Inputs above the line will evoke a larger responsefrom cell
C
Bthan from CA,and vice versa for inputsbelow the line.
The inputs in the figure have been placed such thatmost variants of A tend to generate larger responses (i.e.,have longer orthogonal projections onto) in cell A thancell B, and vice versa for variants of B. In terms ofphysical characteristics, variants of A are much moresimilar to each other than any of them are to variants ofB. Thus even a quite noisy or distorted version of Acannot be confused as being a B on the basis of physicalcharacteristics. Nonetheless, the only internal "repre-sentation" of the inputs that is possible in this cell popu-lation is the activity trace of those cells. In the figure itcan be seen that it is possible for the cells to "mistake"one for the other, i.e., for almost all of the variants of A,
variants of A, the reverse is true: cell CB will respondmore strongly than CA since those variants are closer tothe CB vector. Misclassifications or errors of this kindoccur as a function of the "fit" between the types ofinputs that occur and the placement (connectivity) ofcells in the input space.
It will be shown that
I . LTP-based learning broadens the radius of the effec-tive receptive field around inputs, such that noisy ver-sions of the input that fall within that radius will hecorrectly responded to after learning.
Kilborn el al.
. 3 ,11

spatial representations of fourdifferent inputs to the net-work. If there are N afferents,then inputs are points in N-dimensional space whereeach point's value along anyparticular dimension dependson whether that afferent is ac-tive or not. The activationlevel of a cell is proportionalto the projection of its inputonto the vector representationof the cell itself. [For example,
is the projection of
. has a larger projection
error, therefore, is the chanceof this situation happening.Point , however, has agreater projection onto thecell on which B inputs weretrained, so the network willperform a correct classifica-tion. As more inputs are pre-sented to a cell, the cell willreduce its angle from the in-puts by increasing its valuealong those dimensions com-mon to both its synapse locations and the active afferents. Both the size of each increase, e, and the minimum and maximum value of a cellalong any dimension where a synapse is present, wO and wm , are global parameters of the network (step and ceiling size). Note: Two aspectsof this diagram may be potentially misleading, but are necessary to visualize the spatial representation. First, all inputs from both patterns are ac-tually the same distance from the origin. Here we see only a two-dimensional slice of the input space, so inputs appear to be of differentlengths. Second, the activation of a cell is the inner product of the synaptic weights and the input, but here we instead show the inputs' projec-tion onto each cell. Projection can also be used to compare cell activations as long as the cells' vector representations are the same length. Al-though this is only approximately the case in the model, projection is much easier to visualize in this diagram than inner product.
2. The breadth of the receptive field is inversely re-
lated to the LTP increment (step size).3. The breadth of the receptive field is proportional
to the distance from naive to saturated (ceiling) synapticweights.
Theoretical Treatment
The target cortical network is assumed to have N affer-
ent input lines making Swith the dendrites of each of M target cells. The naiveinitial synaptic efficacy (weight) of each synapse is wp.Input stimuli consist of I of the input lines being activeat a given time. We consider the case of two distinctgroups of inputs, corresponding to the variants of A andB as above, as depicted in Figure 1. Formally, thesegroups are defined such that each variant of input A
onto cell CB than cell CA, so itis mistakenly associated withpattern B despite the fact thatcell CA was trained on inputsmore similar to
consists of the conjoint activation of three subsets of
As and Bs, and random noisy inputsconsists of a fixed number I of active afferents, such that
random deletion ofactivation of"region" corresponds to the part of a cell that maycontact a particular set of afferents. For instance, the
with the shared region of each cell, also depicted inFigure 1.
The sparse random connectivity of the input lines tothe target cells causes specific inputs to differentiallyactivate different targets, as a function of the fit between
the I active input lines (out of the total N lines) and theS synapses present on a target dendrite. Before any learn-
Volume 8, Number 4332 Journal of Cognitive Neuroscience
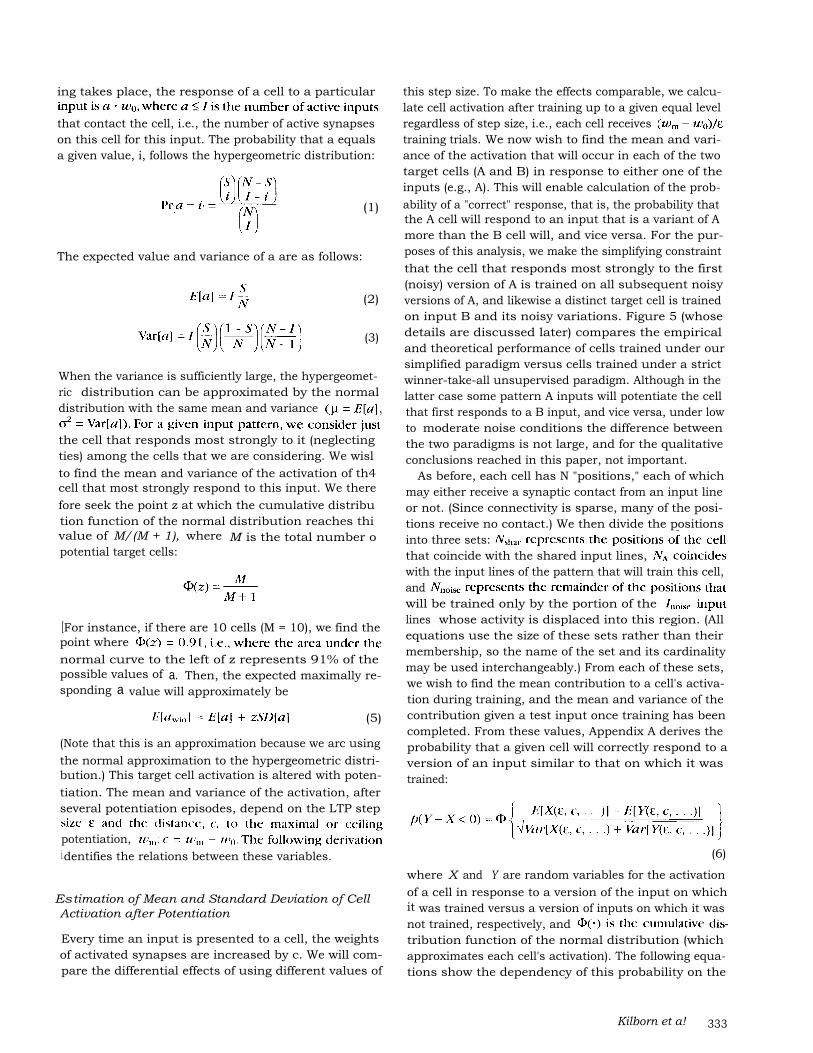
ing takes place, the response of a cell to a particular
that contact the cell, i.e., the number of active synapseson this cell for this input. The probability that a equalsa given value, i, follows the hypergeometric distribution:
(1)
The expected value and variance of a are as follows:
(3)
(2)
When the variance is sufficiently large, the hypergeomet-ric distribution can be approximated by the normaldistribution with the same mean and variance
the cell that responds most strongly to it (neglectingties) among the cells that we are considering. We wislto find the mean and variance of the activation of th4cell that most strongly respond to this input. We therefore seek the point z at which the cumulative distribution function of the normal distribution reaches thivalue of M/(M + 1), where M is the total number opotential target cells:
[For instance, if there are 10 cells (M = 10), we find thepoint wherenormal curve to the left of z represents 91% of thepossible values of a. Then, the expected maximally re-sponding a value will approximately be
(5)(Note that this is an approximation because we arc usingthe normal approximation to the hypergeometric distri-bution.) This target cell activation is altered with poten-tiation. The mean and variance of the activation, afterseveral potentiation episodes, depend on the LTP step
potentiation,i dentifies the relations between these variables.
Estimation of Mean and Standard Deviation of CellActivation after PotentiationEvery time an input is presented to a cell, the weightsof activated synapses are increased by c. We will com-pare the differential effects of using different values of
this step size. To make the effects comparable, we calcu-late cell activation after training up to a given equal levelregardless of step size, i.e., each cell receivestraining trials. We now wish to find the mean and vari-ance of the activation that will occur in each of the twotarget cells (A and B) in response to either one of theinputs (e.g., A). This will enable calculation of the prob-ability of a "correct" response, that is, the probability thatthe A cell will respond to an input that is a variant of Amore than the B cell will, and vice versa. For the pur-poses of this analysis, we make the simplifying constraintthat the cell that responds most strongly to the first(noisy) version of A is trained on all subsequent noisyversions of A, and likewise a distinct target cell is trainedon input B and its noisy variations. Figure 5 (whosedetails are discussed later) compares the empiricaland theoretical performance of cells trained under oursimplified paradigm versus cells trained under a strictwinner-take-all unsupervised paradigm. Although in thelatter case some pattern A inputs will potentiate the cellthat first responds to a B input, and vice versa, under lowto moderate noise conditions the difference betweenthe two paradigms is not large, and for the qualitativeconclusions reached in this paper, not important.
As before, each cell has N "positions," each of whichmay either receive a synaptic contact from an input lineor not. (Since connectivity is sparse, many of the posi-tions receive no contact.) We then divide the positionsinto three sets:that coincide with the shared input lines,with the input lines of the pattern that will train this cell,andwill be trained only by the portion of thelines whose activity is displaced into this region. (Allequations use the size of these sets rather than theirmembership, so the name of the set and its cardinalitymay be used interchangeably.) From each of these sets,we wish to find the mean contribution to a cell's activa-tion during training, and the mean and variance of thecontribution given a test input once training has beencompleted. From these values, Appendix A derives theprobability that a given cell will correctly respond to aversion of an input similar to that on which it wastrained:
(6)where X and Y are random variables for the activationof a cell in response to a version of the input on whichit was trained versus a version of inputs on which it wasnot trained, respectively, andtribution function of the normal distribution (whichapproximates each cell's activation). The following equa-tions show the dependency of this probability on the
Kilborn et a!
333

values of the step sizepotentiation
Without loss of generality, we can estimate the meanand variance of a cell tested on (noisy versions of) thesame pattern as it has been trained on, by estimating themean and variance of a cell trained on noisy variants ofA (a "pattern A" input) and tested on one such variantof A. Likewise, we can estimate the mean and varianceof a cell's response to a different pattern than it wastrained on by estimating the mean and variance of a celltrained on pattern B inputs but tested on a pattern Ainput. Letpotentiation,set of synapses (e.g., a shared or pattern A-specific re-gion) given a test input (e.g.,synapses in the shared region),ability of a particular value offormulas for this and the following two terms),the percentage of synapses modified within a set on asingle training input pattern presentation,expected number of active input lines to a region duringtraining (once noise has deleted some of the activeinputs in thea region trained and tested on pattern A inputs, andbe the activation level of a region trained on pattern Binputs and tested on a pattern A input. Then,
(7)
for the shared, pattern B, and noise sets, and(8)
Likewise, we can calculate the variance:
and(10)
The equations forthose for
(11)and
(12)except we further divide the cell into four regions byseparating the noise region into regions B and neitherSince we are looking at a cell that is trained on one
334journal of (Cognitive Neuroscience)
pattern and tested on another, it helps to separate thecell into the region that gets the inputs shared by bothpatterns, the region that gets most of the pattern-specifictraining inputs (B), the region that gets most of thepattern-specific testing inputs (A), and the region thatlies outside both pattern A and pattern B inputs exceptfor noise. [These distinct "regions" are assumed to bedistributed across the dendrite, since the inputs have notopographic organization. Moreover, as mentioned ear-lier, for the short electrotonic dendritic lengths identifiedin many modeling studies (Rall et al., 1992) the proximalvs distal location of specific inputs can be neglected.]When calculating the probability of active input syn-apses,tested on A, the reversal of the number of input linesspecific to each pattern must be taken into account (asdiscussed in Appendix A).
Errors as a Function of Step and CeilingFigure 4 shows the effect of step size e on the probabilityof an error, i.e., the probability of the target networkmisrepresenting an A as a B or vice versa. Shown are bothanalytical results based on the above equations, andempirical results based on tests of a network implement-ing the described algorithm. It can be seen that theempirical results parallel the analytical results (althoughactual errors are slightly higher than analytical predic-tions for some large step sizes). Performance improves(error decreases) with decreasing step size. It is worthnoting that the improvement in performance falls offonce the step size reaches roughly 15 to 20% of thedistance from the naive to the ceiling weight, i.e., thestep size is such that there are roughly seven stepsbefore the ceiling is reached.
A similar result is obtained for the recognition perfor-mance of the network as a function of the ceiling, i.e.,the ratio of the maximal potentiated strength of a syn-apse to its naive strength (Fig. 5). Again, empirical andanalytical results agree relatively closely; performanceimproves (errors decrease) as the ceiling increases. Asbefore, the effect is highly nonlinear, and there is anobvious inflection point at which increases to the ceilingoffer diminishing returns-there is little performancegained in raising the ceilings to a level more than threeor four times larger than the naive synaptic strength.
Figure 6 shows the probability of error for a fixed stepand ceilingfunction of the difficulty of the discrimination betweenthe two inputs A and B. The more the two inputs shareinput lines, the more similar they are, and the moredifficult it is to discriminate between them. (This corre-sponds to the points becoming closer and closer to-gether in Figure 3.) As expected, more similar inputsyield higher probability of error. The effect interacts withthe amount of random noise in the signal; if noise isrestricted to only 10% of the input signal, error prob-
Volume 8, Number 4
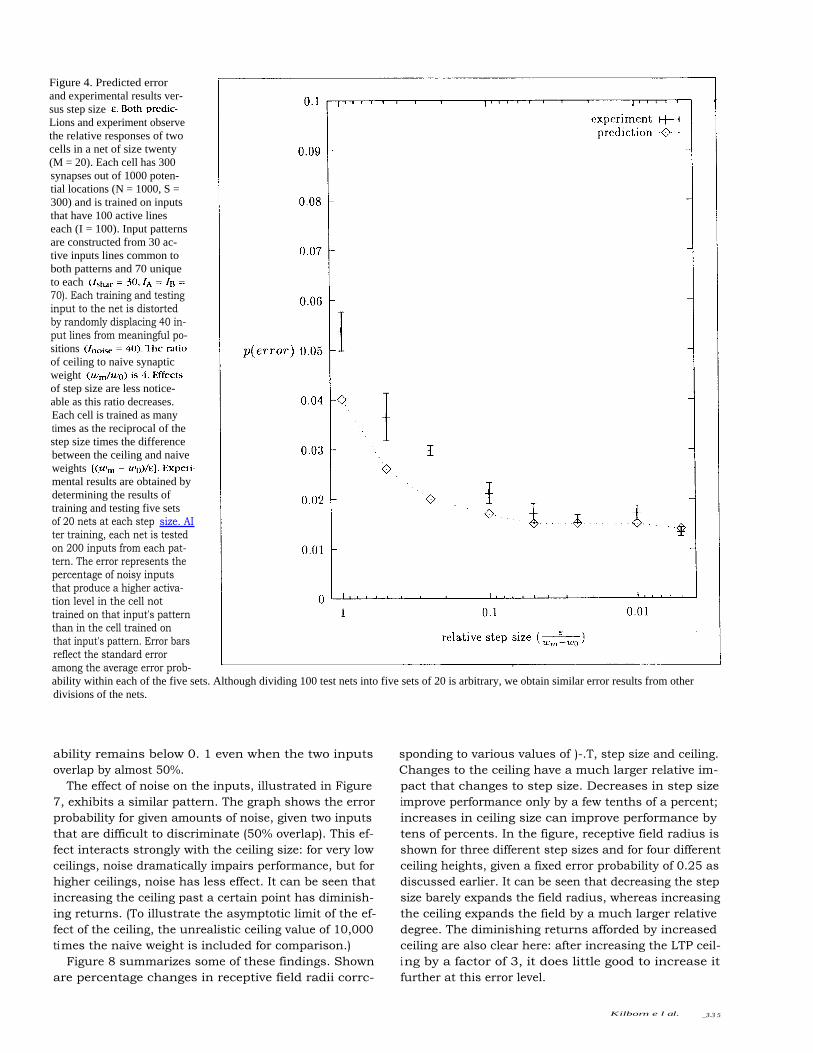
Lions and experiment observethe relative responses of twocells in a net of size twenty(M = 20). Each cell has 300synapses out of 1000 poten-tial locations (N = 1000, S =300) and is trained on inputsthat have 100 active lineseach (I = 100). Input patternsare constructed from 30 ac-tive inputs lines common toboth patterns and 70 uniqueto each70). Each training and testinginput to the net is distortedby randomly displacing 40 in-put lines from meaningful po-sitionsof ceiling to naive synapticweightof step size are less notice-able as this ratio decreases.Each cell is trained as manytimes as the reciprocal of thestep size times the differencebetween the ceiling and naiveweightsmental results are obtained bydetermining the results oftraining and testing five setsof 20 nets at each step size. AIter training, each net is testedon 200 inputs from each pat-tern. The error represents thepercentage of noisy inputsthat produce a higher activa-tion level in the cell nottrained on that input's patternthan in the cell trained onthat input's pattern. Error barsreflect the standard erroramong the average error prob-ability within each of the five sets. Although dividing 100 test nets into five sets of 20 is arbitrary, we obtain similar error results from otherdivisions of the nets.
ability remains below 0. 1 even when the two inputsoverlap by almost 50%.
The effect of noise on the inputs, illustrated in Figure7, exhibits a similar pattern. The graph shows the errorprobability for given amounts of noise, given two inputsthat are difficult to discriminate (50% overlap). This ef-fect interacts strongly with the ceiling size: for very lowceilings, noise dramatically impairs performance, but forhigher ceilings, noise has less effect. It can be seen thatincreasing the ceiling past a certain point has diminish-ing returns. (To illustrate the asymptotic limit of the ef-fect of the ceiling, the unrealistic ceiling value of 10,000times the naive weight is included for comparison.)
Figure 8 summarizes some of these findings. Shownare percentage changes in receptive field radii corrc-
sponding to various values of )-.T, step size and ceiling.Changes to the ceiling have a much larger relative im-pact that changes to step size. Decreases in step sizeimprove performance only by a few tenths of a percent;increases in ceiling size can improve performance bytens of percents. In the figure, receptive field radius isshown for three different step sizes and for four differentceiling heights, given a fixed error probability of 0.25 asdiscussed earlier. It can be seen that decreasing the stepsize barely expands the field radius, whereas increasingthe ceiling expands the field by a much larger relativedegree. The diminishing returns afforded by increasedceiling are also clear here: after increasing the LTP ceil-ing by a factor of 3, it does little good to increase itfurther at this error level.
Kilborn e l al.
_3.3 5
sus step size
Figure 4. Predicted errorand experimental results ver-

Figure 5. Predicted error andexperimental results versusceiling to naive ratio
the simplified experiment,each cell is trained on 10 in-puts from the pattern it firstprefers. In the strict winner-take-all experiment each cellis trained on inputs for whichit has the highest activation inthe patch. In both experi-ments the step size is one-tenth the difference betweenthe ceiling and naive weights
calculated in the same man-ner as described in the pre-vious figure.
DISCUSSION
Small LTP step size, then, yields two effects, one obviousand one less so: (1) many such steps must be taken toachieve a given level of potentiation, and (2) after learn-ing, the target cell population will come to respondcorrectly to a somewhat wider range of inputs, effec-tively "recognizing" even noisy versions of inputs onwhich it has been trained. This latter effect correspondsto the receptive field of the target cells. The incrementsize and LTP ceiling each affect the receptive fieldbreadth, and hence affect the restrictiveness of the re-sponse of the cell thus trained. If an input A generates aparticular cortical response, how similar must input A'be to A to generate that same cortical response? If theLTP step is larger, or the ceiling lower, then the targetreceptive field is narrowed, and thus A must be verysimilar to A' to generate the same response. If the LTP
step is smaller or the ceiling higher, then the receptivefield is broadened, and the required similarity betweenA and A' is reduced.
The effects of both step and ceiling are quite non-linear, and a tradeoff between them can be identified.Increases to ceiling and decreases to step size bothbroaden receptive fields. Higher ceilings and smaller stepsizes share the cost that they cause maximal potentiationto take longer to reach. Thus presumably training will bemore protracted as ceiling is raised and step size de-creased. The nonlinearities in the analysis provide inflec-tion points that can be chosen to optimize this tradeoff.From the graphs it can be seen that for the parametersused in the simulation (such as connectivity and inputsize), the chosen ceiling size should be roughly 2 to 2.5times larger than naive synaptic strengths, and the cho-sen step size should traverse roughly one-seventh of thedistance from naive to maximal weight with each poten-
Volume 8, Number 4.336 Journal of Cognitive Neuroscience

Figure 6. Predicted prob-ability of error given variousdegrees of similarity betweenthe two patterns. The predic-tions are for two cells whichhave 300 synapses out of1000 potential locations each(S = 300, N = 1000). Thereare 100 active inputs (I =100), Israr of which are com-mon to both patterns and therest of which are unique toeach pattern
predictions for a differentlevel of noise,ing to naive ratio2, and the step size is one-tenth the difference betweenthe ceiling and naive weights
is trained on 10 examples ofone pattern.
tiation episode. It is worth noting that these analyticalresults do not differ greatly from values experimentallyidentified in in vitro brain slices (Larson & Lynch, 1986;Larson, Wong, & Lynch, 1986).
Pharmacological agents that increase the step size andceiling of LTP (Arai & Lynch, 1992) have been shown toaffect the learning rate of animals to which these agentshave been administered (Granger et al., 1993; Staubli,Rogers, & Lynch, 1994). From the findings presentedhere, it can be predicted that the resulting learned infor-mation will be formed with slightly more restrictivereceptive fields than if learned via training with unen-hanced step sizes. A larger effect should obtain for in-crease in ceiling size. That is, increase in LTP ceilingshould broaden the receptive fields surrounding thelearned items, and this effect will be large enough tooverwhelm effects that may be due to step size. Thus ifboth step size and ceiling are increased by a drug, it is
predicted that the resulting target cell receptive fieldswill be broadened compared to learning that occurswithout the drug. The behavioral consequences of thisare unknown, although it might be loosely speculatedthat operational generalization gradients around learnedstimuli may correspond to the receptive field sizes of thetarget cortical cells.
Convergent anatomical and physiological evidencesuggests that step size and ceiling may be readily con-trolled endogenously via the effects of ascending modu-latory systems on their GABA interneuron targets.Immunohistochemical work has indicated that ascend-ing serotonergic (5HT) fibers preferentially terminate onGABAb interneurons (Seress et al., 1993) and pharma-cological manipulation of the 5HT system suggests thatits effect on GABAb cell activity is facilitatory. Blockadeof the GABAb-mediated long hyperpolarization byforskolin has a dramatic effect on LTP: the magnitude of
Kilborn et al.
337

Figure 7. Predicted prob-ability of error versus noise.The predictions are onceagain for two cells, with N =1000, S = 300, and I = 100.There are 50 input lines simi-lar to both patterns and 50unique to each
the predictions for a differentratio between the ceiling andthe naive synaptic weight. The
sents an "ideal" synapse,which has negligible initialweight. All predictions are forcells trained 10 times with
the maximal LTP nearly doubles (Arai & Lynch, 1992).The mechanism underlying this effect is not known, butit is reasonable to assume that the extra hyperpolariza-tion due to 5HT-mediated GABAb enhancement will ab-breviate any NMDA currents activated during a burst,since the duration of those currents are dependent onongoing depolarization. Calcium is the trigger for LTPinduction, and shortening of NMDA receptor openingwould lessen the amount of thespine, possibly reducing the amount of LTP that can beinduced. By this same reasoning, suppression of the 5HTsystem should allow more LTP to be induced, and thishas recently been shown using the selective 5HT 3 inhibi-tor Ondansetron (Staubli, personal communication). Ifthis modulator does raise the LTP ceiling, it is predictedthat the resulting learning will exhibit broader receptivefields than comparable learning without the modulator.
Just as the 5HT system preferentially targets GABAb
338 Journal of Cognitive Neuroscience Volume 8, Number 4
interneurons, there is evidence that the ascending norad-renergic and cholinergic (NE and ACh) systems termi-nate on GABAa interneurons (Toth, Borhegyi, & Freund,1993; Miettinen & Freund, 1992; Seress et al., 1993)enabling their modulation of GABAa-mediated fast IPSPs.This modulation should affect IPSP strength and mayaffect the strength or the latency of the refractory periodfor the GABAa synapse (Larson et al., 1986; Mott & Lewis,1991). If the IPSP is strengthened, the amount of LTP thatcan be induced per step should be reduced; if the IPSPis weakened, more UP should be able to be inducedper induction episode; i.e., the LTP step size would beincreased. A modulator weakening the IPSP shouldthus enable faster learning, with the side effect ofslightly narrowing the receptive fields resulting fromthe training.
Finally, it should be noted that the size of the UPceiling varies in the same neuron across different den-

Figure 8. The radius of each concentric circle graphically repre-sents the amount of generalization a network will tolerate for agiven set of LTP parameters. Tolerance in (A) and (B) is arbitrarilyset at 25%, i.e., we allow one-quarter of the examples that a cell pre-fers to belong to a pattern that the cell was not trained on. (A) Ef-feet of step size
dritic locii (Woodward, Chiaia, Teyler, Leong, & Coull,1990; Arai, Silberg, & Lynch, 1995; Kolta, Larson, & Lynch,1995) and it appears that this may hold true for the stepsize as well (Arai et al., 1995). This raises the possibilitythat networks form multiple representations of noisyinputs with some being restrictive and others broad intheir receptive fields. Such a system, if coupled withvariations in the stability of potentiation, could allow forthe gradual sharpening of categories.
APPENDIX AActivation of a Cell Trained and Tested onPattern A InputsWe divide all N potential locations of the cell (and inputlines) into three sets:both patterns A and B inputs,specific to pattern A inputs, andcorrespond to the remainder:
(13)
Next, we calculate the expected number of active inputlines to each set of potential synaptic locations. For theshared and pattern A sets,will equal the number of positions in that set (corre-sponding to a noiseless input pattern) less a proportionalamount of positions that will be displaced by noise:
(1-1)
(15)
winning cell (the cell with the highest activation) forsome noisy input, then we can assume that on averagethe shared and pattern A regions of that cell will have aslightly higher density of synapses than the remainder ofthe cell. Since a certain proportion of the entire inputcomes from the shared and pattern A input lines, anequal proportion of the active synapses must come fromthose sets. Where noise displaces the activity of some ofthe input lines to other regions, we can only assume thatthere is the same density of synapses as the remainderof the cell. In other words, for at least some of thepositions in the shared and pattern A sets, we expect ahigher probability of a synapse existing at any particularposition than in an average cell, since this cell did pro-duce a higher activation on a (noisy) version of thepattern than did other cells. The remainder of the cellwill have a slightly lower probability of a synapse exist-ing at any particular position to compensate. We cancalculate the expected number of synapses (E[S]) ineach of these regions as follows:
(16)
(17)
(18)
To calculate the mean and variance of the activation ofa trained cell on an input, we can calculate the meansand variances of the contribution of each region. If X isthe activation of a trained cell on an input, then
Kilborn et al.
339
(19)

Since dependencies between the contributions of eachregion are not significant, we consider the contributionsindependent, and thus:
(20)
In presenting the following method of estimating vari-ance, we will look at only one region at a time.stands forfor which we are calculating variance. The same appliestoon an input, the weight of a certain number of synapsesis increased. For simplicity, we will assume that an aver-age number,training input pattern presentation (the mean number ofactive synapses in the set). We can think of weightincrements as balls and synapses as bins: every time wetrain the cell, we randomly throwbins. At first, some bins will be empty while others willcontain a widely varying amount of balls. As we throwmore balls in, however, the relative number of balls ineach bin will tend to even out.
We calculateric distribution ofcomes out of
(21)
If the learning step size is large relative to the differencebetween the ceiling and naive weightthen each of those balls represents a larger weight incre-ment and we will throw in fewer of them. This willprevent us from getting to the point of having nearlyidentical weights at each synapse. However, if the stepsize is small, we will have more chance to even out theweights. Since the probability of an active input line inany position within a region is equal, the lower thevariance among the synaptic weights, the lower thevariance in that region's contribution to the activationlevel.
When we determine the activation of a cell on a testinput pattern, we sum the weights of all active synapses.If there aretrained on
random variable, which represents whether or not acertain synapse was trained at a given training step.
The mean activation of a hypergeometric distributionis the product of the number of trials and the probabilityof success. In our case, we must scale the mean bydividing it by the number of steps, since each successrepresents a weight increment of onlywe must add any initial weight the synapses already had:
(22)
340 Journal of Cognitive Neuroscience
wherebeing active within a region. Note that the mean activa-tion does not depend on the step size according to thisequation. (A large step size actually does have a veryslight effect in terms of causing a few synapses to hittheir ceiling weight early, but we can disregard this.)
The variance can be calculated as follows:
(23)
and once again we scale according to the actual size ofeach weight increment. Note that Eq. (23) depends onlyonaffects only the mean activation, not the variance.
We now have the mean and variance of a cell's acti-vation giventest input. To estimate the mean and variance of the cellacross all possible inputs within the category, we mustfind the probability of different values ofbine variances according to those probabilities. Thisgives us a more accurate prediction than simply using
synapses in each region contributes largely to the vari-ation of the overall activation of the cell.
Letdistribution whereaccording to the above formulas where
apses is i, which follows the hypergeometric distribu-tion:
(24)
We want to calculate the mean and standard deviationof the random variable
(25)
Since(26)
and
(27)
and we know the mean and variance of eachcan make the calculation. Note that although we do not
Volume 8, Number 4

have an explicit formula forformula for variance:
(28)We have now incorporated two significant sources ofvariation into our calculations of a region's contributionto a cell's activation: varying synaptic weights and vary-ing input line activation. These computations are identi-cal to the ones for a cell trained and tested on patternB inputs, except that the computations for the patternA- and B-specific regions need to be switched ac-cordingly.
Along with predictions for a cell trained on a differentpattern than the test pattern (namely, trained on patternB inputs and tested on a pattern A input), we can esti-mate the likelihood of an input generating a higheractivation for a cell trained on inputs of the same patternas opposed to a cell trained on inputs of a differentpattern.
Activation of a Cell Trained on Pattern B Inputsand Tested on a Pattern A InputSuppose a cell has been trained on pattern B inputs andis tested on a pattern A input. Although we can expectthe same behavior in the region of shared input lines,the only lines activating the pattern B region of the cellwill be the result of noise in the pattern A test input.Likewise, the pattern A-specific input lines will synapseonto only a certain portion of what is the noise regionof the pattern B-trained cell. Because of this, the noiseregion of the cell should be divided into two parts: theregion that coincides with the pattern A-specificpositions of the test input and the region that coincideswith the positions of the test input that are part ofneither pattern A nor pattern B inputs
gions is equalDuring training, the pattern B-specific positions of the
i nput will coincide with the pattern B region of the cell,so
(29)
And the noisy lines of the training input will be dividedbetween the pattern A region and the remaining regionindicating neither pattern:
(30)
(31)
The expected number of synapses in the shared region
the same pattern. The mean number of synapses in thepattern B, pattern A, and neither pattern regions will be
(34)
(33)
(32)
During testing, the number of active input lines in thepatter nAandpatternBregionsreverses.Therefore,thecalculationof
(36)
(35)
The estimation of the mean and standard deviation ofthe activation of a cell trained on pattern B inputs andtested on a pattern A input (Y) can be made accordingto
(38)(37)
Chance That an Input Will Generate a HigherActivation for the Cell Trained on the SamePatternTo calculate the probability that a pattern A test inputwill generate a higher activation for the pattern A-trainedcell (and similarly that a pattern B test input will gener-ate a higher activation for the pattern B-trained cell), wemake a normal approximation for the distributions ofsame pattern and different pattern cell activations. Let Ube a random variable with normal distributionwheretested on pattern A inputs. Let V be a random variablewith normal distribution
Kilborn et al.
34 1

tested on pattern A inputs. The former mean and vari-ance generalizes to the activation of any cell tested withthe same pattern as it was trained on, be that eitherpattern A or B. Likewise, the latter mean and variancegeneralize to the activation of any cell tested on a differ-ent pattern than it was trained on.
The probability of the cell firing that was trained onthe same pattern as the test input is
(39)
We can express this in terms of the cumulative normaldistribution function:
(40)
(p) that may be incorporated into the above equa-
This probability can be visualized as the lesser volumeof the bivariate normal distribution of U and V after ithas been bisected by the U = V plane. Note that due tothe nature of the inputs (where noise displaces activityfrom one region to another), there is virtually no corre-lation between X and Y In other input paradigms, suchas purely additive noise, there may be a negative corre-lationtion:
\p(V<~_(D
µU - µv ~(6y- (ypp)2 + (y(1 - p 2)
(41)
Acknowledgments
This work was supported in part by the Office of Naval Re-search under Grants N00014-94-C-0103 and N00014-92+1625. We would also like to thank the reviewers of this paperfor their detailed and insightful comments.
Reprint requests should be sent to Richard Granger, Center forthe Neurobiology of Learning and Memory, University of Cali-fornia, Irvine, Irvine, CA 92717-3800.
REFERENCES
Arai, A., & Lynch, G. (1992). Factors regulating the magnitudeof long-term potentiation induced by theta pattern stimula-tion. Brain Research, 598, 173-184.
Arai, A., Silberg, J., & Lynch, G. (1995). Differences in the re-fractory properties of two distinct inhibitory circuitries infield CAI of the hippocampus. Brain Research, 704, 298-306.
Bear, M. E, & Malenka, R. C. (1994). Synaptic plasticity: LTPand LTD. Current Opinion in Neurobiology, 4(3), 389-399.
Bliss, T V P, & Lomo, T (1973). Long-lasting potentiation ofsynaptic transmission in the dentate area of the anesthe-tized rabbit following stimulation of the perforant path.Journal of Physiology (London), 232, 334-356.
Coultrip, R., Granger, R., & Lynch, G. (1992). A cortical modelof winner-take-all competition via lateral inhibition. Neu-ral Networks, 5, 47-54.
Ezeh, P, Wellis, D., & Scott, J. (1993). Organization of inhibi-
342 Journal of Cognitive Neuroscience Volume 8, Number 4
tion in the rat olfactory bulb external plexiform layer.Jour-nal of Neurophysiology, 70, 263-274.
Granger, R., Staubli, U., Davis, M., Perez, Y, Nilsson, L., Rogers,G., & Lynch, G. (1993). A drug that facilitates glutamatergictransmission reduces exploratory activity and improvesperformance in a learning dependent task. Synapse, 15,326-329.
Granger, R., Whitson, J., Larson, J., & Lynch, G. (1994). Non-Hebbian properties of LTP enable high-capacity encodingof temporal sequences. Proceedings of the National Acad-emy of Sciences US.A., 91, 10104-10108.
Haberly, L. B. (1985). Neuronal circuitry in the olfactory cor-tex: Anatomy and functional implications. ChemicalSenses, 10(2), 219-238.
Harnad, S. (1987). Categorical perception. New York: Cam-bridge University Press.
Hill, A. (1978). First occurrence of hippocampal spatial firingin a new environment Experimental Neurology, 62, 282-297.
Iriki, A., Pavlides, C., Keller, A., & Asanuma, H. (1989). Long-term potentiation in the motor cortex. Science, 245, 1385-1387.
Jiang, T., & Holley, A. (1992). Some properties of receptivefields of olfactory mitral/tufted cells in the frog.Journalof Neurophysiology, 68, 726-733.
Jung, M., Larson, J., & Lynch, G. (1990). Long-term potentia-tion of monosynaptic EPSPs in rat piriform cortex in vi-tro. Synapse, 6, 279-293.
Kanter, E. D., & Haberly, L. B. (1990). NMDA-dependent induction of long-term potentiation in afferent and associationfiber systems of piriform cortex in vitro. Brain Research,525, 175-179.
Kirkwood, A., & Bear, M. (1994). Hebbian synapses in visualcortex.Journal of Neuroscience, 14, 1634-1645.
Kolta, A., Larson, J., & Lynch, G. (1995). Comparison of long-term potentiation in the proximal versus distal stratum ra-diatum of hippocampal field CAI. Neuroscience, 66,277-289.
Larson, J., & Lynch, G. (1986). Induction of synaptic potentia-tion in hippocampus by patterned stimulation involvestwo events. Science, 232, 985-988.
Larson, J., Wong, D., & Lynch, G. (1986). Patterned stimulationat the theta frequency is optimal for induction of long-term potentiation. Brain Research, 368, 347-350.
Larson, J., Xiao, P, & Lynch, G. (1993). Reversal of LIP bytheta frequency stimulation. Brain Research, 600, 97-102
Lynch, G. (1986) Synapses, circuits, and the beginnings ofmemory. Cambridge, MA: MIT Press.
Macrides, F (1975). Temporal relationships between hippo-campal slow waves and exploratory sniffing in hamsters.Behavioral Biology, 14, 295-308.
Miettinen, R., & Freund, T (1992). Convergence and segrega-tion of septal and median raphe inputs onto different sub.sets of hippocampal inhibitory interneurons. BrainResearch, 594, 263-272.
Mott, D., & Lewis, D. (1991). Facilitation of the induction oflong-term potentiation by GABAb receptors. Science, 252,1718-1720.
Otto, T, Eichenbaum, H., Weiner, S., & Wible, C. (1991). Learning-related patterns of CAI spike trains parallel stimula-tion parameters optimal for inducing hippocampallong-term potentiation. Hippocampus, 1, 181-192.
Price, J. L. (1973). An autoradiographic study of complemen-tary laminar patterns of termination of afferent fiber tothe olfactory cortex. Journal of Comparative Neurology,150, 87-108.
Rail, W, Burke, R., Holmes, W, Jack, J., Redman, S., & Segev, I.(1992). Matching dendritic neuron models to experimen-

tal data. Physiological Reviews (Supplement), 72, S159-S186.
Seress, L., Gulyas, A., Ferrer, I., Tunon, T, Soriano, E., & Freund,T. (1993). Distribution, morphological features, and synap-tic connections of parvalbumin- and calbindin d28k-immunoreactive neurons in the human hippocampalformation.Journal of Comparative Neurology, 337, 208-230.
Shepard, R. N. (1987). Toward a universal law of generaliza-tion for psychological science. Science, 237, 1317-1323.
Smith, E. E., & Medin, D. L. (1981). Categories and concepts.Cambridge, MA: Harvard University Press.
Staubli, U., & Lynch, G. (1987). Stable hippocampal long-term
potentiation elicited by 'theta' pattern stimulation. BrainResearch, 435, 227-234.
Staubli, U., Rogers, G., & Lynch, G. (1994). Facilitation of gluta-mate receptors enhances memory. Proceedings c f the Na-tional Academy of Sciences US.A., 91, 777-78 1.
Toth, K., Borhegyi, Z., & Freund, T (1993). Postsynaptic tar-gets of GABAergic hippocampal neurons in the medialseptum-diagonal band of broca complex. Journal ofNeuroscience, 13, 3712-3724.
Woodward, W, Chiaia, N., Teyler, T., Leong, L., & Coull. B.(1990). Organization of cortical afferent and efferent path-ways in the white matter of the rat visual system. Neuro-science, 36, 393-401.