Effects of Liquid Organic Fertilizers on Plant Growth and ... · and Rhizosphere Soil...
16
sustainability Article Effects of Liquid Organic Fertilizers on Plant Growth and Rhizosphere Soil Characteristics of Chrysanthemum Rongting Ji 1,2 , Gangqiang Dong 3 , Weiming Shi 1 and Ju Min 1, * 1 State Key Laboratory of Soil and Sustainable Agriculture, Institute of Soil Science, Chinese Academy of Sciences, Nanjing 210008, China; [email protected] (R.J.); [email protected] (W.S.) 2 University of the Chinese Academy of Sciences, Beijing 100049, China 3 Amway (China) Botanical R&D Center, Wuxi 214115, China; [email protected] * Correspondence: [email protected]; Tel.: +86-25-8688-1577 Academic Editor: Iain Gordon Received: 31 March 2017; Accepted: 8 May 2017; Published: 18 May 2017 Abstract: Organic fertilizers are generally thought to be an effective way to sustain soil fertility and plant growth. To promote the productivity of chrysanthemum, five sources of liquid organic fertilizers (L1–L5), as well as a chemical fertilizer, were applied at an early stage of the growth cycle to investigate their effects on plant growth. In the short-term pot experiment, the liquid organic fertilizers significantly promoted root and aboveground growth by 10.2–77.8% and 10.7–33.3%, respectively, compared with the chemical fertilizer. The order of growth promotion was: L1 (shrimp extracts) > L2 (plant decomposition) > L4 (seaweed extracts)/L5 (fish extracts) > L3 (vermicompost). Morphological and chemical analyses indicated that, compared with other organic fertilizers, the treatment with shrimp extract (L1) produced the greatest increases in root dry weight, total length, surface area, volume, tips, and thick root length, respectively. Furthermore, the shrimp extract treatment significantly increased the nutrient contents and altered the soil’s functional microbial community at the rhizospheric level compared with the chemical fertilizer treatment. Thus, the shrimp extract liquid organic fertilizer could be part of an effective alternative to chemical fertilization during the early stage of chrysanthemum growth. Keywords: liquid organic fertilizer; chrysanthemum; root architecture; nutrient level; microbial community 1. Introduction Chrysanthemum (Chrysanthemum morifolium Ramat.), which originated in Asia and Northeastern Europe, has been cultivated for more than 1600 years [1,2]. It is widely cultivated for ornamental, culinary, and medicinal uses throughout the world. For instance, in Italy, chrysanthemum production covers 1180 ha with 437 million plants and continues to grow [3]. The current trends in the chrysanthemum industry are focused on improving flower quality and creating environmentally-friendly production systems [4,5]. To achieve these goals and accelerate chrysanthemum production, further innovation is needed in improving fertilization regimes and other production techniques [6,7]. In many areas of the world, especially in China, chrysanthemum plants are cultivated under greenhouse conditions, and the over-application of chemical fertilizers has influenced the soil quality and caused serious environmental problems [8,9]. In addition, chrysanthemum plants are sensitive to chemical fertilizers, and their improper use affects the plant’s reproductive growth and the secondary metabolism of chrysanthemum plants [10,11]. Moreover, chrysanthemum has a great demand for nutrients, especially at the early stage of the growth cycle, and the nutrient status during the first seven weeks of chrysanthemum growth has a strong effect on flower size and quality [4]. Thus, growth regulation and fertilizer optimization at the early stage play critical roles during the growth cycle of chrysanthemum. Sustainability 2017, 9, 841; doi:10.3390/su9050841 www.mdpi.com/journal/sustainability
Transcript of Effects of Liquid Organic Fertilizers on Plant Growth and ... · and Rhizosphere Soil...

sustainability
Article
Effects of Liquid Organic Fertilizers on Plant Growthand Rhizosphere Soil Characteristicsof Chrysanthemum
Rongting Ji 1,2, Gangqiang Dong 3, Weiming Shi 1 and Ju Min 1,*1 State Key Laboratory of Soil and Sustainable Agriculture, Institute of Soil Science, Chinese Academy
of Sciences, Nanjing 210008, China; [email protected] (R.J.); [email protected] (W.S.)2 University of the Chinese Academy of Sciences, Beijing 100049, China3 Amway (China) Botanical R&D Center, Wuxi 214115, China; [email protected]* Correspondence: [email protected]; Tel.: +86-25-8688-1577
Academic Editor: Iain GordonReceived: 31 March 2017; Accepted: 8 May 2017; Published: 18 May 2017
Abstract: Organic fertilizers are generally thought to be an effective way to sustain soil fertilityand plant growth. To promote the productivity of chrysanthemum, five sources of liquid organicfertilizers (L1–L5), as well as a chemical fertilizer, were applied at an early stage of the growth cycleto investigate their effects on plant growth. In the short-term pot experiment, the liquid organicfertilizers significantly promoted root and aboveground growth by 10.2–77.8% and 10.7–33.3%,respectively, compared with the chemical fertilizer. The order of growth promotion was: L1 (shrimpextracts) > L2 (plant decomposition) > L4 (seaweed extracts)/L5 (fish extracts) > L3 (vermicompost).Morphological and chemical analyses indicated that, compared with other organic fertilizers,the treatment with shrimp extract (L1) produced the greatest increases in root dry weight, totallength, surface area, volume, tips, and thick root length, respectively. Furthermore, the shrimp extracttreatment significantly increased the nutrient contents and altered the soil’s functional microbialcommunity at the rhizospheric level compared with the chemical fertilizer treatment. Thus, the shrimpextract liquid organic fertilizer could be part of an effective alternative to chemical fertilization duringthe early stage of chrysanthemum growth.
Keywords: liquid organic fertilizer; chrysanthemum; root architecture; nutrient level; microbial community
1. Introduction
Chrysanthemum (Chrysanthemum morifolium Ramat.), which originated in Asia and NortheasternEurope, has been cultivated for more than 1600 years [1,2]. It is widely cultivated for ornamental,culinary, and medicinal uses throughout the world. For instance, in Italy, chrysanthemum productioncovers 1180 ha with 437 million plants and continues to grow [3]. The current trends in the chrysanthemumindustry are focused on improving flower quality and creating environmentally-friendly productionsystems [4,5]. To achieve these goals and accelerate chrysanthemum production, further innovation isneeded in improving fertilization regimes and other production techniques [6,7]. In many areas of theworld, especially in China, chrysanthemum plants are cultivated under greenhouse conditions, and theover-application of chemical fertilizers has influenced the soil quality and caused serious environmentalproblems [8,9]. In addition, chrysanthemum plants are sensitive to chemical fertilizers, and theirimproper use affects the plant’s reproductive growth and the secondary metabolism of chrysanthemumplants [10,11]. Moreover, chrysanthemum has a great demand for nutrients, especially at the early stageof the growth cycle, and the nutrient status during the first seven weeks of chrysanthemum growthhas a strong effect on flower size and quality [4]. Thus, growth regulation and fertilizer optimizationat the early stage play critical roles during the growth cycle of chrysanthemum.
Sustainability 2017, 9, 841; doi:10.3390/su9050841 www.mdpi.com/journal/sustainability
Sustainability 2017, 9, 841 2 of 16
Organic fertilizers are effective in promoting environmental sustainability and plant growthafter long-term use, but previous studies have focused primarily on the conventional solid organicfertilizer product, such as straw and manure [12,13]. Specialized horticultural production has fosteredthe emergence of new liquid organic fertilizers [14], which have usually been derived from naturalproducts and their biological activities occur at limited doses. Compared with conventional organicfertilizer, the abundant organic matter and soluble nutrients in the liquid organic fertilizers couldmaintain soil sustainability and plant health [15,16]. In addition, the integration of watering andfertilization patterns could improve the nutrient use efficiency and decrease the risk of nutrientloss [17,18]. Moreover, the special compounds in liquid organic fertilizers, such as chitin, humic andfulvic acids, and other biopolymers, can be biostimulants to plants [19–22]. Canfora et al. reportedthat liquid organic fertilizers containing stillage and vermicompost promoted the root growth oftomato and improved the soil microbial communities Eubacterial and Archaeal diversity, and thiswas in accordance with the results of liquid residues from lipopeptide production that could promotetomato growth and increase the diversity of the soil’s microbial community, as well as the relatedenzyme activities and nutrient cycles [23,24]. Given the ecological and economic benefits of liquidorganic fertilizer, evaluating plant growth under organic versus chemical fertilizer use and studyingthe possible mechanisms of action are promising steps in developing an effective alternative fertilizerfor chrysanthemum production [25,26].
The root systems of terrestrial plants perform two primary functions: acquiring nutrients andwater from soil-based resources and recruitment of desired microbial partners for greater mutualisticbenefits [27–30]. In a previous study, Xu et al. found that restricted the growth of shoot-borne roots ofmaize decreased nutrient absorption, leaf formation, and shoot growth [31]. The rhizosphere is thethin layer of soil contacted by the root and is the habitat for soil microbial communities [32]. Ecologicalprocesses in the soil are often complex interactions between the plant’s roots, soil nutrients, and therhizosphere’s microorganisms [33,34]. Soil microorganisms in the rhizosphere play critical roles innutrient cycling and soil structure maintenance, which could further promote nutrient cycles and plantgrowth [34,35]. The Biolog microplate technique is a powerful tool for monitoring the soil bacteria’sfunctional diversity, although it cannot determine the total microbial community but, rather, the activemicrobes, which can indicate environmental changes [36,37]. Therefore, root growth and rhizospheremicrobial community changes appear to be extremely vital to evaluating liquid organic fertilizers.
The present study was conducted to investigate the short-term effects [24,38] of five liquid organicfertilizers from different sources (shrimp extracts (L1), plant decomposition (L2), vermicompost (L3),seaweed extracts (L4), and fish extracts (L5)), on chrysanthemum plant growth at the seedling stageusing the root architecture and plant growth parameters. To understand the effects of various liquidfertilizers on the soil quality, the soil nutrient level and functional bacterial diversity, which sustainsmicrobes at the rhizosphere level, were also studied. The chief objectives of this study were: (1) toidentify the effects of liquid organic fertilizers and a chemical fertilizer on chrysanthemum growthat the seedling stage; (2) to find a suitable source of liquid organic fertilizer to be applied at the earlystage of the growth cycle during chrysanthemum production; and (3) to study the effects of liquidorganic fertilizers on the soil characteristics at the rhizosphere level.
2. Materials and Methods
2.1. Materials, Experimental Design, and Sampling
The chrysanthemum cultivar Hangju ‘No. 2 of Jinju’ was obtained from the Amway BotanicalResearch and Development Center, Wuxi, Jiangsu, China. The cutting seedlings of chrysanthemumwere cultivated on a sterilized substrate of vermiculite and perlite (1:1, v:v) without fertilization.After rooting for 15 days, seedlings of a similar height and diameter were transplanted into plots filledwith 500 g of a peat and paddy soil (2:1, v:v) substrate and grown for 60 days, with one plant per pot.

Sustainability 2017, 9, 841 3 of 16
At transplanting and at one additional time (30 days after transplanting), the CK, NPK, and fiveliquid organic fertilizers (L1: shrimp extracts; L2: plant decomposition; L3: vermicompost; L4:seaweed extracts; L5: fish extracts) were applied to the substrate of the chrysanthemum. The majorcharacteristics of these fertilizers are presented in Table 1. All products were applied as a dilutedsolution according to the instructions provided by the manufacturers. The total amount of themacro-elements applied with the mineral and organic fertilizers was as follows:
NPK: 60.0 mg N pot−1; 13.1 mg P pot−1; 41.2 mg K pot−1;L1: 36.8 mg N pot−1; 0.5 mg P pot−1; 9.1 mg K pot−1;L2: 35.0 mg N pot−1; 2.9 mg P pot−1; 40.4 mg K pot−1;L3: 18.4 mg N pot−1; 0.3 mg P pot−1; 24.6 mg K pot−1;L4: 15.1 mg N pot−1; 3.3 mg P pot−1; 12.5 mg K pot−1; andL5: 27.4 mg N pot−1; 4.1 mg P pot−1; 14.6 mg K pot−1.
Table 1. Nutrient elements content of the liquid organic fertilizers applied in the experiment.
Product Source Biostimulants pH N 1
(g/L)P
(g/L)K
(g/L)Using
Instructions ProvidersProduction
OrganicCertification
CK / / / / / / / / /
NPK chemicalreagent / 8.9 267.7 58.2 184.4 0.20% / /
L1 shrimp extracts chitosan 7.2 98.0 1.3 23.2 0.25%
ShenbotaiBiotechnology andChemical Co., Ltd.,
Zhanjiang,Guangdong, China
China OFDC 2
certifiedorganic
L2 plantdecomposition humic acid 10.4 140.1 11.4 169.5 0.17%
TiancibaoAgrtcultural andTechnology Co.,Ltd., Changsha,Hunan, China
/
L3 vermicompost amino acids 4.0 49.0 0.7 65.5 0.25%Wenxing Biotech
Co., Ltd., Shanghai,China
China OFDCcertifiedorganic
L4 seaweedextracts alginate 7.1 60.4 13.0 51.0 0. 17%
Qingdao SeawinBiotech Group Co.,
Ltd., Qingdao,Shandong, China
EU 3 certifiedorganic
L5 fish extracts fish emulsion 3.6 91.3 13.6 48.5 0.20%
YirongBio-engineering
Co., Ltd., Ningde,Fujian, China
China OFDCcertifiedorganic
Notes: 1 The concentration of N, P, and K in the mineral and organic fertilizers was determined by the chemicalanalysis methods in Section 2.3; 2 OFDC, Organic Food Development Center; 3 EU, European Union.
To exclude the influence of chrysanthemum roots, one more treatment, Non-R (withoutchrysanthemum plant), was also included in our experiment to assess the non-rhizospheric effects.Each treatment consisted of three pots placed in a completely randomized design. At the end ofthe trial (60 days after transplanting), plant growth was monitored and the rhizospheric soil of thechrysanthemum root was gathered by removing the loose soil and collecting the remaining soil thatwas tightly adhered to the roots. The soil was divided into two parts: one air-dried for the soilproperties analyses, and the other stored at 4 ◦C for further microbial analysis.
2.2. Root Morphology and Aboveground Growth Parameters
Root morphological parameters, including total root length, root surface area, root volume,and root tip number, were analyzed using the root analysis instrument WinRhizo-LA1600 (RegentInstruments Inc., Quebec, QC, Canada) [39]. Thick root lengths were calculated from root diameters>0.5 mm. Root weight was measured after determining of the root morphological parameters.

Sustainability 2017, 9, 841 4 of 16
Aboveground growth was monitored by shoot height, diameter, and dry weight, as well as leafwidth, length, area, and dry weight. The SPAD values of leaves were quantified using the hand-heldMinolta SPAD-502 (Minolta corporation, Ltd., Osaka, Japan).
2.3. Chemical Analyses of Fertilizer and Soil
The content of N, P, and K of the mineral fertilizer and L1–L5 organic fertilizers was determinedwith an ICP (inductively-coupled plasma) spectrometer (Thermo Electron Corporation, Ltd., Waltham,MA, USA) [24]. Soil NH4
+-N and NO3−-N were extracted from the fresh soil samples with 1 M KCl
(1:10 soil:solution ratio) for 1 h, and their levels were determined using a continuous flow analyzer(Skalar Analytical B.V., Breda, The Netherlands). The content of soil mineral N was calculated as thesum of the soil NH4
+-N and NO3−-N contents [40]. Available P was extracted using a 0.5 M NaHCO3
solution (1:10 soil: solution ratio) and was measured using the colorimetric method with molybdenum.Available K was extracted with 1 M NH4OAC solution (1:10 soil:solution ratio) and was determinedusing flame photometry [38]. The EC of air-dried soil was determined by means of an EC meter (Bante,Ltd., Shanghai, China) with a soil: water ratio of 1:5 (w/v). The soil pH was measured using the pHmeter (Agilent technologies, Ltd., Palo Alto, CA, USA) with a soil: water ratio of 1:2.5 (w/v) [41].
2.4. Community Level Physiological Profile Analyses
Biolog EcoPlates (Biolog Inc., Hayward, CA, USA) and a BIOLOGEmaxTM reading (Biolog Inc.)
were used to determine the community level physiological profiles of the chrysanthemum rhizosphericsoil. Each plate contains three sets of 31 carbon substrates and one control, and uses tetrazoliumdye as the substrate utilization indicator (Janice Young, Biolog, Inc., personal communication). Thesubstrates were classified into six substrate sources, namely, carbohydrates, carboxylic acids, phenoliccompounds, amino acids, polymers, and amines. Briefly, 5 g of chrysanthemum rhizospheric soil wasmixed in 45 mL of a sterile NaCl solution (0.85%, m/v) and then oscillated at 180 rpm for 30 min. Usinga sterile NaCl solution (0.85%, m/v), a serial dilution was performed until a final 1:1000 dilution wasreached. Then, 150 µL of the supernatant was added to each well. Microplates were incubated at 25 ◦Cfor 192 h, and the influence of turbidity on the OD values at 590 nm and 750 nm were recorded every12 h and calculated by subtracting the absorbance values of the two wavelengths. The OD values atthe 96 h and 192 h of incubation were used for subsequent statistical analyses. All of the treatmentshad three replications. The well absorbance values were adjusted by subtracting the absorbance ofthe control well (water only) before the data analyses. Negative readings (OD < 0) were excludedfrom all subsequent analyses. The microbial activity in each microplate, expressed as the average wellcolor development (AWCD), was determined as follows: AWCD = ∑ODi/31, where ODi is the opticaldensity value from each well. The Shannon diversity index was calculated as follows: H = −∑Pi(ln Pi),where Pi is the ratio of the activity on each substrate (ODi) to the sum of activities on all substrates(∑ODi). The Shannon evenness index was calculated as E = H/ln(richness), where richness refers tothe number of substrates utilized [36].
2.5. Statistical Analyses
Statistical analyses of data were conducted with the SPSS software program (ver. 20.0 for Windows,Chicago, IL, USA). Variations among chrysanthemum root morphological and aboveground growthparameters, the chemical analyses of rhizospheric soil properties, carbon utilization, and diversityindex were analyzed using a two-way analysis of variance. Duncan’s test was used to determinethe different treatment levels. The PCA was conducted to analyze the substrate utilization patternbased on the Biolog EcoPlates data at 96-h after incubation and was performed to visualize the carbonutilization characteristics using CANOCO for Windows 4.5. All of the graphs were created withOriginPro 8.5 (OriginLab Corporation, Northampton, MA, USA).

Sustainability 2017, 9, 841 5 of 16
3. Results
3.1. Effects of Organic Fertilizers on the Root Architecture and Aboveground Growth of Chrysanthemum
The root architecture of chrysanthemum is of great importance in nutrient uptake and transport.The statistical results of the effects on the root architecture of the various fertilizers are shown inFigure 1. Each liquid organic fertilizer had a positive effect on root growth. Compared with the CK andNPK treatments, the application of liquid organic fertilizers significantly promoted the root growthby 76.2–179.6% and 10.2–77.8%, respectively. L1 showed the highest promotional effect on the rootgrowth of chrysanthemum than the other liquid organic fertilizer treatments. The root dry weight,root total length, root surface area, root volume, root tips, and thick root length of chrysanthemumunder the L1 treatment was higher than the NPK treatment by 63.4%, 63.9%, 65.6%, 67.8%, 115.4%,and 90.5%, respectively. The L2 treatment had the second highest promotional effect and the rootindices were enhanced by 35.1%, 44.2%, 41.9%, 40.1%, 75.3%, and 43.6%, respectively, compared withthe NPK treatment. All of the root indices under L3, L4, and L5 treatments were similar to each otherand slightly higher than those of the NPK treatment even at a limited mineral nutrient input rate.Analyses of chrysanthemum root growth showed that the application of L1 resulted in the greatestgrowth-promoting effects among the various liquid organic fertilizers.
Sustainability 2017, 9, 841 5 of 16
3. Results
3.1. Effects of Organic Fertilizers on the Root Architecture and Aboveground Growth of Chrysanthemum
The root architecture of chrysanthemum is of great importance in nutrient uptake and transport. The statistical results of the effects on the root architecture of the various fertilizers are shown in Figure 1. Each liquid organic fertilizer had a positive effect on root growth. Compared with the CK and NPK treatments, the application of liquid organic fertilizers significantly promoted the root growth by 76.2–179.6% and 10.2–77.8%, respectively. L1 showed the highest promotional effect on the root growth of chrysanthemum than the other liquid organic fertilizer treatments. The root dry weight, root total length, root surface area, root volume, root tips, and thick root length of chrysanthemum under the L1 treatment was higher than the NPK treatment by 63.4%, 63.9%, 65.6%, 67.8%, 115.4%, and 90.5%, respectively. The L2 treatment had the second highest promotional effect and the root indices were enhanced by 35.1%, 44.2%, 41.9%, 40.1%, 75.3%, and 43.6%, respectively, compared with the NPK treatment. All of the root indices under L3, L4, and L5 treatments were similar to each other and slightly higher than those of the NPK treatment even at a limited mineral nutrient input rate. Analyses of chrysanthemum root growth showed that the application of L1 resulted in the greatest growth-promoting effects among the various liquid organic fertilizers.
Figure 1. Effects of CK, NPK, and organic liquid fertilizers (L1: shrimp extracts; L2: plant decomposition; L3: vermicompost; L4: seaweed extracts; L5: fish extracts) treatments on the root architecture of chrysanthemum at 60 days after transplanting. (A) Root dry weight; (B) total root length; (C) root surface area; (D) root volume; (E) root tips; and (F) thick root length. Every value is expressed as the mean ± standard deviation. Different letters indicate significantly statistical differences at the p < 0.05 level as determined by Duncan’s multiple range test.
The statistical results of the aboveground growth indices affected by different fertilization regimes are shown in Figure 2. The shoot and leaf growth of chrysanthemum was significantly improved by the application of liquid organic fertilizers. Each type of liquid organic fertilizer produced greater seedling growth than the NPK treatment, especially in terms of shoot height and weight, leaf length, width, area, and weight, which were enhanced by 28.9%, 30.8%, 15.9%, 18.9%,
Figure 1. Effects of CK, NPK, and organic liquid fertilizers (L1: shrimp extracts; L2: plant decomposition;L3: vermicompost; L4: seaweed extracts; L5: fish extracts) treatments on the root architecture ofchrysanthemum at 60 days after transplanting. (A) Root dry weight; (B) total root length; (C) rootsurface area; (D) root volume; (E) root tips; and (F) thick root length. Every value is expressed as themean ± standard deviation. Different letters indicate significantly statistical differences at the p < 0.05level as determined by Duncan’s multiple range test.
The statistical results of the aboveground growth indices affected by different fertilization regimesare shown in Figure 2. The shoot and leaf growth of chrysanthemum was significantly improved by theapplication of liquid organic fertilizers. Each type of liquid organic fertilizer produced greater seedlinggrowth than the NPK treatment, especially in terms of shoot height and weight, leaf length, width,area, and weight, which were enhanced by 28.9%, 30.8%, 15.9%, 18.9%, 36.2%, and 28.2%, respectively.

Sustainability 2017, 9, 841 6 of 16
The shoot heights of all the plants under the liquid organic fertilizer treatments were higher thanunder the NPK treatment, and the tallest plants were exposed to the L2 treatment, having an increaseof 35.7%, but there were no significant differences among the liquid organic fertilizers treatments.Treatments with L1, L2, and L4 showed significant promotional effects that led to the cultivation ofstrong seedlings, and the shoot diameters of L1-treated plants were 1.2 times those of the NPK-treatedplants. Plants treated with L1 achieved the greatest shoot and leaf biomasses, which were greaterthan the CK treatment by 70.0% and 66.7%, respectively. All of the liquid organic fertilizer treatmentssignificantly promoted the leaf growth of chrysanthemum, and the leaf length, width, and area underthe L5 treatment were 44.7%, 29.7%, and 90.7% greater than those under the CK treatment, respectively.The SPAD measurements of leaves were elevated after the application of liquid organic fertilizersand greater than under the NPK treatment (expect L3). The SPAD value of the L1 treatment was29.3% greater than the CK treatment. Analyses of the aboveground indices of chrysanthemum showedthat the L1, L2, and L5 treatments had the greatest promotional effects on chrysanthemum shoot andleaf growth.
Sustainability 2017, 9, 841 6 of 16
36.2%, and 28.2%, respectively. The shoot heights of all the plants under the liquid organic fertilizer treatments were higher than under the NPK treatment, and the tallest plants were exposed to the L2 treatment, having an increase of 35.7%, but there were no significant differences among the liquid organic fertilizers treatments. Treatments with L1, L2, and L4 showed significant promotional effects that led to the cultivation of strong seedlings, and the shoot diameters of L1-treated plants were 1.2 times those of the NPK-treated plants. Plants treated with L1 achieved the greatest shoot and leaf biomasses, which were greater than the CK treatment by 70.0% and 66.7%, respectively. All of the liquid organic fertilizer treatments significantly promoted the leaf growth of chrysanthemum, and the leaf length, width, and area under the L5 treatment were 44.7%, 29.7%, and 90.7% greater than those under the CK treatment, respectively. The SPAD measurements of leaves were elevated after the application of liquid organic fertilizers and greater than under the NPK treatment (expect L3). The SPAD value of the L1 treatment was 29.3% greater than the CK treatment. Analyses of the aboveground indices of chrysanthemum showed that the L1, L2, and L5 treatments had the greatest promotional effects on chrysanthemum shoot and leaf growth.
Figure 2. Effects of CK, NPK, and organic liquid fertilizers (L1: shrimp extracts; L2: plant decomposition; L3: vermicompost; L4: seaweed extracts; L5: fish extracts) treatments on the aboveground growth of chrysanthemum at 60 days after transplanting. (A) ΔH; (B) shoot diameter; (C) shoot dry weight; (D) leaf length; (E) leaf width; (F) leaf area; (G) leaf dry weight; and (H) SPAD value. ΔH indicates the shoot height change during the growth stage; leaf length and width were measured using the largest leaf of the plant. Leaf area was estimated as follows: leaf length × width ×
Figure 2. Effects of CK, NPK, and organic liquid fertilizers (L1: shrimp extracts; L2: plantdecomposition; L3: vermicompost; L4: seaweed extracts; L5: fish extracts) treatments on theaboveground growth of chrysanthemum at 60 days after transplanting. (A) ∆H; (B) shoot diameter;(C) shoot dry weight; (D) leaf length; (E) leaf width; (F) leaf area; (G) leaf dry weight; and (H)SPAD value. ∆H indicates the shoot height change during the growth stage; leaf length andwidth were measured using the largest leaf of the plant. Leaf area was estimated as follows:leaf length × width × 0.75. Different letters indicate significant differences among treatments asdetermined by Duncan’s multiple range test at the p < 0.05 level.

Sustainability 2017, 9, 841 7 of 16
3.2. Effects of Liquid Organic Fertilizers on the Nutrient Contents of Chrysanthemum Rhizospheric Soil
To investigate the soil’s chemical properties influenced by the application of liquid organicfertilizers, several main nutritional parameters of rhizospheric soil were measured and the results areshown in Table 2. The nutrient content in the non-rhizosphere (Non-R) treatment was significantlydifferent from the rhizospheric soil. The contents of mineral nitrogen and available potassium weremuch higher in the Non-R treatment. In the rhizospheric soil, the mineral N content was significantlyincreased with the addition of L1, whereas the content was the lowest under the NPK treatment, witha gap of 12.46 mg/kg. The available P and K contents under the L4 treatment were greater thanunder other treatments, and were enhanced by 49.0% and 13.4%, respectively, compared with theCK treatment. The EC measurements of rhizospheric soil significantly increased with the applicationof liquid organic fertilizers, which was consistent with the change in the mineral N content. The L1treatment showed the highest EC value, followed by the L3 treatment, and no significant differenceswere observed among the other fertilizer treatments. The pH value of rhizospheric soil changed underdifferent fertilizer treatments, and this was partly due to the different pH values of the fertilizersthemselves, and because of different influences on the root exudates of chrysanthemum. Comparedwith that of the NPK, the pH values of the liquid organic fertilizer treatments were closer to that ofthe CK.
Table 2. The mineral nitrogen (N), available phosphorus (Avail-P), available potassium (Avail-K),electric conductivity (EC), and pH of chrysanthemum rhizospheric soil at the end of the trial *.
Treatment Mineral N (mg/kg) Avail-P (mg/kg) Avail-K (mg/kg) EC (us/cm) pH
Non-R 29.9 ± 2.7 a 15.6 ± 0.3 d 48.3 ± 1.9 a 228.0 ±17.1 b 5.1 ± 0.1 eCK 11.9 ± 0.6 d 17.4 ± 0.7 cd 18.3 ± 0.3 b 139.6 ± 5.1 c 5.3 ± 0.1 b
NPK 7.4 ± 0.7 e 18.7 ± 0.5 bcd 17.4 ± 1.3 b 186.8 ± 15.9 bc 5.5 ± 0.1 aL1 19.8 ± 1.2 b 19.4 ± 1.1 bcd 17.3 ± 0.5 b 340.3 ± 39.6 a 5.2 ± 0.1 cdL2 12.5 ± 1.1 cd 21.0 ± 0.9 bc 18.5 ± 1.1 b 194.6 ± 9.8 bc 5.4 ± 0.1 aL3 11.4 ± 0.4 d 17.0 ± 0.7 d 18.7 ± 1.1 b 294.0 ± 10.1 bc 5.1 ± 0.1 deL4 13.1 ± 1.3 cd 25.9 ± 2.5 a 20.8 ± 1.3 b 171.4 ± 28.9 c 5.3 ± 0.1 bcL5 16.3 ± 1.0 bc 22.4 ± 1.3 ab 19.0 ± 0.8 b 209.3 ± 21.5 bc 5.2 ± 0.1 bcd
Notes:* Treatments included: Non-R: non-rhizosphere; CK: control; NPK: chemical fertilizer; L1: shrimp extracts;L2: plant decomposition; L3: vermicompost; L4: seaweed extracts; and L5: fish extracts. Different letters indicatesignificant differences among treatments as determined by Duncan’s multiple range test at the p < 0.05 level.
3.3. Effects of the Organic Fertilizers on Microbial Community Functions in Chrysanthemum Rhizospheric Soil
The AWCD was used as an indicator of the microbial activity in the soil. As presented in Figure 3,the AWCD of the rhizospheric soil was almost zero over the first 50 h of incubation, and it experienceda rapidly increasing stage, subsequently. The highest AWCD values were achieved under L1 andL2 treatments, while the lowest AWCD values were exhibited under the Non-R and CK treatments.The addition of liquid organic fertilizers significantly increased the AWCD values after incubation,and the AWCD values of rhizospheric soil treated with L1–L5 were 2.46, 2.43, 1.70, 1.35, and 1.83 timesgreater, respectively, than those of the CK soil. Thus, the addition of liquid organic fertilizers generallyimproved the functions of chrysanthemum rhizospheric soil’s microbial community. Additionally,treatments with L1 and L2 affected the increase in the AWCD. The AWCD under treatment L5 showedno significant variation compared with the NPK treatment, whereas the AWCD values of the L3 and L4treatments at the preliminary stage of incubation were lower than the NPK treatment, but the AWCDof the L3 treatment exceeded that of the NPK treatment at the end of the incubation.

Sustainability 2017, 9, 841 8 of 16Sustainability 2017, 9, 841 8 of 16
Figure 3. Changes in the AWCD of 31 carbon sources utilized in chrysanthemum rhizospheric soil treated with the following: Non-R: non-rhizosphere soil; CK: control; NPK: chemical fertilizer treatment; L1: shrimp extracts; L2: plant decomposition; L3: vermicompost; L4: seaweed extracts; and L5: fish extracts.
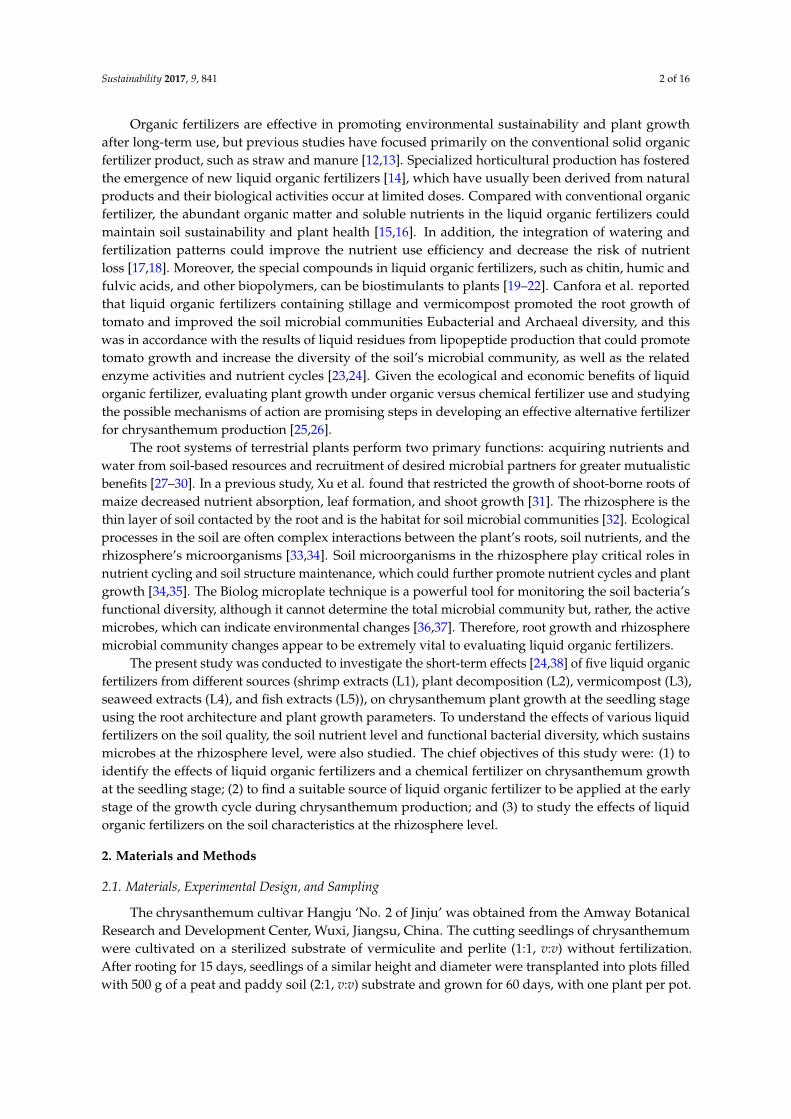
As demonstrated by the PCA (Figure 4), 59.1% of the total variance was explained, with the first principal component explaining 43.3% of the variance. The microbial community primarily clustered into six distinct groups: the CK, L1, L3/L4, L2/L5, NPK, and Non-R, and, as revealed by the PCA analysis, the liquid organic fertilizer treatments, could significantly influence the bacteria’s carbon source utilization in the rhizospheric soil. The NPK treatment was separated from the liquid organic fertilizer treatments on the PC1 axis, and the CK treatment could be separated from the liquid organic fertilizer treatments on the PC2 axis. The metabolic activities in the rhizospheric soil under different fertilizers indicated that the microbial community was capable of growing by ingesting diverse types of carbon sources under different conditions. For example, the main carbon substrates utilized under the CK treatment was 2-hydroxybenzoic acid, whereas under the NPK treatment it was 4-hydroxybenzoic acid. Under the L5 treatment D-mannitol and N-acetyl-D-glucosamine were the main carbon sources. Moreover, significant differences were detected in the utilization of the six main carbon sources (carbohydrates, carboxylic acid, phenolic compounds, amino acid, polymer, and amines) (Figure 5). Carbohydrates and carboxylic acid were the major carbon sources for different treatments. The highest utilization of carbohydrates was achieved under the L1 treatment, and the optical density (OD) value was 2.29 times that of the CK treatment. This was followed by L2, and the lowest utilization values occurred under the CK and Non-R treatments. The highest utilization of carboxylic acid was achieved under the L2 treatment, and the OD value was 3.89 times that of the CK treatment. There were no significant differences in the utilization of the other fertilizer treatments. The utilization of phenolic compounds was highest under the Non-R treatment and lowest under the CK treatment, while the utilization of amines from the rhizospheric soil under fertilizer treatments (except L3 and L4) was higher than that observed in other unfertilized treatments. There was a similar pattern for the utilization of amino acids and polymers, where the highest utilization occurred under the L1 and L2 treatments and there were no significant differences among the other fertilizer treatments.
Figure 3. Changes in the AWCD of 31 carbon sources utilized in chrysanthemum rhizospheric soiltreated with the following: Non-R: non-rhizosphere soil; CK: control; NPK: chemical fertilizer treatment;L1: shrimp extracts; L2: plant decomposition; L3: vermicompost; L4: seaweed extracts; and L5:fish extracts.
As demonstrated by the PCA (Figure 4), 59.1% of the total variance was explained, with thefirst principal component explaining 43.3% of the variance. The microbial community primarilyclustered into six distinct groups: the CK, L1, L3/L4, L2/L5, NPK, and Non-R, and, as revealed bythe PCA analysis, the liquid organic fertilizer treatments, could significantly influence the bacteria’scarbon source utilization in the rhizospheric soil. The NPK treatment was separated from the liquidorganic fertilizer treatments on the PC1 axis, and the CK treatment could be separated from the liquidorganic fertilizer treatments on the PC2 axis. The metabolic activities in the rhizospheric soil underdifferent fertilizers indicated that the microbial community was capable of growing by ingestingdiverse types of carbon sources under different conditions. For example, the main carbon substratesutilized under the CK treatment was 2-hydroxybenzoic acid, whereas under the NPK treatment itwas 4-hydroxybenzoic acid. Under the L5 treatment D-mannitol and N-acetyl-D-glucosamine werethe main carbon sources. Moreover, significant differences were detected in the utilization of thesix main carbon sources (carbohydrates, carboxylic acid, phenolic compounds, amino acid, polymer,and amines) (Figure 5). Carbohydrates and carboxylic acid were the major carbon sources for differenttreatments. The highest utilization of carbohydrates was achieved under the L1 treatment, and theoptical density (OD) value was 2.29 times that of the CK treatment. This was followed by L2, andthe lowest utilization values occurred under the CK and Non-R treatments. The highest utilizationof carboxylic acid was achieved under the L2 treatment, and the OD value was 3.89 times that of theCK treatment. There were no significant differences in the utilization of the other fertilizer treatments.The utilization of phenolic compounds was highest under the Non-R treatment and lowest under theCK treatment, while the utilization of amines from the rhizospheric soil under fertilizer treatments(except L3 and L4) was higher than that observed in other unfertilized treatments. There was a similarpattern for the utilization of amino acids and polymers, where the highest utilization occurred underthe L1 and L2 treatments and there were no significant differences among the other fertilizer treatments.

Sustainability 2017, 9, 841 9 of 16Sustainability 2017, 9, 841 9 of 16
Figure 4. PCA of diverse uses of carbon sources after the 96-h incubation of the chrysanthemum non-rhizospheric (Non-R) soil and rhizospheric soil treated with CK: control; NPK: chemical fertilizer treatment; L1: shrimp extracts; L2: plant decomposition; L3: vermicompost; L4: seaweed extracts; and L5: fish extracts. Carbon substrates of the BiologTM Plate include: A2: β-methyl-D-glucoside; A3: D-galactonic acid g-lactone; A4: L-arginine; B1: pyruvic acid methylester; B2: D-xylose; B3: galacturonic acid; B4: L-asparagine; C1: Tween 40; C2: i-erytritol; C3: 2-hydroxybenzoic acid; C4: L-serine; D1: Tween 80; D2: D-mannitol; D3: 4-hydroxybenzoic acid; D4: L-phenylalanine; E1: α-cyclodextrine; E2: N-acetyl-D-glucosamine; E3: γ-hydroxybutiric acid; E4: L-threonine; F1: glycogen; F2: D-glucosaminic acid; F3: itaconic acid; F4: glycyl-L-glutamic acid; G1: D-cellobiose; G2: glucose-1-phosphate; G3: α-ketobutiric acid; G4: phenylethylamine;H1: α-lactose; H2: D,L-α-glycerol phosphate; H3: D-malic acid; and H4: putrescine.
Figure 4. PCA of diverse uses of carbon sources after the 96-h incubation of the chrysanthemumnon-rhizospheric (Non-R) soil and rhizospheric soil treated with CK: control; NPK: chemical fertilizertreatment; L1: shrimp extracts; L2: plant decomposition; L3: vermicompost; L4: seaweed extracts;and L5: fish extracts. Carbon substrates of the BiologTM Plate include: A2: β-methyl-D-glucoside; A3:D-galactonic acid g-lactone; A4: L-arginine; B1: pyruvic acid methylester; B2: D-xylose; B3: galacturonicacid; B4: L-asparagine; C1: Tween 40; C2: i-erytritol; C3: 2-hydroxybenzoic acid; C4: L-serine; D1:Tween 80; D2: D-mannitol; D3: 4-hydroxybenzoic acid; D4: L-phenylalanine; E1: α-cyclodextrine; E2:N-acetyl-D-glucosamine; E3: γ-hydroxybutiric acid; E4: L-threonine; F1: glycogen; F2: D-glucosaminicacid; F3: itaconic acid; F4: glycyl-L-glutamic acid; G1: D-cellobiose; G2: glucose-1-phosphate; G3:α-ketobutiric acid; G4: phenylethylamine;H1: α-lactose; H2: D,L-α-glycerol phosphate; H3: D-malicacid; and H4: putrescine.
Sustainability 2017, 9, 841 9 of 16
Figure 4. PCA of diverse uses of carbon sources after the 96-h incubation of the chrysanthemum non-rhizospheric (Non-R) soil and rhizospheric soil treated with CK: control; NPK: chemical fertilizer treatment; L1: shrimp extracts; L2: plant decomposition; L3: vermicompost; L4: seaweed extracts; and L5: fish extracts. Carbon substrates of the BiologTM Plate include: A2: β-methyl-D-glucoside; A3: D-galactonic acid g-lactone; A4: L-arginine; B1: pyruvic acid methylester; B2: D-xylose; B3: galacturonic acid; B4: L-asparagine; C1: Tween 40; C2: i-erytritol; C3: 2-hydroxybenzoic acid; C4: L-serine; D1: Tween 80; D2: D-mannitol; D3: 4-hydroxybenzoic acid; D4: L-phenylalanine; E1: α-cyclodextrine; E2: N-acetyl-D-glucosamine; E3: γ-hydroxybutiric acid; E4: L-threonine; F1: glycogen; F2: D-glucosaminic acid; F3: itaconic acid; F4: glycyl-L-glutamic acid; G1: D-cellobiose; G2: glucose-1-phosphate; G3: α-ketobutiric acid; G4: phenylethylamine;H1: α-lactose; H2: D,L-α-glycerol phosphate; H3: D-malic acid; and H4: putrescine.
Figure 5. Cont.
Sustainability 2017, 9, 841 10 of 16Sustainability 2017, 9, 841 10 of 16
Figure 5. The OD values of diverse carbon substrates after the incubation of chrysanthemum rhizospheric soil treated with CK: control; NPK: chemical fertilizer treatment; L1: shrimp extracts; L2: plant decomposition; L3: vermicompost; L4: seaweed extracts; and L5: fish extracts. Non-R: non-rhizosphere soil. The main carbon sources were as follows: (A) carbohydrate; (B) carboxylic acid; (C) phenolic compounds; (D) amino acid; (E) polymer; and (F) amine. Different letters indicate significant differences among treatments as determined by Duncan’s multiple range test at the p < 0.05 level.
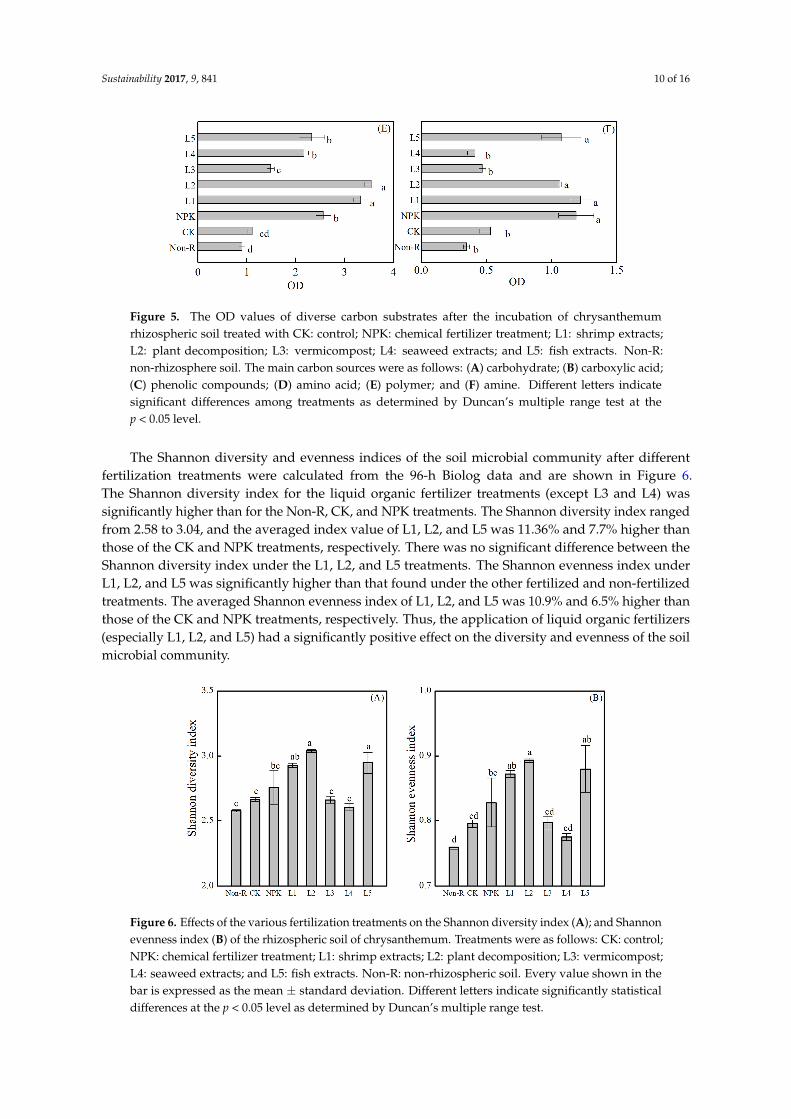
The Shannon diversity and evenness indices of the soil microbial community after different fertilization treatments were calculated from the 96-h Biolog data and are shown in Figure 6. The Shannon diversity index for the liquid organic fertilizer treatments (except L3 and L4) was significantly higher than for the Non-R, CK, and NPK treatments. The Shannon diversity index ranged from 2.58 to 3.04, and the averaged index value of L1, L2, and L5 was 11.36% and 7.7% higher than those of the CK and NPK treatments, respectively. There was no significant difference between the Shannon diversity index under the L1, L2, and L5 treatments. The Shannon evenness index under L1, L2, and L5 was significantly higher than that found under the other fertilized and non-fertilized treatments. The averaged Shannon evenness index of L1, L2, and L5 was 10.9% and 6.5% higher than those of the CK and NPK treatments, respectively. Thus, the application of liquid organic fertilizers (especially L1, L2, and L5) had a significantly positive effect on the diversity and evenness of the soil microbial community.
Figure 6. Effects of the various fertilization treatments on the Shannon diversity index (A); and Shannon evenness index (B) of the rhizospheric soil of chrysanthemum. Treatments were as follows: CK: control; NPK: chemical fertilizer treatment; L1: shrimp extracts; L2: plant decomposition; L3: vermicompost; L4: seaweed extracts; and L5: fish extracts. Non-R: non-rhizospheric soil. Every value shown in the bar is expressed as the mean ± standard deviation. Different letters indicate significantly statistical differences at the p < 0.05 level as determined by Duncan’s multiple range test.
Figure 5. The OD values of diverse carbon substrates after the incubation of chrysanthemumrhizospheric soil treated with CK: control; NPK: chemical fertilizer treatment; L1: shrimp extracts;L2: plant decomposition; L3: vermicompost; L4: seaweed extracts; and L5: fish extracts. Non-R:non-rhizosphere soil. The main carbon sources were as follows: (A) carbohydrate; (B) carboxylic acid;(C) phenolic compounds; (D) amino acid; (E) polymer; and (F) amine. Different letters indicatesignificant differences among treatments as determined by Duncan’s multiple range test at thep < 0.05 level.
The Shannon diversity and evenness indices of the soil microbial community after differentfertilization treatments were calculated from the 96-h Biolog data and are shown in Figure 6.The Shannon diversity index for the liquid organic fertilizer treatments (except L3 and L4) wassignificantly higher than for the Non-R, CK, and NPK treatments. The Shannon diversity index rangedfrom 2.58 to 3.04, and the averaged index value of L1, L2, and L5 was 11.36% and 7.7% higher thanthose of the CK and NPK treatments, respectively. There was no significant difference between theShannon diversity index under the L1, L2, and L5 treatments. The Shannon evenness index underL1, L2, and L5 was significantly higher than that found under the other fertilized and non-fertilizedtreatments. The averaged Shannon evenness index of L1, L2, and L5 was 10.9% and 6.5% higher thanthose of the CK and NPK treatments, respectively. Thus, the application of liquid organic fertilizers(especially L1, L2, and L5) had a significantly positive effect on the diversity and evenness of the soilmicrobial community.
Sustainability 2017, 9, 841 10 of 16
Figure 5. The OD values of diverse carbon substrates after the incubation of chrysanthemum rhizospheric soil treated with CK: control; NPK: chemical fertilizer treatment; L1: shrimp extracts; L2: plant decomposition; L3: vermicompost; L4: seaweed extracts; and L5: fish extracts. Non-R: non-rhizosphere soil. The main carbon sources were as follows: (A) carbohydrate; (B) carboxylic acid; (C) phenolic compounds; (D) amino acid; (E) polymer; and (F) amine. Different letters indicate significant differences among treatments as determined by Duncan’s multiple range test at the p < 0.05 level.
The Shannon diversity and evenness indices of the soil microbial community after different fertilization treatments were calculated from the 96-h Biolog data and are shown in Figure 6. The Shannon diversity index for the liquid organic fertilizer treatments (except L3 and L4) was significantly higher than for the Non-R, CK, and NPK treatments. The Shannon diversity index ranged from 2.58 to 3.04, and the averaged index value of L1, L2, and L5 was 11.36% and 7.7% higher than those of the CK and NPK treatments, respectively. There was no significant difference between the Shannon diversity index under the L1, L2, and L5 treatments. The Shannon evenness index under L1, L2, and L5 was significantly higher than that found under the other fertilized and non-fertilized treatments. The averaged Shannon evenness index of L1, L2, and L5 was 10.9% and 6.5% higher than those of the CK and NPK treatments, respectively. Thus, the application of liquid organic fertilizers (especially L1, L2, and L5) had a significantly positive effect on the diversity and evenness of the soil microbial community.
Figure 6. Effects of the various fertilization treatments on the Shannon diversity index (A); and Shannon evenness index (B) of the rhizospheric soil of chrysanthemum. Treatments were as follows: CK: control; NPK: chemical fertilizer treatment; L1: shrimp extracts; L2: plant decomposition; L3: vermicompost; L4: seaweed extracts; and L5: fish extracts. Non-R: non-rhizospheric soil. Every value shown in the bar is expressed as the mean ± standard deviation. Different letters indicate significantly statistical differences at the p < 0.05 level as determined by Duncan’s multiple range test.
Figure 6. Effects of the various fertilization treatments on the Shannon diversity index (A); and Shannonevenness index (B) of the rhizospheric soil of chrysanthemum. Treatments were as follows: CK: control;NPK: chemical fertilizer treatment; L1: shrimp extracts; L2: plant decomposition; L3: vermicompost;L4: seaweed extracts; and L5: fish extracts. Non-R: non-rhizospheric soil. Every value shown in thebar is expressed as the mean ± standard deviation. Different letters indicate significantly statisticaldifferences at the p < 0.05 level as determined by Duncan’s multiple range test.

Sustainability 2017, 9, 841 11 of 16
4. Discussion
4.1. Effects of Liquid Organic Fertilizers on the Growth of Chrysanthemum
The root systems of plants perform important roles in plant growth [42]. Here, the variousliquid organic fertilizer treatments significantly promoted root growth by 76.2–179.6% and 10.2–77.8%compared with the CK and NPK treatments, respectively (Figure 1). The improved root growthof chrysanthemum could be due to the liquid organic fertilizers’ abilities to supply soluble organicnutrients and biostimulants more quickly to the plant, which supported its growth [43]. Among thefive liquid organic fertilizers, plants treated with L1 achieved greater root dry weights, root totallengths, root surface areas, root volumes, root tips, and thicker root lengths than with the other organicfertilizer treatments by 35.4%, 31.6%, 36.3%, 39.4%, 57.5%, and 34.5%, respectively (Figure 1), followedby the L2 and then the L4 treatments. The L3 and L5 treatments only slightly increased the root growthof chrysanthemum. The shoot and leaf growth of chrysanthemum showed the same trend, and theliquid organic fertilizer treatments significantly promoted the aboveground growth by 30.2–56.5%and 10.7–33.3% compared with the CK and NPK treatments, respectively (Figure 2). These resultsare consistent with those of Martínez-Alcántara et al., in which either an animal or plant-based liquidorganic fertilizer produced a higher total biomass of citrus trees than mineral fertilizers because of themore profuse development of new organs under the organic treatments [26]. Additionally, the shootdiameter, SPAD value and aboveground biomass of chrysanthemum significantly increased with theapplication of L1 (Figure 2), suggesting that the L1 had a positive effect on seedling growth, leafchlorophyll concentrations, photosynthetic activities, and nutrient uptake efficiency [44]. In addition,the L2 treatment had a positive effect on shoot height, which may be due to the modified availability ofresources [45], whereas the application of L5 significantly enhanced the leaf growth of chrysanthemum,which contributed toward an advanced photosynthetic efficiency [46]. Thus, compared with NPK,the addition of L1 significantly improved the root and plant growth of chrysanthemum under theexperimental conditions. The L2 treatment had the next greatest effect, followed by the L4 and L5treatments. The addition of L3 resulted in only a slight increase in seedling growth.
L1 was derived from shrimp extract, which is the most abundant natural resource on earth, with anestimated chitin yield of 1010–1011 tons per year [22,47]. Additionally, seafood processing wastesdo not contain known toxic or carcinogenic materials like liquid wastes from other industries [48].Therefore, the shrimp extract is a low-cost and environmentally-friendly resource. The chitosancompounds deacetylated from chitin that are extracted from shrimp are effective in promoting seedgermination, and root and shoot growth, and can induce resistance to abiotic stresses, as well asacting as biopesticides [14,22,49–51]. Therefore, the positive effect of L1 may be partly due to thepresence of chitosan. In the conventional monoculture production system, chrysanthemum is generallyaffected by Fusarium wilt and other diseases [6]. The addition of L1 from this experiment may promoteroot growth and ecological adaptability and reduce the occurrence of plant diseases and insect pests,thereby improving chrysanthemum growth, and additional experiments are required to verify thehypothesis [52,53].
4.2. Effects of Liquid Organic Fertilizers on Chrysanthemum Rhizospheric Soil’s Characteristics
Organic amendments are frequently used to improve the soil structure, microbial diversity,and plant nutrient status [12,54]. In our study, the applications of various liquid organic fertilizerssignificantly improved the nutrient level (mineral N, available P, and available K contents) by 2.9–28.3%and 8.1–134.2% compared with the CK and NPK treatments, respectively. Increases in the availablenutrient content of rhizospheric soil after the application of liquid organic fertilizers have beenattributed to the improved diversity of the microbial community, which enhances the nutrient cycle inthe soil, increasing the soil nutrients available for plant growth [23,55]. The addition of L1 significantlystimulated the N mineralization process (Table 2), which was different from the findings of Gutseret al. in which the input of organic fertilizers on arable land significantly reduced the mineral-N

Sustainability 2017, 9, 841 12 of 16
content and increased the stability of the organic matter [56]. This was mainly because the organicfertilizer form used by Gutser et al. was compost, whereas the liquid organic fertilizer used in ourexperiment contained a large amount of soluble nutrients and tended to be more quickly available toplants compared with the traditional substrate-incorporated fertilizers [57]. In our experiment, the L1treatment produced the highest EC values, which were 15.8–143.8% higher than those of the othertreatments (Table 2). The increase in the soil EC value could be correlated with the mineralization oforganic matter after the application of liquid organic fertilizers [58], which was in accordance with thechange in the mineral N content (Table 2).
The carbon substrate utilization presented by the Biolog-Eco plates was sensitive enough to detectshort-term changes in the soil environment, and the appropriate fertilizer regimes could increase thesoil’s functional microbial diversity [38,59]. In our study, the application of liquid organic fertilizersimproved the AWCD of rhizospheric soil by 35.4–146.2% and −13.5–57.3% compared with the CK andNPK treatments, respectively (Figure 3). The addition of L1 exhibited the highest carbon substrateutilization, and the AWCD of L1 at the end of the incubation was 1.4–81.9% higher than those of theother liquid organic fertilizer treatments. In agreement with our results, Gomez et al. found thatorganic soil amendments significantly stimulated the carbon substrate utilization [60], and this mainlydepended on the availability of soil carbon. The PCA showed that the fertilizer regimes significantlyinfluenced the rhizospheric soil’s functional diversity (Figure 4). Liquid organic fertilizers may inducechanges in soil properties which, in turn, influence the soil’s microbial functional diversity, resulting indifferences in the soil carbon substrate utilization and plant growth [38,61]. Under the liquid organicfertilizer treatments, the utilization of carbohydrate, carboxylic acid, phenolic compounds, aminoacid, and polymer was much greater than in the CK and NPK treatments, and an enhancement ofthese carbon sources was observed by 59.4–191.7% and 0.2–56.0% compared with the CK and NPKtreatments, respectively (Figure 5). This was in accordance with earlier work of Romaniuk et al. inwhich microbial functional diversity could indicate the influence of fertilizer and management practicesin organic and conventional horticulture systems [62]. The utilization of phenolic compounds showeda different tendency in our experiment and it was highest under the Non-R treatment and lowest forCK treatment. This phenomenon was possible partly for the different pH values among treatmentsand the pH value of the Non-R treatment was the lowest (Table 2). Additionally, phenolic compoundswere the main autotoxicity substance in rhizosphere soil of many plants and it would influence thegrowth of plants; thus, the utilization of phenolic compounds was higher in Non-R treatment than therhizosphere soil [63,64]. The application of L1 significantly improved the utilization of the six maincarbon sources (carbohydrate, carboxylic acid, phenolic compounds, amino acid, polymer, and amine)by 76.6, 40.1, 22.4, 81.6, 29.7, and 2.9% than the NPK treatment, respectively. The Shannon indexanalysis also showed that the application of liquid organic fertilizer treatments (especially L1, L2,and L5) significantly improved the diversity and evenness of the soil bacterial community (Figure 6),which would be beneficial in resisting stress [61,65]. Thus, the application of liquid organic fertilizers,especially L1, significantly increased the microbial population’s diversity in the rhizosphere.
5. Conclusions
Fertilizer management is of great importance in chrysanthemum production. In this study, fivesources of liquid organic fertilizer were applied to promote chrysanthemum growth at the earlystage. The application of liquid organic fertilizers significantly promoted the root architecture andplant growth of chrysanthemum compared with the CK and inorganic fertilizer treatment over theshort term, even with a limited amount of mineral nutrient input. Among the five liquid organicfertilizers treatments applied in our experiment, the L1 liquid fertilizer proved to be effective in bothroot development and aboveground growth promotion, especially the root tips, SPAD value of leaves,and the aboveground biomass. The addition of L1 liquid organic fertilizer significantly stimulatedthe soil’s microbial activity and functional diversity through the enhancement the N mineralizationprocess at the rhizospheric level. Treating with L1 liquid organic fertilizer indicated its potential as

Sustainability 2017, 9, 841 13 of 16
an effective fertilizer regime in the chrysanthemum production system. Moreover, the successfulapplication of liquid organic fertilizers in our study suggested a rational way to reuse agriculturalwastes and was effective in sustaining plant growth and the health of the soil system. In the future,more attention should be paid to quantifying the optimal fertilizer rate of the shrimp extract liquidorganic fertilizer in diverse growth periods of chrysanthemum production, and further analysis is alsorequired to clarify the key microbiologic population in the process.
Acknowledgments: This work was funding from the National Natural Science Foundation of China (31672236)and enterprise academician workstation in Amway (China) Botanical Research and Development Center of theherbal chrysanthemum planting project (BC20160005Z).
Author Contributions: Ju Min, Weiming Shi, and Gangqiang Dong conceived and designed the experiments;Rongting Ji performed the experiments; Rongting Ji analyzed the data; Gangqiang Dong contributedreagents/materials/analysis tools; and Rongting Ji and Ju Min wrote the paper.
Conflicts of Interest: The authors declare no conflict of interest.
Abbreviations
NPK chemical fertilizerCK no fertilizer controlEC electric conductivitySPAD Soil and Plant Analyzer DevelopmentAWCD Average Well Color Development
References
1. Tsukiboshi, T.; Chikuo, Y.; Ito, Y.; Matsushita, Y.; Kageyama, K. Root and stem rot of chrysanthemum causedby five pythium species in Japan. J. Gen. Plant Pathol. 2007, 73, 293–296. [CrossRef]
2. Zhao, H.E.; Liu, Z.H.; Hu, X.; Yin, J.L.; Li, W.; Rao, G.Y.; Zhang, X.H.; Huang, C.L.; Anderson, N.;Zhang, Q.X.; et al. Chrysanthemum genetic resources and related genera of chrysanthemum collected inChina. Genet. Resour. Crop Evol. 2009, 56, 937–946. [CrossRef]
3. Pecchia, S.; Franceschini, A.; Santori, A.; Vannacci, G.; Myrta, A. Efficacy of dimethyl disulfide (dmds) forthe control of chrysanthemum verticillium wilt in Italy. Crop Prot. 2017, 93, 28–32. [CrossRef]
4. MacDonald, W.N.; Blom, T.J.; Tsujita, M.J.; Shelp, B.J. Review: Improving nitrogen use efficiency of pottedchrysanthemum: Strategies and benefits. Can. J. Plant Sci. 2013, 93, 1009–1016. [CrossRef]
5. Wandl, M.T.; Haberl, H. Greenhouse gas emissions of small scale ornamental plant production inAustria—A case study. J. Clean. Prod. 2017, 141, 1123–1133. [CrossRef]
6. Zhao, S.; Chen, X.; Deng, S.P.; Dong, X.N.; Song, A.P.; Yao, J.J.; Fang, W.M.; Chen, F.D. The effects offungicide, soil fumigant, bio-organic fertilizer and their combined application on chrysanthemum fusariumwilt controlling, soil enzyme activities and microbial properties. Molecules 2016, 21, 526. [CrossRef] [PubMed]
7. Rostami, M.; Zamani, A.; Goldasteh, S.; Shoushtari, R.; Kheradmand, K. Influence of nitrogen fertilization onbiology of Aphis gossypii (hemiptera: Aphididae) reared on Chrysanthemum lindicum (asteraceae). J. PlantProt. Res. 2012, 52, 118–121. [CrossRef]
8. Han, J.P.; Luo, Y.H.; Yang, L.P.; Liu, X.M.; Wu, L.S.; Xu, J.M. Acidification and salinization of soils withdifferent initial pH under greenhouse vegetable cultivation. J. Soils Sediments 2014, 14, 1683–1692. [CrossRef]
9. Min, J.; Lu, K.P.; Sun, H.J.; Xia, L.L.; Zhang, H.L.; Shi, W.M. Global warming potential in an intensivevegetable cropping system as affected by crop rotation and nitrogen rate. Clean Soil Air Water 2016, 44,766–774. [CrossRef]
10. Macz, O.; Paparozzi, E.T.; Stroup, W.W.; Leonard, R.; Nell, T.A. Effect of nitrogen and sulfur applicationson pot chrysanthemum production and postharvest performance. II. Plant growth responses. J. Plant Nutr.2001, 24, 131–146. [CrossRef]
11. Liu, D.H.; Zhu, D.W.; Guo, L.P.; Liu, W.; Zuo, Z.T.; Jin, H.; Yang, Y. Effects of nitrogen fertilization ongrowth,yield and quality of Chrysanthemum morifolium. Plant Nutr. Fertil. Sci. 2012, 18, 188–195.
12. Sun, J.; Zhang, Q.; Zhou, J.; Wei, Q.P. Pyrosequencing technology reveals the impact of different manuredoses on the bacterial community in apple rhizosphere soil. Appl. Soil Ecol. 2014, 78, 28–36. [CrossRef]

Sustainability 2017, 9, 841 14 of 16
13. Atiyeh, R.M.; Edwards, C.A.; Subler, S.; Metzger, J.D. Pig manure vermicompost as a componentof a horticultural bedding plant medium: Effects on physicochemical properties and plant growth.Bioresour. Technol. 2001, 78, 11–20. [CrossRef]
14. Pichyangkura, R.; Chadchawan, S. Biostimulant activity of chitosan in horticulture. Sci. Hortic. 2015, 196,49–65. [CrossRef]
15. Hou, J.Q.; Li, M.X.; Mao, X.H.; Hao, Y.; Ding, J.; Liu, D.M.; Xi, B.D.; Liu, H.L. Response of microbialcommunity of organic-matter-impoverished arable soil to long-term application of soil conditioner derivedfrom dynamic rapid fermentation of food waste. PLoS ONE 2017, 12, e0175715. [CrossRef] [PubMed]
16. Dordas, C.A.; Lithourgidis, A.S.; Matsi, T.; Barbayiannis, N. Application of liquid cattle manure and inorganicfertilizers affect dry matter, nitrogen accumulation, and partitioning in maize. Nutr. Cycl. Agroecosyst. 2007,80, 283–296. [CrossRef]
17. Toonsiri, P.; Del Grosso, S.J.; Sukor, A.; Davis, J.G. Greenhouse gas emissions from solid and liquid organicfertilizers applied to lettuce. J. Environ. Qual. 2016, 45, 1812–1821. [CrossRef] [PubMed]
18. Ceretta, C.A.; Girotto, E.; Lourenzi, C.R.; Trentin, G.; Vieira, R.C.B.; Brunetto, G. Nutrient transfer by runoffunder no tillage in a soil treated with successive applications of pig slurry. Agric. Ecosyst. Environ. 2010, 139,689–699. [CrossRef]
19. Canellas, L.P.; Olivares, F.L.; Aguiar, N.O.; Jones, D.L.; Nebbioso, A.; Mazzei, P.; Piccolo, A. Humic and fulvicacids as biostimulants in horticulture. Sci. Hortic. 2015, 196, 15–27. [CrossRef]
20. Du Jardin, P. Plant biostimulants: Definition, concept, main categories and regulation. Sci. Hortic. 2015, 196,3–14. [CrossRef]
21. Sharp, R.G. A review of the applications of chitin and its derivatives in agriculture to modify plant-microbialinteractions and improve crop yields. Agronomy 2013, 3, 757–793. [CrossRef]
22. Tang, H.; Zhang, L.Y.; Hu, L.Y.; Zhang, L.N. Application of chitin hydrogels for seed germination, seedlinggrowth of rapeseed. J. Plant Growth Regul. 2013, 33, 195–201. [CrossRef]
23. Zhu, Z.; Zhang, F.G.; Wang, C.; Ran, W.; Shen, Q.R. Treating fermentative residues as liquid fertilizer and itsefficacy on the tomato growth. Sci. Hortic. 2013, 164, 492–498. [CrossRef]
24. Canfora, L.; Malusa, E.; Salvati, L.; Renzi, G.; Petrarulo, M.; Benedetti, A. Short-term impact of two liquidorganic fertilizers on solanum lycopersicum l. Rhizosphere eubacteria and archaea diversity. Appl. Soil Ecol.2015, 88, 50–59. [CrossRef]
25. Chaudhry, V.; Rehman, A.; Mishra, A.; Chauhan, P.S.; Nautiyal, C.S. Changes in bacterial communitystructure of agricultural land due to long-term organic and chemical amendments. Microb. Ecol. 2012, 64,450–460. [CrossRef] [PubMed]
26. Martinez-Alcantara, B.; Martinez-Cuenca, M.R.; Bermejo, A.; Legaz, F.; Quinones, A. Liquid organic fertilizersfor sustainable agriculture: Nutrient uptake of organic versus mineral fertilizers in citrus trees. PLoS ONE2016, 11, e0161619. [CrossRef] [PubMed]
27. Zobel, R.W. Fine roots—Functional definition expanded to crop species? New Phytol. 2016, 212, 310–312.[CrossRef] [PubMed]
28. Pregitzer, K.S. Fine roots of trees—A new perspective. New Phytol. 2002, 154, 267–270. [CrossRef]29. Hodge, A.; Berta, G.; Doussan, C.; Merchan, F.; Crespi, M. Plant root growth, architecture and function.
Plant Soil 2009, 321, 153–187. [CrossRef]30. Saleem, M.; Law, A.D.; Moe, L.A. Nicotiana roots recruit rare rhizosphere taxa as major root-inhabiting
microbes. Microb. Ecol. 2015, 71, 469–472. [CrossRef] [PubMed]31. Xu, L.Z.; Niu, J.F.; Li, C.J.; Zhang, F.S. Growth, nitrogen uptake and flow in maize plants affected by root
growth restriction. J. Integr. Plant Biol. 2009, 51, 689–697. [CrossRef] [PubMed]32. Ridl, J.; Kolar, M.; Strejcek, M.; Strnad, H.; Stursa, P.; Paces, J.; Macek, T.; Uhlik, O. Plants rather than mineral
fertilization shape microbial community structure and functional potential in legacy contaminated soil.Front. Microbiol. 2016, 7. [CrossRef] [PubMed]
33. Loranger-Merciris, G.; Barthes, L.; Gastine, A.; Leadley, P. Rapid effects of plant species diversity and identityon soil microbial communities in experimental grassland ecosystems. Soil Biol. Biochem. 2006, 38, 2336–2343.[CrossRef]
34. Saleem, M.; Moe, L.A. Multitrophic microbial interactions for eco and agro-biotechnological processes:Theory and practice. Trends Biotechnol. 2014, 32, 529–537. [CrossRef] [PubMed]

Sustainability 2017, 9, 841 15 of 16
35. Suzuki, C.; Kunito, T.; Aono, T.; Liu, C.T.; Oyaizu, H. Microbial indices of soil fertility. J. Appl. Microbiol.2005, 98, 1062–1074. [CrossRef] [PubMed]
36. Guo, P.P.; Zhu, L.S.; Wang, J.H.; Wang, J.; Liu, T. Effects of alkyl-imidazolium ionic liquid [omim]cl on thefunctional diversity of soil microbial communities. Environ. Sci. Pollut. Res. 2015, 22, 9059–9066. [CrossRef][PubMed]
37. Chen, L.J.; Feng, Q.; Wei, Y.P.; Li, C.S.; Zhao, Y.; Li, H.Y.; Zhang, B.G. Effects of saline water irrigation andfertilization regimes on soil microbial metabolic activity. J. Soils Sediments 2016, 17, 376–383. [CrossRef]
38. Yu, C.; Hu, X.M.; Deng, W.; Li, Y.; Xiong, C.; Ye, C.H.; Han, G.M.; Li, X. Changes in soil microbialcommunity structure and functional diversity in the rhizosphere surrounding mulberry subjected tolong-term fertilization. Appl. Soil Ecol. 2015, 86, 30–40. [CrossRef]
39. Arsenault, J.L.; Pouleur, S.; Messier, C.; Guay, R. WinrhizoTM, a root measuring system with a unique overlapcorrection method. HortScience 1995, 30, 906.
40. Min, J.; Zhao, X.; Shi, W.M.; Xing, G.X.; Zhu, Z.L. Nitrogen balance and loss in a greenhouse vegetablesystem in southeastern China. Pedosphere 2011, 21, 464–472. [CrossRef]
41. Shi, W.M.; Yao, J.; Yan, F. Vegetable cultivation under greenhouse conditions leads to rapid accumulationof nutrients, acidification and salinity of soils and groundwater contamination in south-eastern China.Nutr. Cycl. Agroecosyst. 2008, 83, 73–84. [CrossRef]
42. Li, X.X.; Zeng, R.S.; Liao, H. Improving crop nutrient efficiency through root architecture modifications.J. Integr. Plant Biol. 2016, 58, 193–202. [CrossRef] [PubMed]
43. Nelson, P.V.; Pitchay, D.S.; Niedziela, C.E.; Mingis, N.C. Efficacy of soybean-base liquid fertilizer forgreenhouse crops. J. Plant Nutr. 2010, 33, 351–361. [CrossRef]
44. Uddling, J.; Gelang-Alfredsson, J.; Piikki, K.; Pleijel, H. Evaluating the relationship between leaf chlorophyllconcentration and spad-502 chlorophyll meter readings. Photosynth. Res. 2007, 91, 37–46. [CrossRef][PubMed]
45. Collet, C.; Colin, F.; Bernier, F. Height growth, shoot elongation and branch development of young quercuspetraea grown under different levels of resource availability. Annal. Sci. For. 1997, 54, 65–81. [CrossRef]
46. Lee, J.H.; Heuvelink, E. Simulation of leaf area development based on dry matter partitioning and specificleaf area for cut chrysanthemum. Ann. Bot. 2003, 91, 319–327. [CrossRef] [PubMed]
47. Gallert, C.; Winter, J. Solid and liquid residues as raw materials for biotechnology. Naturwissenschaften 2002,89, 483–496. [CrossRef] [PubMed]
48. Pierantozzi, P.; Zampini, C.; Torres, M.; Isla, M.I.; Verdenelli, R.A.; Meriles, J.M.; Maestri, D. Physico-chemicaland toxicological assessment of liquid wastes from olive processing-related industries. J. Sci. Food Agric.2012, 92, 216–223. [CrossRef] [PubMed]
49. Fitza, K.N.E.; Payn, K.G.; Steenkamp, E.T.; Myburg, A.A.; Naidoo, S. Chitosan application improvesresistance to fusarium circinatum in pinus patula. S. Afr. J. Bot. 2013, 85, 70–78. [CrossRef]
50. Katiyar, D.; Hemantaranjan, A.; Singh, B. Chitosan as a promising natural compound to enhance potentialphysiological responses in plant: A review. Indian J. Plant Physiol. 2015, 20, 1–9. [CrossRef]
51. Winkler, A.J.; Dominguez-Nuñez, J.A.; Aranaz, I.; Poza-Carrión, C.; Ramonell, K.; Somerville, S.;Berrocal-Lobo, M. Short-chain chitin oligomers: Promoters of plant growth. Mar. Drugs 2017, 15, 40.[CrossRef] [PubMed]
52. Hallmann, J.; Rodriguez-Kabana, R.; Kloepper, J.W. Chitin-mediated changes in bacterial communities ofthe soil, rhizosphere and within roots of cotton in relation to nematode control. Soil Biol. Biochem. 1999, 31,551–560. [CrossRef]
53. Debode, J.; De Tender, C.; Soltaninejad, S.; Van Malderghem, C.; Haegeman, A.; Van der Linden, I.; Cottyn, B.;Heyndrickx, M.; Maes, M. Chitin mixed in potting soil alters lettuce growth, the survival of zoonotic bacteriaon the leaves and associated rhizosphere microbiology. Front. Microbiol. 2016, 7. [CrossRef] [PubMed]
54. Ling, N.; Zhu, C.; Xue, C.; Chen, H.; Duan, Y.H.; Peng, C.; Guo, S.W.; Shen, Q.R. Insight into how organicamendments can shape the soil microbiome in long-term field experiments as revealed by network analysis.Soil Biol. Biochem. 2016, 99, 137–149. [CrossRef]
55. Lee, J.J.; Park, R.D.; Kim, Y.W.; Shim, J.H.; Chae, D.H.; Rim, Y.S.; Sohn, B.K.; Kim, T.H.; Kim, K.Y. Effect offood waste compost on microbial population, soil enzyme activity and lettuce growth. Bioresour. Technol.2004, 93, 21–28. [CrossRef] [PubMed]

Sustainability 2017, 9, 841 16 of 16
56. Gutser, R.; Ebertseder, T.; Weber, A.; Schraml, M.; Schmidhalter, U. Short-term and residual availability ofnitrogen after long-term application of organic fertilizers on arable land. J. Plant Nutr. Soil Sci. 2005, 168,439–446. [CrossRef]
57. Burnett, S.E.; Mattson, N.S.; Williams, K.A. Substrates and fertilizers for organic container production ofherbs, vegetables, and herbaceous ornamental plants grown in greenhouses in the united states. Sci. Hortic.2016, 208, 111–119. [CrossRef]
58. Gulser, C.; Demir, Z.; Ic, S. Changes in some soil properties at different incubation periods after tobaccowaste application. J. Environ. Biol. 2010, 31, 671–674. [PubMed]
59. Fliessbach, A.; Mader, P. Carbon source utilization by microbial communities in soils under organic andconventional farming practice. In Microbial Communities—Functional versus Structural Approaches; Insam, H.,Rangger, A., Eds.; Springer: Berlin/Heidelberg, Germany, 1997; pp. 109–120.
60. Gomez, E.; Ferreras, L.; Toresani, S. Soil bacterial functional diversity as influenced by organic amendmentapplication. Bioresour. Technol. 2006, 97, 1484–1489. [CrossRef] [PubMed]
61. Saleem, M.; Pervaiz, Z.H.; Traw, M.B. Theories, mechanisms and patterns of microbiome species coexistencein an era of climate change. In Microbiome Community Ecology; Saleem, M., Ed.; Springer: New York, NY, USA,2015; pp. 125–152.
62. Romaniuk, R.; Giuffre, L.; Costantini, A.; Nannipieri, P. Assessment of soil microbial diversity measurementsas indicators of soil functioning in organic and conventional horticulture systems. Ecologic. Indic. 2011, 11,1345–1353. [CrossRef]
63. Dong, Y.; Dong, K.; Tang, L.; Zheng, Y.; Yang, Z.X.; Xiao, J.X.; Zhao, P.; Hu, G.B. Relationship betweenrhizosphere microbial community functional diversity and faba bean fusarium wilt occurrence in wheat andfaba bean intercropping system. Acta Ecol. Sin. 2013, 33, 7445–7454. [CrossRef]
64. Asaduzzaman, M.; Asao, T. Autotoxicity in beans and their allelochemicals. Sci. Hortic. 2012, 134, 26–31.[CrossRef]
65. Degens, B.P.; Schipper, L.A.; Sparling, G.P.; Duncan, L.C. Is the microbial community in a soil with reducedcatabolic diversity less resistant to stress or disturbance? Soil Biol. Biochem. 2001, 33, 1143–1153. [CrossRef]
© 2017 by the authors. Licensee MDPI, Basel, Switzerland. This article is an open accessarticle distributed under the terms and conditions of the Creative Commons Attribution(CC BY) license (http://creativecommons.org/licenses/by/4.0/).