Effects of Heterogeneity and Experimental Scale on the Biodegradation of Diesel
12
Biodegradation 14: 373–384, 2003. © 2003 Kluwer Academic Publishers. Printed in the Netherlands. 373 Effects of heterogeneity and experimental scale on the biodegradation of diesel Cynthia Davis 1,2 , Todd Cort 2,3 , Dongping Dai 2 , Tissa H. Illangasekare 2 & Junko Munakata- Marr 2,∗ 1 URS Corporation, 9801 Westheimer, Suite 500, Houston, TX 77042, USA; 2 Environmental Science and Engineer- ing Division, Colorado School of Mines, Golden, CO 80401, USA; 3 Cameron-Cole, LLC, 5777 Central Avenue, Suite 100, Boulder, CO 80301, USA ( ∗ author for corresponding: e-mail: [email protected]) Accepted 16 July 2003 Key words: biodegradation, diesel, heterogeneity, NAPL, scale Abstract Biodegradation of petroleum hydrocarbon contamination is a common method for remediating soils and ground- water. Due to complexities with field-scale studies, biodegradation rates are typically evaluated at the bench-scale in laboratory studies. However, important field conditions can be difficult to mimic in the laboratory. This study investigates three scaling factors that can impact laboratory biodegradation rates and that are frequently unac- counted for in typical laboratory experimental procedures. These factors are soil heterogeneity, morphology of petroleum hydrocarbon non-aqueous phase liquids (NAPLs) and soil moisture distribution. The effects of these factors on the biodegradation rate of diesel NAPL is tested under a variety of experimental procedures from well-mixed batch studies to four-foot static soil columns. The results indicate that a high degree of variability results from even small-scale heterogeneities. In addition, it appears that as the experimental scale increases, the measured biodegradation rates slow. The results indicate that diesel biodegradation rates derived from small-scale experiments are not necessarily representative of field-scale biodegradation rates. Introduction Soil and groundwater contamination resulting from the release of petroleum hydrocarbons has been recog- nized as one of the principal issues in environmental remediation. The potential health and ecosystem im- pacts associated with the presence of petroleum hydro- carbons in the subsurface continue to cause concern ( ˆ Sepiˆ c et al. 1996). Diesel fuel, which can be released to the environment during fueling, maintenance and storage, is among the most prevalent petroleum hy- drocarbons impacting the subsurface. Large volumes of spilled diesel fuel can migrate through unsaturated soil zones and pool on the groundwater table. These non-aqueous phase liquid (NAPL) pools can serve as long-term sources for groundwater contamination as the soluble constituents of the diesel slowly leach into and migrate with the groundwater. Due to the difficulty and high costs typically as- sociated with extracting residual diesel NAPL from the subsurface and the long timeframes required for traditional pump-and-treat strategies, in-situ biore- mediation (degradation of target contaminants by mi- croorganisms present in the subsurface) has become an increasingly common method for treating zones im- pacted by diesel NAPLs (Goudar & Strevett 1998). The biodegradation of diesel in the subsurface has been well documented under a variety of soil and geochemical conditions (Norris et al. 1994). Success- ful and cost-effective application of biodegradation is dependent on the accurate measurement of biode- gradation rates to predict timeframes and assess the effectiveness of bioremediation approaches. Typically, diesel and other petroleum hydrocar- bons are degraded most rapidly under aerobic con- ditions (Parker & Burgos 1999; Moller et al. 1996;
-
Upload
cynthia-davis -
Category
Documents
-
view
213 -
download
0
Transcript of Effects of Heterogeneity and Experimental Scale on the Biodegradation of Diesel

Biodegradation 14: 373–384, 2003.© 2003 Kluwer Academic Publishers. Printed in the Netherlands.
373
Effects of heterogeneity and experimental scale on the biodegradation ofdiesel
Cynthia Davis1,2, Todd Cort2,3, Dongping Dai2, Tissa H. Illangasekare2 & Junko Munakata-Marr2,∗1URS Corporation, 9801 Westheimer, Suite 500, Houston, TX 77042, USA; 2Environmental Science and Engineer-ing Division, Colorado School of Mines, Golden, CO 80401, USA; 3Cameron-Cole, LLC, 5777 Central Avenue,Suite 100, Boulder, CO 80301, USA (∗author for corresponding: e-mail: [email protected])
Accepted 16 July 2003
Key words: biodegradation, diesel, heterogeneity, NAPL, scale
Abstract
Biodegradation of petroleum hydrocarbon contamination is a common method for remediating soils and ground-water. Due to complexities with field-scale studies, biodegradation rates are typically evaluated at the bench-scalein laboratory studies. However, important field conditions can be difficult to mimic in the laboratory. This studyinvestigates three scaling factors that can impact laboratory biodegradation rates and that are frequently unac-counted for in typical laboratory experimental procedures. These factors are soil heterogeneity, morphology ofpetroleum hydrocarbon non-aqueous phase liquids (NAPLs) and soil moisture distribution. The effects of thesefactors on the biodegradation rate of diesel NAPL is tested under a variety of experimental procedures fromwell-mixed batch studies to four-foot static soil columns. The results indicate that a high degree of variabilityresults from even small-scale heterogeneities. In addition, it appears that as the experimental scale increases, themeasured biodegradation rates slow. The results indicate that diesel biodegradation rates derived from small-scaleexperiments are not necessarily representative of field-scale biodegradation rates.
Introduction
Soil and groundwater contamination resulting fromthe release of petroleum hydrocarbons has been recog-nized as one of the principal issues in environmentalremediation. The potential health and ecosystem im-pacts associated with the presence of petroleum hydro-carbons in the subsurface continue to cause concern(Sepic et al. 1996). Diesel fuel, which can be releasedto the environment during fueling, maintenance andstorage, is among the most prevalent petroleum hy-drocarbons impacting the subsurface. Large volumesof spilled diesel fuel can migrate through unsaturatedsoil zones and pool on the groundwater table. Thesenon-aqueous phase liquid (NAPL) pools can serve aslong-term sources for groundwater contamination asthe soluble constituents of the diesel slowly leach intoand migrate with the groundwater.
Due to the difficulty and high costs typically as-sociated with extracting residual diesel NAPL fromthe subsurface and the long timeframes required fortraditional pump-and-treat strategies, in-situ biore-mediation (degradation of target contaminants by mi-croorganisms present in the subsurface) has become anincreasingly common method for treating zones im-pacted by diesel NAPLs (Goudar & Strevett 1998).The biodegradation of diesel in the subsurface hasbeen well documented under a variety of soil andgeochemical conditions (Norris et al. 1994). Success-ful and cost-effective application of biodegradationis dependent on the accurate measurement of biode-gradation rates to predict timeframes and assess theeffectiveness of bioremediation approaches.
Typically, diesel and other petroleum hydrocar-bons are degraded most rapidly under aerobic con-ditions (Parker & Burgos 1999; Moller et al. 1996;

374
Stout & Lundergard 1998; Widrig & Manning 1995).However, accurate measurement of degradation ratesunder field conditions can be complicated by severalfactors. Three of the most significant of these factorsare the soil and microbial heterogeneity, NAPL entrap-ment morphology and soil moisture distribution. Soiland microbial heterogeneities can result in differentialtransport of electron acceptors and nutrients, forma-tion of micro-redox zones and complex distributionof the NAPL (Seagren et al. 1994; Rogers & Logan2000). Such heterogeneity may result in significantsmall-scale variation in biodegradation, as concludedin a recent review (Haack & Bekins 2000). This occursdue to the presence of zones of high relative permeab-ility through which these substances will preferentiallypass. Outside of these preferential pathways, zones oflow permeability are expected to allow little relativepassage and exchange of compounds.
Such localized zones of lower permeability are alsoexpected to influence NAPL morphology. NAPL mor-phology refers to the mode of entrapment of NAPLin the subsurface such as in pools or residual zones.At high saturation, NAPL typically forms pools offree phase NAPL, while at lower saturation, the NAPLforms residual blobs, ganglia and fingers that ‘smear’through the soil and remain in small pockets of lowerpermeability. The NAPL morphology can affect, bythree distinct mechanisms, the activity of degradingmicrobial communities and therefore the overall rateof degradation. The smaller surface area to volumeratio present in pools of NAPL compared to residualzones can decrease the mass flux of soluble constitu-ents from the non-aqueous phase to the water. Theresult is a decrease in the time-dependent availabil-ity of the substrate to nearby organisms (Ramaswami& Luthy 1997; Seagren et al. 1994). Second, thepresence of free phase can reduce the potential ad-hesion sites for microorganisms on the soil particlesand pore spaces, resulting in lower numbers of organ-isms in the potential reactive zone (Rogers & Logan2000). Finally, the presence of NAPL pools can cre-ate large pockets of immobile water (Rogers & Logan2000; Seagren et al. 1994) that result in decreased sub-strate delivery to the degrading organisms or decreasedbacterial transport rates around the NAPL pool.
The third principal factor influencing biodegrada-tion rate in the subsurface is the moisture distributionof the soil. Moisture is essential to active biodegrad-ation (Bossert & Bartha 1984). However, in fullysaturated systems, aerobic biodegradation rates can bereduced due to decreased access to oxygen (Bossert &
Bartha 1984; Leeson & Hinchee 1997). Moisture dis-tribution can also influence the accessibility of dieselsubstrate to the degrading microorganisms. Pools ofdiesel will tend to sit on top of the saturated zone dueto their lower density compared to water. Microor-ganisms within the saturated zone may therefore havemore limited access to the diesel constituents than mi-croorganisms within the capillary fringe just above thegroundwater table.
Due to the complexities of measuring biodegrad-ation rates resulting from these factors at the fieldscale, biodegradation rates are more typically meas-ured in laboratories at the bench scale (Møller et al.1996; Hinchee & Ong 1992; van Eyk & Vreeken1989; Hogg et al. 1992; Downey et al. 1995; Daviset al. 1998). These bench-scale studies are frequentlyconducted under more homogeneous soil, NAPL en-trapment and moisture conditions established throughconstant mixing. The rates measured at the benchscale are then commonly used to infer degradationrates that occur in the field. The ability to extrapolatefrom the bench scale to the field scale is dependenton determining the effect that each of the describedfactors has on biodegradation rates. The experimentsdescribed here were conducted to measure and de-scribe the relative impacts of heterogeneity, NAPLmorphology and soil moisture distribution on aerobicdiesel biodegradation rates at varying scales. Aerobicbiodegradation rates were measured by respirometryin both batch and column studies. All three factors(soil heterogeneity, NAPL morphology and soil mois-ture distribution) were hypothesized to independentlyand significantly impact biodegradation rates, withheterogeneity having the largest impact due to its ef-fect on both NAPL morphology and soil moisturedistribution. Experimental results are used to discussthe implications of directly using bench scale biode-gradation rates to predict effectiveness of degradationat the field scale.
Materials and methods
Rates of aerobic diesel biodegradation were measuredusing both batch and column studies. Soil was ob-tained from a railyard impacted by aged diesel. Soilwas collected aseptically and shipped on ice to thelaboratory. Soil samples were collected from the ca-pillary fringe in areas impacted by diesel in order toobtain microbial cultures pre-adapted to diesel degrad-
375
ation. Prior to experimentation, soils were stored at5.5 ◦C to minimize microbial activity.
A mixture of diesel samples collected from twolocations at the site was used in these experiments. Gaschromatograms of the diesel indicated that the sampleswere enriched in higher molecular weight hydrocar-bons compared to fresh diesel. This aged diesel patternis consistent with the reported time period of dieselimpact at the site (approximately 50 years). A nutrientbuffer solution (pH 7.2) was used to mimic ground-water conditions at the site and provide nutrients formicrobial activity. The nutrient buffer consisted of16 mg l−1 KH2PO4, 42 mg l−1 K2HPO4, 5 mg l−1
Na2HPO4, 4 mg l−1 NH4Cl, 5 mg l−1 MgSO4·7H2O,0.05 mg l−1 FeCl3·6H2O, 5 mg l−1 CaCl2, 0.005 mgl−1 MnSO4·4H2O, 0.01 mg l−1 H3BO3, 0.005 mg l−1
ZnSO4·7H2O, 0.003 mg l−1 (NH4)Mo7O24 (Gouder& Strevett 1998).
Batch experiments
The experimental conditions for soil batch studies aresummarized in Table 1. A total of 19 batch bottlesrepresenting six different conditions were tested. Ap-proximately 2 ft3 (56.6 l) of diesel-impacted soil washomogenized in a methanol-rinsed plastic bucket. Allbatch studies were conducted using this homogenizedsoil. The first experimental condition (biotic, well-mixed, containing 20 µl diesel (BM20)) representedthe most ideal conditions obtainable in the laboratory.Three replicate soil slurry bottles were created by pla-cing approximately 30 g of sieved (4.75 mm) soil, 60ml of nutrient solution and 20 µl of diesel mixture(to establish residual NAPL saturations on the soil) insterilized 250 ml amber glass bottles capped with Min-inert valves. The high ratio of liquid to soil promotedmixing during the experiment. During the experiment,the sample bottles were shaken on a rotary shaker at200 rpm, sufficient to establish a constantly stirredslurry within the bottles. Gas-phase samples (1 ml)were collected from the headspace of the bottles every6–12 h. The O2 and CO2 concentrations were analyzedby gas chromatography (GC) as described below.
A lower ratio of liquid to soil was studied in thesecond (biotic, partially mixed, 10 µl added diesel(BP10)) and third (biotic, partially mixed, 20 µl ad-ded diesel (BP20)) experimental conditions to testless homogeneous conditions. For these batch stud-ies, approximately 60 g of soil and 30 ml of nutrientsolution were combined with either 10 µl or 20 µl ofdiesel mixture in sterilized 250 ml amber glass bottles
capped with Mininert valves. Bottles were sampledand shaken as described for the well-mixed bottles(experimental condition 1 – BM20). At the 200 rpmshaking speed, the soil within the bottles was notsuspended in the solution.
Three tests were conducted as controls. Twobottles containing biotic soil (60 g), nutrient buffer(30 ml) and no added diesel (biotic, partially mixed,no diesel added (BP0)) were tested to measure thebaseline O2 depletion and CO2 production rates in thesoil. Four additional bottles were tested with sterilizedsoil (60 g), nutrient buffer (30 ml) and either 10 or 20µl diesel added (abiotic, partially mixed, 10 µl dieseladded (AP10) or abiotic, partially mixed, 20 µl dieseladded (AP20)). To sterilize soils for the abiotic tests,a portion of the homogenized soil was autoclaved forone hour at 121 ◦C and 22 psi on three consecutivedays as described by Lotrario et al. (1995).
Column experiments
To test for the potential impacts of experimental scaleon diesel biodegradation rates, respirometric tests ofsoils in three column sizes were conducted. Soil fromthe same sampling area used in batch studies was usedto fill columns of different sizes. The 10, 50 and 120cm high columns were made of glass, aluminum andPlexiglas, respectively, with a sampling port at thetop and a connection at the base to a constant-headreservoir. Each soil column was rinsed with methanoland then packed with soil in increments by altern-ately filling with soil and packing the soil down withweight. After packing each column with soil to justbelow the upper end, the columns were slowly filled inan upflow manner over 8 h using an adjustable reser-voir of nutrient solution connected to the base of thecolumn. Diesel was then added to each column viasyringe loading to the top surface of the packed soilto establish a diesel concentration of approximately337 mg diesel kg−1 soil (to establish residual NAPLsaturation in the soil). After addition of the diesel,the water table was dropped to establish a ratio of30% unsaturated soil to 70% saturated soil and thecolumns were allowed to equilibrate for at least 18 hprior to initiation of sampling. Samples were collectedfrom the column headspace and analyzed for O2 andCO2 similar to those described for batch tests. Theexperimental conditions for each set of columns aresummarized in Table 2.
An additional set of experiments involving watertable fluctuations was conducted on three of the 120

376
Table 1. Batch study experimental conditions
Label Number of Mixing Soil Approximate Nutrient solution Diesel
replicates condition condition soil mass (g) volume (ml) volume (µl)
BM20 3 Well mixed Biotic 30 60 20
BP10 5 Partially mixed Biotic 60 30 10
BP20 5 Partially mixed Biotic 60 30 20
BP0 2 Partially mixed Biotic 60 30 0
AP10 2 Partially mixed Abiotic 60 30 10
AP20 2 Partially mixed Abiotic 60 30 20
Table 2. Column study experimental conditions
Column Soil Diesel volume Diesel concentration Depth unsaturated soil/
height volume added (mg diesel/kg soil) depth saturated soil
10 cm 180 ml 0.19 ml 337 2.5 cm/ 5.9 cm
50 cm 875 ml 0.9 ml 337 13 cm/30 cm
120 cm 4.9 L 5 ml 337 30 cm/71 cm
cm columns. During the initial respirometric tests, thewater table was located 30 cm from the top of thecolumn. During water table fluctuation studies, respir-ometric tests were also conducted at water table depthsof 0, 15, 45 and 60 cm with no additional diesel ad-ded. After visual verification that the desired watertable level was established in the columns, the sys-tem was aerated from the column base for 30 min tore-establish a high oxygen concentration within thecolumn for aerobic activity. Headspace sampling foreach water table depth was conducted for 10 days.
Analytical techniques
Oxygen and carbon dioxide gas-phase samples weremeasured by Agilent p200 micro GC equippedwith dual columns and thermal conductivity detector(TCD). Oxygen was analyzed with a retention time of25 s and a total run time of 100 s on a 10 m, MS-5Å column at a constant temperature of 50 ◦C. Carbondioxide was analyzed with a retention time of 25 sand total run time of 100 s on an 8 m, PPU columnat a constant temperature of 70 ◦C. Oxygen deple-tion was converted to diesel degradation assuming astoichiometry of 3.5 mg oxygen to 1.0 mg diesel (Hin-chee & Ong 1992; Dupont 1993; Davis et al. 1998;Hickey 1995; Downey et al. 1995; Bregnard et al.1996; Moller et al. 1996).
Following respirometry experiments, diesel wasextracted from batch and column tests using a modi-fied EPA SW-846 method 3550 by varying the methyl-ene chloride to soil ratio based on the extent ofcontamination in the soil (Environmental ProtectionAgency 1996a). Extracted diesel was analyzed usingEPA SW-846 method 8015 (Environmental ProtectionAgency 1996b) with a DB-624 rather than a DB-5column in a Hewlett Packard 6890 Series Gas Chro-matograph equipped with a flame ionisation detector.The DB-624 (J&W Scientific) column (30-m × 0.320-mm with a nominal film thickness of 1.8-mm) wasused with helium as the carrier gas. The injector anddetector temperatures were 255 ◦C and 260 ◦C, re-spectively. Oven temperature conditions were: 60 ◦Cfor 3 min, 15 ◦C min−1 to 255 ◦C and 14 min at255 ◦C for an overall run time of 30 min, with integra-tion of data beginning at 5 min and ending at 25 min.Known concentrations of the site diesel (100–50,000ppm) were used for calibration.

377
Results
Batch experiments
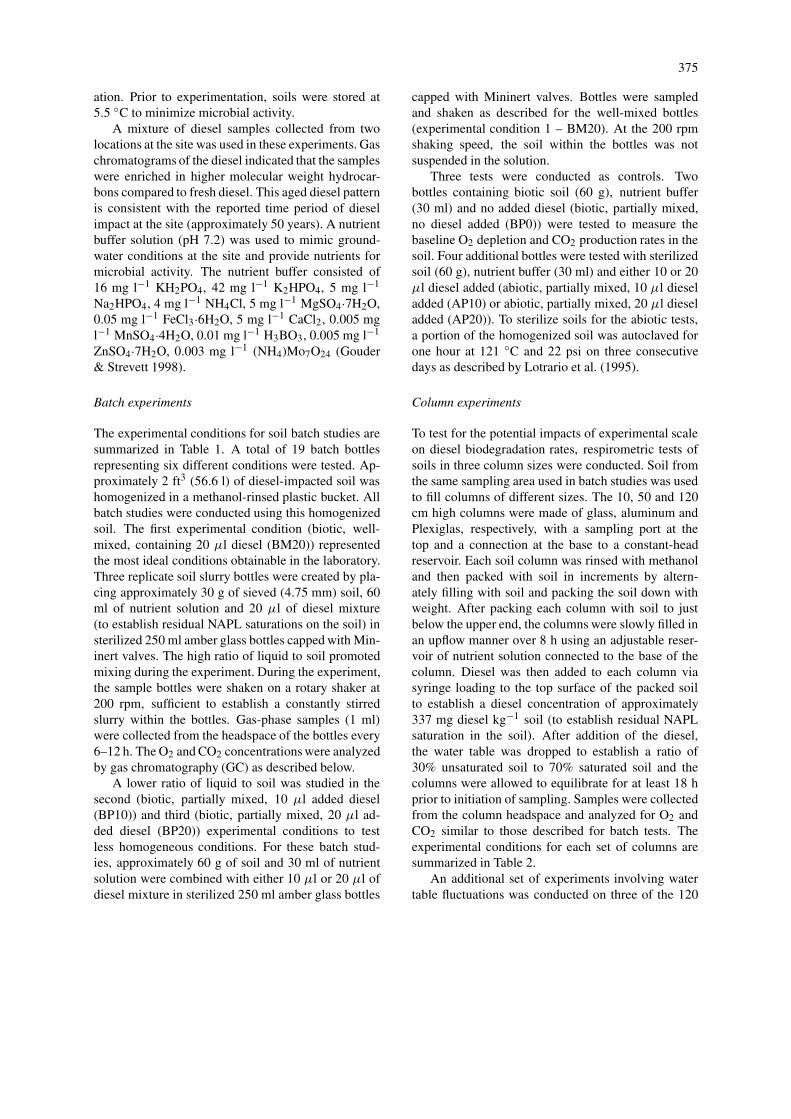
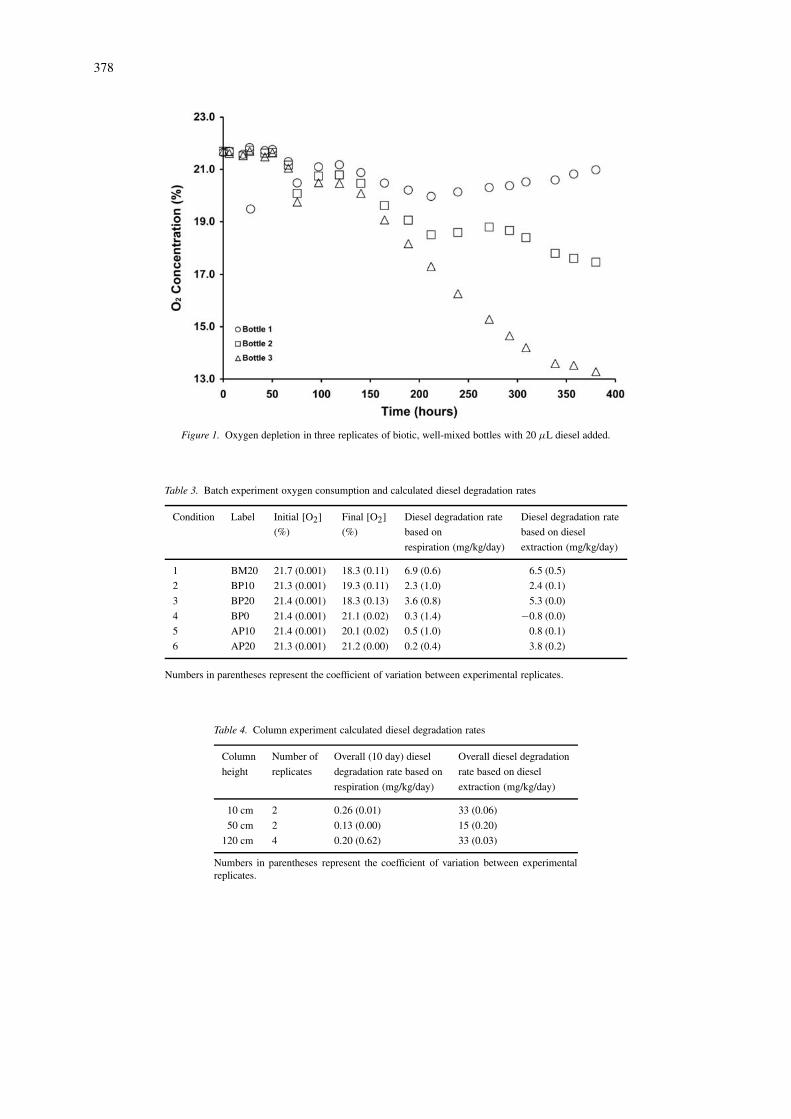
A high degree of variability was measured in oxygenconsumption rates between replicates. This variabilitywas present in all of the batch experiments includingthe well-mixed, ‘homogenous’ soil experiments. Theoxygen depletion from the three replicates of the well-mixed soil experiments is shown in Figure 1. While thereplicates behaved similarly during approximately thefirst 100 h of the experiment, the oxygen consumptiondiverged sharply between the three replicates duringthe last 200 h of the experiment. Average oxygenconsumption rates measured over 380 h ranged from3.1 mg (kg day)−1 to 11.2 mg (kg day)−1. Thislarge difference is reflected in the calculated stand-ard deviations for both overall oxygen consumptionand the calculated diesel degradation rates shown inthe first row of Table 3. This marked divergencein oxygen consumption under well-mixed conditionsdemonstrates that small samples of homogenized soilscan exhibit significantly different respiration behavior.
Similar variability was observed in the partiallymixed batch experiments. As with the well-mixed sys-tems, biotic experiments initially containing 10 and 20µl of diesel under partially-mixed conditions showedsimilar early oxygen depletion followed by significantdivergence after approximately 100 h. The results ofthese studies are summarized in Table 3. Although thestandard deviations of the BP10 and BP20 series weresimilar to the well-mixed soil experiments, the calcu-lated average diesel degradation rates were slower inthe partially mixed soil experiments.
Given the variability between replicates, no sig-nificant difference (tested at 90% confidence) wasobserved in degradation rates with initial diesel addi-tions of 10 µl (BP10) and 20 µl (BP20). Therefore,any dependence of the diesel degradation rate on theamount of diesel present cannot be determined. Abi-otic controls (AP10 and AP20) showed small oxygendepletion compared to the average oxygen depletion inbiotic tests, indicating that the primary mechanism foroxygen depletion was biological oxidation. Relativelylow oxygen depletion rates were also observed in con-trols containing no added diesel (BP0), demonstratingthat the biological oxidation of alternate organic sub-strates (such as background diesel or soil humic andfulvic acids) did not significantly contribute to theoxygen depletion observed in experiments containingadded diesel. Based on the results from these two con-
trols, diesel degradation rates, summarized in Table 3,were calculated on the basis of (1) negligible abioticoxygen uptake; and (2) negligible biological oxidationof alternate organics.
Average diesel degradation rates were also calcu-lated based on recovery of extracted diesel from thebatch test materials. A simple batch test to measure ex-traction efficiency indicated that 83% of diesel addedto soil could be recovered (data not shown). Using thisefficiency value and the measured remaining diesel,the average diesel degradation rate was calculated, assummarized in Table 3. The degradation rates basedon extracted diesel are quite similar to those based onrespiration, with no statistically significant differenceat 90% confidence with the exception of the AP20system. The soil in these systems may have been in-sufficiently sterilized so that bioactivity developed inthe time between respiration measurements and dieselextraction, but significant CO2 production did not oc-cur (data not shown). The most likely cause for thisdiscrepancy in rates is poor extraction efficiency, asseen in the column systems (see below). Though awide range of diesel degradation rates was observed inthe batch studies, the strong correlation between theserates based on the diesel extraction and respirometrymeasurements suggests that the respirometry methodaccurately reflected the diesel degradation rates in thebatch systems.
Column experiments
The oxygen concentration observed over time in theheadspace of each column is shown in Figure 2.The highest degree of variability was observed inthe 120 cm columns, with overall diesel degrada-tion rates based on respirometry ranging from 0.04mg (kg day)−1 to 0.34 mg (kg day)−1 and an aver-age of 0.20 mg (kg day)−1 (see Table 4). Like thebatch experiments, oxygen concentrations decreasedinitially and then appeared to stabilize somewhat.Oxygen and diesel concentrations upon stabilizationwere sufficiently high so that respiration rates werenot limited, but nitrogen may have been a limiting nu-trient. Estimates based on CO2 data (not shown) andtypical cell growth stoichiometry suggest that some,though not all, of the experimental systems may havebeen nitrogen-limited, though no experiments wereconducted to determine a limiting growth factor.
The rates of diesel biodegradation based on extrac-tion of diesel from the column materials are substan-tially higher than those calculated from respirometry
378
Figure 1. Oxygen depletion in three replicates of biotic, well-mixed bottles with 20 µL diesel added.
Table 3. Batch experiment oxygen consumption and calculated diesel degradation rates
Condition Label Initial [O2] Final [O2] Diesel degradation rate Diesel degradation rate
(%) (%) based on based on diesel
respiration (mg/kg/day) extraction (mg/kg/day)
1 BM20 21.7 (0.001) 18.3 (0.11) 6.9 (0.6) 6.5 (0.5)
2 BP10 21.3 (0.001) 19.3 (0.11) 2.3 (1.0) 2.4 (0.1)
3 BP20 21.4 (0.001) 18.3 (0.13) 3.6 (0.8) 5.3 (0.0)
4 BP0 21.4 (0.001) 21.1 (0.02) 0.3 (1.4) −0.8 (0.0)
5 AP10 21.4 (0.001) 20.1 (0.02) 0.5 (1.0) 0.8 (0.1)
6 AP20 21.3 (0.001) 21.2 (0.00) 0.2 (0.4) 3.8 (0.2)
Numbers in parentheses represent the coefficient of variation between experimental replicates.
Table 4. Column experiment calculated diesel degradation rates
Column Number of Overall (10 day) diesel Overall diesel degradation
height replicates degradation rate based on rate based on diesel
respiration (mg/kg/day) extraction (mg/kg/day)
10 cm 2 0.26 (0.01) 33 (0.06)
50 cm 2 0.13 (0.00) 15 (0.20)
120 cm 4 0.20 (0.62) 33 (0.03)
Numbers in parentheses represent the coefficient of variation between experimentalreplicates.

379
Figure 2. Oxygen depletion in column headspaces for 10 cm column replicates (squares), 50 cm columns (triangles) and 120 cm columns(circles).
data, as shown in Table 4. However, the total mass ofoxygen present in the columns in both gas and aqueousphases was only sufficient to allow for oxidation of 3–11% of the diesel to CO2. In addition, CO2 data (notshown) also does not support oxidation of that muchdiesel but instead accounts for about 62% of the oxy-gen depletion observed in both batch and column tests.Significant anaerobic diesel degradation is unlikelydue to continuous presence of oxygen in the columnheadspace (Figure 2), though mass transfer limitationsmay have led to the formation of anoxic zones. Thus,extraction of diesel from column materials appears tobe much less efficient than from batch materials. Thiscould be due in large part to the mechanical difficultyin removing soils from the columns, which could haveresulted in significant volatilization of diesel com-ponents and loss of solid materials to the columns,weighing apparatus and extraction tools. Based onthe difficulties associated with the diesel extraction,respirometry data appears to more accurately reflectactual degradation rates and was used exclusively toassess degradation rates in the soil columns.
The effect of soil moisture distribution was alsoinvestigated by fluctuating the depth to water tablein three of the 120 cm columns. The sequence ofdepths tested in the water table fluctuation experi-ments was: 30 cm, 0 cm, 15 cm, 45 cm and 60 cm.
Table 5. Calculated degradation rates at varied water tabledepths
Depth to water Overall (10 day) Overall (10 day)
table (cm) O2 depletion degradation rate
(%) (mg/kg/day)
0 3.4 (0.90) 0.02 (0.91)
15 37 (0.71) 0.15 (0.70)
30 65 (0.31) 0.26 (0.31)
45 56 (0.50) 0.24 (0.49)
60 58 (0.44) 0.25 (0.42)
Numbers in parentheses represent the coefficient of vari-ation between experimental replicates.
The average oxygen consumption data for the threecolumns is shown in Figure 3. Calculated diesel de-gradation rates, assuming equilibrium between gas-and aqueous-phase oxygen, are summarized in Table5. While dissolved oxygen (DO) levels were not meas-ured, the mass of oxygen present in the aqueous phaseconstituted only 4.3% of the total oxygen in the systemwith the most water. Therefore, assuming completeDO consumption would not significantly increase theestimates of total diesel degraded. Essentially no oxy-gen depletion occurred when the water table was set atthe soil surface, indicating that degradation occurredvery slowly in the fully saturated system. For depths

380
Figure 3. Average oxygen depletion at varied water table depths.
between 0 and 30 cm, the rate of oxygen depletionincreased with increasing depth to water table (correl-ation coefficient of 0.84). Though absolute rates variedbetween columns (again, likely due to soil and mi-crobial heterogeneities), similar relative trends wereobserved within each of the columns. However, thisrate increase was not observed at the 45 and 60 cmdepths (correlation coefficient of −0.03). Instead, theoxygen depletion rates were similar at 30, 45 and 60cm.
Discussion
Effect of heterogeneities and NAPL morphology
The observed rates of oxygen consumption decreasedas the scale of the system increased in partially mixedand un-mixed systems. The implication is that the in-creased presence of soil and microbial heterogeneitiesat larger scales reduces the efficiency of biodegrad-ation by one or more mechanisms. One potentialmechanism is that the presence of less permeable soilzones could decrease the access of degrading pop-ulations to electron acceptors and substrate (Kao &Prosser 1999). Similarly, different soil zones could
have different levels of degrading microbe popula-tions. Also, the presence of differential zones of NAPLmorphology can reduce degradation rates by concen-trating substrate in localized areas or by creating zoneswith contaminant concentrations that are bioinhibitory(Seagren et al. 1994; Rogers & Logan 2000).
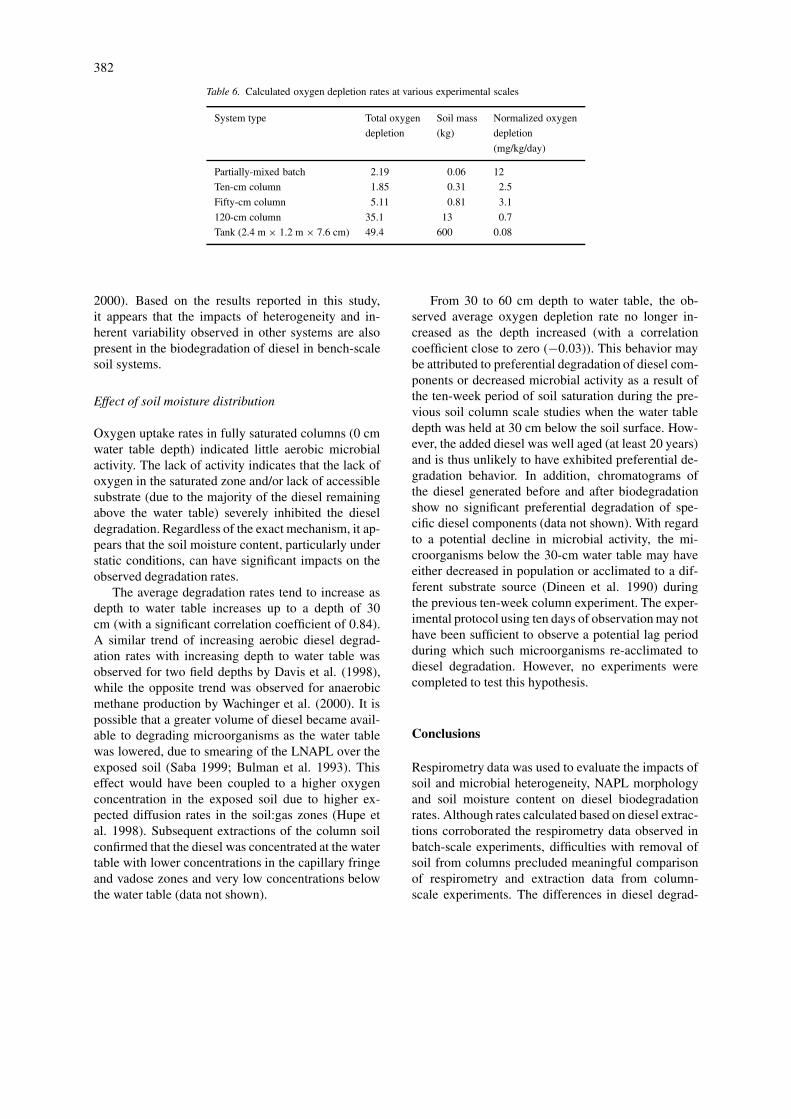
In order to evaluate the impact of experimentalscale on observed diesel biodegradation rates, batchand column results were compared to experimentsconducted in an intermediate-scale tank system (245× 122 × 8 cm) previously reported by Cort et al.(2001). The same soil and diesel mixture were used inboth the column/batch experiments reported here andin the intermediate-scale tank experiments describedby Cort et al. (2001). Diesel mixture was added tothe soil-packed tanks and aqueous-phase oxygen con-centrations were measured over a period of severaldays. The average oxygen depletion rate observed inthe intermediate-scale tanks is listed along with theaverage column and batch oxygen depletion rates inTable 6. Aqueous oxygen depletion data for the tanksystem was converted to total mass depletion usingthe soil porosity and total soil volume. Gaseous oxy-gen depletion in the batch and column systems wasconverted to total oxygen depletion based on the head-space volume. This method does not report the actual

381
depletion rate, as the headspace concentration is lim-ited by oxygen diffusion, so the value represents aconservative rate estimate.
When the oxygen depletion rates are normalizedto the total mass of soil in the system, a clear trendof decreasing rate with increasing experimental scaleis observed. Assuming first-order diesel degradationand using average rates at each scale, the time re-quired to reduce diesel concentrations from 1000 mgkg−1 to 100 mg kg−1 was calculated. The time rangesfrom 64 days based on batch rates, to 1047 daysbased on the 50-cm columns, to 79 years based onthe intermediate-scale tank. Similar results have beennoted when comparing predicted rates and field-scalebiodegradation rates of petroleum products. Sturmanet al. (1995) noted that half lives of petroleum products(gasoline, fuel oil, BTEX) under aerobic or denitrify-ing conditions were 4 to 10 times longer in the fieldthan in the lab.
The effects of heterogeneity on the oxygen uptakeand corresponding diesel degradation rate were evid-ent in both batch and column experiments. The largeobserved variability between replicates suggests thatsmall-scale heterogeneities can significantly impactdegradation rates, even in well-mixed batch systems.Assuming that diesel degradation rate is first orderwith respect to the concentration of diesel, the timerequired to reduce diesel concentrations from 1000 mgkg−1 to 100 mg kg−1 was calculated using the highestand lowest rates (mg (kg day)−1) determined for eachexperimental scale. The time required ranges from 24to 113 days based on batch-scale rates, to 317 to 1389days based on the 120-cm columns. These calculationsindicate that to overcome the effects of these small-scale heterogeneities and measure representative bio-activity, large sample sizes are required. The exactsize of soil sample required to capture representativeactivity depends primarily on the degree of heterogen-eity present in the soil sample and in the field. Suchvariability in microbial activity within a single sitehas been attributed to the presence of microbiological’hotspots’ (areas of high microbial density or degrad-ation activity) (Brockman & Murray 1997; Vroblesky& Chapelle 1994). The presence of these ‘hotspots’ ishypothesized to result from differential substrate andelectron acceptor availability due to small- and largerscale heterogeneities. In this study, the 13 kg soil usedin the 120-cm columns appears to be insufficient tocapture representative diesel biodegradation, thoughdifferences in column packing may also have contrib-uted to the observed variability. Measured soil mass
in the different columns was quite different from thatexpected based on typical soil bulk density. The meas-ured bulk density varied substantially between columnscales (CV = 0.50), suggesting that column packingvariability may have been important, though replicatecolumn masses were comparable (CVs 0.0007–0.18).
The impacts of heterogeneity on microbial growthand activity have been observed in numerous studiesat different scales. In studies examining bacterial com-munities associated with microbial activity, in general,activity and bacterial density were only loosely correl-ated (Kao & Borden 1997; Hickman & Novak 1989)and highly variable (Beloin et al. 1988; Zhang et al.1998; Ulrich et al. 1998). Ulrich et al. (1998) suggestthat such microscale variability may account for themajority of total heterogeneity associated with subsur-face sulfate reduction and, possibly, other microbialprocesses.
Within a single site, high variability has beenobserved in bioactivities ranging from BTEX degrad-ation to denitrification. A study on the degradation ofBTEX in a contaminated aquifer showed that morepermeable sediment materials responded to biore-mediation with higher biomass and significant toluenedegradation while less permeable sediments containedlower microbial populations and had no significant de-gradation (Kao & Prosser 1999). Parkin et al. (1987)observed a coefficient of variation (CV) in measureddenitrification rates ranging from 1.28–3.83, with thestandard deviation of small cores 3–10 times lowerthan that of large cores. Most variability occurred atdistances <10 cm, and a computerized random res-ampling algorithm suggested that 10–15 kg of soilwould be required to obtain “representative” ratesfrom a single sample. Highly variable methanogen-esis rates within single sites have also been observed,with CV 0.40–1.80 (Wachinger et al. 2000) and 3.40–4.90 (Adrian et al. 1994) for replicates, and significantdifferences at 95% level in a MANOVA (Pedersen &Sayler 1981).
Finally, a recent review of pesticide biodegradationconcluded that a priori prediction of pesticide bio-transformation is not possible, even within a singlesite, due to subsurface heterogeneities (Hoyle & Ar-thur 2000). Another review of microbial communit-ies associated with organic biodegradation concludedthat studies indicate that many organic-degrading bac-teria with different degradative capabilities may existwithin a single site, and that significant small-scaleheterogeneity in biodegradation may be expected dueto heterogeneity in aquifer materials (Haack & Bekins
382
Table 6. Calculated oxygen depletion rates at various experimental scales
System type Total oxygen Soil mass Normalized oxygen
depletion (kg) depletion
(mg/kg/day)
Partially-mixed batch 2.19 0.06 12
Ten-cm column 1.85 0.31 2.5
Fifty-cm column 5.11 0.81 3.1
120-cm column 35.1 13 0.7
Tank (2.4 m × 1.2 m × 7.6 cm) 49.4 600 0.08
2000). Based on the results reported in this study,it appears that the impacts of heterogeneity and in-herent variability observed in other systems are alsopresent in the biodegradation of diesel in bench-scalesoil systems.
Effect of soil moisture distribution
Oxygen uptake rates in fully saturated columns (0 cmwater table depth) indicated little aerobic microbialactivity. The lack of activity indicates that the lack ofoxygen in the saturated zone and/or lack of accessiblesubstrate (due to the majority of the diesel remainingabove the water table) severely inhibited the dieseldegradation. Regardless of the exact mechanism, it ap-pears that the soil moisture content, particularly understatic conditions, can have significant impacts on theobserved degradation rates.
The average degradation rates tend to increase asdepth to water table increases up to a depth of 30cm (with a significant correlation coefficient of 0.84).A similar trend of increasing aerobic diesel degrad-ation rates with increasing depth to water table wasobserved for two field depths by Davis et al. (1998),while the opposite trend was observed for anaerobicmethane production by Wachinger et al. (2000). It ispossible that a greater volume of diesel became avail-able to degrading microorganisms as the water tablewas lowered, due to smearing of the LNAPL over theexposed soil (Saba 1999; Bulman et al. 1993). Thiseffect would have been coupled to a higher oxygenconcentration in the exposed soil due to higher ex-pected diffusion rates in the soil:gas zones (Hupe etal. 1998). Subsequent extractions of the column soilconfirmed that the diesel was concentrated at the watertable with lower concentrations in the capillary fringeand vadose zones and very low concentrations belowthe water table (data not shown).
From 30 to 60 cm depth to water table, the ob-served average oxygen depletion rate no longer in-creased as the depth increased (with a correlationcoefficient close to zero (−0.03)). This behavior maybe attributed to preferential degradation of diesel com-ponents or decreased microbial activity as a result ofthe ten-week period of soil saturation during the pre-vious soil column scale studies when the water tabledepth was held at 30 cm below the soil surface. How-ever, the added diesel was well aged (at least 20 years)and is thus unlikely to have exhibited preferential de-gradation behavior. In addition, chromatograms ofthe diesel generated before and after biodegradationshow no significant preferential degradation of spe-cific diesel components (data not shown). With regardto a potential decline in microbial activity, the mi-croorganisms below the 30-cm water table may haveeither decreased in population or acclimated to a dif-ferent substrate source (Dineen et al. 1990) duringthe previous ten-week column experiment. The exper-imental protocol using ten days of observation may nothave been sufficient to observe a potential lag periodduring which such microorganisms re-acclimated todiesel degradation. However, no experiments werecompleted to test this hypothesis.
Conclusions
Respirometry data was used to evaluate the impacts ofsoil and microbial heterogeneity, NAPL morphologyand soil moisture content on diesel biodegradationrates. Although rates calculated based on diesel extrac-tions corroborated the respirometry data observed inbatch-scale experiments, difficulties with removal ofsoil from columns precluded meaningful comparisonof respirometry and extraction data from column-scale experiments. The differences in diesel degrad-
383
ation rates observed within replicates at each scalehave significant implications for the extrapolation ofbiodegradation rates determined in the laboratory tofield-scale applications. The high degree of variabilityobserved at the various experimental scales indicatesthat small-scale soil and microbial heterogeneities sig-nificantly impact biodegradation rates. In addition, thebiodegradation rates determined in small-scale batchor column systems are enhanced by more efficientdiffusion rates of substrate and electron acceptorsand will be susceptible to variability introduced bysmall-scale heterogeneities. The results of this studyindicate that bench-scale studies may not sufficientlycapture representative microbial and soil heterogen-eity and diffusion limitations, such that larger-scalestudies, which also incorporate large-scale heterogen-eities, are required to effectively predict field-scalebioremediation outcomes.
Acknowledgements
The authors wish to acknowledge the funding and sup-port provided by Union Pacific Railroad and Cameron-Cole, LLC, in particular to Mr Shawn Leppert forhis assistance in acquiring the funds. Dr. Frank Bar-ranco assisted in the design of the experiments. Hiscontributions are gratefully acknowledged.
References
Adrian N, Robinson JA & Suflita JM (1994) Spatial variability inbiodegradation rates as evidenced by methane production froman aquifer. Appl. Environ. Microbiol. 60: 3632–3639
Beloin RM, Sinclair JL & Ghiorse WC (1988) Distribution andactivity of microorganisms in subsurface sediments of a pristinestudy site in Oklahoma. Microbial Ecol. 16: 85–97
Bossert I & Bartha R (1984) The fate of petroleum in soil ecosys-tems. In: Atlas RM (Ed) Petroleum Microbiology (pp 435–473).MacMillan Publishing Company, New York
Bregnard TP-A, Hohener P, Haner A & Zeyer J (1996) Degradationof weathered diesel fuel by microorganisms from a contaminatedaquifer in aerobic and anaerobic microcosms. Environ. Toxicol.Chem. 15: 299–307
Brockman FJ & Murray CJ (1997) Subsurface microbiologicalheterogeneity: Current knowledge, descriptive approaches andapplications. FEMS Microbiol. Rev. 20: 231–247
Bulman TL, Newland M & Wester A (1993) In-situ bioventing of adiesel fuel spill. Hydrol. Sci. 38: 297–308
Cort T, Davis CA, Dai D, Illangasekare TH & Munakata-Marr J(2001) Intermediate-scale evaluation of bioremediation techno-logies in heterogeneous LNAPL-contaminated soil. Proc. Conf.Environ. Research, Hazardous Substance Research Center, Man-hattan, KS, May 21–24
Davis GB, Johnston CD, Patterson BM, Barber C & Bennett M(1998) Estimation of biodegradation rates using respiration testsduring in-situ bioremediation of weathered diesel NAPL. GroundWater Monit. Remediat. 18: 123–132
Dineen D, Slater JP, Hicks P, Holland J & Clendening LD (1990)In-situ biological remediation of petroleum hydrocarbons in un-saturated soils. In: Kostecki PT & Calabrese EJ (Eds) PetroleumContaminated Soils (pp 177–187). Lewis Publishers, Inc. BocaRaton FL
Downey DC, Guest PR & Ratz JW (1995) Results of a two-year in-situ bioventing demonstration. Environ. Progress. 14: 121–125
Dupont RR (1993) Fundamentals of bioventing applied to fuelcontaminated sites. Environ. Progress. 12: 45–53
Environmental Protection Agency (1996a) SW-846, TestMethods for Evaluating Solid Wastes: Physical/ChemicalMethods: Method 3550b Ultrasonic Extraction, Revision 2,http://www.epa.gov/epaoswer/hazwaste/test/pdfs/3550b.pdf(July 1, 2003)
Environmental Protection Agency (1996b) SW-846, Test Meth-ods for Evaluating Solid Wastes: Physical/Chemical Meth-ods: Method 8015b Nonhalogenated Organics using GC/FID,Revision 2, http://www.epa.gov/epaoswer/hazwaste/test/pdfs/8015b.pdf (July 1, 2003)
Goudar CT & Strevett KA (1998) Comparison of relative ratesof BTEX biodegradation using respirometry. J. Ind. Microbiol.Biotechnol. 21: 11–18
Haack SK & Bekins BA (2000) Microbial populations in contamin-ant plumes. Hydrogeol. J. 8: 63–76
Hickey WJ (1995) In situ respirometry: Defining the limits. Environ.Sci. Technol. 30: 398A–401A
Hickman GT & Novak JT (1989) Relationship between subsur-face biodegradation rates and microbial density. Environ. Sci.Technol. 23: 525–532
Hinchee RE & Ong SK (1992) A rapid in-situ respiration test formeasuring aerobic biodegradation rates of hydrocarbons in soil.J. Air Waste Manag. Assoc. 42: 1305–1312
Hogg DS, Burden RJ & Riddell PJ (1992) In-situ vadose zonebioremediation of soil contaminated with non-volatile hydrocar-bons. Presented at HMCRI Conference, February 4, 1992, SanFrancisco, CA
Hoyle BL & Arthur EL (2000) Biotransformation of pesticides insaturated-zone materials. Hydrogeol. J. 8: 89–103
Hupe K, Heerenklage J, Woyczechowske H, Bollow S & StegmannR (1998) Influence of oxygen on the degradation of diesel fuel insoil bioreactors. Acta Biotechnologica 18: 109–122
Kao C-M & Borden RC (1997) Site specific variability in BTEXbiodegradation under denitrifying conditions. Groundwater 35:305-311
Kao C-M & Prosser J (1999) Influence of aquifer biogeochemicaldistribution on BTEX biodegradation under aerobic/anaerobicconditions. J. Chinese Institute Environ. Engin. 9:187–197
Leeson A. & Hinchee RE (1997) Soil Bioventing: Principles andPractice. Lewis Publishers, Boca Raton, FL
Lotrario JB, Stuart BJ, Lam T, Arands RR, O’Connor OA & KossonDS (1995) Effects of sterilization methods on the physical char-acteristics of soil: Implications for sorption isotherm analyses.Bull. Environ. Contam. Toxicol. 54: 668–675
Moller J, Winther B, Lund K, Kirkebjerg K & Westermann P (1996)Bioventing of diesel oil-contaminated soil: Comparison of de-gradation rates in soil based on actual oil concentration and onrespirometric data. J. Indus. Microbiol. 16: 110–116
Norris RD, Hinchee RE, Brown R, McCarty PL, Semprini L,Wilson JT, Kampbell DH, Reinhard M, Bouwer EJ, Borden
384
RC, Vogel TM, Thomas JM & Ward CH (1994) Handbook ofBioremediation. Lewis Publishers, Boca Raton, FL
Parker EF & Burgos WD (1999) Degradation patterns of fresh andaged petroleum-contaminated soils. Environ. Eng. Science 16:21–29
Parkin TB, Starr JL & Meisinger JJ (1987) Influence of sample sizeon measurement of soil denitrification. Soil Sci. Soc. Am. J. 51:1492–1501
Pedersen D & Sayler GS (1981) Methanogenesis in freshwatersediments: inherent variability and effects on environmentalcontaminants. Can. J. Microbiol. 27: 198–205
Ramaswami A & Luthy RG (1997) Mass transfer and bioavailabilityof PAH compounds in coal tar NAPL-slurry systems 1. ModelDevelopment. Environ. Sci. Technol. 31: 2260–2267
Rogers B & Logan BE (2000) Bacterial transport in NAPL-contaminated porous media. J. Environ. Engin. 126: 657–666
Saba TA (1999) Upscaling of mass transfer from entrapped NAPLsunder natural and enhanced conditions. Dissertation, Universityof Colorado, Boulder
Seagren EA, Rittmann BE & Valocchi AJ (1994) Quantitative eval-uation of the enhancement of NAPL-pool dissolution by flushingand biodegradation. Environ. Sci. Technol. 28: 833–839
Sepic E, Trier C & Leskovsek H (1996) Biodegradation studies ofselected hydrocarbons from diesel oil. Analyst 121: 1451–1456
Stout SA & Lundergard PD (1998) Intrinsic biodegradation ofdiesel fuel in an interval of separate phase hydrocarbons. Appl.Geochem. 13: 851–859
Sturman PJ, Stewart PS, Cunningham AB, Bouwer EJ & Wolfram
JH (1995) Engineering scale-up of in situ bioremediation pro-cesses: A review. J. Contam. Hydrol. 19: 171–203
Ulrich GA, Martino D, Burger K, Routh J, Grossman EL, Ammer-man JW & Suflita JM (1998) Sulfur cycling in the terrestrial sub-surface: Commensal interactions, spatial scales, and microbialheterogeneity. Microbial Ecol. 36: 141–151
Van Eyk J & Vreeken C (1989) Venting mediated removal of dieseloil from subsurface soil strata as a result of stimulated evapor-ation and enhanced biodegradation. In: Hazardous Waste andContaminated Sites, Envirotech Vienna, Vol. 2, Session 3 (pp475–485). Westarp Wiss., Essen
Vroblesky D A & Chapelle FH (1994) Temporal and spatialchanges of terminal electron-accepting processes in a petro-leum hydrocarbon-contaminated aquifer and the significancefor contaminant biodegradation. Wat. Resour. Res. 30: 1561–1570
Wachinger G, Fiedler S, Zepp K, Gattinger A, Sommer M & RothK (2000) Variability of soil methane production on the micro-scale: Spatial association with hot spots of organic material andarchaeal populations. Soil Biol. Biochem. 32: 1121–1130
Widrig DL & Manning JF (1995) Testing bioremediation in thefield. In: In-Situ Bioremediation: When Does it Work? (pp160–184). National Research Council; National Academy Press,Washington DC
Zhang C, Palumbo AV, Phelps TJ, Beauchamp JJ, Brockman FJ,Murray CJ, Parsons BS & Swift DJP (1998) Grain size and depthconstraints on microbial variability in coastal plain subsurfacesediments. Geomicrobiol. 15: 171–185