Effects of Environmental Policy on the Type of Innovation · on the Type of Innovation: ... air...
18
ISSN 1995-2848 OECD Journal: Economic Studies Volume 2009 © OECD 2009 1 Effects of Environmental Policy on the Type of Innovation: The Case of Automotive Emission-control Technologies by Ivan Hascic, Frans de Vries, Nick Johnstone and Neelakshi Medhi Ivan Hascic and Nick Johnstone both work in the OECD Environment Directorate, Frans de Vries is at the Department of Economics, Stirling University, and Neelakshi Medhi is at the Maxwell School, Syracuse University. They are grateful to Dominique Guellec, Hélène Dernis and Romain Duval of the OECD, as well as David Popp of the Maxwell School, the Syracuse University, for helpful inputs and suggestions. Introduction. . . . . . . . . . . . . . . . . . . . . . . . . . . . . . . . . . . . . . . . . . . . . . . . . . . . . 2 Technological innovation in automotive emissions control . . . . . . . . . . . . 3 Technology overview . . . . . . . . . . . . . . . . . . . . . . . . . . . . . . . . . . . . . . . . . 3 Patent counts. . . . . . . . . . . . . . . . . . . . . . . . . . . . . . . . . . . . . . . . . . . . . . . . . . . . 4 Factors determining patenting activity in automotive emissions control . . . . . . . . . . . . . . . . . . . . . . . . . . . . . . . . . . . . . . . . . . . . . . . . 6 Fuel prices . . . . . . . . . . . . . . . . . . . . . . . . . . . . . . . . . . . . . . . . . . . . . . . . . . 6 Environmental regulation in the automobile sector . . . . . . . . . . . . . . . 7 Empirical model and results . . . . . . . . . . . . . . . . . . . . . . . . . . . . . . . . . . . . . . . 10 Conclusions . . . . . . . . . . . . . . . . . . . . . . . . . . . . . . . . . . . . . . . . . . . . . . . . . . . . . 13 Notes. . . . . . . . . . . . . . . . . . . . . . . . . . . . . . . . . . . . . . . . . . . . . . . . . . . . . . . 14 Bibliography . . . . . . . . . . . . . . . . . . . . . . . . . . . . . . . . . . . . . . . . . . . . . . . . . 15 Appendix. List of Selected IPC Patent Classes Relevant for Automotive Emissions Control . . . . . . . . . . . . . . . . . . . . . . . . . . . . . . 17
Transcript of Effects of Environmental Policy on the Type of Innovation · on the Type of Innovation: ... air...

ISSN 1995-2848
OECD Journal: Economic Studies
Volume 2009
© OECD 2009
Effects of Environmental Policyon the Type of Innovation: The Case
of Automotive Emission-control Technologies
byIvan Hascic, Frans de Vries, Nick Johnstone and Neelakshi Medhi
Ivan Hascic and Nick Johnstone both work in the OECD Environment Directorate,
Frans de Vries is at the Department of Economics, Stirling University, and Neelakshi Medhi
is at the Maxwell School, Syracuse University. They are grateful to Dominique Guellec,
Hélène Dernis and Romain Duval of the OECD, as well as David Popp of the Maxwell School,
the Syracuse University, for helpful inputs and suggestions.
Introduction. . . . . . . . . . . . . . . . . . . . . . . . . . . . . . . . . . . . . . . . . . . . . . . . . . . . . 2
Technological innovation in automotive emissions control . . . . . . . . . . . . 3
Technology overview . . . . . . . . . . . . . . . . . . . . . . . . . . . . . . . . . . . . . . . . . 3
Patent counts. . . . . . . . . . . . . . . . . . . . . . . . . . . . . . . . . . . . . . . . . . . . . . . . . . . . 4
Factors determining patenting activity in automotive
emissions control . . . . . . . . . . . . . . . . . . . . . . . . . . . . . . . . . . . . . . . . . . . . . . . . 6
Fuel prices . . . . . . . . . . . . . . . . . . . . . . . . . . . . . . . . . . . . . . . . . . . . . . . . . . 6
Environmental regulation in the automobile sector . . . . . . . . . . . . . . . 7
Empirical model and results . . . . . . . . . . . . . . . . . . . . . . . . . . . . . . . . . . . . . . . 10
Conclusions . . . . . . . . . . . . . . . . . . . . . . . . . . . . . . . . . . . . . . . . . . . . . . . . . . . . . 13
Notes. . . . . . . . . . . . . . . . . . . . . . . . . . . . . . . . . . . . . . . . . . . . . . . . . . . . . . . 14
Bibliography. . . . . . . . . . . . . . . . . . . . . . . . . . . . . . . . . . . . . . . . . . . . . . . . . 15
Appendix. List of Selected IPC Patent Classes Relevant
for Automotive Emissions Control . . . . . . . . . . . . . . . . . . . . . . . . . . . . . . 17
1

EFFECTS OF ENVIRONMENTAL POLICY ON THE TYPE OF INNOVATION: THE CASE OF AUTOMOTIVE EMISSION-CONTROL TECHNOLOGIES
IntroductionAutomotive emissions are among the major sources of local air pollution. The major
pollutants emitted by motor vehicles include carbon monoxide (CO) and nitrogen oxides
(NOx). In OECD countries, car emissions account for 55% of CO and 36% of the ozone-
causing NOx emissions.1 Other automobile pollutants include hydrocarbons (HC) and
particulate matter (PM), contributing 21% and 12% respectively to air emissions in OECD
countries (OECD, 2007).2 Given the relatively large contribution of automotive emissions to
overall air pollution, reducing the amount of emissions generated by motor vehicles can
contribute significantly to improving local air quality.
There is a relatively limited body of literature that examines the links between
environmental regulation and technological innovation and diffusion empirically. Earlier
research on the induced innovation hypothesis used patent data in rather broad terms –
either by analysing the overall patenting activity or by environmental patenting in general
(e.g. Lanjouw and Mody, 1996; Jaffe and Palmer, 1997; Brunnermeier and Cohen, 2003). More
recently, several studies adopted a more specific focus. For example, some studies explored
the effects of higher energy prices on innovations in energy-efficient technologies for
stationary sources (e.g. Popp, 2002) and mobile sources (e.g. Crabb and Johnson, 2007). The
study by Crabb and Johnson examines the effects of motor fuel prices on patent activity in
the field of energy-efficient automotive technology. However, effects of environmental
policy on technologies which are explicitly emission-reducing are not addressed. Few
papers have studied innovation specifically related to air quality control (e.g. Taylor et al.,
2003; Popp, 2003), and those which exist have analysed innovation related to SO2 and NOx
regulations for stationary sources.
Finally, there are few available cross-country studies (e.g. De Vries and Withagen, 2005;
Popp, 2006; Popp et al., 2007). For example, Popp (2006) explored the effect of environmental
regulations on both national and international technological innovation and diffusion in
air pollution control for coal-fired power plants and found that domestic regulation plays a
major role in fostering innovative activities in the home country. Johnstone et al. (2008)
examined the role of domestic policy design on renewable energy patents for a broad cross-
section of OECD countries. Popp et al. (2007) studied innovations in the pulp industry and
found that foreign consumer pressure can be an effective means of inducing innovation.
One key difference between these industries is that the final product is traded in the case
of the pulp and paper industry, so that consumer demand for environmentally-friendly
paper can influence production across borders. In contrast, most electricity is not traded
across borders, making domestic regulation more important.
This paper examines patenting activity in automotive emission-control technologies
for a cross-section of OECD countries in the period 1978-2005. We find that both domestic
and foreign environmental regulations, as well as fuel prices, played an important role in
terms of encouraging innovation with respect to the pollution emissions of motor vehicle
technologies. However, the role played by these two factors depends very much on the type
OECD JOURNAL: ECONOMIC STUDIES – VOLUME 2009 – ISSN 1995-2848 – © OECD 20092

EFFECTS OF ENVIRONMENTAL POLICY ON THE TYPE OF INNOVATION: THE CASE OF AUTOMOTIVE EMISSION-CONTROL TECHNOLOGIES
of technology induced. In particular, fuel prices have been key to the development of
“integrated” abatement technologies, while regulatory standards have been more
important for the development of post-combustion technologies. This result reflects the
fact that innovation with respect to environmental technologies results in both private
(i.e. increased fuel efficiency) and public (i.e. reduced emissions) benefits, while in the case
of post-combustion technologies the benefits are purely public.
The structure of the paper is as follows. The next section discusses the different types
of automotive emission-control technologies and introduces the data on patenting activity
in this field, followed by a section providing an overview of the regulations of the
automobile sector in the United States, Japan and Europe. The penultimate section
presents the empirical analysis of the effects of regulations and fuel prices on patenting
activity and the final section summarises the findings and concludes.
Technological innovation in automotive emissions control
Technology overview
Automotive emission-control technologies comprise all technologies that are used to
reduce pollutants produced and released into the atmosphere by automobiles. Based on
the point of emission, pollutants fall broadly into two categories: tailpipe (or exhaust)
emissions (e.g. CO, HCs, NOx, PM) and evaporative emissions (e.g. VOCs). Tailpipe emissions
are produced as a by-product in the (imperfect) combustion of fuels to power the vehicle
and are released from the vehicle’s exhaust system. Evaporative emissions are produced as
a result of the evaporation of fuel due to heating of the vehicle or release of vapour while
refuelling.
There are four primary methods used to control tailpipe emissions: increasing engine
efficiency, treatment of emissions emitted, increasing vehicle efficiency, or increasing
driving efficiency. This paper is concerned only with innovations related to the former two
types of technologies, namely those that increase engine efficiency and those that involve
post-combustion devices. The latter two types of control methods depend on non-
technological aspects (e.g. driving techniques, levels of congestion) or on material
improvements (e.g. light-weighting, aerodynamic design). Consequently, these issues are
not considered here in this paper.
The type of pollutant and its volume are to a great extent determined by the type of
vehicle engine installed (e.g. spark-ignition and diesel engines) and the type of fuel it uses.
While the different types of engines require different control technologies, the approaches
can be broadly classified in two groups. Reductions in exhaust emissions can be achieved
by i) (re)designing the engine or by changing conditions under which combustion takes
place and ii) treating pollutants before they are released into the atmosphere (post-
combustion). It is important to note that the impacts of engine design are not always
exclusively environmental. For example, changes in engine design are often motivated by
the objective to increase engine power or improve fuel efficiency, while also reducing
exhaust emissions. Some emissions control requirements have also resulted in improved
fuel quality and fuel efficiency.
Post-combustion technologies allow reaction with and treatment of the remaining
emissions. Such technologies are an important component of emissions control strategies
because reductions in the amount of pollutants generated due to advances in engine
design, although continually improving, are generally considered insufficient to meet
OECD JOURNAL: ECONOMIC STUDIES – VOLUME 2009 – ISSN 1995-2848 – © OECD 2009 3

EFFECTS OF ENVIRONMENTAL POLICY ON THE TYPE OF INNOVATION: THE CASE OF AUTOMOTIVE EMISSION-CONTROL TECHNOLOGIES
emissions goals. Table 1 contains a summary of the technologies that are covered in the
analysis.3 We focus on technologies that are specific to automotive emissions control, and
for which well-defined patent classes exist. For a more extensive discussion see, for
instance, OECD (2004).
Patent counts
Patents and patent statistics have been widely used as indicators of inventive
performance of a firm or an economy (Griliches,1990 and OECD, 2008). Patent data
constitute a valuable source of information on the nature of the invention, containing
discrete records which are categorised in specific technological fields.
The World Intellectual Property Organisation’s (WIPO) International Patent
Classification (IPC) system4 is used to identify patent classes that match the automotive
emission-control technologies as described above. The full list of IPC codes that deal with
the purification of gases and emissions control in motor vehicles is given in the Appendix.
These codes are broadly categorised into the two major technology groups identified
above: 1) those that relate to improvements in engine (re)design; and 2) those that treat
pollutants after they are produced but before they are released into the atmosphere.
Data on patent applications deposited at the European Patent Office (EPO) were
extracted from the OECD Patent Database.5 The data were then used to construct patent
counts disaggregated by source country (country of origin of the inventor), priority year (the
earliest year of application within a given patent family), and technology type. When
interpreting the descriptive data it is important to bear the “home bias” in mind, with
(for instance) German inventors much more likely to apply to the EPO than Japanese or
US inventors.
Table 1. Automotive emission-control technologies covered
1. Integrated technologies
Air-fuel ratio devices Mechanical control systems that inject fresh air into the exhaust manifolds of the engine in orderto allow further combustion of exhaust gases (HC and CO), e.g. air injection reactors.
Oxygen, NOx and temperature sensors Provide feedback and increase competence of computerised control systems.
Fuel injection systems Inject fuel continuously through nozzles at each intake port, the rate of injection being controlledby varying the pressure supplied to the nozzles by an electric fuel pump. Sequential fuel injection systems fire at the optimal time during engine rotation and thus allow for better air-fuel mixturesand therefore better performance and fewer emissions.
Exhaust gas recirculation (EGR) valves Reduce NOx emissions by re-introducing exhaust gases into the fuel mixture and lowering exhaust temperatures.
Electronic control systems and plasma-based technologies
Measure the air-fuel ratio in the exhaust and control the ratio of air to fuel in the combustion mixture, as well as provide control of other features such as spark timing, exhaust gas recirculation, idle speed, air injection systems, and purging of evaporative canisters (e.g. on-board diagnostic (OBD) systems).
Crankcase emissions control Systems which include a crankcase vent port that requires closing the vent port and ventingthe crankcase emissions (the compressed gases that blow-by the piston rings in the crankcasemostly consisting of unburned or partly burned hydrocarbons) back into the air-intake system,instead of venting the blow-by gases into the atmosphere.
2. Post-combustion technologies
Catalytic converters and regeneration Devices placed in the exhaust systems capable of converting noxious emissions (CO, HCs and NOx) into harmless substances (carbon dioxide, nitrogen and water vapour). A catalytic converter consists of a substrate providing a large surface area (a ceramic support with a wash-coat of (usually) aluminum-oxide) which is then layered with the catalyst (noble metals, like platinum, palladium,and rhodium, either singly or in combination). Catalysts increase the reaction rate between oxygenand emissions present in the exhaust, whose chemical reaction is otherwise too slow.
OECD JOURNAL: ECONOMIC STUDIES – VOLUME 2009 – ISSN 1995-2848 – © OECD 20094

EFFECTS OF ENVIRONMENTAL POLICY ON THE TYPE OF INNOVATION: THE CASE OF AUTOMOTIVE EMISSION-CONTROL TECHNOLOGIES
Bearing this in mind, Figure 1 gives the aggregate patent counts for vehicle emission
control technologies for the 15 countries with the highest counts over the period 1978-2004
(> 50 in total). Japan and Germany have the highest counts, followed by the United States.
Canada has shown remarkable growth in recent years.
Figure 2 gives the same data by technology type, distinguishing between integrated
emission-control technologies and post-combustion technologies (catalytic converters).
Integrated technologies are more predominant, with the growth in recent years being very
marked, increasing from approximately 400 per year in the mid-1990s to over 1 000 more
recently. In recent years post-combustion technologies have represented 25%-30% of
the total.
Figure 1. EPO patent counts in automotive emissions control by countryof inventor (1978-2004)
Figure 2. EPO patent counts in automotive emissions control by type of technology (1978-2004)
197
8 1
979
1980
1981
1982
1983
1984
1985
1986
1987
1988
1989
1990
1991
1992
1993
1994
1995
1996
1997
1998
1999
2000
2001
2002
2003
2004
700
600
500
400
300
200
100
0
AustraliaItalyGermany
NetherlandsSwedenJapan
BelgiumAustriaUnited States
FinlandSwitzerlandFrance
DenmarkCanadaUnited Kingdom
1978 1980 1982 1984 1986 1988 1990 1992 1994 1996 1998 2000 2002 2004
1 200
1 000
800
600
400
200
0
Post-combustion abatement Integrated abatement
OECD JOURNAL: ECONOMIC STUDIES – VOLUME 2009 – ISSN 1995-2848 – © OECD 2009 5

EFFECTS OF ENVIRONMENTAL POLICY ON THE TYPE OF INNOVATION: THE CASE OF AUTOMOTIVE EMISSION-CONTROL TECHNOLOGIES
Factors determining patenting activity in automotive emissions controlA number of factors are likely to affect the rate and direction of innovation with
respect to automotive emissions control, including general macroeconomic conditions
(size and openness of an economy, integration in international trade) and general
propensity to patent (strength of intellectual property rights regimes, scientific and
research capacity). However, such factors affect patents in total and not specifically those
associated with emission-control technologies.
Fuel prices
For the period 1978-2006, the most important development in international energy
markets was the second oil supply shock in the late 1970s. Prices culminated at historic
heights in 1981, then dropped somewhat after that point. Oil prices in recent years have
been sufficiently high to consider present circumstances as representing a “third” oil
shock. Figure 3 gives the post-tax price of gasoline and diesel in Germany, Japan and the
United States.
Retail fuel prices have been substantially higher in Germany than in the US
throughout the 1978-2006 period, with Japan in-between. Unlike in the United States
where gasoline and diesel prices have been approximately equal during most of the period,
in Germany and Japan gasoline has been the relatively more expensive fuel compared with
diesel. This can affect the incentives for innovation in emission-control technologies. In
general, rising fuel prices provide incentives for increased fuel efficiency. This can affect
the rate of innovation with respect to emission-control technologies in general. More
specifically, emission control technologies which result in both increased fuel efficiency
and reduced emissions (e.g. on-board diagnostics) are likely to be relatively more attractive
than other technologies (e.g. catalytic converters).
Figure 3. Post-tax price of gasoline and diesel (2000 USD per litre using PPP)
Source: Own figure using data from IEA (2007).
1978 1980 1982 1984 1986 1988 1990 1992 1994 1996 1998 2000 2002 2004 2006
1.4
1.2
1.0
0.8
0.6
0.4
0.2
0
DE – Average of PDIESDE – Average of PGAS
JP – Average of PDIESJP – Average of PGAS
US – Average of PDIESUS – Average of PGAS
OECD JOURNAL: ECONOMIC STUDIES – VOLUME 2009 – ISSN 1995-2848 – © OECD 20096

EFFECTS OF ENVIRONMENTAL POLICY ON THE TYPE OF INNOVATION: THE CASE OF AUTOMOTIVE EMISSION-CONTROL TECHNOLOGIES
Environmental regulation in the automobile sector
There has been significant evolution in the key regulatory measures affecting the
automobile sector. Given the tradability of vehicles and the relative importance of the US,
Japanese and European markets we focus on regulations in these three regions. This
section provides a brief overview of the relevant legislation. For a more extensive
discussion of regulation and other strategies to reduce emissions from motor vehicles,
see OECD (2004), Hascic (2006), and De Vries and Medhi (2008).
Emission standards
In response to environmental regulations introduced by a number of countries in
the 1970s car manufacturers generally based their compliance strategies on the use of
catalytic converters. In the early 1980s, some car manufacturers applied three-way catalyst
in a closed-loop emissions control system using sophisticated electronic devices for
controlling engine functions, while others relied solely on the use of three-way catalyst
without these electronic devices (Bresnahan and Yao, 1985).
The standards applied in the United States have generally had a “technology-forcing”
character, with the introduction of performance standards that cannot be met with
existing technology and as such have not been demonstrated in practice (e.g. Gerard and
Lave, 2005). “Technology-following” standards are less strict, and can be met with existing
technology. It has been argued that European standards were primarily “technology-
following” (Faiz et al., 1996).
The United States established Tier I standards for HC and NOx emissions in 1994,
followed by Tier II standards in 2004.6 Relative to the initial levels in the early 1970s,
standards have become significantly more stringent. For example, compared with pre-
regulation levels, the 2004 standards represent a reduction of 97% for HC, 94% for NOx, and
95% for CO. Additional standards for particulate matter (PM) were implemented in 1994,
and are currently set at 0.08 g/mile.7
Japan introduced the Air Pollution Control Law in 1968. Subsequent standards set
in 1972 required a 90% reduction of CO and HC emissions by 1975 and a 90% reduction of
NOx emissions by 1976 (Zhu et al., 2006, p. 8). Japanese automobile regulations are also
embedded in the 1992 Motor Vehicle NOx law, which specified performance standards for
NOx emissions from in-use vehicles. More recently, in joint cooperation with the Japan
Automobile Manufacturers Association (JAMA) and the Petroleum Association of Japan
(PAJ), the Japan Clean Air Program (JCAP) was established in 1996 with the aim to improve
air quality. For diesel engines, the CO standard first coincided with the standard for
gasoline engines in the period 1986-1999, and became more stringent in 2002.8 The HC and
NOx standards for diesel have generally been less strict than the corresponding standards
for gasoline engines.9 Furthermore, PM standards for diesel came into effect after 1994 and
gradually changed from 0.23 g/km to 0.0135 g/km in 2005 – about a 94% reduction.
In the European Union, the basis for union-wide standards for automobile emissions is
laid down in Directive 70/220/EEC from 1970. The Directive specified the maximum limits for
CO and HC vehicle emissions. In subsequent decades, the stringency levels have been
increased through a series of amendments. For example, Directive 83/351/EEC imposed stricter
CO standards and introduced limits on the combined HC + NOx emissions; Directive 88/76/EEC
provided additional restrictions on NOx emissions separately; and Directive 89/441/EEC
introduced standards for PM emissions. The most important amendments have been those
OECD JOURNAL: ECONOMIC STUDIES – VOLUME 2009 – ISSN 1995-2848 – © OECD 2009 7

EFFECTS OF ENVIRONMENTAL POLICY ON THE TYPE OF INNOVATION: THE CASE OF AUTOMOTIVE EMISSION-CONTROL TECHNOLOGIES
termed Euro 1 – Euro 5. The 1992 Euro 1 performance standard required manufacturers to
install three-way catalytic converters in gasoline vehicles. Since the 1996 Euro 2, there have
been different standards for diesel and gasoline vehicles, both of which have become
progressively stricter as they progress from Euro 2 to Euro 5.
Table 2 summarises the development of standards for Japan, the United States and the
European Union for HC, CO and NOx for petrol-driven vehicles. In sum, comparing the
regulatory history of the three regions with respect to emission standards suggests that
whereas the US and the EU regulations show a more gradual adjustment towards higher
stringency levels, the Japanese standards were initially set at a relatively more stringent
level and then remained more-less constant for a longer period of time.10 The different
temporal patterns of regulatory tightening, as well as the EU experience with joint
standards for different pollutants (HC and NOx), may have some implications for the
nature of innovation.
Table 2. Changes in performance standards for petrol-driven vehicles1
United States Japan European Union
1975 CO (15.0), HC (1.5) and NOx (3.1) CO (2.1) and HC (0.25) CO (30.11) and HC (2.12)
1976 ▼ NOx (0.6)
1977 NOx (2.0) ▼
1978 NOx (0.25)
1979 ▼
1980 CO (7.0) and HC (0.41)
1981 CO (3.4) and NOx (1.0)
1982
1983 ▼
1984 CO (18.76) and HC + NOx (5.43)
1985
1986
1987
1988 ▼
1989 CO (7.40) and HC + NOx (1.97)
1990
1991 ▼
1992 CO (2.72) and HC + NOx (0.97)
1993 ▼
1994 HC (0.25) and NO x (0.4)
1995 ▼
1996 CO (2.2) and HC + N x (0.5)
1997
1998
1999 ▼ ▼
2000 CO (0.67), HC (0.08) and NOx (0.08) HC (0.2) and NOx (0.15)
2001
2002
2003
2004 ▼
2005 ▼ ▼ CO (1.0), HC (0.1) and NOx (0.08)
1. US standards in grams per mile and Japanese and European standards in grams per kilometre. Note, however, thatstandards are not strictly comparable, depending upon characteristics of test cycles used for permitting.
Source: Hascic (2006).
OECD JOURNAL: ECONOMIC STUDIES – VOLUME 2009 – ISSN 1995-2848 – © OECD 20098

EFFECTS OF ENVIRONMENTAL POLICY ON THE TYPE OF INNOVATION: THE CASE OF AUTOMOTIVE EMISSION-CONTROL TECHNOLOGIES
On-board diagnostic systems
In addition to the use of emission standards, public policy has increasingly focused on
the development and implementation of on-board diagnostic (OBD) systems. In general,
two generations of OBD systems can be distinguished. The OBD-I system makes use of
electronic means to diagnose engine problems and to control engine functions, such as
fuel and ignition. Sensors are also used to measure the performance of the engine as well
as the level of automotive emissions. In addition, the sensors are also helpful in providing
early diagnostic assistance (B&B Electronics 2005). The OBD-II systems are more
sophisticated and ensure that vehicles remain as “clean” as possible over their entire life
by monitoring and automatically adjusting vehicle emission performance (USEPA 2004).
In the United States, the first implementation of OBD requirements occurred in
California in 1988, and was implemented by the California Air Resources Board (CARB).
This system (OBD-I) had to be installed beginning with all 1988 model-year vehicles. The
requirements were particularly related to the control of fuel and ignition functions of the
vehicle. Induced by this first generation of OBD systems in California, the 1990 Clean Air
Act Amendments (CAAA) mandated the implementation of a more sophisticated and
expanded OBD system for the United Staes as a whole. This advanced (OBD-II) system,
developed by the Society of Automotive Engineers (SAE), became the basis for the legal
standard set by the US Environmental Protection Agency (USEPA). The 1990 CAAA
mandated that all light-duty vehicles and trucks built in 1996 and later are to be equipped
with an OBD-II system.
In Japan, OBD requirements ran more-or-less in parallel with Japan’s pursuit of a more
stringent environmental policy with respect to exhaust emissions which were introduced
in 2000. Since then, OBD requirements have also been explicitly mandated. However,
Japanese car manufacturers already produced vehicles equipped with OBD-II systems
since 1996, similar to the nation-wide implementation of OBD-II systems in the United
States, perhaps in order to gain overseas market share, a point discussed below.
In the EU, Directive 98/69/EC mandated the introduction of OBD systems for emission
control (Euro 3). Further OBD requirements were introduced in Directive 1999/96/EC which
states that “From 1 October 2005, new types of vehicles, and from 1 October 2006, all types
of vehicles, should be equipped with an OBD system or an On-Board Measurement (OBM)
system to monitor in-service exhaust emissions”.
In summary, the forerunner in the development and implementation of both OBD
legislation and OBD systems was the United States, which introduced the first generation of
OBD systems (OBD-I). At the federal level, the 1990 CAAA mandated the installation of the
more advanced OBD-II system as of 1996. Although Japan formally mandated the
implementation of OBD-II systems as of October 2000, Japanese automobile manufacturers
had already installed this type of system since 1996. European legislation on OBD systems,
included in Directive 1999/96/EC, lags behind the OBD policy implementation in both the
United States and Japan. The first EU-wide installation of OBD systems was required by 2005.
Regulation tailored to OBD systems differs in nature from regulation that is explicitly
directed towards reducing exhaust emissions. The “environmental” motivation for OBD
regulation seems to have a more “technology-following” character. For example, the
principal line of approach of OBD was on developing (general) improvements in engine
performance and engine design, rather than on reducing emissions per se. The latter
effects more-or-less came along with more advanced OBD systems. The policy implication
OECD JOURNAL: ECONOMIC STUDIES – VOLUME 2009 – ISSN 1995-2848 – © OECD 2009 9

EFFECTS OF ENVIRONMENTAL POLICY ON THE TYPE OF INNOVATION: THE CASE OF AUTOMOTIVE EMISSION-CONTROL TECHNOLOGIES
of this is that the public motivation for OBD regulation came into being once these systems
revealed their potential for environmental benefits, but only after they had already proven
to be useful for “non-environmental” reasons (i.e. enhanced performance and diagnostics).
This makes the nature of OBD regulation different from regulation mandating the
development and installation of catalytic converters. In the former case, there is a mix of
private and social benefits, while in the latter case, the benefits are exclusively social.
Whereas post-combustion devices only generate environmental benefits at the “end-of-
pipe”, the environmental benefits from OBD systems could be classified as being
complementary with other benefits, such as increased fuel efficiency and reduced
maintenance costs. As discussed in Labonne and Johnstone (2008), incentives for
innovation in the two cases will be very different, with implications for policy design.
General market and policy conditions
Aside from public policy and fuel prices there are, of course, other important
determinants of patenting activity for motor vehicle control technologies. Patent activity is
clearly a result, in part, of national scientific capacity and general expenditures on research
and development. In addition, the propensity of inventors from a particular country to
patent is likely to change over time, both because different strategies may be adopted to
capture the rents from innovation and because legal conditions may change through time.
As such, in the empirical model presented below, a variable was included reflecting overall
patent applications filed across the whole spectrum of technological areas. This variable
thus serves as a “trend” and “scale” variable in that it controls for the changes in general
propensity to patent over time and across countries.
Empirical model and resultsAn empirical model is developed in order to evaluate the effects of environmental policy
and other factors on patenting activity in the area of motor vehicle emissions. The following
reduced-form equation is specified:
[1]
where i indexes country and t indexes year. The dependent variable is measured by the
number of patent applications for integrated technologies (PAT-INTG) in one equation and
for post-combustion technologies (PAT-POST) in a second equation.11
Explanatory variables include a vector of proxies for regulatory performance standards
(STD), and for OBD (OBD) standards. Separate dummy variables are included for each of
three regions. These are assumed to have an impact on patent activity in all countries since
the market for motor vehicles is globalised and since these three regions represent a
significant share of the global market. Regulatory developments in these three regions are
likely to have an influence on inventors in all countries. However, differences in the
“regional” impacts of regulations introduced in one jurisdiction are examined in the
models estimated.
In addition, a variable reflecting domestic fuel prices was included. Since diesel and
gasoline prices are so highly correlated within countries, only the variable for gasoline
prices (GASPRICE) was used for the estimation. This varies across the whole panel. Various
lag lengths were tested, and in the best-fitting models presented below a lag of three years
is applied. Lags (and leads) were also tested for the regulatory measures but had no
tiitititititi TOTPATGASPRICEOBDSTDENVPAT ,,4,3,2,1,
OECD JOURNAL: ECONOMIC STUDIES – VOLUME 2009 – ISSN 1995-2848 – © OECD 200910
EFFECTS OF ENVIRONMENTAL POLICY ON THE TYPE OF INNOVATION: THE CASE OF AUTOMOTIVE EMISSION-CONTROL TECHNOLOGIES
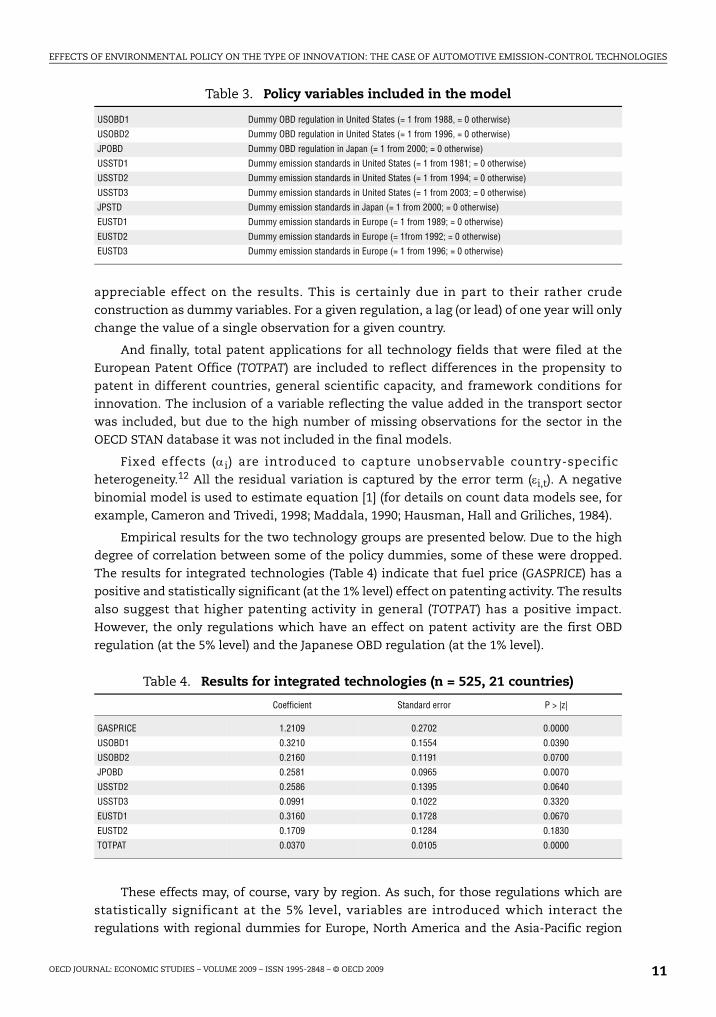
appreciable effect on the results. This is certainly due in part to their rather crude
construction as dummy variables. For a given regulation, a lag (or lead) of one year will only
change the value of a single observation for a given country.
And finally, total patent applications for all technology fields that were filed at the
European Patent Office (TOTPAT) are included to reflect differences in the propensity to
patent in different countries, general scientific capacity, and framework conditions for
innovation. The inclusion of a variable reflecting the value added in the transport sector
was included, but due to the high number of missing observations for the sector in the
OECD STAN database it was not included in the final models.
Fixed effects (i) are introduced to capture unobservable country-specific
heterogeneity.12 All the residual variation is captured by the error term (i,t). A negative
binomial model is used to estimate equation [1] (for details on count data models see, for
example, Cameron and Trivedi, 1998; Maddala, 1990; Hausman, Hall and Griliches, 1984).
Empirical results for the two technology groups are presented below. Due to the high
degree of correlation between some of the policy dummies, some of these were dropped.
The results for integrated technologies (Table 4) indicate that fuel price (GASPRICE) has a
positive and statistically significant (at the 1% level) effect on patenting activity. The results
also suggest that higher patenting activity in general (TOTPAT) has a positive impact.
However, the only regulations which have an effect on patent activity are the first OBD
regulation (at the 5% level) and the Japanese OBD regulation (at the 1% level).
These effects may, of course, vary by region. As such, for those regulations which are
statistically significant at the 5% level, variables are introduced which interact the
regulations with regional dummies for Europe, North America and the Asia-Pacific region
Table 3. Policy variables included in the model
USOBD1 Dummy OBD regulation in United States (= 1 from 1988, = 0 otherwise)
USOBD2 Dummy OBD regulation in United States (= 1 from 1996, = 0 otherwise)
JPOBD Dummy OBD regulation in Japan (= 1 from 2000; = 0 otherwise)
USSTD1 Dummy emission standards in United States (= 1 from 1981; = 0 otherwise)
USSTD2 Dummy emission standards in United States (= 1 from 1994; = 0 otherwise)
USSTD3 Dummy emission standards in United States (= 1 from 2003; = 0 otherwise)
JPSTD Dummy emission standards in Japan (= 1 from 2000; = 0 otherwise)
EUSTD1 Dummy emission standards in Europe (= 1 from 1989; = 0 otherwise)
EUSTD2 Dummy emission standards in Europe (= 1from 1992; = 0 otherwise)
EUSTD3 Dummy emission standards in Europe (= 1 from 1996; = 0 otherwise)
Table 4. Results for integrated technologies (n = 525, 21 countries)
Coefficient Standard error P > |z|
GASPRICE 1.2109 0.2702 0.0000
USOBD1 0.3210 0.1554 0.0390
USOBD2 0.2160 0.1191 0.0700
JPOBD 0.2581 0.0965 0.0070
USSTD2 0.2586 0.1395 0.0640
USSTD3 0.0991 0.1022 0.3320
EUSTD1 0.3160 0.1728 0.0670
EUSTD2 0.1709 0.1284 0.1830
TOTPAT 0.0370 0.0105 0.0000
OECD JOURNAL: ECONOMIC STUDIES – VOLUME 2009 – ISSN 1995-2848 – © OECD 2009 11

EFFECTS OF ENVIRONMENTAL POLICY ON THE TYPE OF INNOVATION: THE CASE OF AUTOMOTIVE EMISSION-CONTROL TECHNOLOGIES
and likelihood-ratio tests are conducted to determine the statistical significance of the
model relative to the restricted case in which the impacts are assumed to be equal across
regions. The results are presented below, and indicate that the OBD1 regulations had a
greater impact in Europe and Asia-Pacific than in North America itself. This may reflect the
fact that the American car sector had anticipated (and perhaps influenced) the regulation
prior to its introduction. The regulation came as more of a “shock” to foreign manufacturers.
However, it should be noted that the regional interaction terms are not statistically different
from one another. The Japanese OBD regulations (which came later) did not affect innovation
in the North American market, but did have a positive and significant influence on
innovation in the European and Asia-Pacific market.
Contrary to the above, the estimates given in Table 6 suggest that innovation for post-
combustion technologies is primarily driven by environmental policy shocks. The
coefficient for the price of gasoline is not significant. The coefficients of a number of
regulatory standards (USSTD3, EUSTD1 and (almost) EUSTD2) are significant at the 5%
level. The second US OBD regulation is also significant. Interestingly, in this case the
variable TOTPAT is not significant, indicating that determinants of innovation for post-
combustion technologies are distinct from the general determinants of innovation.
As with the previous case, region-specific interaction terms are introduced for those
regulations which are significant at the 5% level. In this case the USOBD2 regulations affect
innovation in Europe and Asia-Pacific, but not North America itself. The effects in the
European and North American market are not statistically different. This may be for
reasons similar to those hypothesised above concerning the effects of the
Table 5. Results for integrated technologies with regional interactions
Coefficient Standard error P > |z|
GASPRICE 0.8753 0.2625 0.0010
EU_USOBD1 0.8101 0.1035 0.0000
NA_USOBD1 0.4965 0.2014 0.0140
AP_USOBD1 0.7581 0.1983 0.0000
EU_JPOBD 0.6665 0.0838 0.0000
NA_JPOBD –0.0843 0.1887 0.6550
AP_JPOBD 0.4436 0.1703 0.0090
TOTPAT 0.0758 0.0115 0.0000
Table 6. Estimation results for post-combustion technologies(n = 500, 20 countries)
Coefficient Standard error P>|z|
GASPRICE –0.3367 0.3105 0.2780
USOBD1 0.3651 0.2036 0.0730
USOBD2 0.2925 0.1223 0.0170
JPOBD 0.1421 0.0992 0.1520
USSTD2 0.1875 0.1434 0.1910
USSTD3 0.3039 0.1067 0.0040
EUSTD1 0.6267 0.2132 0.0030
EUSTD2 0.2682 0.1377 0.0510
TOTPAT 0.0142 0.0116 0.2200
OECD JOURNAL: ECONOMIC STUDIES – VOLUME 2009 – ISSN 1995-2848 – © OECD 200912

EFFECTS OF ENVIRONMENTAL POLICY ON THE TYPE OF INNOVATION: THE CASE OF AUTOMOTIVE EMISSION-CONTROL TECHNOLOGIES
USOBD1 regulations on more integrated forms of innovation. The USSTD3 only affects
innovation in post-combustion technologies in Asia-Pacific, while the EUSTD2 regulations
affect innovation in both Europe and Asia-Pacific, but the regional interaction terms are not
statistically different from one another. It is only the 1989 EU standards (EUSTD1) which
impact all three regions. The differences in the coefficients between the three regions are
statistically different from one another.
ConclusionsSome innovations yield both private and public benefits (e.g. on-board diagnostics or
fuel injection), while others yield only public benefits (e.g. catalytic converters). As such, one
would expect to find that different factors are determinant in inducing innovation in the two
cases. Drawing upon patent data, an analysis of patent activity in a cross-section of OECD
countries for the period 1978-2005 was undertaken. On the one hand, it is clear that “foreign”
regulations have a significant impact on domestic innovation. For a globalised industry such
as the car market this is hardly surprising. However, the finding that foreign regulations can
have a greater influence on domestic innovation than domestic regulations is, perhaps,
surprising. This might be explained by the important role played by “home” manufacturers
in the development of domestic regulations. Since such measures are anticipated (and
perhaps influenced) by domestic manufacturers to a greater extent than foreign
manufacturers, the introduction of the regulation is not as much of a policy “shock”, and its
effect cannot be captured by a dummy variable of the kind used in this study.
On the other hand, in terms of the links between policy design and the nature of
innovation induced, our results largely confirm our hypotheses. “Integrated” innovations
which capture both private and public benefits are determined by gasoline prices and those
policies which sought to encourage the use of technologies which yield both types of
benefit. In addition, the general determinants of innovation in the economy (as proxied by
total patent counts) are positively correlated with integrated innovations. Conversely, in
the case of post-combustion technologies, it is primarily regulatory standards which drive
innovation. Gasoline prices and the general rate of innovation have little influence. In
effect, innovation efforts with respect to the attainment of environmental objectives are
“hived off” from the influence of more general economic factors.
Table 7. Results for post-combustion technologies with regional interactions
Coefficient Standard error P > |z|
GASPRICE 0.3101 0.3115 0.3200
EU_USOBD2 0.4420 0.0955 0.0000
NA_USOBD2 –0.2035 0.1645 0.2160
AP_USOBD2 0.3884 0.1480 0.0090
EU_USSTD3 0.1596 0.0990 0.1070
NA_USSTD3 –0.0329 0.1568 0.8340
AP_USSTD3 0.4485 0.1315 0.0010
EU_EUSTD1 0.9069 0.1439 0.0000
NA_EUSTD1 0.5828 0.2046 0.0040
AP_EUSTD1 1.6338 0.2381 0.0000
EU_EUSTD2 0.2743 0.1213 0.0240
NA_EUSTD2 0.3079 0.1875 0.1010
AP_EUSTD2 0.5826 0.1789 0.0010
TOTPAT 0.0479 0.0096 0.0000
OECD JOURNAL: ECONOMIC STUDIES – VOLUME 2009 – ISSN 1995-2848 – © OECD 2009 13

EFFECTS OF ENVIRONMENTAL POLICY ON THE TYPE OF INNOVATION: THE CASE OF AUTOMOTIVE EMISSION-CONTROL TECHNOLOGIES
What does this mean for environmental policy? Firstly, the finding that environmental
policies have an impact on innovation is hardly surprising. Whether through
environmental taxes (as reflected in fuel prices) or standards, the shadow price of polluting
(and not innovating in a manner which reduces pollution) will have risen. Clearly, while
such innovation may reduce the costs of meeting given environmental objectives, this does
not imply that such standards are socially optimal. Forcing excessive innovation through
standards or taxes might actually reduce social welfare.
However, if it is possible to meet environmental objectives in a manner which allows
(at least partly) for the realisation of private commercial objectives, the cost of
environmental improvements is reduced. Whether or not firms are able to implement
technologies which allow for this is dependent in part upon the regulatory framework.
Prescriptive regulations which restrict the potential for manufacturers to exploit such
synergies are likely to be more costly than would otherwise be the case. As such, the
finding that innovation in integrated abatement technologies has been influenced by
gasoline prices, general innovation capacity, as well as environmental regulations, is
significant. In order to minimise the cost of the realisation of given environmental
objectives it is important that regulations allow for innovation which can realise multiple
(public and private) objectives. Whether or not “flexible” regulations are implemented will
depend, of course, in large part upon the administrative costs of doing so. The widespread
use of prescriptive standards is in part a reflection of the costs of monitoring emissions
from mobile sources.
Notes
1. In the United States, Europe and Japan the contribution of road transport to CO emissions is 61%,42% and 36%, respectively; the corresponding figures for NOx emissions are 38%, 40% and 28%(OECD 2007).
2. In the United States, Europe and Japan the contribution of road transport to HC emissions is 25%,20% and 6%, respectively; the corresponding figures for PM emissions in the United States andEurope are 3% and 17% (OECD 2007).
3. In general, abating pollution from vehicles must target both tailpipe as well as gas tank venting.While tailpipe emissions result from the combustion process, evaporative emissions can resulteven when the engine is idle. Technologies to control evaporative emissions require additionalmodifications, which are not necessarily related to engine design (e.g. capturing of vented vapoursfrom within the vehicle, reducing refueling emissions). However, due to limitations in the patentclassification system, this paper does not consider separately technologies which targetevaporative emissions.
4. For further details on the latest, 8th edition, of the IPC see www.wipo.int/classifications/ipc/ipc8.
5. See www.oecd.org/sti/ipr-statistics.
6. Tier 2 for light-duty vehicles (cars and light trucks) was fully phased in by 2007. Heavy light-dutytrucks will be fully phased in by 2009.
7. The NOx standards for diesel engines are the same as the standards that apply to gasoline, withthe exception of the period since 1994. From that time on, diesel standards are a bit more lenient(1.0 g/mile for diesel versus 0.4 g/mile for gasoline). As of 1994, PM standards for gasoline have beenset at 0.08 g/mile.
8. The diesel standard was tightened from 2.1 g/km to 0.63 g/km, compared with 0.67 g/km forgasoline engines.
9. The exception is in 2005 when the HC standard for diesel became more strict (0.024 g/km for dieselversus 0.05 g/km for gasoline).
10. On the other hand, prior to reaching the standards that were in place as of 1975, Japan graduallyset more stringent CO, HC and NOx standards for gasoline vehicles in the period 1965-1975.
OECD JOURNAL: ECONOMIC STUDIES – VOLUME 2009 – ISSN 1995-2848 – © OECD 200914

EFFECTS OF ENVIRONMENTAL POLICY ON THE TYPE OF INNOVATION: THE CASE OF AUTOMOTIVE EMISSION-CONTROL TECHNOLOGIES
11. While it might be supposed that the European market can be treated as a single entity, correlationsbetween the dependent variables (patent counts) and the principal explanatory variables(e.g. gasoline prices) are no higher within Europe than between European countries and NorthAmerican or Asia-Pacific countries.
12. Including value added in the transport sector.
Bibliography
B&B Electronics, 2005, OBD-II background information (www.obdii.com/background.html).
Bresnahan, T.F. and D.A. Yao (1985), “The Non-pecuniary Costs of Automobile Emissions Standards”,RAND Journal of Economics 16, pp. 437-455.
Brunnermeier, S.B. and M.A. Cohen (2003), “Determinants of Environmental Innovation in the USManufacturing Industries”, Journal of Environmental Economics and Management 45, pp. 278-293.
Cameron. A.C. and P.K. Trivedi (1998), Regression Analysis of Count Data, Cambridge University Press,Cambridge; New York.
Crabb, J.M. and D.K.N Johnson (2007), “Fueling the Innovation Process: Oil Prices and InducedInnovation in Automotive Energy-Efficient Technology”, Working Paper 2007-04, Department ofEconomics and Business, Colorado College, Colorado Springs, United States, May.
Faiz, A., C.S. Weaver and M.P. Walsh (1996), “Air Pollution from Motor Vehicles: Standards andTechnologies for Controlling Emissions”, World Bank, Washington, D.C.
Gerard, D. and L.B. Lave (2005), “Implementing Technology-forcing Policies: the 1970 Clean Air ActAmendments and the Introduction of Advanced Automotive Emissions Controls in the UnitedStates”, Technological Forecasting and Social Change 72, pp. 761-778.
Griliches, Z. (1990), “Patent Statistics as Economic Indicators: A Survey”, Journal of Economic Literature28, pp. 1661-1707.
Hascic, I. (2006), “Regulation of Automotive Emissions in the EU, Japan and the US”, OECD EnvironmentDirectorate, memo.
Hausman J., B.H. Hall and Z. Griliches (1984), “Econometric Models for Count Data with an Applicationto the Patents-R&D Relationship”, Econometrica 52, pp. 909-938.
IEA (International Energy Agency) (2004), Oil Crises and Climate Challenges: 30 Years of Energy Use in IEACountries, IEA, Paris, France.
IEA (International Energy Agency) (2007), Energy Prices and Taxes Data Service, IEA, Paris, France (http://data.iea.org).
Jaffe, A.B. and K. Palmer (1997), “Environmental Regulation and Innovation: A Panel Data Study”,Review of Economics and Statistics 79, pp. 610-619.
Johnstone, N., I. Hascic and D. Popp (2008), “Renewable Energy Policies and Technological Innovation:Evidence Based on Patent Counts”, NBER Working Paper 13760.
Labonne, J. and N. Johnstone (2008), “Environmental Policy and Economies of Scope in Facility-LevelEnvironmental Practices”, Environmental Economics and Policy Studies (forthcoming) – working paperversion available at http://papers.ssrn.com/sol3/papers.cfm?abstract_id=1035661.
Lanjouw, J.O. and A. Mody (1996), “Innovation and the International Diffusion of EnvironmentallyResponsive Technology”, Research Policy 25, pp. 549-571.
Maddala, G.S. (1983), Limited-dependent and Qualitative Variables in Econometrics, Cambridge UniversityPress, Cambridge, U.K.
OECD (2004), Can Cars Come Clean? Strategies for Low-emission Vehicles, OECD, Paris.
OECD (2007), OECD Environmental Data: Compendium 2006/2007, OECD, Paris.
OECD (2008), OECD Patent Statistics Manual, OECD, Paris.
Popp, D. (2002), “Induced Innovation and Energy Prices”, The American Economic Review 92, pp. 160-180.
Popp, D. (2003), “Pollution Control Innovations and the Clean Air Act of 1990”, Journal of Policy Analysisand Management Vol. 22, No. 4, pp. 641-660.
OECD JOURNAL: ECONOMIC STUDIES – VOLUME 2009 – ISSN 1995-2848 – © OECD 2009 15

EFFECTS OF ENVIRONMENTAL POLICY ON THE TYPE OF INNOVATION: THE CASE OF AUTOMOTIVE EMISSION-CONTROL TECHNOLOGIES
Popp, D. (2006), “International Innovation and Diffusion of Air Pollution Control Technologies: theEffects of NOx and SO2 Regulation in the US, Japan and Germany”, Journal of Environmental Economicsand Management 51(1), pp. 46-71.
Popp, D., T. Hafner and N. Johnstone (2007), “Policy vs. Consumer Pressure: Innovation and Diffusion ofAlternative Bleaching Technologies in the Pulp Industry”, NBER Working Paper #13439.
Taylor, M.R., E.S. Rubin and D.D. Hounshell (2003), “Effect of Government Actions on TechnologicalInnovations for SO2 Control”, Environmental Science and Technology 37, pp. 4527-4534.
USEPA (2004), On-board Diagnostics – Basic Information (www.epa.gov/orcdizux/regs/im/obd/basic.htm).
De Vries, F.P. and C. Withagen (2005), “Innovation and Environmental Stringency: The Case of SulfurDioxide Abatement”, CentER Discussion Paper #2005-18, Tilburg University.
De Vries, F.P. and N. Medhi (2008), “Environmental Regulation and International Innovation inAutomotive Emissions Control Technologies”, in Environmental Policy, Technological Innovation andPatents (OECD).
Zhu, Y., A. Takeishi and S. Yonekura (2006), “The Timing of Technological Innovation: the Case ofAutomotive Emission Control in the 1970s”, Institute of Innovation Research Working PaperNo. 076-05, Hitotsubashi University, Tokyo, Japan.
OECD JOURNAL: ECONOMIC STUDIES – VOLUME 2009 – ISSN 1995-2848 – © OECD 200916

EFFECTS OF ENVIRONMENTAL POLICY ON THE TYPE OF INNOVATION: THE CASE OF AUTOMOTIVE EMISSION-CONTROL TECHNOLOGIES
APPENDIX I
List of Selected IPC Patent Classes Relevantfor Automotive Emissions Control
Table A1. Integrated technologies: Improved engine designor engine redesign
Air-fuel ratio devices
F01N 3/05 Exhaust or silencing apparatus having means for purifying, rendering innocuous, or otherwise treating exhaust by meansof air e.g. by mixing exhaust with air.
F02M 67/00+ Apparatus in which fuel-injection is effected by means of high-pressure gas, the gas carrying the fuel into working cylindersof the engine, e.g. air-injection type.
F02M 23/00+ Apparatus for adding secondary air to fuel-air mixture.
F02M 25/00+ Engine-pertinent apparatus for adding non-fuel substances or small quantities of secondary fuel to combustion-air, main fuel,or fuel-air mixture.
F02M 3/00-04 Idling devices
Oxygen, NOx and temperature sensors
F01N 11/00+ Monitoring or diagnostic devices for exhaust-gas treatment apparatus
F02D 41/14 Electrical control of supply of combustible mixture or its constituents (introducing closed-loop corrections).
Fuel injection systems
F02M 39/00+ Arrangements of fuel-injection apparatus with respect to engines; Pump drives adapted top such arrangements
F02M 41/00+ Fuel-injection apparatus with two or more injectors fed from a common pressure-source sequentially by meansof a distributor
F02M 43/00+ Fuel-injection apparatus operating simultaneously on two or more fuels or on a liquid fuel and another liquid,e.g. the other liquid being an anti-knock additive
F02M 45/00+ Fuel-injection apparatus characterised by having a cyclic delivery of specific time/pressure or time/quantity relationship
F02M 47/00+ Fuel-injection apparatus operated cyclically with fuel-injection valves actuated by fluid pressure
F02M 49/00+ Fuel-injection apparatus in which injection pumps are driven, or injectors are actuated, by the pressure in engine working cylinders, or by impact of engine working piston
F02M 53/00+ Fuel-injection apparatus characterised by having heating, cooling, or thermally-insulating means
F02M 55/00+ Fuel-injection apparatus characterised by their fuel conduits or their venting means
F02M 57/00+ Fuel injectors combined or associated with other devices
F02M 59/00+ Pumps specially adapted for fuel-injection and not provided for in groups F02M 39/00 to F02M 57/00
F02M 61/00+ Fuel injection not provided for in groups F02M 39/00 to F02M 57/00
F02M 69/00+ Low-pressure fuel-injection apparatus
F02M 71/00+ Combinations of carburettors and low-pressure fuel-injection apparatus
Exhaust Gas Recirculation (EGR) valves
F01N 5/00+ Exhaust or silencing apparatus combined or associated with devices profiting by exhaust energy
OECD JOURNAL: ECONOMIC STUDIES – VOLUME 2009 – ISSN 1995-2848 – © OECD 2009 17

EFFECTS OF ENVIRONMENTAL POLICY ON THE TYPE OF INNOVATION: THE CASE OF AUTOMOTIVE EMISSION-CONTROL TECHNOLOGIES
Electronic control systems and plasma-based technologies
F02D 41/00+ Electrical control of combustion engines; Electrical control of supply of combustible mixture or its constituents
F02D 43/00+ Conjoint electrical control of two or more functions, e.g. ignition, fuel-air mixture, recirculation, supercharging,exhaust-gas treatment
F02D 45/00+ Electrical control not provided for in groups F02D 41/00 to F02D 43/00
F02M 51/00+ Fuel injection apparatus characterised by being operated electrically
F01N 9/00+ Electrical control of exhaust gas treating apparatus
Crankcase emissions and control
F01M 13/04 Crankcase ventilating or breathing: having means of purifying air before leaving crankcase, e.g. removing oil
Table A2. Post-combustion devices
Catalytic converters, lean NOx catalysts, NOx absorbers, catalytic regeneration technology
F01N 3/08-34 Exhaust or silencing apparatus having means for purifying, rendering innocuous, or otherwise treating exhaust; for rendering innocuous by thermal or catalytic conversion of noxious components of exhaust
B01D 53/92-96 Separation of gases or vapours; Recovering vapours of volatile solvents from gases; Chemical or biological purification of engine exhaust gases; Regeneration, reactivation or recycling of reactants.
B01J 23/40-46 Catalysts comprising metals or metal oxides or hydroxides; of the platinum group metals
Table A1. Integrated technologies: Improved engine designor engine redesign (cont.)
OECD JOURNAL: ECONOMIC STUDIES – VOLUME 2009 – ISSN 1995-2848 – © OECD 200918