
Effects of Central American Mountains on the Eastern...
18
Effects of Central American Mountains on the Eastern Pacific Winter ITCZ and Moisture Transport* HAIMING XU International Pacific Research Center, University of Hawaii at Manoa, Honolulu, Hawaii, and Department of Atmospheric Sciences, Nanjing University of Information Science and Technology, Nanjing, China SHANG-PING XIE AND YUQING WANG International Pacific Research Center, and Department of Meteorology, University of Hawaii at Manoa, Honolulu, Hawaii R. JUSTIN SMALL International Pacific Research Center, University of Hawaii at Manoa, Honolulu, Hawaii (Manuscript received 9 June 2004, in final form 5 February 2005) ABSTRACT The intertropical convergence zone (ITCZ) is displaced to the south edge of the eastern Pacific warm pool in boreal winter, instead of being collocated. A high-resolution regional climate model is used to investigate the mechanism for this displaced ITCZ. Under the observed sea surface temperature (SST) and lateral boundary forcing, the model reproduces the salient features of eastern Pacific climate in winter, including the southward displaced ITCZ and gap wind jets off the Central American coast. As the northeast trades impinge on the mountains of Central America, subsidence prevails off the Pacific coast, pushing the ITCZ southward. Cold SST patches induced by three gap wind jets have additional effects of keeping the ITCZ away from the coast. In an experiment in which both the Central American mountains and their effect on SST are removed, the ITCZ shifts considerably northward to cover much of the eastern Pacific warm pool. The Central American mountains are considered important to freshwater transport from the Atlantic to the Pacific Ocean, which in turn plays a key role in global ocean thermohaline circulation. The results of this study show that this transport across Central America is not very sensitive to the fine structure of the orography because the increased flow in the mountain gaps in a detailed topography run tends to be compensated for by broader flow in a smoothed topography run. Implications for global climate modeling are discussed. 1. Introduction The sea surface temperature (SST) exerts a strong influence on tropical deep convection: there is an em- pirical threshold of SST—a necessary but not sufficient condition—for atmospheric convection at 26°–27°C (e.g., Gadgil et al. 1984; Graham and Barnett 1987; Waliser and Graham 1993; Lau et al. 1997). This tight coupling between SST and convection allows strong in- teractions of the ocean and the atmosphere, playing an important role in shaping the tropical climate and its seasonal and interannual variations. This coupling is an important observational fact on which recent rapid progress in understanding tropical climate variability builds (see the review in C. Wang et al. 2004). The SST–convection coupling is particularly strong over the eastern Pacific Ocean where strong gradients in SST and atmospheric sea level pressure (SLP) force low-level moisture convergence toward the SST maxi- * International Pacific Research Center Contribution Number 314 and School of Ocean and Earth Science and Technology Con- tribution Number 6556. Corresponding author address: Dr. Haiming Xu, IPRC/SOEST, University of Hawaii at Manoa, 2525 Correa Rd., Honolulu, HI 96822. E-mail: [email protected] 3856 JOURNAL OF CLIMATE VOLUME 18 © 2005 American Meteorological Society JCLI3497
-
Upload
trinhduong -
Category
Documents
-
view
216 -
download
0
Transcript of Effects of Central American Mountains on the Eastern...

Effects of Central American Mountains on the Eastern Pacific Winter ITCZ andMoisture Transport*
HAIMING XU
International Pacific Research Center, University of Hawaii at Manoa, Honolulu, Hawaii, and Department of Atmospheric Sciences,Nanjing University of Information Science and Technology, Nanjing, China
SHANG-PING XIE AND YUQING WANG
International Pacific Research Center, and Department of Meteorology, University of Hawaii at Manoa, Honolulu, Hawaii
R. JUSTIN SMALL
International Pacific Research Center, University of Hawaii at Manoa, Honolulu, Hawaii
(Manuscript received 9 June 2004, in final form 5 February 2005)
ABSTRACT
The intertropical convergence zone (ITCZ) is displaced to the south edge of the eastern Pacific warmpool in boreal winter, instead of being collocated. A high-resolution regional climate model is used toinvestigate the mechanism for this displaced ITCZ. Under the observed sea surface temperature (SST) andlateral boundary forcing, the model reproduces the salient features of eastern Pacific climate in winter,including the southward displaced ITCZ and gap wind jets off the Central American coast. As the northeasttrades impinge on the mountains of Central America, subsidence prevails off the Pacific coast, pushing theITCZ southward. Cold SST patches induced by three gap wind jets have additional effects of keeping theITCZ away from the coast. In an experiment in which both the Central American mountains and their effecton SST are removed, the ITCZ shifts considerably northward to cover much of the eastern Pacific warmpool.
The Central American mountains are considered important to freshwater transport from the Atlantic tothe Pacific Ocean, which in turn plays a key role in global ocean thermohaline circulation. The results of thisstudy show that this transport across Central America is not very sensitive to the fine structure of theorography because the increased flow in the mountain gaps in a detailed topography run tends to becompensated for by broader flow in a smoothed topography run. Implications for global climate modelingare discussed.
1. Introduction
The sea surface temperature (SST) exerts a stronginfluence on tropical deep convection: there is an em-pirical threshold of SST—a necessary but not sufficient
condition—for atmospheric convection at 26°–27°C(e.g., Gadgil et al. 1984; Graham and Barnett 1987;Waliser and Graham 1993; Lau et al. 1997). This tightcoupling between SST and convection allows strong in-teractions of the ocean and the atmosphere, playing animportant role in shaping the tropical climate and itsseasonal and interannual variations. This coupling is animportant observational fact on which recent rapidprogress in understanding tropical climate variabilitybuilds (see the review in C. Wang et al. 2004).
The SST–convection coupling is particularly strongover the eastern Pacific Ocean where strong gradientsin SST and atmospheric sea level pressure (SLP) forcelow-level moisture convergence toward the SST maxi-
* International Pacific Research Center Contribution Number314 and School of Ocean and Earth Science and Technology Con-tribution Number 6556.
Corresponding author address: Dr. Haiming Xu, IPRC/SOEST,University of Hawaii at Manoa, 2525 Correa Rd., Honolulu, HI96822.E-mail: [email protected]
3856 J O U R N A L O F C L I M A T E VOLUME 18
© 2005 American Meteorological Society
JCLI3497
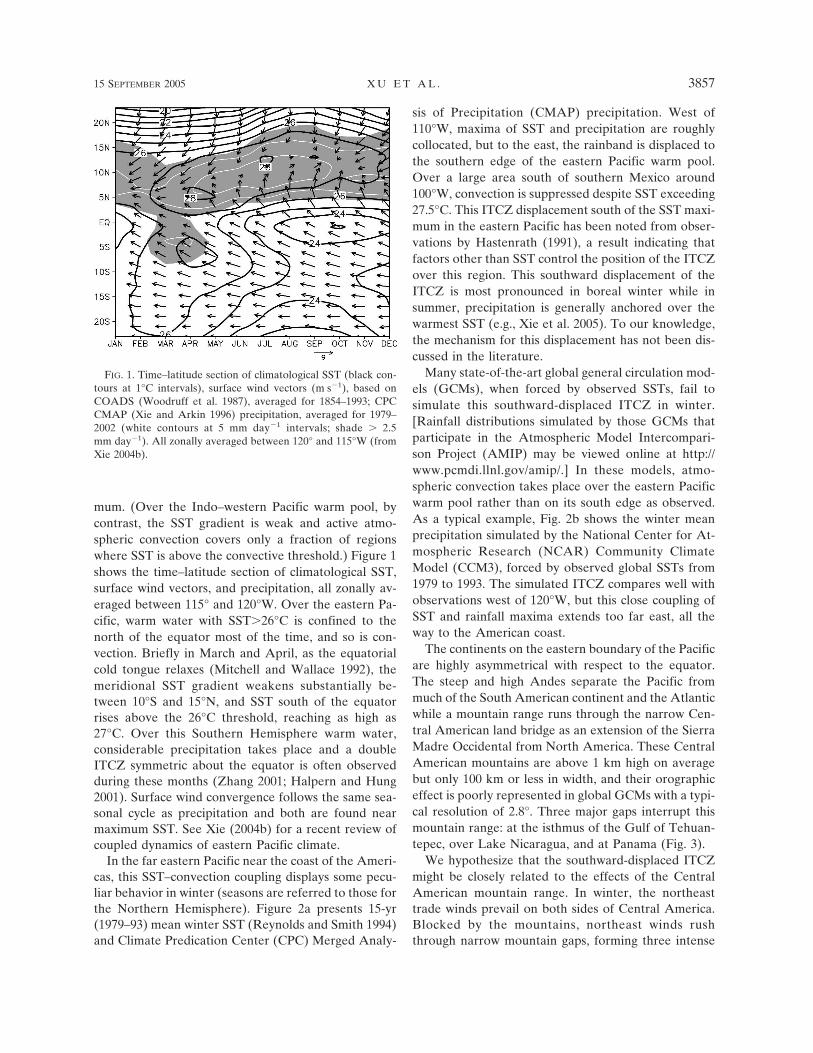
mum. (Over the Indo–western Pacific warm pool, bycontrast, the SST gradient is weak and active atmo-spheric convection covers only a fraction of regionswhere SST is above the convective threshold.) Figure 1shows the time–latitude section of climatological SST,surface wind vectors, and precipitation, all zonally av-eraged between 115° and 120°W. Over the eastern Pa-cific, warm water with SST�26°C is confined to thenorth of the equator most of the time, and so is con-vection. Briefly in March and April, as the equatorialcold tongue relaxes (Mitchell and Wallace 1992), themeridional SST gradient weakens substantially be-tween 10°S and 15°N, and SST south of the equatorrises above the 26°C threshold, reaching as high as27°C. Over this Southern Hemisphere warm water,considerable precipitation takes place and a doubleITCZ symmetric about the equator is often observedduring these months (Zhang 2001; Halpern and Hung2001). Surface wind convergence follows the same sea-sonal cycle as precipitation and both are found nearmaximum SST. See Xie (2004b) for a recent review ofcoupled dynamics of eastern Pacific climate.
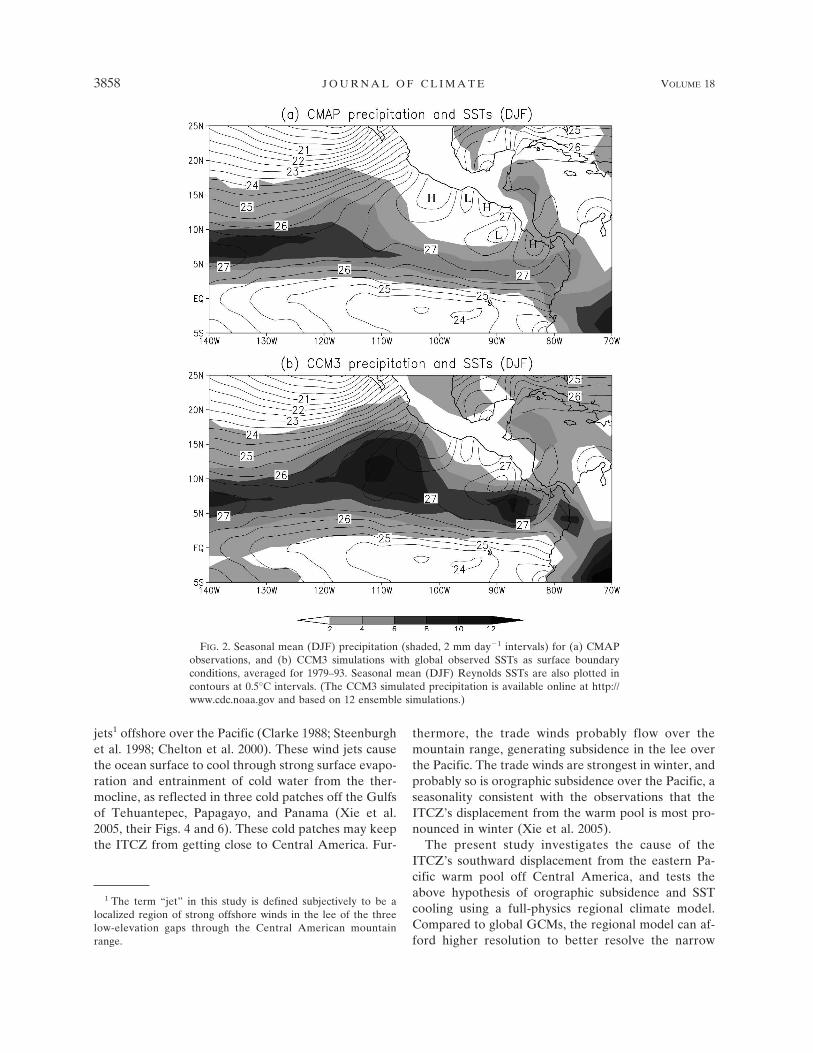
In the far eastern Pacific near the coast of the Ameri-cas, this SST–convection coupling displays some pecu-liar behavior in winter (seasons are referred to those forthe Northern Hemisphere). Figure 2a presents 15-yr(1979–93) mean winter SST (Reynolds and Smith 1994)and Climate Predication Center (CPC) Merged Analy-
sis of Precipitation (CMAP) precipitation. West of110°W, maxima of SST and precipitation are roughlycollocated, but to the east, the rainband is displaced tothe southern edge of the eastern Pacific warm pool.Over a large area south of southern Mexico around100°W, convection is suppressed despite SST exceeding27.5°C. This ITCZ displacement south of the SST maxi-mum in the eastern Pacific has been noted from obser-vations by Hastenrath (1991), a result indicating thatfactors other than SST control the position of the ITCZover this region. This southward displacement of theITCZ is most pronounced in boreal winter while insummer, precipitation is generally anchored over thewarmest SST (e.g., Xie et al. 2005). To our knowledge,the mechanism for this displacement has not been dis-cussed in the literature.
Many state-of-the-art global general circulation mod-els (GCMs), when forced by observed SSTs, fail tosimulate this southward-displaced ITCZ in winter.[Rainfall distributions simulated by those GCMs thatparticipate in the Atmospheric Model Intercompari-son Project (AMIP) may be viewed online at http://www.pcmdi.llnl.gov/amip/.] In these models, atmo-spheric convection takes place over the eastern Pacificwarm pool rather than on its south edge as observed.As a typical example, Fig. 2b shows the winter meanprecipitation simulated by the National Center for At-mospheric Research (NCAR) Community ClimateModel (CCM3), forced by observed global SSTs from1979 to 1993. The simulated ITCZ compares well withobservations west of 120°W, but this close coupling ofSST and rainfall maxima extends too far east, all theway to the American coast.
The continents on the eastern boundary of the Pacificare highly asymmetrical with respect to the equator.The steep and high Andes separate the Pacific frommuch of the South American continent and the Atlanticwhile a mountain range runs through the narrow Cen-tral American land bridge as an extension of the SierraMadre Occidental from North America. These CentralAmerican mountains are above 1 km high on averagebut only 100 km or less in width, and their orographiceffect is poorly represented in global GCMs with a typi-cal resolution of 2.8°. Three major gaps interrupt thismountain range: at the isthmus of the Gulf of Tehuan-tepec, over Lake Nicaragua, and at Panama (Fig. 3).
We hypothesize that the southward-displaced ITCZmight be closely related to the effects of the CentralAmerican mountain range. In winter, the northeasttrade winds prevail on both sides of Central America.Blocked by the mountains, northeast winds rushthrough narrow mountain gaps, forming three intense
FIG. 1. Time–latitude section of climatological SST (black con-tours at 1°C intervals), surface wind vectors (m s�1), based onCOADS (Woodruff et al. 1987), averaged for 1854–1993; CPCCMAP (Xie and Arkin 1996) precipitation, averaged for 1979–2002 (white contours at 5 mm day�1 intervals; shade � 2.5mm day�1). All zonally averaged between 120° and 115°W (fromXie 2004b).
15 SEPTEMBER 2005 X U E T A L . 3857
jets1 offshore over the Pacific (Clarke 1988; Steenburghet al. 1998; Chelton et al. 2000). These wind jets causethe ocean surface to cool through strong surface evapo-ration and entrainment of cold water from the ther-mocline, as reflected in three cold patches off the Gulfsof Tehuantepec, Papagayo, and Panama (Xie et al.2005, their Figs. 4 and 6). These cold patches may keepthe ITCZ from getting close to Central America. Fur-
thermore, the trade winds probably flow over themountain range, generating subsidence in the lee overthe Pacific. The trade winds are strongest in winter, andprobably so is orographic subsidence over the Pacific, aseasonality consistent with the observations that theITCZ’s displacement from the warm pool is most pro-nounced in winter (Xie et al. 2005).
The present study investigates the cause of theITCZ’s southward displacement from the eastern Pa-cific warm pool off Central America, and tests theabove hypothesis of orographic subsidence and SSTcooling using a full-physics regional climate model.Compared to global GCMs, the regional model can af-ford higher resolution to better resolve the narrow
1 The term “jet” in this study is defined subjectively to be alocalized region of strong offshore winds in the lee of the threelow-elevation gaps through the Central American mountainrange.
FIG. 2. Seasonal mean (DJF) precipitation (shaded, 2 mm day�1 intervals) for (a) CMAPobservations, and (b) CCM3 simulations with global observed SSTs as surface boundaryconditions, averaged for 1979–93. Seasonal mean (DJF) Reynolds SSTs are also plotted incontours at 0.5°C intervals. (The CCM3 simulated precipitation is available online at http://www.cdc.noaa.gov and based on 12 ensemble simulations.)
3858 J O U R N A L O F C L I M A T E VOLUME 18

mountains—the 0.25° grid size we use is equivalent to aT480 resolution for a global spectral model. Our resultsshow that indeed, the Central American mountains ex-ert a significant influence on eastern Pacific warm poolconvection, through both the direct orographic subsi-dence and indirect effect on SST.
Central America is one of the main regions wheremoisture is fluxed from the Atlantic to the PacificOceans, due to the favorable northeasterly wind direc-tion and the relatively low mountains compared to theAndes and Rockies. This moisture transport is bal-anced only partly by the eastward transport in the ex-tratropics, causing a net loss of freshwater in the At-lantic and rendering its salinity much greater than thatin the Pacific. Broecker (1997) argues that this is themajor reason why the North Atlantic is favored fordeep-water formation that drives the global thermoha-line circulation. Hence it is important for climate mod-els to make good estimates of this Atlantic-to-Pacificflux. In this study we use the results from the regionalmodel to investigate the sensitivity of the flux to modelorography.
The rest of the paper is organized as follows. Section2 describes the model, experimental design, and obser-vational data sets used for verification. Section 3 pre-sents the simulation results and investigates the effectsof the Central American mountains on precipitation.Section 4 investigates the sensitivity of moisture flux
estimates to model resolution and the representation oforography. Section 5 is a summary and discusses broadimplications.
2. Model and experimental design
a. Model
The regional climate model (RCM) developed at theInternational Pacific Research Center (IPRC), Univer-sity of Hawaii, is used in this study. It is a primitiveequation model with sigma as the vertical coordinate,solved on a longitude–latitude grid system. The modeldomain is 10°S–27.5°N, 125°–65°W, including the east-ern Pacific, Mexico, Central America, the Gulf ofMexico and Caribbean Sea, and part of South America(Fig. 4). The model uses a grid spacing of 0.25° in bothlongitude and latitude, and has 28 levels in the vertical.A detailed description of the model and its perfor-mance in simulating regional climate of East Asia canbe found in Wang et al. (2003). The model has alsobeen used to simulate the regional climate over theeastern Pacific, including the atmospheric response totropical instability ocean waves (Small et al. 2003),boundary layer clouds over the southeast Pacific (Y.Wang et al. 2004), and the effect of the Andean moun-tains (Xu et al. 2004).
The model includes a detailed cloud microphysicsscheme for grid-scale moist processes (Wang 2001).
FIG. 3. Map of topography (shaded, interval levels 300, 500, 1000, 1500, 2000, 2500, 3000 m)based on the 5 min. � 5 min. U.S. Navy ETOP5 data and geographical locations referred toin this paper.
15 SEPTEMBER 2005 X U E T A L . 3859

The mixing ratios of cloud water, rainwater, cloud ice,snow, and graupel are all prognostic variables in themodel. Condensation (evaporation) of cloud watertakes place instantaneously when the air is supersatu-rated (subsaturated). Subgrid-scale convective pro-cesses, such as shallow convection, midlevel convection,and penetrative deep convection, are considered basedon the mass flux cumulus parameterization scheme
originally developed by Tiedtke (1989) and later modi-fied by Nordeng (1995).
The subgrid-scale vertical mixing is accomplished bythe so-called E–� closure scheme, in which both theturbulence kinetic energy (TKE) and its dissipationrate are prognostic variables (Detering and Etling1985). Turbulent fluxes at the ocean surface are calcu-lated using the TOGA COARE algorithm (Fairall et al.
FIG. 4. Model domain and topography (shaded, interval levels 0.25, 0.5, 1.0, 1.5, 2, 2.5, 3,3.5 km) for (a) CTL and (b) NoTop runs. 2-month (Jan and Feb 2002) mean SSTs (contoursat 0.5°C intervals) for (a) CTL and (b) NoTopSmSST runs are also plotted.
3860 J O U R N A L O F C L I M A T E VOLUME 18
1996). Over the land, the bulk aerodynamic method isused in the land surface model, which uses the Bio-sphere–Atmosphere Transfer Scheme (Dickinson et al.1993). Soil moisture is initialized using a method de-scribed by Giorgi and Bates (1989) such that the initialsoil moisture depends on the vegetation and soil typedefined for each grid cell.
The radiation package originally developed by Ed-wards and Slingo (1996) and later modified by Sun andRikus (1999) is used, which includes seven/four bandsfor longwave/shortwave radiation. Seasonal-varying cli-matological ozone and a constant mixing ratio of car-bon dioxide for the present climate are used.
b. Experimental design
The initial and lateral boundary conditions are ob-tained from the (National Centers for EnvironmentalPrediction) NCEP–NCAR global reanalysis (Kalnay etal. 1996), available on a 2.5° � 2.5° grid with 17 verticalpressure levels. They are interpolated onto the modelgrid by cubic spline interpolation in the horizontal andlinear interpolation in both the vertical and time basedon four times daily reanalysis. Over the ocean, theNOAA optimal interpolation V2 weekly SST dataseton a 1° � 1° grid is used as the lower boundary condi-tion (Reynolds et al. 2002).
The following four experiments are carried out toexamine the effects of the Central American mountainson the eastern Pacific ITCZ and moisture transport.Each experiment is initialized at 0000 UTC on 1 Janu-ary 2002, and integrated for 2 months. The rest of thepaper discusses the January–February means con-structed from hourly output (the output for the first 3days is discarded and referred to as model spinup).
• Control (CTL) run. The model topography is basedon the U.S. Geophysical Survey 0.0833°� 0.0833° to-pographic dataset and smoothed with an envelopetopographic algorithm (Wang et al. 2003). At ourmodel resolution, the main features of CentralAmerican cordillera are reasonably represented (Fig.4a). The mountains are about 2 km high in Mexicoand 1 km high in Central America, but somewhat toolow represented in Costa Rica and Panama.
• No-topography (NoTop) run. The mountains of Cen-tral America and Mexico are removed by setting landelevation at 0.5 m (Fig. 4b). Strictly speaking, thedesign of this no-topography run may be physicallyinconsistent with the imposed lateral boundary con-ditions that are influenced by the presence of theseCentral American mountains in the first place. Nev-ertheless, a comparison of the CTL and NoTop runs
can help identify the mountain effects within the con-text of this model.
• No-topography and smoothed SST (NoTopSmSST)run. While the comparison of the CTL and NoTopruns can identify the direct effect of the CentralAmerican mountain range, these mountains leavemarked signatures in the SST field in the form ofthree cold patches through the action of gap wind jets(Fig. 4a). These cold patches, along with warmpatches leeward of mountains, in turn affect the at-mospheric circulation and convection, and may beconsidered as an indirect effect of Central Americancordillera. In the NoTopSmSST run, we removethese orographically induced variations in SST aswell as the mountains themselves. The smoothed SSTfield is obtained by first setting SST to 27.8°C(27.5°C) if it is greater (smaller) than this value offthe west coast of Central America—up to 600 kmoffshore, and then applying a 5-point smoother 5times in the coastal region. Figure 4b shows the re-sultant SST field that is nearly uniformly above27.5°C near the Central American coast.
• Smoothed-topography (SmTop) run. This experimentis identical to the CTL run except that the topogra-phy is replaced with a smoother one taken from aGCM with triangular truncation at zonal wavenum-ber 42 (T42). The T42 topography is interpolatedonto the model grid by cubic spline interpolation. Tobe consistent with the land–sea mark in the regionalmodel, nonzero topography heights over the oceanare set to zero, because the T42 topography extendsto the ocean, especially over the eastern Pacific offthe west coast of Central and South Americas. Thissimulation is used to investigate the effect of topo-graphic resolution on the moisture transport from theAtlantic to the Pacific.
c. Observational data
To evaluate the model simulations, we use precipita-tion rate and column-integrated water vapor measuredby the Tropical Rainfall Measuring Mission (TRMM)Microwave Imager (TMI). TMI satellite measures SST,rain rate, and water vapor over the Tropics within38°N–S, at resolutions of 0.25° in space and twice dailyin time. We use a monthly TMI product availablesince January 1998 on a 0.25° grid (Wentz et al. 2000).Serra and McPhaden (2003) compare TMI precipita-tion with self-siphoning rain gauge data from 14 open-ocean buoys located in heavy-rain areas of the tropicalPacific and Atlantic Oceans, and report a favorablecomparison on monthly and seasonal time scales. TheTMI product is only available over the oceans, and inorder to evaluate the modeled rainfall over land, we use
15 SEPTEMBER 2005 X U E T A L . 3861

a monthly terrestrial precipitation product from Uni-versity of Delaware Center for Climatic Research(Legates and Willmott 1990) that is based on stationrecords and available on a 0.5° � 0.5° of latitude/longitude grid from January 1950 to December 1999.The monthly Climate Predication Center (CPC)
Merged Analysis of Precipitation (CMAP; Xie and Ar-kin 1996) dataset on a 2.5° grid is also used. Themonthly CMAP precipitation is available since January1979.
The microwave scatterometer on the Quick Scatter-ometer (QuikSCAT) satellite measures surface wind ve-
FIG. 5. The 2-month (Jan–Feb) mean daily precipitation (shaded, interval levels 2, 4, 8, 12,16, 20, 24, 28, and 32 mm day�1) for (a) TMI observations over the ocean in 2002 andgauge-corrected precipitation over the land, averaged for 1950–99, and (b) model CTL run.The 2-month (Jan–Feb 2002) mean (a) TMI and (b) Reynolds SSTs (contours at 1°C inter-vals) are also plotted.
3862 J O U R N A L O F C L I M A T E VOLUME 18

locity over the World Ocean (Liu et al. 2000). We use amonthly product for wind velocity available since Au-gust 1999 on a 0.25° grid. TMI and QuikSCAT obser-vations have revealed rich structures on short spatialscales around the world (Xie 2004a; Chelton et al.2004).
3. ITCZ experiment results
a. Control run
Figure 5 compares the simulated precipitation aver-aged for January–February 2002 with the TMI obser-vations over the ocean for the same period. In January–February, major precipitation in the eastern Pacific oc-curs in the zonally elongated ITCZ centered around5°N, a feature that the model reproduces reasonablywell. The simulated ITCZ is visibly displaced to thesouth of maximum SST, especially between 100° and110°W, a feature most GCMs fail to simulate. However,the simulated ITCZ is slightly stronger and wider thanthe observed counterpart (Fig. 5a). The simulated pre-cipitation is also found over the Caribbean Sea on thewindward side of the Central American mountainrange. This orographic-induced precipitation is con-firmed by January–February mean climatology2 (Fig.5a) of gauge measurements from 1950 to 1999 (Legatesand Willmott 1990). Pierrehumbert and Wyman (1985)and Mozer and Zehnder (1996) study the effects ofmesoscale mountains on flow adjustment and discussthe conditions for flow-over and flow-around regimes.Adjustment across Central America displays the char-acteristics of both regimes. The windward rainband inobservations and the model suggests upward motion onthe Caribbean side of the mountains and a flow-overcomponent in winter. The strong wind jets through themountains gaps, on the other hand, are indicative offlow-around.
The simulated 10-m surface wind velocity field gen-erally compares well with the QuikSCAT observations(Fig. 6). In particular, the model captures strong windjets off Tehuantepec and Papagayo and reduced windspeeds leeward of the mountain barrier. The Tehuant-pece and Papagayo jets extend over a few hundred ki-lometers offshore, and eventually merge into the Pa-cific northeast trades. The Tehuantepec jet is orientedroughly in the north–south direction while the Papa-gayo jet takes a more zonal orientation. This differencein orientation between these jets greatly affects oceandynamic response and its delayed effect on summeratmospheric convection (Xie et al. 2005). The simulated
Panama jet, however, is too broad and takes a south-west–northeast orientation compared to a northerly jetin QuikSCAT measurements (Fig. 6a). These deficien-cies are due in part to the coarse resolution of themodel that does not adequately resolve the mountainsin Costa Rica.
The simulated Tehuantepec wind jet appears to turnanticyclonically westward after leaving the coast. Thefanlike wind pattern closely resembles that observed(Fig. 6a) rather than a narrow and confined jet as sug-gested by the scale analysis presented by Clarke (1988).A ridge of geopotential height is located over the Gulfof Tehuantepec with its pressure gradient nearly paral-lel to the coastal jet axis (Fig. 6b), indicating the north-erly Tehuantepec jet is accelerated by the pressure gra-2 TMI precipitation product is not available over land.
FIG. 6. The 10-m height wind vectors for (a) QuikSCAT obser-vations and (b) model CTL run, averaged for Jan and Feb 2002.The 2-month mean (a) NCEP and (b) model geopotential heights(contours at 4 gpm intervals) at 1000 hPa are also plotted.
15 SEPTEMBER 2005 X U E T A L . 3863

dient. Steenburgh et al. (1998) examined the momen-tum balances of flow curvature during a gap-outflowevent over the Gulf of Tehuantepec and found thattrajectories along the axis of the outflow jet were iner-tially balanced, but the momentum balances along tra-
jectories off the axis of the outflow jet were modified bycross-flow pressure-gradient accelerations. Because ofthe influence of these cross-flow pressure-gradient ac-celerations on trajectories off the jet axis, the flow fansout in the outflow region rather than maintaining a
FIG. 7. Column-integrated water vapor (mm) for (a) TMI observations and (b) model CTLrun, averaged for Jan and Feb 2002. Contour interval is 2 mm.
3864 J O U R N A L O F C L I M A T E VOLUME 18

narrow jet. The simulated Tehuantepec jet finallycomes into a near-geostrophic balance about 500–600km offshore, a distance comparable to the Rossby ra-dius of deformation. However, the geopotential heightridge does not appear along the Tehuantepec jet in theNCEP reanalysis because of its coarse resolution (Fig.6a). Major discrepancies between the regional climatemodel simulation and NCEP reanalysis are also foundin geopotential height west of Mexico. The trough off-shore in the reanalysis is probably spurious and in vio-lation of geostrophy with the wind velocity observed byQuikSCAT west of Mexico. There, the simulated windsare weaker than the QuikSCAT winds, especially alongthe coast, but their directions are roughly consistent.
The characteristics of the Papagayo jet seem to befundamentally different from the Tehuantepec jet. ThePapagayo jet does not turn to the north anticyclonicallyafter exiting the gap and geopotential height contoursare almost parallel to the direction of the Papagayo jet(Fig. 6b), indicating a near-geostrophic balance. Chel-ton et al. (2000) suggested that this different characterof the Papagayo jet might be because the gap over theNicaraguan lake is wide enough for the trade winds tomaintain a near-geostrophic balance across CentralAmerica.
Figure 7 compares the column-integrated water va-por content between the TMI observations (Fig. 7a)and the model simulation (Fig. 7b). The model repro-duces well the high water vapor content in the zonal-oriented ITCZ between 2.5° and 7.5°N, except for aslight overestimation. Over the Northeast Pacific offCentral America, the simulated water vapor comparesreasonably well with the TMI observations both in spa-tial distribution and magnitude. In particular, the drytongue over the Gulf of Tehuantepec is well repro-duced in the model as a result of dry advection from thenorth. Over the Pacific between 10° and 15°N, watervapor content both in the model and observations de-creases near the west coast of Central America, indi-cating that the orographically induced rainfall on thewindward side and downdraft in the lee may play animportant role in reducing water vapor as the northeasttrades impinge upon Central America.
b. Topographic effects
With the Central American mountain range removedin the NoTop run, the surface wind and precipitationdistributions are markedly changed. Without the moun-tain barrier, air flows freely across Central America,and the northeast trade winds become very smooth inspace over the Northeast Pacific (Fig. 8), in contrast tolarge variations in the CTL run. A near-geostrophicbalance is maintained over both the Caribbean Sea and
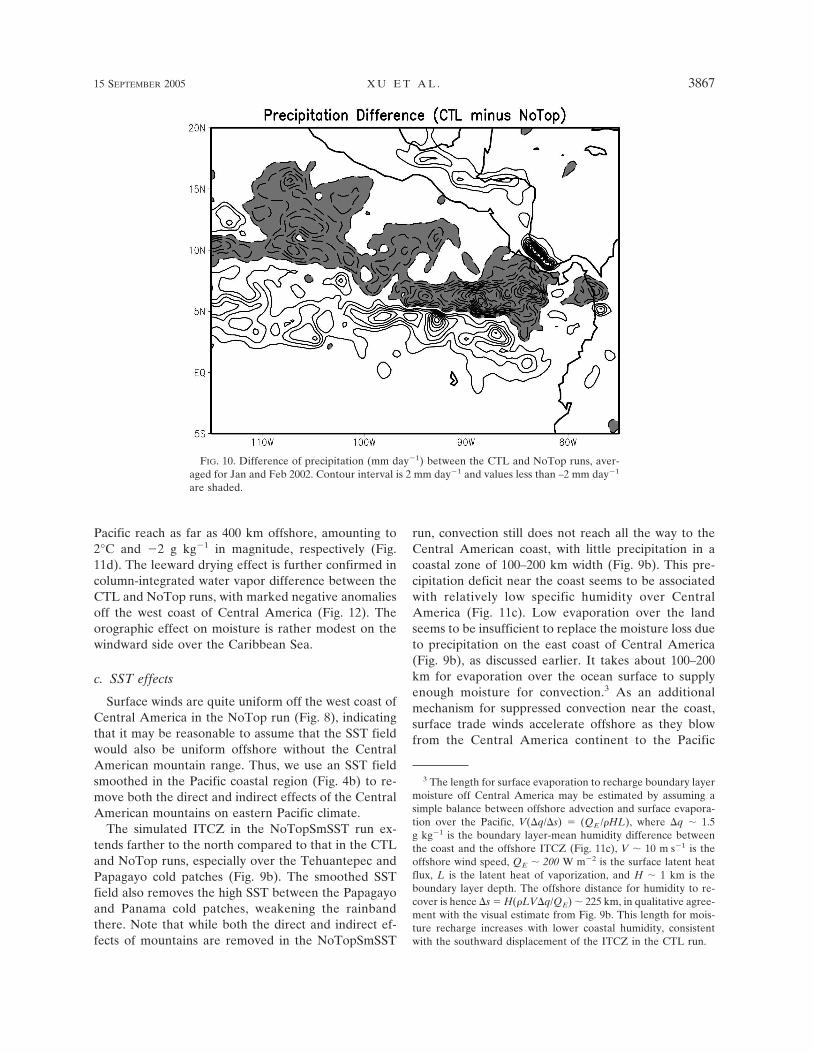
the eastern Pacific. Compared to the CTL run the ITCZrainband shifts markedly northeastward and becomesbroader in the meridional direction, especially over thewarm water south of Mexico between 110° and 100°W(Fig. 9a). Without the direct orographic effect, the SSTeffect on precipitation becomes much clearer than thatin the CTL run. Besides occupying the warm watersouth of Mexico, rainfall reaches a distinct maximum ina zonally oriented band of high SSTs between the Papa-gayo and Panama cold patches. The precipitation ratein this zonal rainband is significantly greater than thatin the CTL run. On the other hand, precipitation re-mains low over the Tehuantepec and Papagayo coldpatches, producing two holes in the broad ITCZ. Theorographic effect on the eastern Pacific ITCZ can beseen more clearly in the (CTL minus NoTop) precipi-tation difference map (Fig. 10). A pair of zonally ori-ented bands of rainfall anomalies, positive and negativeroughly south and north of 5°N, respectively, indicatesthat the mountains act to push the eastern Pacific ITCZsouthward. On the windward side of the mountains,rainfall increases in the CTL run compared to the No-Top run because of orographic lifting.
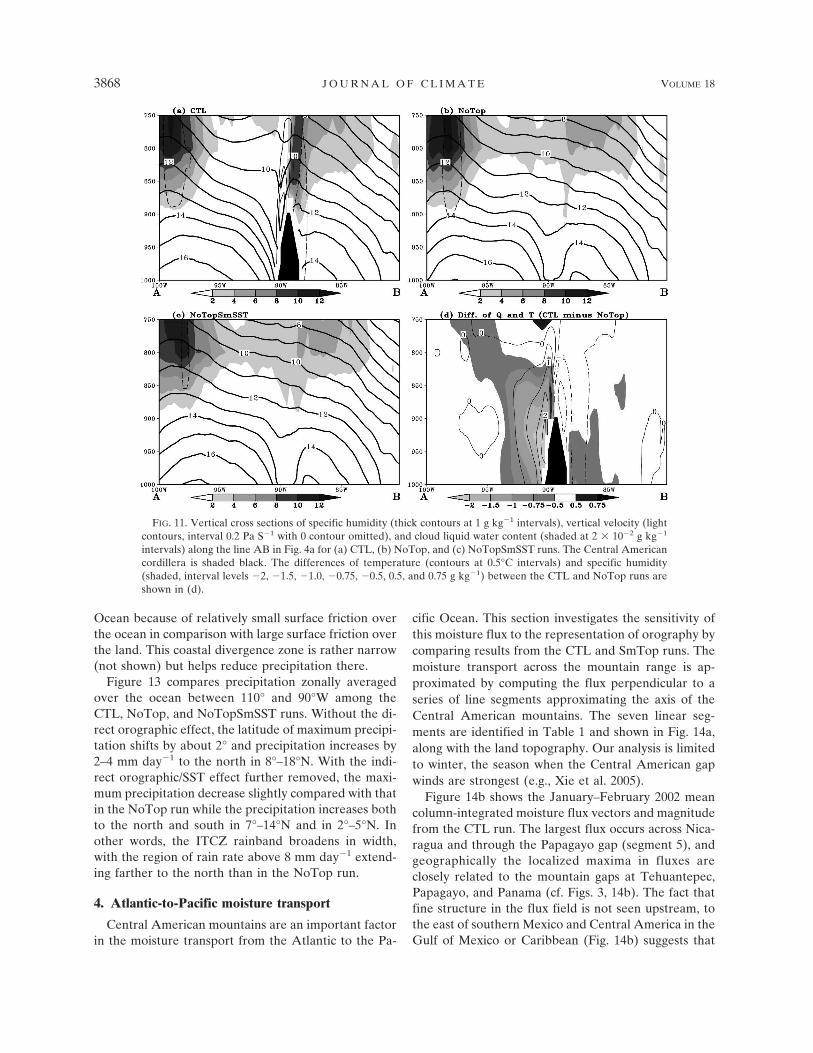
Now we examine further the mechanism by whichthe Central American mountain range displaces theeastern Pacific ITCZ southward. Figure 11 shows crosssections of model results along the line AB as markedin Fig. 4a. The mountains force a strong updraft on thewindward side (Fig. 11a) with elevated cloud liquid wa-ter content (Fig. 11a) and precipitation (Fig. 5). On theleeside, the mountains cause a strong downdraft, whichalong with the windward precipitation depresses spe-
FIG. 8. The 10-m height wind vectors and geopotential heights(contours at 4 gpm intervals) at 1000 hPa for model NoTop run,averaged for Jan and Feb 2002.
15 SEPTEMBER 2005 X U E T A L . 3865

cific humidity by transporting dry air downward. About500 km away from the coast, boundary layer moisturerecovers to values high enough for convection to be-come active west of 95°W.
In the NoTop run, humidity does not change muchacross Central America, except near the surface (Fig.11b). This dip in boundary-layer humidity is due toprecipitation near the east coast (�2 mm day�1; Fig. 9)
and weak evaporation supply over land. Withoutmountains, moisture depletion by precipitation on theCaribbean side of Central America is greatly reduced(Fig. 10), and so is the subsidence on the Pacific side.Both effects act to increase moisture in the lower at-mosphere over the Pacific Ocean near Central Americain the NoTop compared to the CTL run. The warmingand drying induced by orographic subsidence on the
FIG. 9. The 2-month (Jan and Feb 2002) mean daily precipitation (shaded, interval levels 2,4, 8, 12, 16, 20, 24, 28, and 32 mm day�1) for (a) NoTop, and (b) NoTopSmSST runs. Thecorresponding 2-month mean SSTs (contours at 1°C intervals) are also plotted.
3866 J O U R N A L O F C L I M A T E VOLUME 18
Pacific reach as far as 400 km offshore, amounting to2°C and �2 g kg�1 in magnitude, respectively (Fig.11d). The leeward drying effect is further confirmed incolumn-integrated water vapor difference between theCTL and NoTop runs, with marked negative anomaliesoff the west coast of Central America (Fig. 12). Theorographic effect on moisture is rather modest on thewindward side over the Caribbean Sea.
c. SST effects
Surface winds are quite uniform off the west coast ofCentral America in the NoTop run (Fig. 8), indicatingthat it may be reasonable to assume that the SST fieldwould also be uniform offshore without the CentralAmerican mountain range. Thus, we use an SST fieldsmoothed in the Pacific coastal region (Fig. 4b) to re-move both the direct and indirect effects of the CentralAmerican mountains on eastern Pacific climate.
The simulated ITCZ in the NoTopSmSST run ex-tends farther to the north compared to that in the CTLand NoTop runs, especially over the Tehuantepec andPapagayo cold patches (Fig. 9b). The smoothed SSTfield also removes the high SST between the Papagayoand Panama cold patches, weakening the rainbandthere. Note that while both the direct and indirect ef-fects of mountains are removed in the NoTopSmSST
run, convection still does not reach all the way to theCentral American coast, with little precipitation in acoastal zone of 100–200 km width (Fig. 9b). This pre-cipitation deficit near the coast seems to be associatedwith relatively low specific humidity over CentralAmerica (Fig. 11c). Low evaporation over the landseems to be insufficient to replace the moisture loss dueto precipitation on the east coast of Central America(Fig. 9b), as discussed earlier. It takes about 100–200km for evaporation over the ocean surface to supplyenough moisture for convection.3 As an additionalmechanism for suppressed convection near the coast,surface trade winds accelerate offshore as they blowfrom the Central America continent to the Pacific
3 The length for surface evaporation to recharge boundary layermoisture off Central America may be estimated by assuming asimple balance between offshore advection and surface evapora-tion over the Pacific, V(�q/�s) � (QE /�HL), where �q � 1.5g kg�1 is the boundary layer-mean humidity difference betweenthe coast and the offshore ITCZ (Fig. 11c), V � 10 m s�1 is theoffshore wind speed, QE � 200 W m�2 is the surface latent heatflux, L is the latent heat of vaporization, and H � 1 km is theboundary layer depth. The offshore distance for humidity to re-cover is hence �s � H(�LV�q/QE) � 225 km, in qualitative agree-ment with the visual estimate from Fig. 9b. This length for mois-ture recharge increases with lower coastal humidity, consistentwith the southward displacement of the ITCZ in the CTL run.
FIG. 10. Difference of precipitation (mm day�1) between the CTL and NoTop runs, aver-aged for Jan and Feb 2002. Contour interval is 2 mm day�1 and values less than –2 mm day�1
are shaded.
15 SEPTEMBER 2005 X U E T A L . 3867
Ocean because of relatively small surface friction overthe ocean in comparison with large surface friction overthe land. This coastal divergence zone is rather narrow(not shown) but helps reduce precipitation there.
Figure 13 compares precipitation zonally averagedover the ocean between 110° and 90°W among theCTL, NoTop, and NoTopSmSST runs. Without the di-rect orographic effect, the latitude of maximum precipi-tation shifts by about 2° and precipitation increases by2–4 mm day�1 to the north in 8°–18°N. With the indi-rect orographic/SST effect further removed, the maxi-mum precipitation decrease slightly compared with thatin the NoTop run while the precipitation increases bothto the north and south in 7°–14°N and in 2°–5°N. Inother words, the ITCZ rainband broadens in width,with the region of rain rate above 8 mm day�1 extend-ing farther to the north than in the NoTop run.
4. Atlantic-to-Pacific moisture transport
Central American mountains are an important factorin the moisture transport from the Atlantic to the Pa-
cific Ocean. This section investigates the sensitivity ofthis moisture flux to the representation of orography bycomparing results from the CTL and SmTop runs. Themoisture transport across the mountain range is ap-proximated by computing the flux perpendicular to aseries of line segments approximating the axis of theCentral American mountains. The seven linear seg-ments are identified in Table 1 and shown in Fig. 14a,along with the land topography. Our analysis is limitedto winter, the season when the Central American gapwinds are strongest (e.g., Xie et al. 2005).
Figure 14b shows the January–February 2002 meancolumn-integrated moisture flux vectors and magnitudefrom the CTL run. The largest flux occurs across Nica-ragua and through the Papagayo gap (segment 5), andgeographically the localized maxima in fluxes areclosely related to the mountain gaps at Tehuantepec,Papagayo, and Panama (cf. Figs. 3, 14b). The fact thatfine structure in the flux field is not seen upstream, tothe east of southern Mexico and Central America in theGulf of Mexico or Caribbean (Fig. 14b) suggests that
FIG. 11. Vertical cross sections of specific humidity (thick contours at 1 g kg�1 intervals), vertical velocity (lightcontours, interval 0.2 Pa S�1 with 0 contour omitted), and cloud liquid water content (shaded at 2 � 10�2 g kg�1
intervals) along the line AB in Fig. 4a for (a) CTL, (b) NoTop, and (c) NoTopSmSST runs. The Central Americancordillera is shaded black. The differences of temperature (contours at 0.5°C intervals) and specific humidity(shaded, interval levels �2, �1.5, �1.0, �0.75, �0.5, 0.5, and 0.75 g kg�1) between the CTL and NoTop runs areshown in (d).
3868 J O U R N A L O F C L I M A T E VOLUME 18

the local maxima in fluxes off the Pacific side of CentralAmerica are due to local effects. By comparison, theflux in the SmTop run (Fig. 14c) shows less fine struc-ture and a broader maximum in flux spreading west-wards from the Nicaragua/Papagayo region, due to themuch smoother orography.
The water vapor mixing ratio along the segments,and the wind component normal to the segments (to-ward the Pacific) are shown as vertical cross sections in
Fig. 15 as a function of longitude, with the segmentnumber annotated at the top. The contrast in the orog-raphy along the segments (represented as white blocks)between the CTL and SmTop runs is dramatic, and thegaps in the mountain range around 95°W (Tehuante-pec), 85°W (Papagayo), and at 79°W (Panama) aremore pronounced in the CTL run. As a consequence,the wind speed core through Papagaya is stronger in theCTL run as the flow is squeezed through the narrowergap (Fig. 15).
FIG. 13. Precipitation (mm day�1) zonally averaged between90° and 110°W over the ocean for the CTL (thick solid), NoTop(light solid), and NoTopSmSST (dashed) runs, averaged for Janand Feb 2002.
TABLE 1. Line integral of flux normal to each segment, for theline segments shown in Fig. 14a. Results show the Jan–Feb 2002mean from the CTL and SmTop runs.
SegmentLength(km)
Flux (Sv)CTL run
Flux (Sv)SmTop
run
1) Sierra Madre Occidental 1553 �0.101 �0.1042) Tehuantepec gap 550 0.027 0.0253) Chiapas highlands,
South Mexico232 0.012 0.032
4) Guatemala–HondurasHighlands
465 0.031 0.033
5) Honduras–Nicaragua–Costa Rica/Papagayo gap
767 0.210 0.217
6) Panama 412 0.078 0.0467) Panama 401 0.066 0.060Total 4381 0.323 0.309
FIG. 12. Difference of column-integrated water vapor (mm) between the CTL and NoTopruns, averaged for Jan and Feb 2002. Contour interval is 1 mm with 0 contour omitted.
15 SEPTEMBER 2005 X U E T A L . 3869

When the component of column-integrated moistureflux normal to the segments (and pointing toward thePacific), Q, is calculated (Table 1), the largest differ-ences between CTL and SmTop runs occur in segments3 (south Mexico highlands) and 6 (Panama highlands).In segment 3 the SmTop simulation shows larger Q, dueto the absence of the high mountains which would oth-erwise act to reduce the moisture transport. Along seg-ment 6, Q is reduced in the SmTop run because thesmoother Andean mountains weaken the easterlywinds to the north in the Caribbean, helping to de-crease the moisture fluxes in that area (cf. Figs. 14b,cand note the stronger surface wind component into seg-ment 6 on Fig. 15a). The differences in the segmentsthat include the prominent gaps (2, 5, and 7) are small(Table 1): the stronger flow through the gaps in theCTL run is compensated for by the broader and deepernature of the flow in the SmTop run (Fig. 15). Theoverall result is that the total of the flux across CentralAmerica mountains is only slightly different betweenCTL (0.32 Sv, where 1 Sv 106 m3 s�1) and SmTopruns (0.31 Sv).
Not shown here, an analysis of the NCEP–NCARreanalysis indicates that the moisture transport displaysa second peak in July–August when cross–CentralAmerican winds intensify (Fig. 1 of Xie et al. 2005)along with a seasonal increase in lower-atmospheric hu-midity in the region. Thus longer model integrationsare necessary to assess the annual-mean moisture trans-port across Central America and its sensitivity to orog-raphy.
5. Summary and discussion
A high-resolution regional climate model is used tostudy the effects of the Central American mountains onthe eastern Pacific ITCZ in boreal winter. The modelreproduces the salient features of eastern Pacific cli-mate as compared to TMI and QuikSCAT observa-tions, including three intense wind jets and an ITCZdisplaced to the southern edge of the warm pool in thefar eastern Pacific. As the strong northeast trades im-pinge on the Central American mountains, much of thenortheast trades is blocked by the mountains. A portionof the trades flows over the mountains and generatessubsidence on the leeward side, suppressing atmo-spheric deep convection over the Pacific Ocean. Ex-periments with and without Central American cordil-lera demonstrate that this orographically inducedsubsidence is the main cause of the southward displace-ment of the eastern Pacific ITCZ away from the core ofthe warm pool. Our results also show that cold patchesunder the gap wind jets, which are themselves an oro-
FIG. 14. Column-integrated moisture flux vectors and magni-tude in the regional climate model. (a) Topography (shaded, in-terval 500 m), and location and numbering of line segments (whitelines). (b) Jan–Feb 2002 CTL run moisture flux vectors and mag-nitude in kg m s�1 (contour levels 100, 200, 300, 350, and 400kg m s�1). (c) Same as b but for SmTop run. The vectors areshown every sixth grid point (every 1.5°).
3870 J O U R N A L O F C L I M A T E VOLUME 18
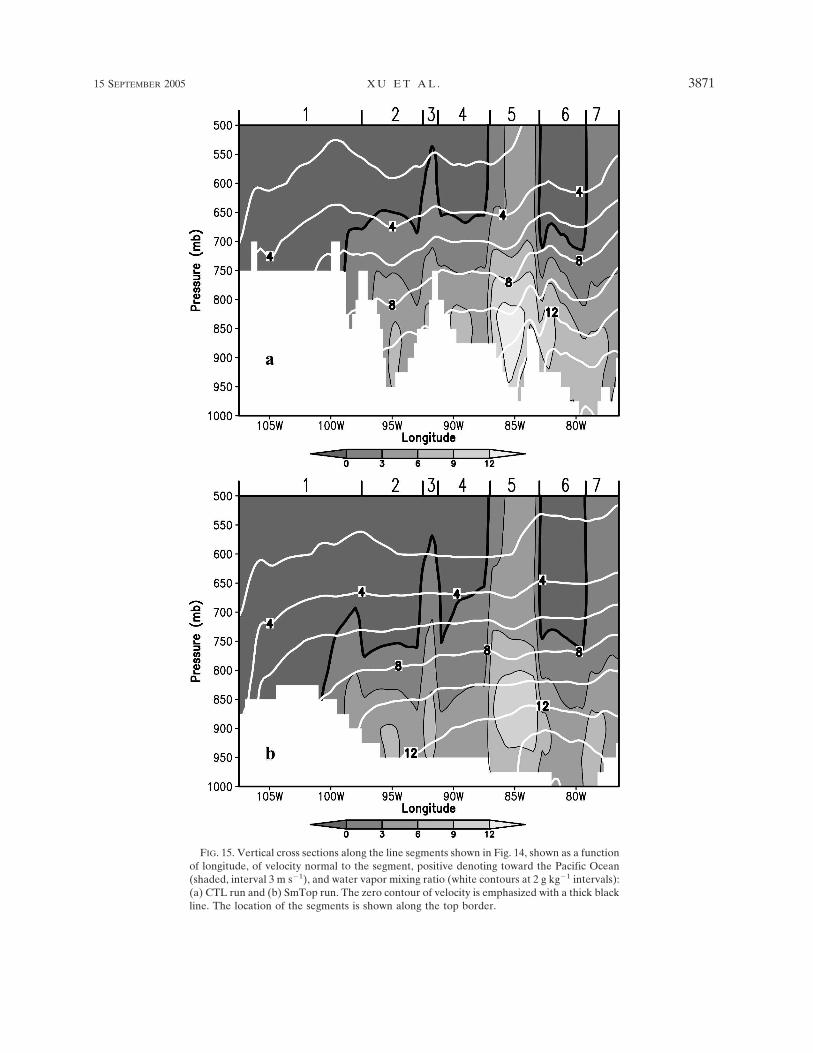
FIG. 15. Vertical cross sections along the line segments shown in Fig. 14, shown as a functionof longitude, of velocity normal to the segment, positive denoting toward the Pacific Ocean(shaded, interval 3 m s�1), and water vapor mixing ratio (white contours at 2 g kg�1 intervals):(a) CTL run and (b) SmTop run. The zero contour of velocity is emphasized with a thick blackline. The location of the segments is shown along the top border.
15 SEPTEMBER 2005 X U E T A L . 3871

graphic effect, are an additional mechanism that keepsthe ITCZ from moving northward and occupying thewarm pool.
While so far we have focused on the winter season,Central American mountains also imprint on the sum-mer climate. Strong curls of gap wind jets imprint onocean thermocline topography by the Rossby wavemechanism (e.g., McCreary et al. 1989; Umatani andYamagata 1991). In particular, the cyclonic curls of thePapagayo jet maintain a thermocline dome west ofCosta Rica, where the 20°C isotherm is only 30 m deepyear-round (Kessler 2002). Xie et al. (2005) show thatthis thermocline dome maintains a cool spot in the east-ern Pacific warm pool and punches a large hole in theITCZ rainband in summer. Thus, winter gap windshave a delayed effect on eastern Pacific climate in sub-sequent seasons.
Current GCMs have a typical grid size of 2.8° and donot adequately resolve the narrow mountains of theAmericas. In a companion paper, using the same re-gional model, Xu et al. (2004) study the effects of steepmountains of South America, suggesting that the poorrepresentation of the Andes might be a cause of thesystematic bias of many coupled GCMs where theITCZ persists too long south of the equator (Mechosoet al. 1995). Compared to Central American cordillera,the Andes are much taller in height (�2 km) and blockthe lower-atmospheric flow, creating favorable condi-tions for stratus cloud formation by enhancing subsi-dence offshore. In March–April, the Andes disruptwestward-traveling disturbances that trigger convec-tion, helping terminating the ITCZ south of the equator(Xu et al. 2004). In the 2-month RCM simulations pre-sented here, Central American mountains induce a pre-cipitation dipole offshore (Fig. 10) but has limited ef-fects on winds on and south of the equator based onhere. When this RCM is coupled with a general circu-lation model of the Pacific Ocean, these mountains ap-pear to have significant impacts on the boreal springITCZ. Further research is underway with this coupledregional model and its results will be reported else-where.
Moisture flux from the Atlantic to the Pacific Oceanis an important component of hydrological cycle, help-ing set the salinity contrast between the two oceans.The winter wind system is favorable for the Atlantic-to-Pacific moisture transport, with the northeast tradesstrong on either side of the isthmus. Calculations fromthe regional climate model showed that around 0.32 Svof water vapor is transported across the Central Ameri-can isthmus during January and February 2002. Theresults of this study suggest that the estimates of thismoisture transport is not very sensitivity to the fine
structure of the orography (mountain peaks and gaps)because the increased flow in the gaps in detailed to-pography tends to be compensated for by broader anddeeper flow in smoothed topography.
Acknowledgments. We wish to thank Jan Hafner forarchiving the TMI and QuikSCAT data from RemoteSensing Systems’ Web site and Y. Zhang for archivingthe NCEP reanalysis dataset. We are also grateful toanonymous reviewers for their comments, whichhelped improve the manuscript. This work is supportedby NOAA PACS Program (NA17RJ230), NSF (ATM01-04468), NASA (NAG5-10045, JPL1216010), the StateKey Program (2004CB418304), and by the JapanAgency for Marine-Earth Science and Technology(JAMSTEC) through its sponsorship of the Interna-tional Pacific Research Center.
REFERENCES
Broecker, W. S., 1997: The thermohaline circulation, the Achillesheel of our climate system: Will man-made CO2 upset thecurrent balance? Science, 278, 1582–1588.
Chelton, D. B., M. H. Freilich, and S. N. Esbensen, 2000: Satelliteobservations of the wind jets off the Pacific coast of CentralAmerica. Part II: Regional relationships and dynamical con-siderations. Mon. Wea. Rev., 128, 2019–2043.
——, M. G. Schlax, M. H. Freilich, and R. F. Milliff, 2004: Satellitemeasurements reveal persistent small-scale features in oceanwinds. Science, 303, 978–983.
Clarke, A. J., 1988: Inertial wind path and sea surface temperaturepatterns near the Gulf of Tehuantepec and the Gulf of Papa-gayo. J. Geophys. Res., 93, 15 491–15 501.
Detering, H. W., and D. Etling, 1985: Application of the E-� tur-bulence model to the atmospheric boundary layer. Bound.-Layer Meteor., 33, 113–133.
Dickinson, R. E., A. Henderson-Sellers, and P. J. Kennedy, 1993:Biosphere-Atmosphere Transfer Scheme (BATS), Version1e as coupled to the NCAR Community Climate Model.NCAR Tech. Note NCAR/TN-387STR, 72 pp.
Edwards, J. M., and A. Slingo, 1996: Studies with a flexible newradiation code. I: Choosing a configuration for a large-scalemodel. Quart. J. Roy. Meteor. Soc., 122, 689–719.
Fairall, C. W., E. F. Bradley, D. P. Rogers, J. B. Edson, and G. S.Young, 1996: Bulk parameterization of air-sea fluxes forTropical Ocean-Global Atmosphere Coupled Ocean Atmo-sphere Research Experiment. J. Geophys. Res., 110, 3747–3764.
Gadgil, S., P. V. Joseph, and N. V. Joshi, 1984: Ocean–atmospherecoupling over the monsoon regions. Nature, 358, 394–397.
Giorgi, F., and G. T. Bates, 1989: The climatological skill of aregional model over complex terrain. Mon. Wea. Rev., 117,2325–2347.
Graham, N. E., and T. P. Barnett, 1987: Sea surface temperature,surface wind divergence and convection over tropical oceans.Science, 238, 657–659.
Halpern, D., and C.-W. Hung, 2001: Satellite observations of thesoutheast Pacific intertropical convergence zone during1993–1998. J. Geophys. Res., 106, 28 107–28 112.
3872 J O U R N A L O F C L I M A T E VOLUME 18

Hastenrath, S., 1991: Climate Dynamics of the Tropics. KluwerAcademic, 488 pp.
Kalnay, E., and Coauthors, 1996: The NCEP/NCAR 40-Year Re-analysis Project. Bull. Amer. Meteor. Soc., 77, 437–472.
Kessler, W. S., 2002: Mean three-dimensional circulation in thenortheast tropical Pacific. J. Phys. Oceanogr., 32, 2457–2471.
Lau, K.-M., H.-T. Wu, and S. Bony, 1997: The role of large-scaleatmospheric circulation in the relationship between tropicalconvection and sea surface temperature. J. Climate, 10, 381–392.
Legates, D. R., and C. J. Willmott, 1990: Mean seasonal and spa-tial variability in guage-corrected global precipitation. Int. J.Climatol., 10, 111–127.
Liu, W. T., X. Xie, P. S. Polito, S.-P. Xie, and H. Hashizume, 2000:Atmospheric manifestation of tropical instability waves ob-served by QuikSCAT and Tropical Rain Measuring Mission.Geophys. Res. Lett., 27, 2545–2548.
McCreary, J. P., H. S. Lee, and D. B. Enfield, 1989: Response ofthe coastal ocean to strong offshore winds: With applicationto circulations in the Gulf of Tehuantepec and Papagayo. J.Mar. Res., 47, 81–109.
Mechoso, C. R., and Coauthors, 1995: The seasonal cycle over thetropical Pacific in coupled ocean–atmosphere general circu-lation models. Mon. Wea. Rev., 123, 2825–2838.
Mitchell, T. P., and J. M. Wallace, 1992: The annual cycle in equa-torial convection and sea surface temperature. J. Climate, 5,1140–1156.
Mozer, J. B., and J. A. Zehnder, 1996: Lee vorticity production bylarge-scale tropical mountain range. Part I: Eastern NorthPacific tropical cyclogenesis. J. Atmos. Sci., 53, 521–538.
Nordeng, T. E., 1995: Extended versions of the convective param-eterisation scheme at ECMWF and their impact upon themean climate and transient activity of the model in the Trop-ics. ECMWF Research Department Tech. Memo. 206, 41 pp.
Pierrehumbert, R. T., and B. Wyman, 1985: Upstream effects ofmesoscale mountains. J. Atmos. Sci., 42, 977–1003.
Reynolds, R. W., and T. M. Smith, 1994: Improved global sea sur-face temperature analyses using optimum interpolation. J.Climate, 7, 929–948.
——, N. A. Rayner, T. M. Smith, D. C. Stokes, and W. Wang,2002: An improved in situ and satellite SST analysis for cli-mate. J. Climate, 15, 1609–1625.
Serra, Y. L., and M. J. McPhaden, 2003: Multiple time- and space-scale comparisons of ATLAS buoy rain gauge measurementswith TRMM satellite precipitation measurements. J. Appl.Meteor., 42, 1045–1059.
Small, R. J., S.-P. Xie, and Y. Wang, 2003: Numerical simulationof atmospheric response to Pacific tropical instability waves.J. Climate, 16, 3722–3737.
Steenburgh, W. J., D. M. Schultz, and B. A. Colle, 1998: Thestructure and evolution of gap outflow over the Gulf of Te-huantepec, Mexico. Mon. Wea. Rev., 126, 2673–2691.
Sun, Z., and L. Rikus, 1999: Improved application of exponential
sum fitting transmissions to inhomogeneous atmosphere. J.Geophys. Res., 102, 6291–6303.
Tiedtke, M., 1989: A comprehensive mass flux scheme for cumu-lus parameterization in large-scale models. Mon. Wea. Rev.,117, 1779–1800.
Umatani, S., and T. Yamagata, 1991: Response of the easterntropical Pacific to meridional migration of the ITCZ: Thegeneration of the Costa Rica Dome. J. Phys. Oceanogr., 21,346–363.
Waliser, D. E., and N. E. Graham, 1993: Convective cloud systemsand warm-pool sea surface temperatures: Coupled interac-tion and self-regulation. J. Geophys. Res., 98, 12 881–12 893.
Wang, C., S.-P. Xie, and J. A. Carton, 2004: A global survey ofocean-atmosphere and climate variability. Earth Climate: TheOcean-Atmosphere Interaction, Geophys. Monogr., No. 147,Amer. Geophys. Union, 1–19.
Wang, Y., 2001: An explicit simulation of tropical cyclone with atriply nested movable mesh primitive equation model:TCM3. Part I: Model description and control experiment.Mon. Wea. Rev., 129, 1370–1394.
——, O. L. Sen, and B. Wang, 2003: A highly resolved regionalclimate model (IPRC–RegCM) and its simulation of the 1998severe precipitation event over China. Part I: Model descrip-tion and verification of simulation. J. Climate, 16, 1721–1738.
——, S.-P. Xie, H. Xu, and B. Wang, 2004: Regional model simu-lations of boundary layer clouds over the Southeast Pacificoff South America. Part I: Control experiment. Mon. Wea.Rev., 132, 274–296.
Wentz, F. J., C. Gentemann, D. Smith, and D. Chelton, 2000:Satellite measurements of sea surface temperature throughclouds. Science, 288, 847–850.
Woodruff, S. D., R. J. Slutz, R. L. Jenne, and P. M. Steurer, 1987:A comprehensive ocean–atmosphere data set. Bull. Amer.Meteor. Soc., 68, 1239–1250.
Xie, P., and P. A. Arkin, 1996: Analyses of global monthly pre-cipitation using gauge observations, satellite estimates, andnumerical model predictions. J. Climate, 9, 840–858.
Xie, S.-P., 2004a: Satellite observations of cool ocean-atmosphereinteraction. Bull. Amer. Meteor. Soc., 85, 195–208.
——, 2004b: The shape of continents, air-sea interaction, and therising branch of the Hadley circulation. The Hadley Circula-tion: Past, Present and Future, H. F. Diaz and R. S. Bradley,Eds., Kluwer Academic, 121–152.
——, H. Xu, W. S. Kessler, and M. Nonaka, 2005: Air-sea inter-action over the eastern Pacific warm pool: Gap winds, ther-mocline dome, and atmospheric convection. J. Climate, 18,5–25.
Xu, H., Y. Wang, and S.-P. Xie, 2004: Effects of the Andes oneastern Pacific climate: A regional atmospheric model study.J. Climate, 17, 589–602.
Zhang, C., 2001: Double ITCZs. J. Geophys. Res., 106, 11 785–11 792.
15 SEPTEMBER 2005 X U E T A L . 3873


![Jc05 plages espagnoles [ Adult only ]](https://static.fdocuments.net/doc/165x107/58836ef91a28ab536b8b6cb3/jc05-plages-espagnoles-adult-only-.jpg)


