Effects of a $15 Minimum Wage in California and...
79
Effects of a $15 Minimum Wage in California and Fresno By Michael Reich, Sylvia Allegretto and Claire Montialoux With the assistance of Ian Perry Michael Reich is a Professor at UC Berkeley and Co-Chair of the Center on Wage and Employment Dynamics at UC Berkeley’s Institute for Research on Labor and Employment (IRLE). Sylvia Allegretto is a Research Economist and Co-Chair of the Center on Wage and Employment Dynamics at IRLE. Claire Montialoux is an Economics Researcher at IRLE. Ian Perry is a member of the UC Berkeley IRLE Minimum Wage Research Group. POLICY BRIEF January 2017
Transcript of Effects of a $15 Minimum Wage in California and...
The Effects of a $15 Minimum Wage by 2023 in California 1
Effects of a $15 Minimum Wage in California and Fresno By Michael Reich, Sylvia Allegretto and Claire Montialoux
With the assistance of Ian Perry
Michael Reich is a Professor at UC Berkeley and Co-Chair of the Center on Wage and Employment Dynamics at UC Berkeley’s Institute for Research on Labor and Employment (IRLE). Sylvia Allegretto is a Research Economist and Co-Chair of the Center on Wage and Employment Dynamics at IRLE. Claire Montialoux is an Economics Researcher at IRLE. Ian Perry is a member of the UC Berkeley IRLE Minimum Wage Research Group.
POLICY BRIEF January 2017
The Effects of a $15 Minimum Wage by 2023 in California 2
CONTENTS KEY FINDINGS ........................................................................................................................................ 3
PART 1. POLICY CONTEXT ...................................................................................................................... 8
1. Economic context ........................................................................................................................... 9
2. Minimum wage eligibility and increase schedule ...................................................................... 12
PART 2. EMPLOYMENT ANALYSIS: California ..................................................................................... 14
1. Previous minimum wage research .............................................................................................. 15
2. The UC Berkeley IRLE minimum wage model ............................................................................ 17
3. Effects on workers ....................................................................................................................... 21
4. Effects on businesses .................................................................................................................. 26
5. Effects on employment ................................................................................................................ 29
PART 3. EMPLOYMENT ANALYSIS: FRESNO COUNTY ........................................................................ 40
1. Fresno: the Economic Context .................................................................................................... 41
2. Employment Analysis for Fresno County .................................................................................... 46
CONCLUSION ........................................................................................................................................ 54
APPENDIX: DATA AND METHODS ........................................................................................................ 57
Calibrating the UC Berkeley IRLE minimum wage model .............................................................. 58
Endnotes ............................................................................................................................................... 67
References ............................................................................................................................................ 70
The Effects of a $15 Minimum Wage by 2023 in California 3
KEY FINDINGS
The Effects of a $15 Minimum Wage by 2023 in California 4
We present here an analysis of the pay and employment effects of the scheduled minimum wage increases to $15 by 2023 in California as a whole and in Fresno County, one of the poorest areas in the state.
Critics of minimum wage increases often cite factors that will reduce employment, such as automation or reduced sales, as firms raise prices to recoup their increased costs. Advocates often argue that better-paid workers are less likely to quit and will be more productive, and that a minimum wage increase positively affects jobs and economic output as workers can increase their consumer spending. Here we take into account all of these often competing factors to assess the net effects of the policy.
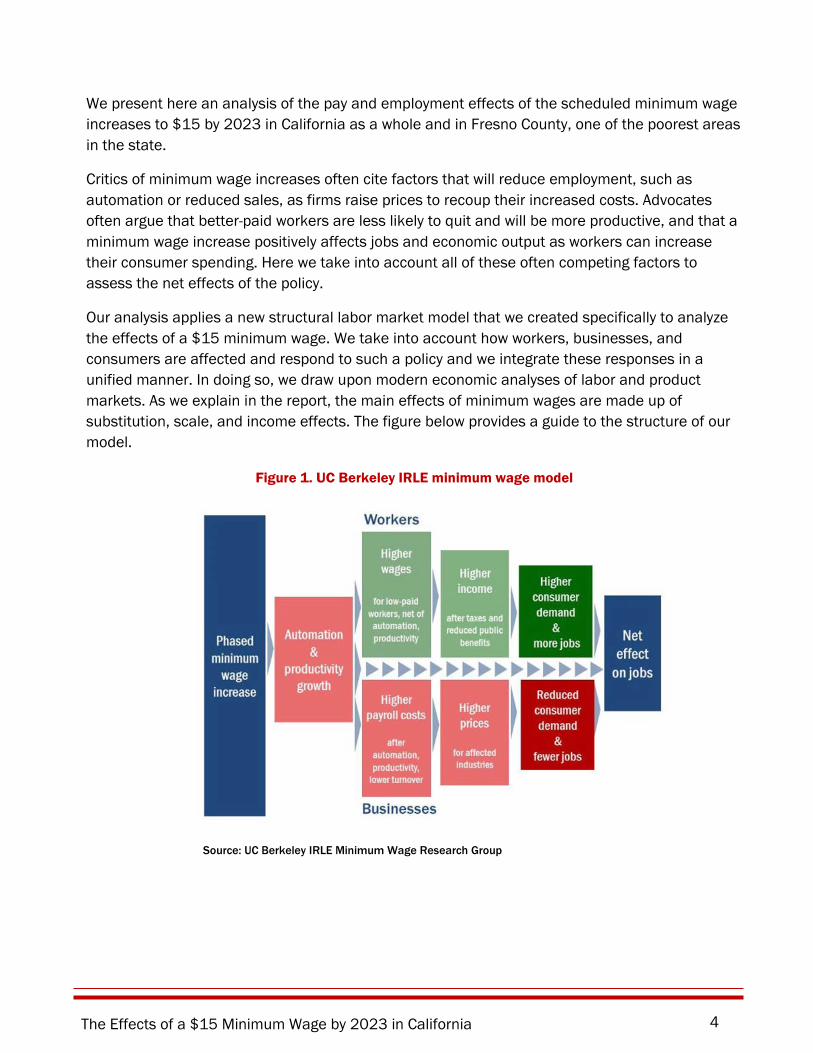
Our analysis applies a new structural labor market model that we created specifically to analyze the effects of a $15 minimum wage. We take into account how workers, businesses, and consumers are affected and respond to such a policy and we integrate these responses in a unified manner. In doing so, we draw upon modern economic analyses of labor and product markets. As we explain in the report, the main effects of minimum wages are made up of substitution, scale, and income effects. The figure below provides a guide to the structure of our model.
Figure 1. UC Berkeley IRLE minimum wage model
Source: UC Berkeley IRLE Minimum Wage Research Group
The Effects of a $15 Minimum Wage by 2023 in California 5
Our data are drawn from the Census Bureau’s American Community Survey and from other Census and U.S. Bureau of Labor Statistics datasets. We also make use of the extensive research conducted by economists—including ourselves—in recent years on minimum wages, and upon research on related economic topics.
Our estimates of the effects of a $15 minimum wage are also based upon existing research on labor markets, business operations, and consumer markets. Our estimates compare employment numbers with the adopted policy to employment numbers if the policy had not been adopted. Other factors that may affect employment by 2023 are therefore outside the scope of our analysis.
Our analysis does not incorporate recent laws that raise minimum wage in numerous California cities to $15 on a faster pace than the statewide policy. We do so to simplify the presentation and to focus on the overall statewide impact by 2023.
We pay special attention to Fresno County because it is one of the poorest areas in the state. Many better-off and more expensive California cities have already examined the effects of higher minimum wages and enacted their own $15 laws. We consider here the effects of a $15 minimum wage in a less affluent and lower costs of living area of the state.
Economic context
• California has more than recovered from the Great Recession. Indeed, California’s economic growth ranks as one of the highest rates among all fifty states. As a result, California’s unemployment rate has fallen from its 2010 recession peak of 12.5 percent in 2010 to 5.3 percent in November 2016, close to the 2007 pre-recession annual rate (5.4 percent in November 2007).
• Despite improving economic conditions, median real earnings in California were about the same in 2015 as their 2007 pre-recession level.
Effects on workers
• Increasing the minimum wage to $15 would increase earnings for 5.26 million workers, or 38.0 percent of California’s workforce.
• Among those getting raises, annual pay would increase 25.4 percent, or about $3,900 (in 2015 dollars) on average.
• 96 percent of workers who would get increases are over 20; 58.2 percent are over 30.
• Latinos comprise 55 percent of workers getting increases.
The Effects of a $15 Minimum Wage by 2023 in California 6
• Workers who would get pay increases are less-educated than the overall workforce, but almost half (47.3 percent) have at least some college experience.
• Workers getting increases are disproportionately employed in part-time jobs and are less likely to have health insurance through their employer.
• Workers who would get pay increases earn close to half of their family’s income.
• There are downstream benefits from the proposed wage increase, such as improved health outcomes for both workers and their children, and increases in children’s school achievement and cognitive and behavioral outcomes.
Effects on businesses and consumers
• Three industries account for almost 40 percent of the private sector workers who would be getting increases in California: retail trade (16.5 percent), restaurants (14.6 percent), and health services (8.2 percent).
• 79.2 percent of workers in the restaurant industry would receive a wage increase.
• Total wage costs would increase by 15.7 percent for restaurants and 2.8 percent across all employers.
• Employee turnover reduction, automation, and increases in worker productivity would offset some of these payroll cost increases.
• Businesses could absorb the remaining payroll cost increases by increasing prices by 0.6 percent through 2023. This price increase is well below the annual inflation rate of 1.8 percent over the past five years. Price increases in restaurants would be 5.1 percent.
• The consumers who would pay these increased prices range across the entire income distribution.
Net effect on employment in California
• Using past trends on population and employment, we project that state employment without the minimum wage increases will grow 1.40 percent annually between 2016 and 2023.
• Our estimate projects a very small increase in employment growth relative to what would occur without the minimum wage increase. This slightly higher job growth would add 13,980 more jobs by 2023, raising employment by 0.1 percent by 2023..
• Like all forecasts, our results may differ if other economic conditions change.
The Effects of a $15 Minimum Wage by 2023 in California 7
• A $15 statewide minimum wage by 2023 would generate a significant increase in earnings for about 5.26 million workers in California while creating a small price increase borne by all consumers.
• Our estimates for Fresno County project larger wage and cost effects and a close to zero but positive effect on employment.
• How can such a major improvement in living standards occur without adverse employment effects? The answer is that minimum wage increases generate both negative and positive employment effects. A higher minimum wage induces some automation, as well as increased worker productivity and slightly higher prices; these are the negative effects. A minimum wage increase simultaneously reduces employee turnover, which reduces employers’ costs, and it increases worker purchasing power, which stimulates consumer demand. These are the positive effects. As it turns out, these negative and positive effects on employment largely offset each other, in both California and in Fresno County.
The Effects of a $15 Minimum Wage by 2023 in California 8
PART 1. POLICY CONTEXT
The Effects of a $15 Minimum Wage by 2023 in California 9
1. ECONOMIC CONTEXT
We review here current economic conditions in California. We focus on how four economic indicators changed during the Great Recession and the subsequent recovery: unemployment, job growth, employment rates, and worker pay. Each provides a somewhat different perspective on the nature of the current recovery.
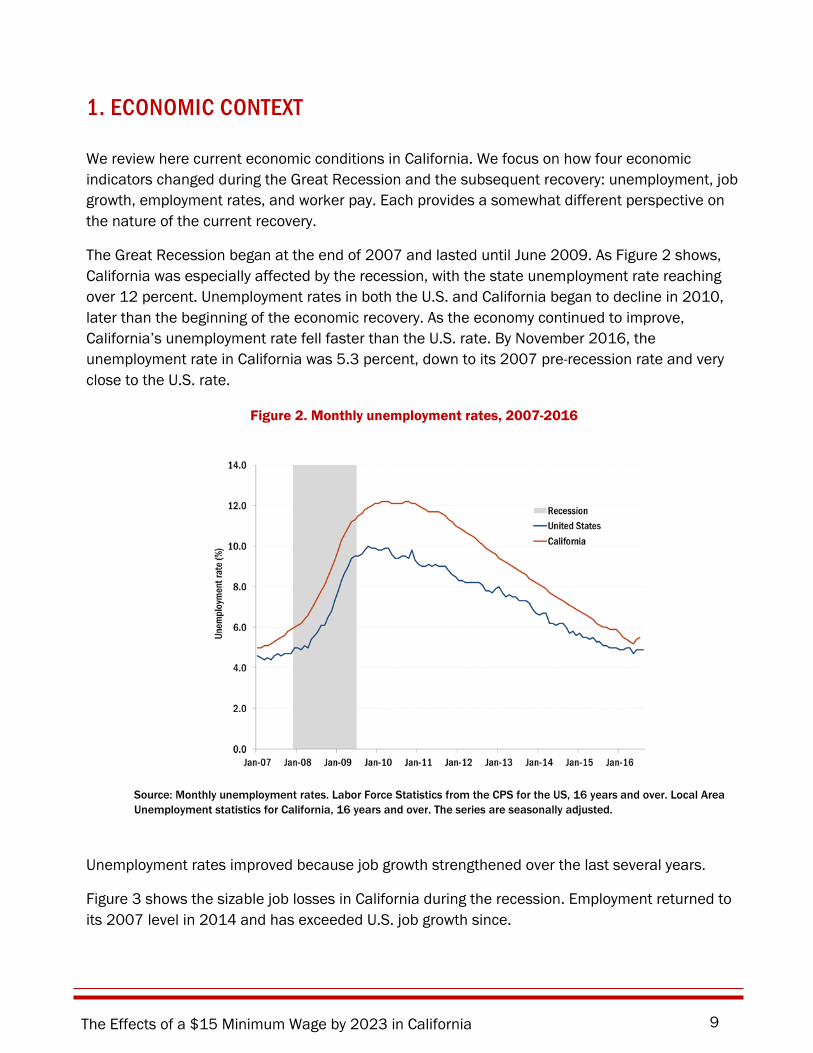
The Great Recession began at the end of 2007 and lasted until June 2009. As Figure 2 shows, California was especially affected by the recession, with the state unemployment rate reaching over 12 percent. Unemployment rates in both the U.S. and California began to decline in 2010, later than the beginning of the economic recovery. As the economy continued to improve, California’s unemployment rate fell faster than the U.S. rate. By November 2016, the unemployment rate in California was 5.3 percent, down to its 2007 pre-recession rate and very close to the U.S. rate.
Figure 2. Monthly unemployment rates, 2007-2016
Source: Monthly unemployment rates. Labor Force Statistics from the CPS for the US, 16 years and over. Local Area Unemployment statistics for California, 16 years and over. The series are seasonally adjusted.
Unemployment rates improved because job growth strengthened over the last several years.
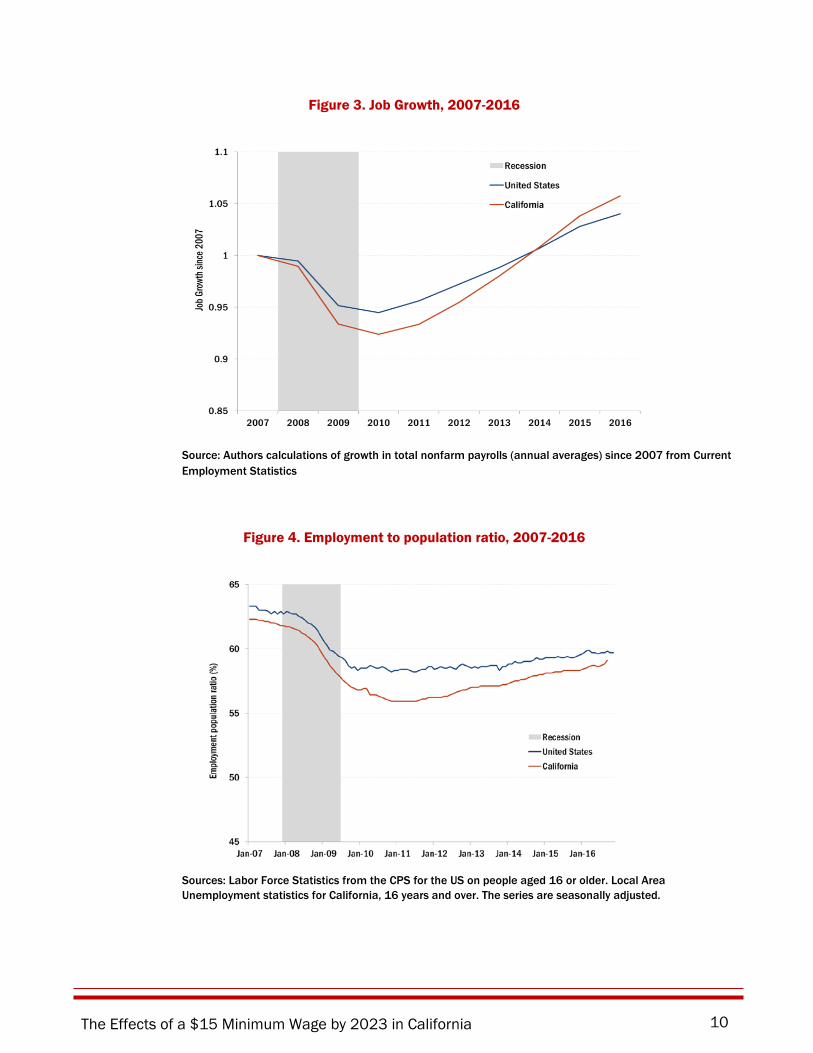
Figure 3 shows the sizable job losses in California during the recession. Employment returned to its 2007 level in 2014 and has exceeded U.S. job growth since.
The Effects of a $15 Minimum Wage by 2023 in California 10
Figure 3. Job Growth, 2007-2016
Source: Authors calculations of growth in total nonfarm payrolls (annual averages) since 2007 from Current Employment Statistics
Figure 4. Employment to population ratio, 2007-2016
Sources: Labor Force Statistics from the CPS for the US on people aged 16 or older. Local Area Unemployment statistics for California, 16 years and over. The series are seasonally adjusted.
The Effects of a $15 Minimum Wage by 2023 in California 11
Figure 4 depicts trends in the employment rate- - the share of the working age population that is employed. This indicator is a companion to the unemployment rate as it counts workers who stopped looking for work. The employment rate in California fell rapidly during the Great Recession and has recovered since 2010, but remains well below its pre-recession level. (Long-term demographic forces are partly responsible for the weak recovery of the employment rate.)
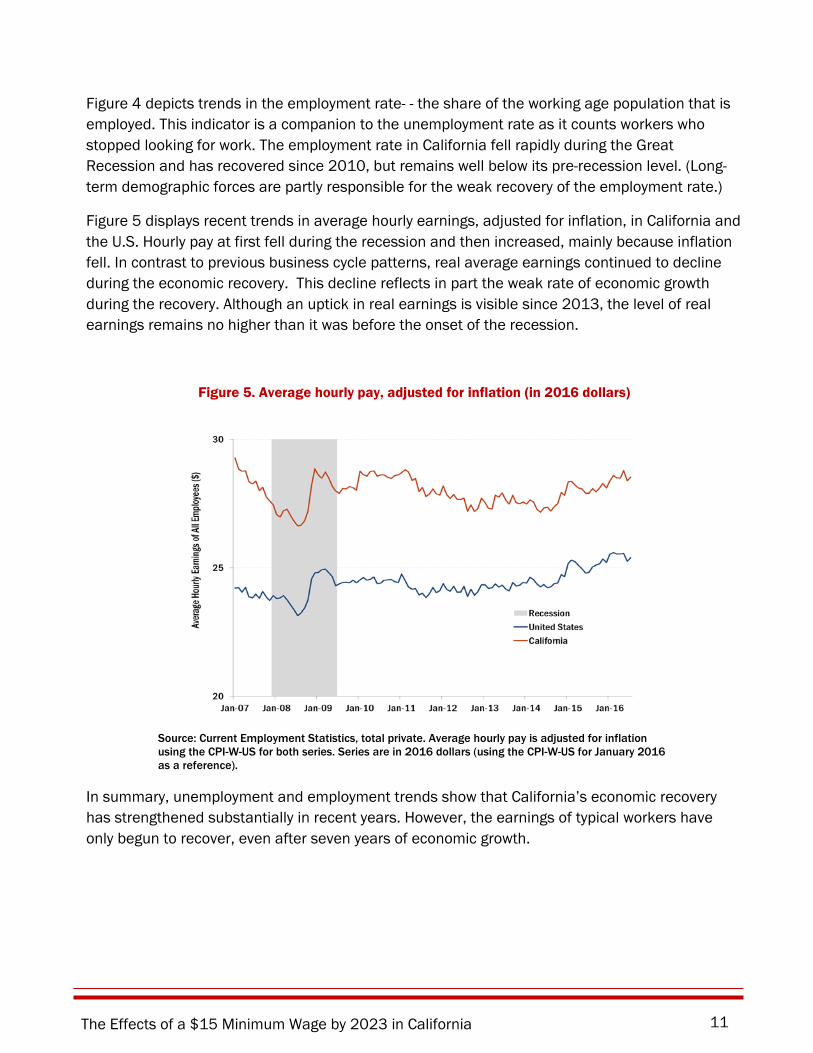
Figure 5 displays recent trends in average hourly earnings, adjusted for inflation, in California and the U.S. Hourly pay at first fell during the recession and then increased, mainly because inflation fell. In contrast to previous business cycle patterns, real average earnings continued to decline during the economic recovery. This decline reflects in part the weak rate of economic growth during the recovery. Although an uptick in real earnings is visible since 2013, the level of real earnings remains no higher than it was before the onset of the recession.
Figure 5. Average hourly pay, adjusted for inflation (in 2016 dollars)
Source: Current Employment Statistics, total private. Average hourly pay is adjusted for inflation using the CPI-W-US for both series. Series are in 2016 dollars (using the CPI-W-US for January 2016 as a reference).
In summary, unemployment and employment trends show that California’s economic recovery has strengthened substantially in recent years. However, the earnings of typical workers have only begun to recover, even after seven years of economic growth.
The Effects of a $15 Minimum Wage by 2023 in California 12
2. MINIMUM WAGE ELIGIBILITY AND INCREASE SCHEDULE
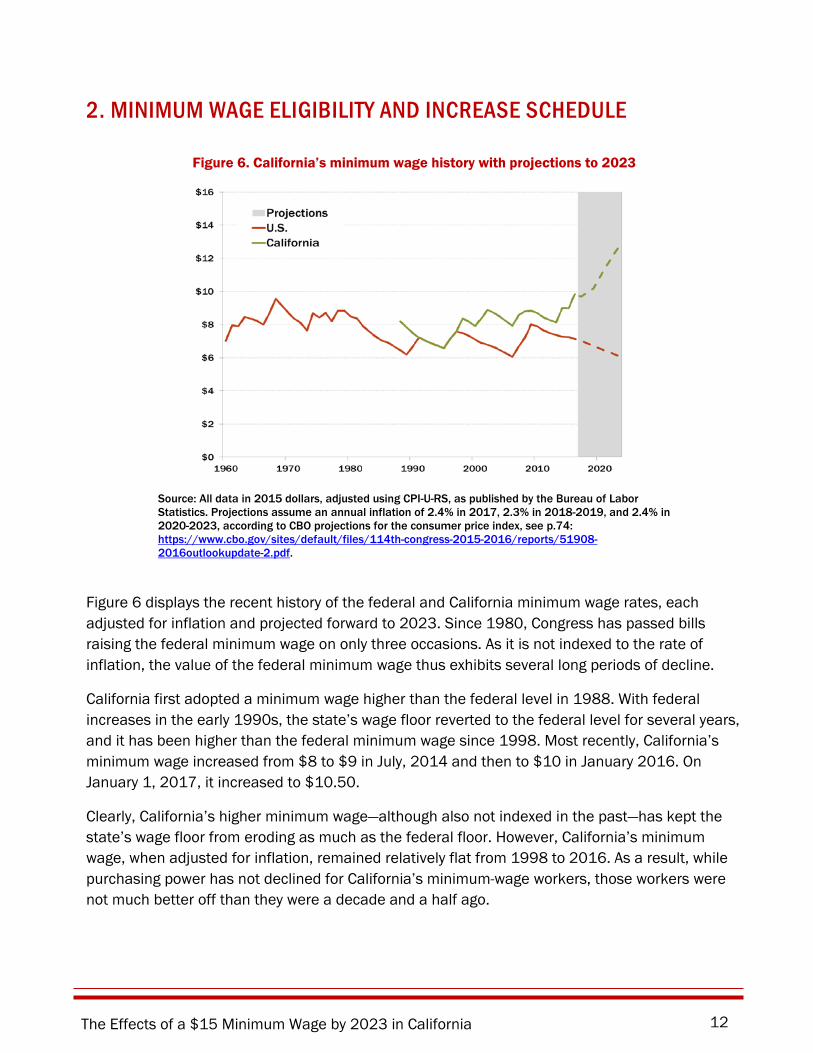
Figure 6. California’s minimum wage history with projections to 2023
Source: All data in 2015 dollars, adjusted using CPI-U-RS, as published by the Bureau of Labor Statistics. Projections assume an annual inflation of 2.4% in 2017, 2.3% in 2018-2019, and 2.4% in 2020-2023, according to CBO projections for the consumer price index, see p.74: https://www.cbo.gov/sites/default/files/114th-congress-2015-2016/reports/51908-2016outlookupdate-2.pdf.
Figure 6 displays the recent history of the federal and California minimum wage rates, each adjusted for inflation and projected forward to 2023. Since 1980, Congress has passed bills raising the federal minimum wage on only three occasions. As it is not indexed to the rate of inflation, the value of the federal minimum wage thus exhibits several long periods of decline.
California first adopted a minimum wage higher than the federal level in 1988. With federal increases in the early 1990s, the state’s wage floor reverted to the federal level for several years, and it has been higher than the federal minimum wage since 1998. Most recently, California’s minimum wage increased from $8 to $9 in July, 2014 and then to $10 in January 2016. On January 1, 2017, it increased to $10.50.
Clearly, California’s higher minimum wage—although also not indexed in the past—has kept the state’s wage floor from eroding as much as the federal floor. However, California’s minimum wage, when adjusted for inflation, remained relatively flat from 1998 to 2016. As a result, while purchasing power has not declined for California’s minimum-wage workers, those workers were not much better off than they were a decade and a half ago.
The Effects of a $15 Minimum Wage by 2023 in California 13
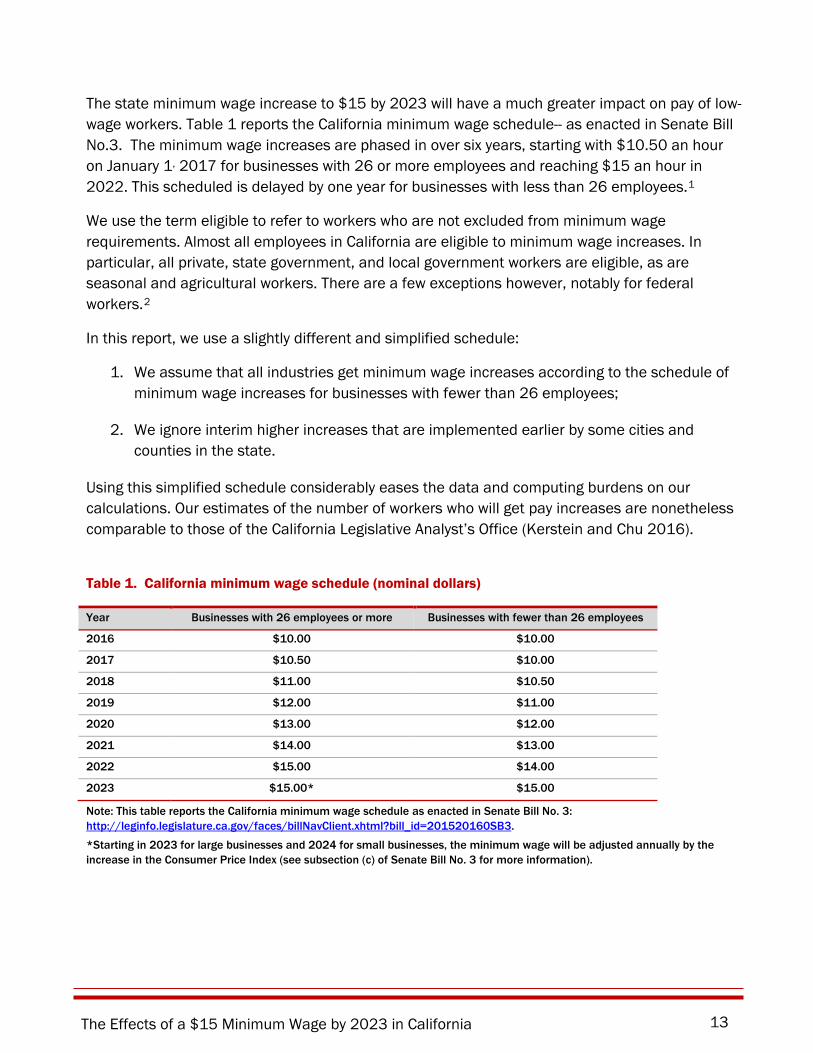
The state minimum wage increase to $15 by 2023 will have a much greater impact on pay of low-wage workers. Table 1 reports the California minimum wage schedule-- as enacted in Senate Bill No.3. The minimum wage increases are phased in over six years, starting with $10.50 an hour on January 1, 2017 for businesses with 26 or more employees and reaching $15 an hour in 2022. This scheduled is delayed by one year for businesses with less than 26 employees.1
We use the term eligible to refer to workers who are not excluded from minimum wage requirements. Almost all employees in California are eligible to minimum wage increases. In particular, all private, state government, and local government workers are eligible, as are seasonal and agricultural workers. There are a few exceptions however, notably for federal workers.2
In this report, we use a slightly different and simplified schedule:
1. We assume that all industries get minimum wage increases according to the schedule of minimum wage increases for businesses with fewer than 26 employees;
2. We ignore interim higher increases that are implemented earlier by some cities and counties in the state.
Using this simplified schedule considerably eases the data and computing burdens on our calculations. Our estimates of the number of workers who will get pay increases are nonetheless comparable to those of the California Legislative Analyst’s Office (Kerstein and Chu 2016).
Table 1. California minimum wage schedule (nominal dollars)
Year Businesses with 26 employees or more Businesses with fewer than 26 employees
2016 $10.00 $10.00
2017 $10.50 $10.00
2018 $11.00 $10.50
2019 $12.00 $11.00
2020 $13.00 $12.00
2021 $14.00 $13.00
2022 $15.00 $14.00
2023 $15.00* $15.00
Note: This table reports the California minimum wage schedule as enacted in Senate Bill No. 3: http://leginfo.legislature.ca.gov/faces/billNavClient.xhtml?bill_id=201520160SB3.
*Starting in 2023 for large businesses and 2024 for small businesses, the minimum wage will be adjusted annually by the increase in the Consumer Price Index (see subsection (c) of Senate Bill No. 3 for more information).
The Effects of a $15 Minimum Wage by 2023 in California 14
PART 2. EMPLOYMENT ANALYSIS: CALIFORNIA
The Effects of a $15 Minimum Wage by 2023 in California 15
1. PREVIOUS MINIMUM WAGE RESEARCH
In the past two decades, economists have conducted numerous econometric studies of the effects of minimum wages. The overwhelming majority of these studies focused on the employment effects (Belman and Wolfson 2014; Belman and Wolfson 2015; Schmitt 2015). Typically these studies make use of panel data on workers or firms from standard government sources such as the Current Population Survey or the Quarterly Census on Employment and Wages.
Most extant research on minimum wages does not detect significant effects on workers age 20 and over. Observers attribute the lack of visible effects to the relatively small proportion of adults who were affected by past minimum wage increases in the U.S.3 Minimum wage effects should be detectible, however, by examining groups that are more affected, notably teens and restaurant workers (Brown 1999).
Economists have therefore focused on these two groups. After two decades of methodological controversy among researchers, the literature has produced some areas of agreement. In particular, recent studies of the effects on restaurant workers by researchers with opposing methodological views have arrived at a consensus: the employment effects are either extremely small or non-existent.4 The effects of minimum wages on teen employment remain somewhat controversial. Some researchers find significant but not large negative effects (Neumark, Salas, and Wascher 2014) while others find effects that are much smaller, close to zero (Allegretto et al. forthcoming).
The remaining controversy over effects on teens has become less relevant than it once was. While teens once comprised one-fourth of all workers affected by minimum wages nationwide, their importance has fallen to less than half that level today. As we show below, teens represent only 4 percent of the workers who would be affected by the proposed $15 California minimum wage. Moreover, compared to teens, the rest of the low-wage workforce is older and has more work experience and schooling than was the case in previous decades. Results that are specific to teens are therefore not as informative for the effects on the workforce as a whole.
This minimum wage research uses quasi-experimental methods, exploiting time and state variation between 1979 and 2014 in federal and state minimum wages to identify causal effects. The most credible of these studies use state of the art statistical methods to ensure that the causal comparisons do not reflect confounding correlations. However, the minimum wage changes in these past experiences, which peak at about $10, were modest, in the sense that they generated increases for at most 8-10 percent of the workforce.5 In contrast, we estimate below that approximately 38 percent of all eligible workers in California will receive a wage increase as a result of the minimum wage increases to $15. As a result, this previous research is at best only suggestive of the effects we consider here.
The Effects of a $15 Minimum Wage by 2023 in California 16
Moreover, this quasi-experimental econometric approach does not tell us whether employment effects are the result of automation, or price increases, or increases in consumer demand, or other possible mechanisms. Instead, it incorporates the results of all these mechanisms without identifying which are at work. As we discuss below, understanding the importance of specific mechanisms is important because each has effects on different parts of the wage distribution.
Since the quasi-experimental econometric approach is not appropriate for our study, we draw here upon the other major empirical method used by economists—building and calibrating a structural model. Thus, in order to better understand the impacts of a larger minimum wage increase, we model how the minimum wage policy works its way through the California economy, examining workers, businesses, and consumers. We incorporate outcomes from economists’ best research on labor markets, business practices, and consumer spending to construct a structural, multi-iterative model to estimate the effects of a $15 minimum wage in California.
The Effects of a $15 Minimum Wage by 2023 in California 17
2. THE UC BERKELEY IRLE MINIMUM WAGE MODEL
In 2015, the UC Berkeley Institute for Research on Labor and Employment (IRLE) minimum wage group developed a structural model to study the prospective impacts of a $15 minimum wage in Los Angeles.6 This model was further enhanced to study the effects of a $15 minimum wage in New York State and in Santa Clara County (Reich et al. 2016a, b). The current report, which uses that model, contains two components:
• A wage simulation model that predicts the number of workers that will be affected by (i.e., receive) minimum wage increases. The results of this model are described in the first part of this report, and the model itself is described in detail in the appendix.
• An economic impact model that predicts the effect of minimum wage increases, given the structure of the workforce affected, on consumer demand. We focus on the latter in this section.
We also adapt the model to apply to California in particular. Our estimates draw on standard government data sources, the large body of economic research on the minimum wage, other research studies, and a standard regional economic model (IMPLAN). These data sources and models are fully documented in the text, accompanying endnotes, and in the appendix.
Our economic impact model recognizes that higher minimum wages will affect labor supply and labor demand. Adjustments to labor supply include lower employee turnover. We do not consider increases in labor force participation. Standard labor supply studies of low-wage labor markets find elasticities of about 0.3, low enough to ignore as a first approximation. In future work we will incorporate our own estimates of minimum wage labor supply elasticities.
Adjustments to labor demand include possible substitutions of capital or materials for labor and skilled labor for unskilled labor, greater worker productivity when wages rise, reductions in employment because higher prices reduce sales, and increases in employment because workers’ spending out of their higher income will increase sales and employment. The net effect depends upon the magnitudes of the individual adjustments, again taking into account interactions among them.
The labor demand model draws from standard labor economic textbook analyses. For industry labor demand, these analyses incorporate “substitution” and “scale” effects in labor, capital, and goods markets. For a formal version of this labor demand model, see Cahuc, Carcillo and Zylberg (2014). Since our concern here is on the effects of an economy-wide minimum wage, we add an “income effect.” The income effect accounts for changes in the level of economic output when wage increases lead to increased consumer demand.
The Effects of a $15 Minimum Wage by 2023 in California 18
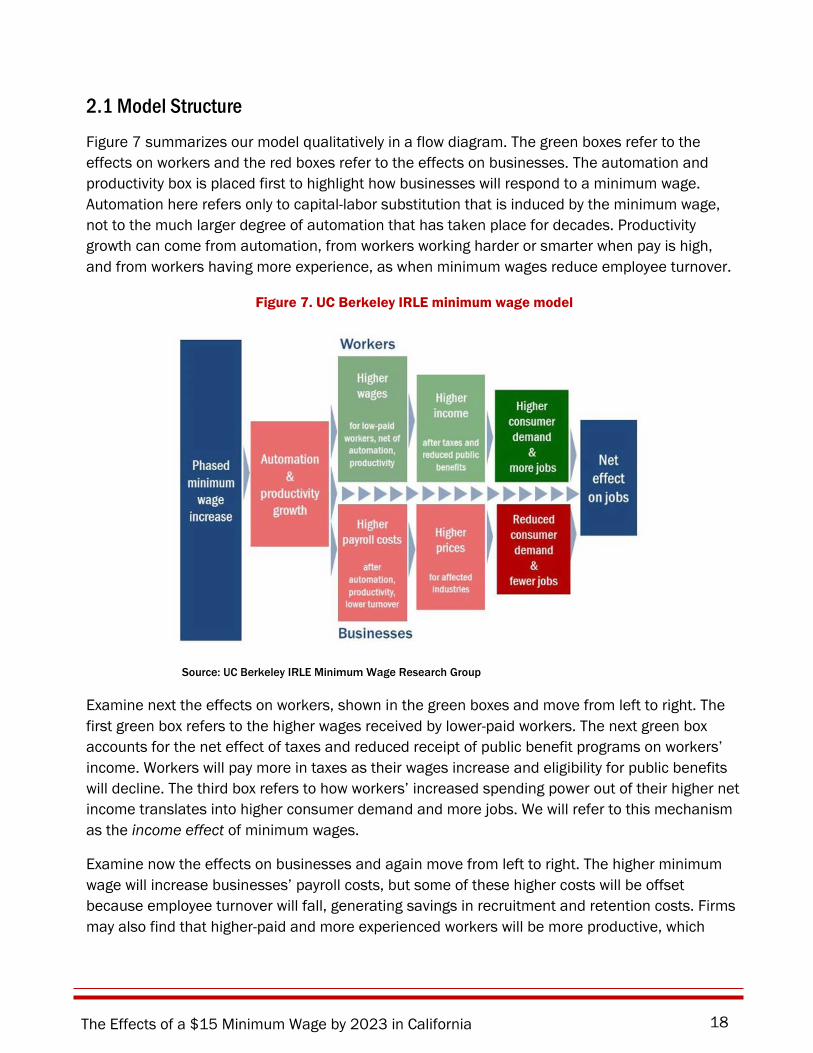
2.1 Model Structure Figure 7 summarizes our model qualitatively in a flow diagram. The green boxes refer to the effects on workers and the red boxes refer to the effects on businesses. The automation and productivity box is placed first to highlight how businesses will respond to a minimum wage. Automation here refers only to capital-labor substitution that is induced by the minimum wage, not to the much larger degree of automation that has taken place for decades. Productivity growth can come from automation, from workers working harder or smarter when pay is high, and from workers having more experience, as when minimum wages reduce employee turnover.
Figure 7. UC Berkeley IRLE minimum wage model
Source: UC Berkeley IRLE Minimum Wage Research Group
Examine next the effects on workers, shown in the green boxes and move from left to right. The first green box refers to the higher wages received by lower-paid workers. The next green box accounts for the net effect of taxes and reduced receipt of public benefit programs on workers’ income. Workers will pay more in taxes as their wages increase and eligibility for public benefits will decline. The third box refers to how workers’ increased spending power out of their higher net income translates into higher consumer demand and more jobs. We will refer to this mechanism as the income effect of minimum wages.
Examine now the effects on businesses and again move from left to right. The higher minimum wage will increase businesses’ payroll costs, but some of these higher costs will be offset because employee turnover will fall, generating savings in recruitment and retention costs. Firms may also find that higher-paid and more experienced workers will be more productive, which
The Effects of a $15 Minimum Wage by 2023 in California 19
could also offset payroll cost increases. In other words, one effect of a higher minimum wage is to induce more efficient management practices.
Higher payroll costs (net of turnover and productivity savings) will lead firms to increase prices, leading to reduced consumer demand. We will refer to this adjustment mechanism as the scale effect, as it identifies reductions in the scale of output that will reduce the demand for workers.
As we have already mentioned, businesses may also respond to higher minimum wages by increasing their investment in equipment. This substitution effect (think automation) also reduces their demand for workers.
The income effect has a positive effect on employment, while the scale and substitution effects each have negative effects on employment. The sum of the income, scale, and substitution effects determines the net employment effect of the minimum wage, as shown in the blue box on the right side of Figure 7.
Figure 7 is useful for understanding the basic structure of our model. But it leaves out some important details. First, the effects on businesses and workers in the red and green boxes of the model occur simultaneously, not sequentially. The effects in reality are therefore captured only by examining the net effects on the economy and employment. These net effects are symbolized by the blue box at the right of the diagram. Second, Figure 7 omits some feedback loops that would make the figure unwieldy, but which are included in our calculations.
2.2 Model calibration and dynamics The net effect of minimum wages on employment equals the sum of the income, scale, and substitution effects. The income effect will always be positive, while the scale and substitution effects will always be negative. Whether the net effect is positive, zero, or negative therefore depends upon the relative magnitudes of its three components.
These relative magnitudes in turn depend upon the quantitative responses of workers and businesses to a minimum wage increase. We refer to the model’s parameters as the inputs that determine these multiple quantitative responses. Some of these parameters, such as the propensity to substitute capital for labor, may not vary with the magnitude of the minimum wage increase. Other parameters, such as turnover cost savings, are likely to vary with the size of the increase. As with any economic model, we calibrate our model using the best data and research findings available. The details are presented in Section 5 below and in the Appendix.
The model’s parameters and dynamics must be consistent with two conditions. First, the model must be consistent with the very small effects that researchers find for the smaller pre-2015 increases in federal and state minimum wages. Second, although labor demand in low-wage labor markets may be much less responsive to wages than is commonly thought, labor demand is not completely unresponsive. The model must therefore be consistent with growing negative
The Effects of a $15 Minimum Wage by 2023 in California 20
effects if minimum wages were to reach extremely high levels, such as at $25 or $40 per hour. The big unknown, of course, is: At what level do the effects become visibly negative and how quickly do they become more negative?
In a forthcoming paper, Reich et al. (2017) show that our calibrated model predicts extremely small effects for minimum wage increases of up to 25 percent, to a minimum wage of $10. At this minimum wage, the income, scale, and substitution effects are each very small. As the minimum wage reaches higher levels, the (positive) income effect weakens since the increase in the proportion of workers getting pay increases slows down, and because the propensity to consume of higher-paid workers is lower than that of lower paid workers. At the same time, the (negative) scale effect strengthens because turnover cost savings diminish and the price elasticity of consumer demand becomes higher for higher-priced goods.7 Our model is thus consistent with growing negative employment effects at higher minimum wage levels.
We have tested our model’s calibration by undertaking a series of robustness tests. The tests show that this net effect changes by small amounts when we vary the model’s parameters (Reich et al. 2017). In the next sections, we discuss how we quantify the effects in each of the boxes in Figure 6.
The Effects of a $15 Minimum Wage by 2023 in California 21
3. EFFECTS ON WORKERS
We begin by analyzing the effects of the minimum wage increases on workers. To estimate these effects, we use publicly-available government datasets to model (a) the number of workers who would receive pay increases under the two minimum wage scenarios and (b) the size of those wage increases. We exclude federal and state government employees, local school district employees, In Home Supportive Services (IHSS) workers, and self-employed workers from our analysis, since those groups of workers would not be eligible for local minimum wage laws.
Specifically, our model produces two different simulations of the future wage distribution. First, we conduct a baseline simulation, in which we assume that the minimum wage will increase each year according to minimum wage laws that are already in effect (see Tables 1 and 2 above). Second, we conduct a simulation that models the future wage distribution under each of the two minimum wage increase scenarios.
We then compare the baseline and scenario simulations and estimate, for each yearly phase-in step, the number of workers that would be affected by the scenario and the additional wages they would receive as a result, above and beyond any currently scheduled minimum wage increases. In constructing these estimates, our model adjusts for expected growth in employment, wages and inflation over time. Our estimates also take into account what is often referred to as a “ripple” or “compression” effect: workers who make slightly more that the scenario minimum wage are also likely to receive wage increases.
3.1 Workforce Impacts Table 3 shows the estimated number and percentage of eligible workers who will receive pay increases by 2023. We estimate that 5.26 million California workers will receive a pay raise by 2023, or about 38 percent of the eligible workforce. Of these, 3.95 million would receive increases because their pay would otherwise be below $15 per hour when the increases would be fully implemented in 2023 (the group directly affected by the law). Another 1.32 million would receive pay increases because their pay would be only slightly more than $15 when the increases would be fully implemented (this the group indirectly affected by the law).
The Effects of a $15 Minimum Wage by 2023 in California 22
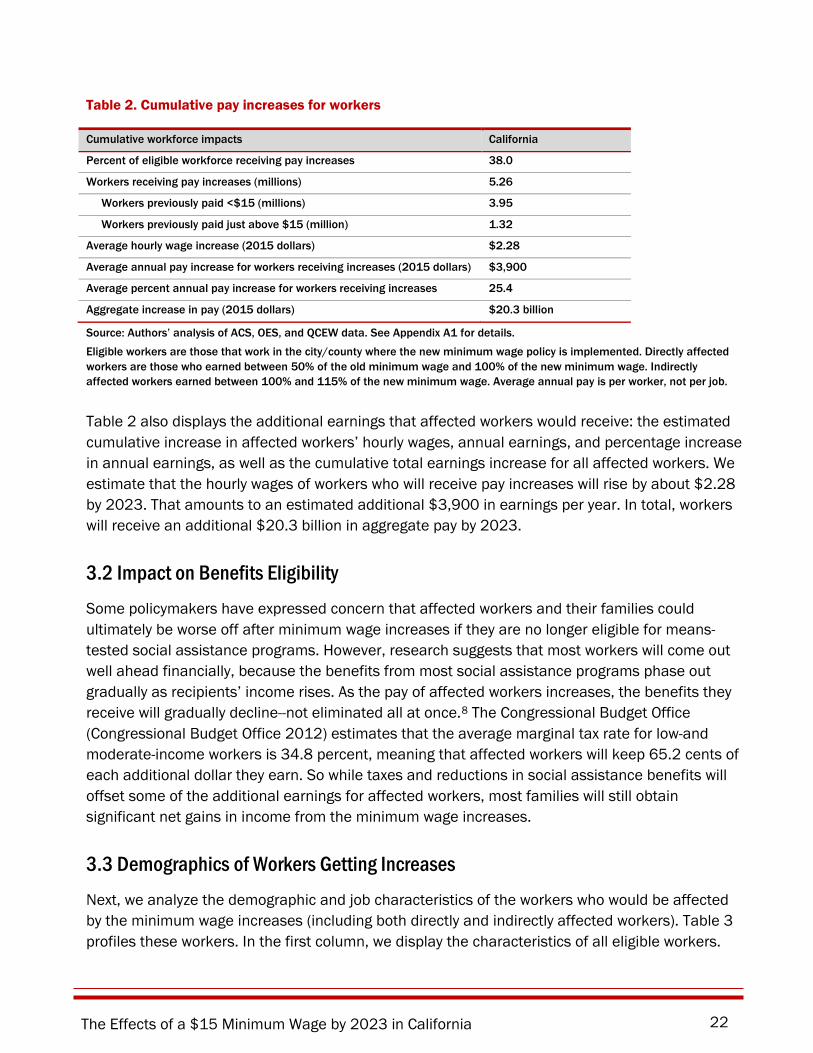
Table 2. Cumulative pay increases for workers
Cumulative workforce impacts California Percent of eligible workforce receiving pay increases 38.0 Workers receiving pay increases (millions) 5.26 Workers previously paid <$15 (millions) 3.95 Workers previously paid just above $15 (million) 1.32 Average hourly wage increase (2015 dollars) $2.28
Average annual pay increase for workers receiving increases (2015 dollars) $3,900 Average percent annual pay increase for workers receiving increases 25.4 Aggregate increase in pay (2015 dollars) $20.3 billion
Source: Authors’ analysis of ACS, OES, and QCEW data. See Appendix A1 for details. Eligible workers are those that work in the city/county where the new minimum wage policy is implemented. Directly affected workers are those who earned between 50% of the old minimum wage and 100% of the new minimum wage. Indirectly affected workers earned between 100% and 115% of the new minimum wage. Average annual pay is per worker, not per job.
Table 2 also displays the additional earnings that affected workers would receive: the estimated cumulative increase in affected workers’ hourly wages, annual earnings, and percentage increase in annual earnings, as well as the cumulative total earnings increase for all affected workers. We estimate that the hourly wages of workers who will receive pay increases will rise by about $2.28 by 2023. That amounts to an estimated additional $3,900 in earnings per year. In total, workers will receive an additional $20.3 billion in aggregate pay by 2023.
3.2 Impact on Benefits Eligibility Some policymakers have expressed concern that affected workers and their families could ultimately be worse off after minimum wage increases if they are no longer eligible for means-tested social assistance programs. However, research suggests that most workers will come out well ahead financially, because the benefits from most social assistance programs phase out gradually as recipients’ income rises. As the pay of affected workers increases, the benefits they receive will gradually decline--not eliminated all at once.8 The Congressional Budget Office (Congressional Budget Office 2012) estimates that the average marginal tax rate for low-and moderate-income workers is 34.8 percent, meaning that affected workers will keep 65.2 cents of each additional dollar they earn. So while taxes and reductions in social assistance benefits will offset some of the additional earnings for affected workers, most families will still obtain significant net gains in income from the minimum wage increases.
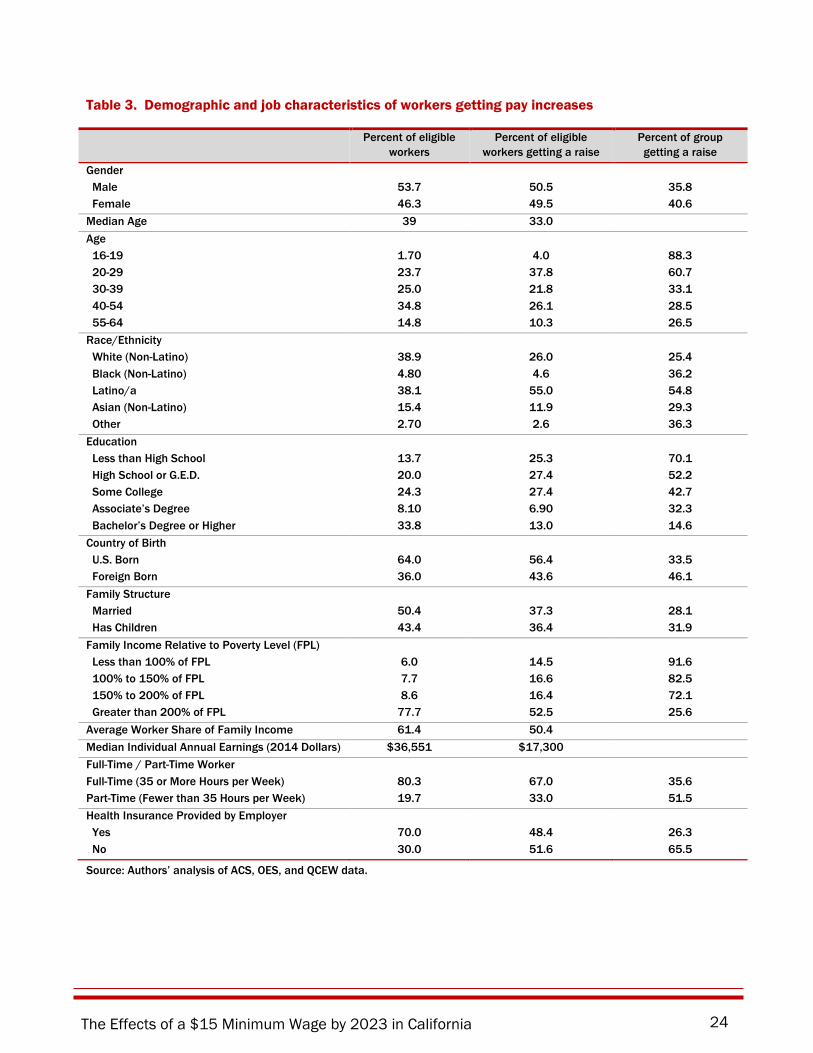
3.3 Demographics of Workers Getting Increases Next, we analyze the demographic and job characteristics of the workers who would be affected by the minimum wage increases (including both directly and indirectly affected workers). Table 3 profiles these workers. In the first column, we display the characteristics of all eligible workers.
The Effects of a $15 Minimum Wage by 2023 in California 23
For example, 53.7 percent of these workers are men and 46.3 percent are women. In the second column, we show the distribution of workers receiving pay increases by 2023. For example, we estimate that 50.5 percent of affected workers are men and 49.5percent are women. In the third column, we present the share of each demographic group that will receive a wage increase. For example, we estimate that 35.8 percent of male workers and 40.6 percent of female workers eligible for the proposed increase will receive a raise.
Contrary to the common perception that minimum wage workers are mainly teens, 96.0 percent of affected workers in California are in their twenties or older and 58.2 percent are in their thirties or older. The scenario will be particularly beneficial to Latino/a workers, as more than half of these workers (54.8 percent) will receive a raise. Workers of all education levels would benefit from the scenario, with less educated workers benefitting the most. About half of affected workers have no college education (52.7 percent)
Over a third of affected workers have children (36.4 percent) and 37.3 percent are married. Affected workers disproportionately live in low-income families, with 47.5 percent at or below 200 percent of the federal poverty level. Fully 91.6 percent of workers in poor families will receive a pay increase. On average, affected workers in California bring home 50.4 percent of their family’s income, suggesting that they are primary breadwinners in their families and are not providing supplementary income.
The median annual earnings of affected workers ($17,300 in 2014 dollars) is less than half (47.3 percent) of the median earnings for all workers in California. Affected workers are disproportionately employed in part-time or part-year jobs, and are much less likely to have health insurance provided by their employer than the overall California workforce.9
The Effects of a $15 Minimum Wage by 2023 in California 24
Table 3. Demographic and job characteristics of workers getting pay increases
Percent of eligible workers
Percent of eligible workers getting a raise
Percent of group getting a raise
Gender Male 53.7 50.5 35.8 Female 46.3 49.5 40.6 Median Age 39 33.0 Age 16-19 1.70 4.0 88.3 20-29 23.7 37.8 60.7 30-39 25.0 21.8 33.1 40-54 34.8 26.1 28.5 55-64 14.8 10.3 26.5 Race/Ethnicity White (Non-Latino) 38.9 26.0 25.4 Black (Non-Latino) 4.80 4.6 36.2 Latino/a 38.1 55.0 54.8 Asian (Non-Latino) 15.4 11.9 29.3 Other 2.70 2.6 36.3 Education Less than High School 13.7 25.3 70.1 High School or G.E.D. 20.0 27.4 52.2 Some College 24.3 27.4 42.7 Associate’s Degree 8.10 6.90 32.3 Bachelor’s Degree or Higher 33.8 13.0 14.6 Country of Birth U.S. Born 64.0 56.4 33.5 Foreign Born 36.0 43.6 46.1 Family Structure Married 50.4 37.3 28.1 Has Children 43.4 36.4 31.9 Family Income Relative to Poverty Level (FPL) Less than 100% of FPL 6.0 14.5 91.6 100% to 150% of FPL 7.7 16.6 82.5 150% to 200% of FPL 8.6 16.4 72.1 Greater than 200% of FPL 77.7 52.5 25.6 Average Worker Share of Family Income 61.4 50.4 Median Individual Annual Earnings (2014 Dollars) $36,551 $17,300 Full-Time / Part-Time Worker Full-Time (35 or More Hours per Week) 80.3 67.0 35.6 Part-Time (Fewer than 35 Hours per Week) 19.7 33.0 51.5 Health Insurance Provided by Employer Yes 70.0 48.4 26.3 No 30.0 51.6 65.5
Source: Authors’ analysis of ACS, OES, and QCEW data.
The Effects of a $15 Minimum Wage by 2023 in California 25
3.4 Downstream effects
The increases in earnings shown in Tables 2 would be substantial and would have an immediate impact on the lives of low-wage workers and their families. But it is important to recognize that there are longer-term effects of minimum wage increases as well.
Low wages have been shown to affect workers negatively in a variety of ways, but the health impacts are most pronounced. All else being equal, low wages (and in turn poverty) result in increased rates of high blood pressure and high levels of stress, as well as shorter life expectancy (Leigh and Du 2012). A recent study from the United Kingdom found that by reducing the financial strain on low-wage workers, an increase in the minimum wage improves mental health at a level comparable to the effect of antidepressants on depression (Reeves et al. 2016). In another study, additional income led to fewer arrests for parents and increases in parental supervision of their children (Akee et al. 2010). Similarly, increases in Earned Income Tax Credit (EITC) program payments led to improvements in the mental health of mothers (Evans and Garthwaite 2010; Congressional Budget Office 2012), as well as reductions in the incidence of low-birth weights (Hoynes, Miller and Simon 2015).
Multiple studies also establish a causal negative effect of low incomes on outcomes for children. A recent review of peer-reviewed articles found that 29 of 34 studies established a negative effect of poverty on children’s outcomes (Cooper and Stewart 2013). Using data from a randomized control trial of the Minnesota Family Investment Program, researchers found positive, significant effects on children’s social behavior and school engagement due to increases in income (Morris and Gennetian 2003). Other researchers analyzed data from ten such studies and found significant effects of increased income on school achievement (Rodgers 2004). Similarly, increases in the Earned Income Tax Credit lead to large benefits on math and reading test scores in elementary and middle schools (Dahl, and Lochner 2012; Chetty, Friedman and Rockoff 2011; Maxfield 2014). The EITC also increases rates of high school completion (or GED) and college attendance rates (Maxfield 2014; Manoli and Turner 2014). These outcomes in turn translate into better employment outcomes and higher earnings (Bastian and Michelmore 2015).
Generally, these studies show that additional income has a positive effect on the outcomes of children in households of all income levels. However, multiple studies also suggest that additional income has a larger effect in very-low-income households compared to middle-income households (Dahl and Lochner 2012; Akee et al. 2010; Costello et al. 2003). Some evidence indicates that additional income early in life is important to cognitive outcomes, whereas additional income in later childhood may be more important in terms of behavioral outcomes (Cooper and Stewart 2013).
The Effects of a $15 Minimum Wage by 2023 in California 26
4. EFFECTS ON BUSINESSES
How a higher minimum wage affects a firm depends on how much the firm’s operating costs change and on how the firm responds to those changes. In this section, we first identify the industries that will be highly affected by the two minimum wage increase scenarios. We then estimate the impact of the minimum wage increases on firms’ operating costs across the entire economy and for highly affected industries, taking into account savings from reduced turnover.
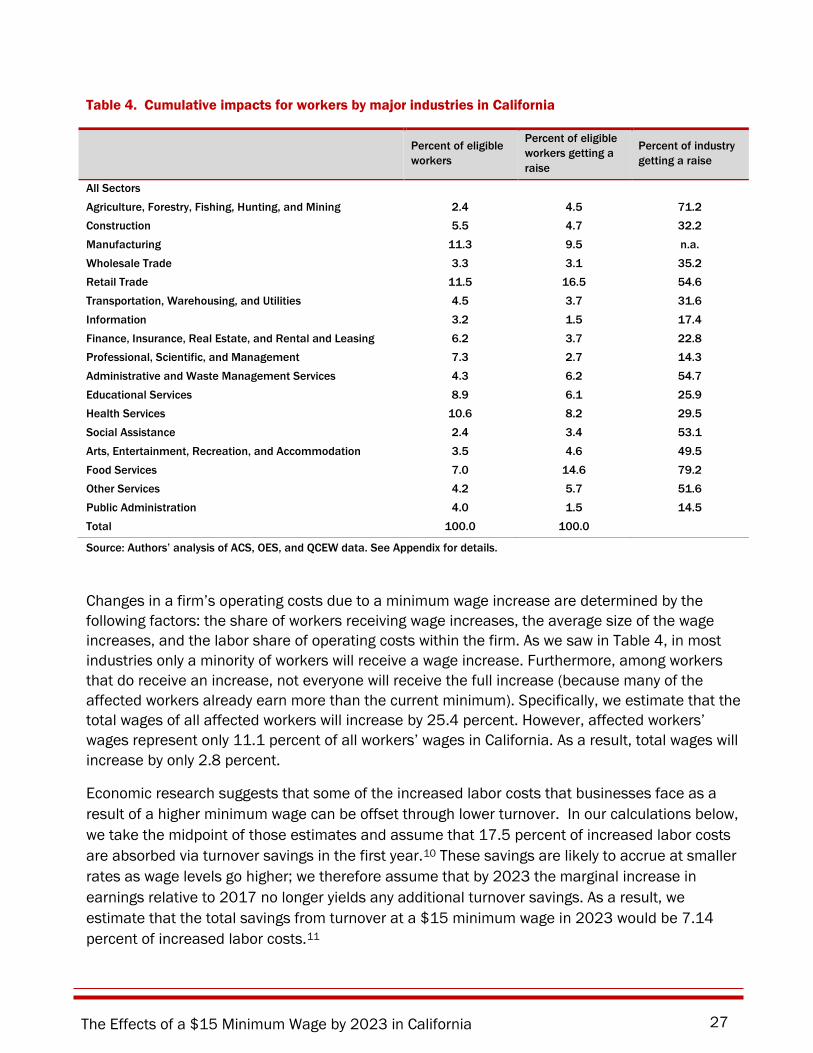
Minimum wage increases do not affect all industries equally. Table 4 shows the estimated distribution of affected workers across California’s industries by 2023. In the first column, we show the percentage of the overall eligible workforce in each industry. The second column displays our estimate of the distribution across industries of workers getting a raise. The third column presents our estimate of the percentage of workers getting a raise within each industry.
About 40 percent of affected workers are employed in just three service sector industries: food services (14.6 percent), retail (16.5 percent), and health services (8.2 percent), which is comprised mainly of building services contractors and employment agencies. The service sector also dominates the list of industries that have high rates of low-wage work—that is, industries where we estimate a high share of workers will get a raise (for example, 79.2 percent in food services and 54.6 percent in retail).
We also examine the sectoral distribution of affected workers in Table 4. Our estimates show that the workers who would get increases are largely employed in the private, for-profit sector. Nonprofit and public sector workers are less likely to be affected than the overall California workforce.
The Effects of a $15 Minimum Wage by 2023 in California 27
Table 4. Cumulative impacts for workers by major industries in California
Percent of eligible workers
Percent of eligible workers getting a raise
Percent of industry getting a raise
All Sectors Agriculture, Forestry, Fishing, Hunting, and Mining 2.4 4.5 71.2 Construction 5.5 4.7 32.2 Manufacturing 11.3 9.5 n.a. Wholesale Trade 3.3 3.1 35.2 Retail Trade 11.5 16.5 54.6 Transportation, Warehousing, and Utilities 4.5 3.7 31.6 Information 3.2 1.5 17.4 Finance, Insurance, Real Estate, and Rental and Leasing 6.2 3.7 22.8 Professional, Scientific, and Management 7.3 2.7 14.3 Administrative and Waste Management Services 4.3 6.2 54.7 Educational Services 8.9 6.1 25.9 Health Services 10.6 8.2 29.5 Social Assistance 2.4 3.4 53.1 Arts, Entertainment, Recreation, and Accommodation 3.5 4.6 49.5 Food Services 7.0 14.6 79.2 Other Services 4.2 5.7 51.6 Public Administration 4.0 1.5 14.5 Total 100.0 100.0
Source: Authors’ analysis of ACS, OES, and QCEW data. See Appendix for details.
Changes in a firm’s operating costs due to a minimum wage increase are determined by the following factors: the share of workers receiving wage increases, the average size of the wage increases, and the labor share of operating costs within the firm. As we saw in Table 4, in most industries only a minority of workers will receive a wage increase. Furthermore, among workers that do receive an increase, not everyone will receive the full increase (because many of the affected workers already earn more than the current minimum). Specifically, we estimate that the total wages of all affected workers will increase by 25.4 percent. However, affected workers’ wages represent only 11.1 percent of all workers’ wages in California. As a result, total wages will increase by only 2.8 percent.
Economic research suggests that some of the increased labor costs that businesses face as a result of a higher minimum wage can be offset through lower turnover. In our calculations below, we take the midpoint of those estimates and assume that 17.5 percent of increased labor costs are absorbed via turnover savings in the first year.10 These savings are likely to accrue at smaller rates as wage levels go higher; we therefore assume that by 2023 the marginal increase in earnings relative to 2017 no longer yields any additional turnover savings. As a result, we estimate that the total savings from turnover at a $15 minimum wage in 2023 would be 7.14 percent of increased labor costs.11
The Effects of a $15 Minimum Wage by 2023 in California 28
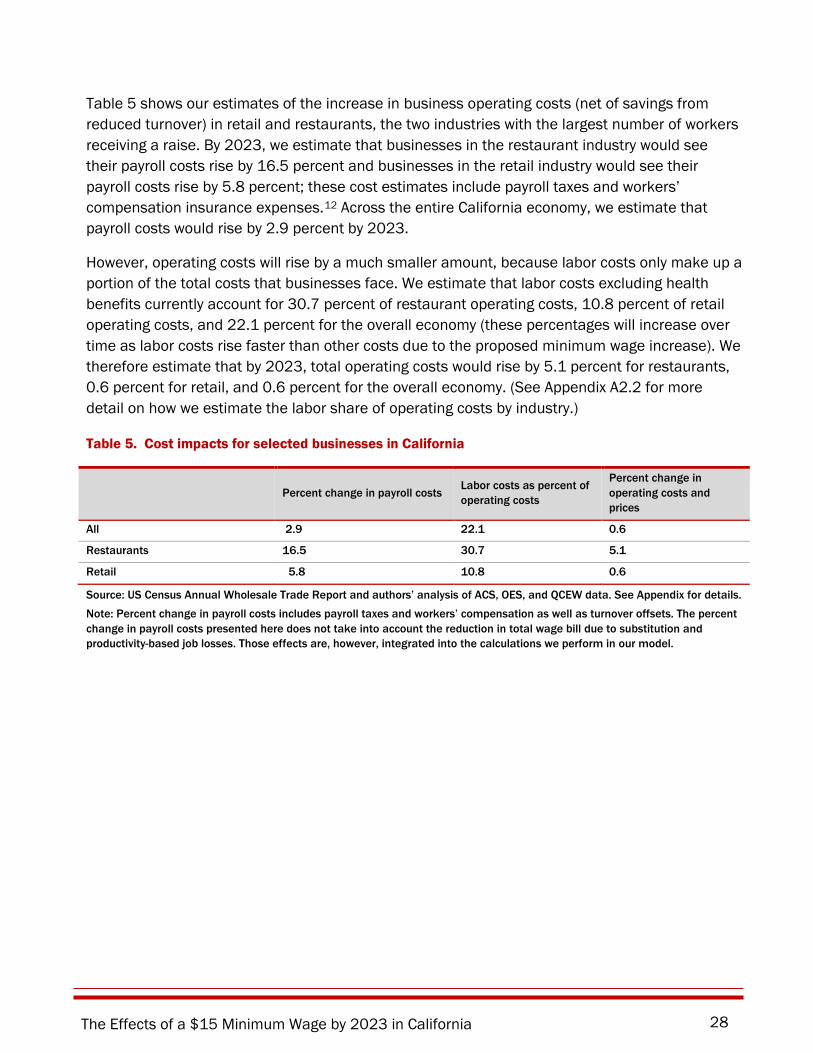
Table 5 shows our estimates of the increase in business operating costs (net of savings from reduced turnover) in retail and restaurants, the two industries with the largest number of workers receiving a raise. By 2023, we estimate that businesses in the restaurant industry would see their payroll costs rise by 16.5 percent and businesses in the retail industry would see their payroll costs rise by 5.8 percent; these cost estimates include payroll taxes and workers’ compensation insurance expenses.12 Across the entire California economy, we estimate that payroll costs would rise by 2.9 percent by 2023.
However, operating costs will rise by a much smaller amount, because labor costs only make up a portion of the total costs that businesses face. We estimate that labor costs excluding health benefits currently account for 30.7 percent of restaurant operating costs, 10.8 percent of retail operating costs, and 22.1 percent for the overall economy (these percentages will increase over time as labor costs rise faster than other costs due to the proposed minimum wage increase). We therefore estimate that by 2023, total operating costs would rise by 5.1 percent for restaurants, 0.6 percent for retail, and 0.6 percent for the overall economy. (See Appendix A2.2 for more detail on how we estimate the labor share of operating costs by industry.)
Table 5. Cost impacts for selected businesses in California
Percent change in payroll costs Labor costs as percent of operating costs
Percent change in operating costs and prices
All 2.9 22.1 0.6
Restaurants 16.5 30.7 5.1
Retail 5.8 10.8 0.6
Source: US Census Annual Wholesale Trade Report and authors’ analysis of ACS, OES, and QCEW data. See Appendix for details. Note: Percent change in payroll costs includes payroll taxes and workers’ compensation as well as turnover offsets. The percent change in payroll costs presented here does not take into account the reduction in total wage bill due to substitution and productivity-based job losses. Those effects are, however, integrated into the calculations we perform in our model.
The Effects of a $15 Minimum Wage by 2023 in California 29
5. EFFECTS ON EMPLOYMENT
In previous sections, we have assessed the benefits to low-wage workers as well as the impact on businesses’ operating costs in particular industries. In this section we consider whether the proposed policy would generate net gains or losses to the state’s economy.
In Section 5.1, the key issues concern how much employers will substitute equipment or skilled labor for unskilled labor and how much of their cost increases employers will pass on in the form of higher prices. In Section 5.2, we discuss who might pay the costs of the higher minimum wage. Higher prices reduce consumption demand, which translates into reductions in employment and economic activity.
Section 5.3 examines the increased spending that derives from the higher income of low-wage workers. We take into account the effects of taxes and reduction in public benefits on the affected workers’ take-home pay and the rate at which their households spend income compared to others. Greater spending from consumers increases economic demand, which translates into increases in employment and economic activity.
The net effects on the economy will then depend upon the sum of the effects estimated in each of these three sections. Section 5.4 estimates these net impacts on economic activity and employment.
5.1 Automation, productivity and substitution away from unskilled labor It is often argued that a higher minimum wage will lead firms to reduce their use of workers. This reduction in labor demand can occur through two different channels: one involves substituting capital for labor, i.e., automation or mechanization of jobs while keeping sales at the same level; the other involves lower demand for workers when prices increase and sales fall. We discuss here the automation channel and consider the effect on sales in the following section.
Automation: economic theory and measurement Mechanization does not necessarily lead to a net loss of jobs. As David Autor (2014a; 2014b) points out, machines (including smart robots) do not just substitute for labor; they are also complements to existing jobs and they can lead to the creation of new jobs and industries. Indeed, previous rounds of automation and computerization have created more jobs than they destroyed. Moreover, automation does not involve only the replacement of labor by machines. It also involves the replacement of old machines (think manual cash registers) with newer ones (think electronic cash registers and electronic screens like iPads).
In general, the effect of automation on employment depends upon the elasticity of substitution of capital for labor —the change in the relative prices of capital and labor—and the share of profits in revenue. The lower is this elasticity, the more difficult it is to substitute capital for labor. Robert

The Effects of a $15 Minimum Wage by 2023 in California 30
Chirinko, the leading economist specializing in estimates of capital-labor substitution, finds an economy-wide elasticity of about 0.4 (Chirinko and Mallick 2016). While the estimates in this study are identified across all economic sectors, most of the variation occurs among manufacturing industries. Lawrence (Lawrence 2015) also finds that the economy-wide sigma is less than 1 and that it is lower still in low-wage manufacturing industries than in high-wage manufacturing industries.
Alvarez-Cuadrado, Van Long and Poschke (2015) estimate substitution elasticities separately for manufacturing and services using data on 16 countries. They find that service sector elasticities are considerably lower than in manufacturing. However, their study does not examine low-wage services separately. The results in these papers nonetheless suggest, as Autor et al. conjectured, that automation possibilities are lower in low-service jobs.
Aaronson and Phelan (Aaronson and Phelan 2015) have carefully studied the short-run impact of minimum wages on the automation of different kinds of low-wage jobs. Their study is the first to examine automation within low-wage industry contexts. Aaronson and Phelan find that minimum wage increases do reduce routinized low-wage jobs (such as cashiers) and increase the number of less-routinized low-wage jobs (such as food preparation). As it turns out, the changes offset each other almost equally, resulting in no net change in employment. Thus, Aaronson and Phelan (2015) find that the capital-labor substitution elasticity is essentially zero in low-wage occupations.
We use an elasticity of 0.2 in our calculations, half-way between Chirinko and Mallick and Aaronson and Phelan. This conservative assumption may therefore result in an over-estimate of the magnitude of the automation effect.
Aaronson and Phelan’s findings also suggest very little substitution of highly skilled workers for lower skilled workers. Dube, Lester and Reich (2016) obtained a similar result. Consequently, we do not include any effect of skilled labor being substituted for unskilled labor in our model.
Automation in practice Machines that process automated transactions—at airports and in airplanes, banks, self-checkout stations in retail stores, parking garages, and gasoline stations—have become particularly widespread over the past 30 years. During this period, the price of computer-related machines has rapidly declined. Labor-saving automation will occur even when wages do not rise, insofar as the technological change continues to push down the price of equipment, making investments in new equipment and software profitable.
The effects of a rising minimum wage on actual automation depend in part upon whether new labor-saving technology that has not yet been adopted continues to become available. We suggest that much of existing labor-saving technological change has already been embodied in low-wage industries, in equipment and software such as smart electronic cash registers, remote
The Effects of a $15 Minimum Wage by 2023 in California 31
reservations, and ordering systems. An increase in the minimum wage is likely only to generate small increases in the adoption of more automated systems.
Equally important, the rate of adoption of technical change depends on changes in the relative prices of capital and labor, not just on the price of low-wage labor. Although the prices of computer-related equipment and software have fallen dramatically, by approximately a factor of ten in the past several decades, the decline in the past five years is much smaller. Meanwhile, median wages have stagnated and real minimum wages remain lower than they were in the early 1970s.
The declining cost of capital is also reflected in declines in long-term interest rates in recent decades. Five-year and ten-year inflation-protected interest rates have also fallen dramatically. These changes in relative prices have been the main impetus to increased automation. Even a doubling of the minimum wage policy, which would imply (according to (Allegretto et al. 2015) an average wage increase of about 22 percent, would have very little impact in comparison. However, interest rates are unlikely to fall further. It is therefore likely that actual automation in low-wage industries is slowing.
To summarize, empirical estimates of the elasticity of substitution of capital for labor that include low-wage industries in their sample range between 0 and 0.4. We use 0.2, the midpoint of this range. Since Aaronson and Phelan find a much smaller elasticity, our use of 0.2 is conservative.
Reductions in paid hours relative to working hours Some commentators assert that a higher minimum wage will lead employers to cheat workers of a portion of their wages. However, such practices already exist; the question at hand is how much the minimum wage increase will increase their prevalence and intensity. Although it is difficult to measure changes in wage theft, we know that employee-reported increases in pay (to a census surveyor) after a minimum wage increase match up well to employer-reported increases in pay on administrative reports that determine payroll taxes (Dube, Lester, and Reich 2010). These results suggest that most employers comply about as much after the increase as before.
Employee turnover and employer recruitment and retention costs The correlation between low wages and high employee turnover is well known (Cotton and Tuttle 1986).13 Over the last decade, annual employee turnover in accommodation and food service averaged 70 percent a year, compared to 41.4 percent in other services, 30.5 percent in health care and social assistance, and 32 percent in non-durable manufacturing (Statistics 2014).14 Quits are higher in low-wage occupations because workers leave to find higher-wage jobs or because they are unable to stay in their jobs due to problems such as difficulties with transportation, child care, or health.
Recent labor market research has gone beyond establishing a correlation between pay and turnover. We now know minimum wage increases have well-identified causal impacts that reduce worker turnover. Dube, Naidu and Reich (2007) found that worker tenure increased substantially
The Effects of a $15 Minimum Wage by 2023 in California 32
in San Francisco restaurants after the 2003 minimum wage law, especially in limited service restaurants. Dube, Lester and Reich (2016) found that a 10 percent increase in the minimum wage results in a 2.1 percent reduction in turnover for restaurant workers and for teens. Jacobs and Graham-Squire (2010) reviewed studies of the impact of living wage laws on employment separations and found that a 1 percent increase in wages is associated with a decline in separations of 1.45 percent.
Turnover creates financial costs for employers (Blake 2000; Dube, Freeman, and Reich 2010; Hinkin and Tracey 2000). These costs include both direct costs for administrative activities associated with departure, recruitment, selection, orientation, and training of workers, and the indirect costs associated with lost sales and lower productivity as new workers learn on the job. Hinkin and Tracey (2000) estimate the average turnover cost for hotel front desk employees at $5,864. A study of the cost of supermarket turnover by the Coca Cola Research Council estimates the replacement cost for an $8 an hour non-union worker at $4,199 (Blake 2000). Boushey and Glynn (2012) estimate that the median replacement cost for jobs paying $30,000 or less equals 16 percent of an employee’s annual salary.
Pollin and Wicks-Lim (2015) estimate that 20 percent of the increased costs from a minimum wage increase are offset by reductions in turnover. Similar estimates can be found in Fairris (2005) and Jacobs and Graham-Squire (2010). In a small case study of quick service restaurants in Georgia and Alabama (Hirsch, Kaufman, and Zelenska 2011), managers reported they offset 23 percent of the labor cost increases through operational efficiencies.
For our calculations below, we assume that 17.5 percent of the increase in payroll costs is absorbed through lower turnover in the early years of the proposed minimum wage increase.15 However, these turnover savings do not continue to grow at higher wage levels. Dube, Lester and Reich (2016) find that most of the reduction in turnover occurs among workers with less than three months of job tenure. Zipperer (in process) also finds that employee turnover rates begin to level off at wages that are twice the minimum wage.
These results suggest that the effect of higher wages on increasing tenure dissipates as wage levels increase. We therefore assume that the increases in wages after 2020 no longer result in turnover reductions, yielding an overall lower rate of savings from turnover of 7.4 percent in 2023.
Impact of higher wages on worker performance Paying workers more can also affect worker performance, morale, absenteeism, the number of grievances, customer service, and work effort, among other metrics (Hirsch, Kaufman, and Zelenska 2011; Reich, Jacobs, and Dietz 2014; Ton 2012; Wolfers and Zilinsky 2015).
Efficiency wage models of the labor market argue that wage increases elicit higher worker productivity, either because when employers pay workers more, workers are more willing to be more productive and require less supervision, or because they remain with the firm longer and
The Effects of a $15 Minimum Wage by 2023 in California 33
thereby gain valuable experience, or because higher pay tends to reduce idleness on the job. This theoretical result holds whether one company raises its wage above the market-clearing level, or whether all do (Akerlof and Yellen 1986).
Reduced employee turnover means that workers will have more tenure with the same employer, which creates incentives for both employers and workers to increase training and therefore worker productivity. A large scholarly literature makes this point, and it has been emphasized recently by firms such as Walmart, TJ Maxx, and The Gap as principal reasons underlying their announced policies to increase their minimum wages nationally to $10. However, because of the lack individual- or firm-level productivity data, the earlier efficiency wage literature does not provide a reliable quantitative assessment of the importance of the effect on worker productivity among low-wage workers.
A recent paper by Burda, Gedanek and Hamermesh (2016) does just that. Using microdata for 2003- 2012 from the American Time Use Study, Burda et al. find that working time while on the job increases when wages are higher. Their results imply that an increase in hourly pay from $10 to $15 increases the level of productivity by 0.05 percent.
Burda et al.’s estimate may be too high, given the difficulty of disentangling cause from effect in their loafing data. On the other hand, they do not have measures of worker engagement while working, which could make the actual worker productivity improvement potentially twice as large. To capture this range of productivity effects in our model, we use the Burda et al. estimate of 0.05 percent.16
A recent study by John Abowd et al. (Abowd et al. 2012) demonstrates the substantial room for productivity and wage growth in low-wage industries in the U.S. Using longitudinally linked employer-employee data, Abowd et al. disentangle wage differentials among industries that are attributable to individual heterogeneity (such as the demographic, educational, and work experience characteristics of workers in the industry), which they label person effects, from the characteristics of the product market and bargaining power of firms in the industry, which they label industry effects.
Abowd et al. can observe wage changes when individual workers move from one employer to another. They find very strong industry average firm effects, particularly for industries that have high average pay and low average pay. Among restaurants, for example, they find that 70 percent of the relatively low wages in the industry are attributable to firm effects, and only 30 percent to person effects. These findings suggest that a change in an industry’s environment can have large effects on worker pay.
Effects on prices As we have seen, previous prospective studies have made different assumptions on how much costs will affect prices—and therefore also profits. Card and Krueger (1995) provide an extensive discussion of this issue. As they point out, from the point of view of an individual employer in a
The Effects of a $15 Minimum Wage by 2023 in California 34
perfectly competitive industry, profits would be unaffected only in the extreme case in which firms can costlessly replace low-wage labor with high-skill labor and/or capital, and without cutting output. Since such substitutions are in fact costly, from this perspective a minimum wage increase would have to reduce profits. Firms do not envision a price increase as a solution, as it fears losing sales to its competitors.
A different result emerges when Card and Krueger consider the point of view of an industry as a whole. This perspective is necessary since the minimum wage increase applies to all the firms in an industry. Now, when individual firms respond to the prospect of reduced profits by raising their prices, they find that other firms are doing the same. Some of the price increases will stick and the industry will recapture some of the reduced profits. However, since demand for the industry’s product is not fixed, this increase in price entails some reduction in product demand, implying that industry output (and therefore employment) will fall. In other words, the price increase will permit employers to recover only a portion of their reduced profits. Card and Krueger do not, however, take into account the income effect that will increase sales when a minimum wage applies to an entire economy, not just a single industry.
The evidence on whether profits do fall is extremely scant. The most important study remains the one in Card and Krueger (1995). These authors obtained mixed results when examining the effects of minimum wage changes on shareholder returns for fast-food restaurant chains. Using British data, Draca et al. (2011) find a small negative effect on profits. However, one segment of this study uses data for firms in the British residential care industry. Firms in this industry were not permitted to increase prices, making the results not very useful for other sectors. Harasztosi and Lindner (2015) examine a large (60 percent) and persistent increase in the Hungarian minimum wage, which affected much of manufacturing. These authors find that cost increases were entirely passed through, but employment did not change and profits did not fall. Of course, the relevance of the British and Hungarian studies for the U.S. is highly uncertain.
In our model, employers pass all of the increase in operating costs stemming from a minimum wage increase onto prices, after accounting for the above-mentioned turnover savings, automation, and productivity growth. Studies of price effects of minimum wages are consistent with this model. These studies generally examine data on restaurants. Aaronson (2001) and Aaronson, French and MacDonald (2008) both find complete pass through of costs. However, their data come from a period of much higher inflation, are based on a handful of observations per metro area, and they do not correct their standard errors for clustering. In contrast, Allegretto and Reich (forthcoming) collected a large sample of restaurant price data in and near San Jose, before and after a 25 percent minimum wage increase in 2013 (from $8.00 to $10.00). Their results indicate that most of the costs are passed through to consumers in higher prices. Using scanner data from supermarkets, Montialoux et al. (forthcoming) find a similar effect for retail prices.
The Effects of a $15 Minimum Wage by 2023 in California 35
Effects on profits and rent Some economists have argued that many firms have captured above-normal profits in recent decades. An increase in the minimum wage could therefore reduce such economic rents. We attempted to include such an effect in our model, but were stymied by limited data on the proportion of reduced profits that would be borne within the study area.
Our simulations did confirm that insofar as payroll cost increases are partly absorbed by profits, then the scale effect is smaller. The reduced profits have much less effect on the income effect because propensities to spend are low among shareholders and managers, and because much of the profit decline affects capital owners outside of the study area. As a consequence, including a fall in profits in our model would have led to more positive effects on employment.
Minimum wage increases will likely affect the composition of businesses within and among industries. Aaronson, French and Sorkin (2015) find that minimum wage increases raise both exit and entry rates among restaurants, suggesting that entering firms arrive with a business model that is more oriented to the higher wage minimums. These higher-wage firms could be instituting business methods that improve productivity or improve product quality, or both. It is not possible for us to quantify these secondary effects, as they require more data on such adjustment mechanisms than are available.
Franchisee-franchiser relationships and commercial rental leases could also be altered by minimum wage increases. Franchises are particularly important among restaurants. In principle, franchisees could pass their increased costs to franchisers, either through a relaxation of fees or land rent. However, data on such changes are not available, to our knowledge. Effects on commercial rents are also difficult to detect, in part because of the lack of data and in part because such leases are typically of longer duration.
5.2 Scale effects of increased prices on reduced sales of consumer goods Economists use the term price elasticity of consumer demand to refer to the effect of an increase in prices on reducing consumer demand. Taylor and Houthakker (2010) report price elasticities for six categories of goods and services that together cover all of consumption. We adjust their health care elasticity to -0.20, to take into account changes in the structure of health care provision since the 1990s, and then compute a weighted average elasticity across the six categories using personal consumption expenditure shares from the U.S. Consumer Expenditure Survey (McCully 2011). The result is a price elasticity of consumer demand of -0.72.17
This estimate is compatible with, but somewhat larger than, price elasticities estimated from aggregate panel data. Hall (2009), for example, obtains a price elasticity of -0.50. On the other hand, our estimate is very close to that of Blundell et al. (1993).
The Effects of a $15 Minimum Wage by 2023 in California 36
5.3 Income effects We consider here the increased spending that derives from the higher income of low-wage workers. Our model takes into account the effects of taxes and reduction in public benefits on the affected workers’ take-home pay and the rate at which their households spend (as opposed to save) income compared to others. Greater spending by consumers increases economic demand, which translates into increases in employment and economic activity.
We do not expect all of the increases in household incomes to translate into increased consumption demand. A substantial portion of minimum wage earners come from households in the middle of the household wage distribution. These households will save some of their increased income. The amount of such savings will depend on their current savings rates and on the extent to which they view the increase in income as permanent, rather than a short-term windfall.
Economic research has found that changes in permanent income generate much higher consumption effects than changes that are, or are perceived as, transitory. Low wage-earners who are young and have more education may regard their low-wage status as transitory. These earners may regard a minimum wage increase as transitory.
However, recent research has found that an increasing proportion of minimum wage workers are stuck in minimum wage careers (Boushey 2005; Casselman 2015). These results suggest that the proportion of workers who regard a minimum wage increase as constituting a one-time increase will be small. Moreover, economic theory and evidence suggests strongly that the distinction between permanent and transitory income does not apply to workers who are credit-constrained and whose households have accumulated very little in assets (Achdou et al. 2014). The majority of minimum wage workers fit this description.
The IMPLAN model does not account for savings that come from transitory income. The considerations above indicate that any such effects are likely to be small. This is nonetheless a topic for future research.
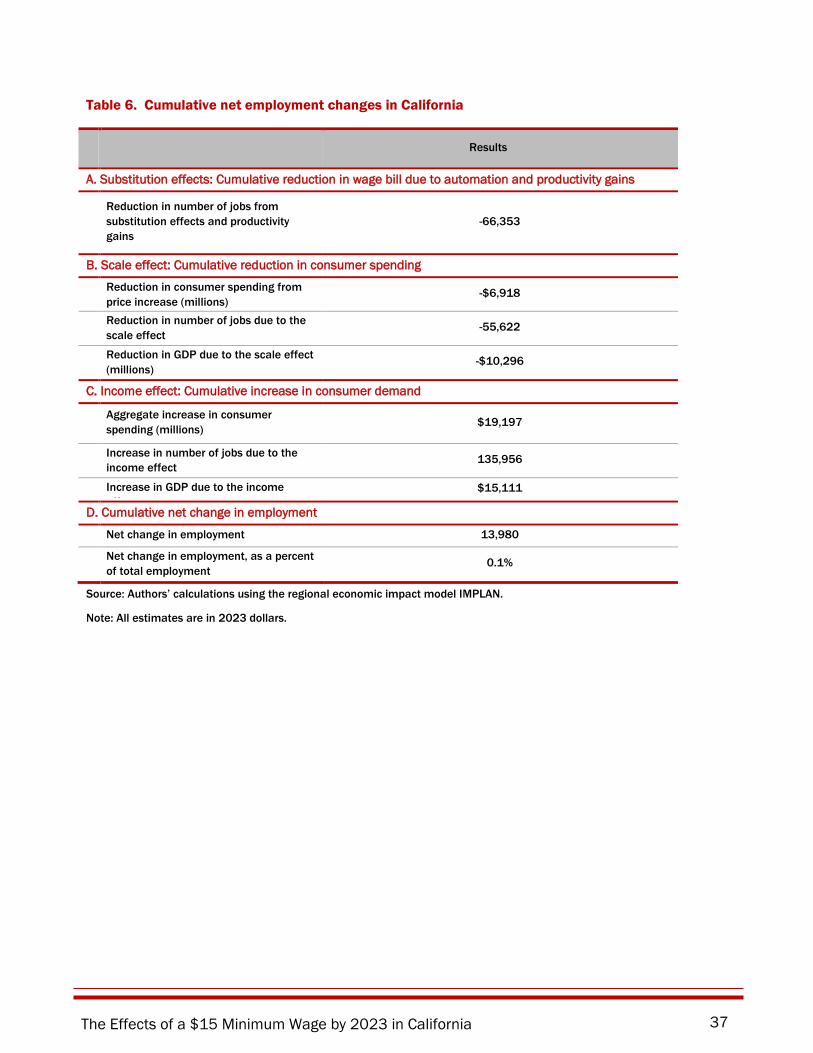
5.4 Model calculations and net effects on employment Table 6 displays the results of our model for 2023. Note that the estimates in this table are cumulative. They are estimated relative to the city’s minimum wage in each year, and therefore capture the full effect of increases in the suggested city minimum wage in previous years.
The Effects of a $15 Minimum Wage by 2023 in California 37
Table 6. Cumulative net employment changes in California
Results
A. Substitution effects: Cumulative reduction in wage bill due to automation and productivity gains
Reduction in number of jobs from substitution effects and productivity gains
-66,353
B. Scale effect: Cumulative reduction in consumer spending
Reduction in consumer spending from price increase (millions)
-$6,918
Reduction in number of jobs due to the scale effect
-55,622
Reduction in GDP due to the scale effect (millions)
-$10,296
C. Income effect: Cumulative increase in consumer demand
Aggregate increase in consumer spending (millions) $19,197
Increase in number of jobs due to the income effect
135,956
Increase in GDP due to the income ff
$15,111
D. Cumulative net change in employment Net change in employment 13,980
Net change in employment, as a percent of total employment
0.1%
Source: Authors’ calculations using the regional economic impact model IMPLAN.
Note: All estimates are in 2023 dollars.
The Effects of a $15 Minimum Wage by 2023 in California 38
Panel A: Reduction in employment due to capital-labor substitution and productivity gains Panel A in Table 6 shows our estimates for the reduction in the number of jobs due to both capital-labor substitution effects and productivity gains. With an assumed capital-labor substitution elasticity of 0.2 and a productivity effect of 0.005, we find a negative employment effect of about 66,353 jobs.
Panel B: Scale effects due to reduced consumer spending Panel B in Table 6 presents our estimates of the reductions in consumer spending from the higher payroll costs that are generated by the minimum wage increases by 2023. Row 3 restates the total net percentage increase in payroll costs from the proposed policy, accounting for savings from reduced turnover costs. This number comes from the top line of Table 6, using the same assumption that expected savings from reduced turnover. Similarly, Row 4 in Table 6 restates the percentage change in prices from Table 5. (Percentage changes in prices are equal to the percentage change in operating costs (after accounting for savings from turnover).
Row 5 presents our estimate of the reduction in consumer spending from the price increase. As previously discussed, we estimate that each 1 percent increase in consumer prices results in a -0.72 percent decline in consumer spending. We apply this price elasticity of demand to the percentage increase in prices and then multiply by annual consumer spending in California.18
The result is an estimate of $6.9bn cumulative reduction in consumer spending by 2023. We then use IMPLAN to estimate the total reduction in consumer demand, including multiplier effects.19 Row 6 then translates these results into numbers of jobs.
Panel C: Income effect-- cumulative increases in wages from proposed minimum wage increase Panel C of Table 6 presents the estimated income effect: increases in consumer demand deriving from increased incomes of low-paid workers.
Row 7 shows the total wage increase from the proposed law for all affected workers. These estimates are taken from Table 4, converted to nominal dollars in 2023. Row 8 adjusts the total wage increase for an estimated loss of 14.75 percent due to reduced eligibility for public assistance programs, as well as lost worker income due to reductions in consumer spending from Panel A.20 The result is an estimated net income increase of $19.2 billion by 2023. We then use IMPLAN to estimate the increase in employment resulting from the increased household spending triggered by the income increase, accounting for multiplier effects.21 Row 9 shows the employment change associated with this increase in income.
Panel D: Net effect As we have previously mentioned, the substitution productivity, scale, and income effects in Parts A to C occur simultaneously, not sequentially. It is thus not correct to infer that the employment changes in Parts A to C actually occur. Net employment changes occur only to the extent that is registered after we add Parts A to C together to obtain the net effects.
The Effects of a $15 Minimum Wage by 2023 in California 39
Panels A to C do tell us that the net effects will likely differ by job wage rates. In particular, the automation and productivity effects in Part A will occur entirely among low-wage jobs. The scale and income effects of Parts B and C, however, will affect jobs throughout the state’s consumer demand industries and among a much broader wage distribution. We have not been able to quantify these differences, as they depend on the relative concentration of scale and income effects in low-wage industries.
Panel D of Table 6 presents our estimate of the net change in employment. We estimate a cumulative net gain in employment, due to the policy, of 13,980 jobs by 2023, or 0.1 percent of total employment. To put this estimate in context, we project, based on past QCEW data on employment that California will grow annually by 1.40 percent from 2014 to 2023. (For more details see Appendix A2.)
The key finding in Table 6 is that a $15 minimum wage will have a negligible effect on net employment in California.
The Effects of a $15 Minimum Wage by 2023 in California 40
PART 3. EMPLOYMENT ANALYSIS: FRESNO COUNTY
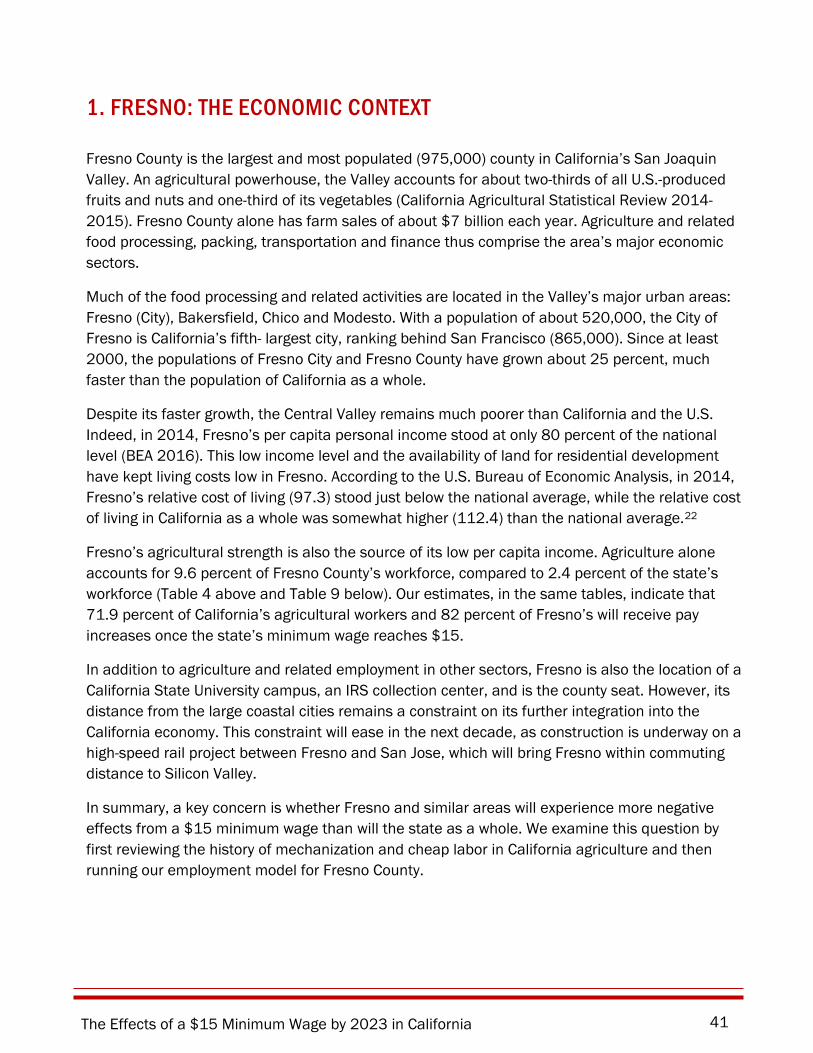
The Effects of a $15 Minimum Wage by 2023 in California 41
1. FRESNO: THE ECONOMIC CONTEXT
Fresno County is the largest and most populated (975,000) county in California’s San Joaquin Valley. An agricultural powerhouse, the Valley accounts for about two-thirds of all U.S.-produced fruits and nuts and one-third of its vegetables (California Agricultural Statistical Review 2014-2015). Fresno County alone has farm sales of about $7 billion each year. Agriculture and related food processing, packing, transportation and finance thus comprise the area’s major economic sectors.
Much of the food processing and related activities are located in the Valley’s major urban areas: Fresno (City), Bakersfield, Chico and Modesto. With a population of about 520,000, the City of Fresno is California’s fifth- largest city, ranking behind San Francisco (865,000). Since at least 2000, the populations of Fresno City and Fresno County have grown about 25 percent, much faster than the population of California as a whole.
Despite its faster growth, the Central Valley remains much poorer than California and the U.S. Indeed, in 2014, Fresno’s per capita personal income stood at only 80 percent of the national level (BEA 2016). This low income level and the availability of land for residential development have kept living costs low in Fresno. According to the U.S. Bureau of Economic Analysis, in 2014, Fresno’s relative cost of living (97.3) stood just below the national average, while the relative cost of living in California as a whole was somewhat higher (112.4) than the national average.22
Fresno’s agricultural strength is also the source of its low per capita income. Agriculture alone accounts for 9.6 percent of Fresno County’s workforce, compared to 2.4 percent of the state’s workforce (Table 4 above and Table 9 below). Our estimates, in the same tables, indicate that 71.9 percent of California’s agricultural workers and 82 percent of Fresno’s will receive pay increases once the state’s minimum wage reaches $15.
In addition to agriculture and related employment in other sectors, Fresno is also the location of a California State University campus, an IRS collection center, and is the county seat. However, its distance from the large coastal cities remains a constraint on its further integration into the California economy. This constraint will ease in the next decade, as construction is underway on a high-speed rail project between Fresno and San Jose, which will bring Fresno within commuting distance to Silicon Valley.
In summary, a key concern is whether Fresno and similar areas will experience more negative effects from a $15 minimum wage than will the state as a whole. We examine this question by first reviewing the history of mechanization and cheap labor in California agriculture and then running our employment model for Fresno County.
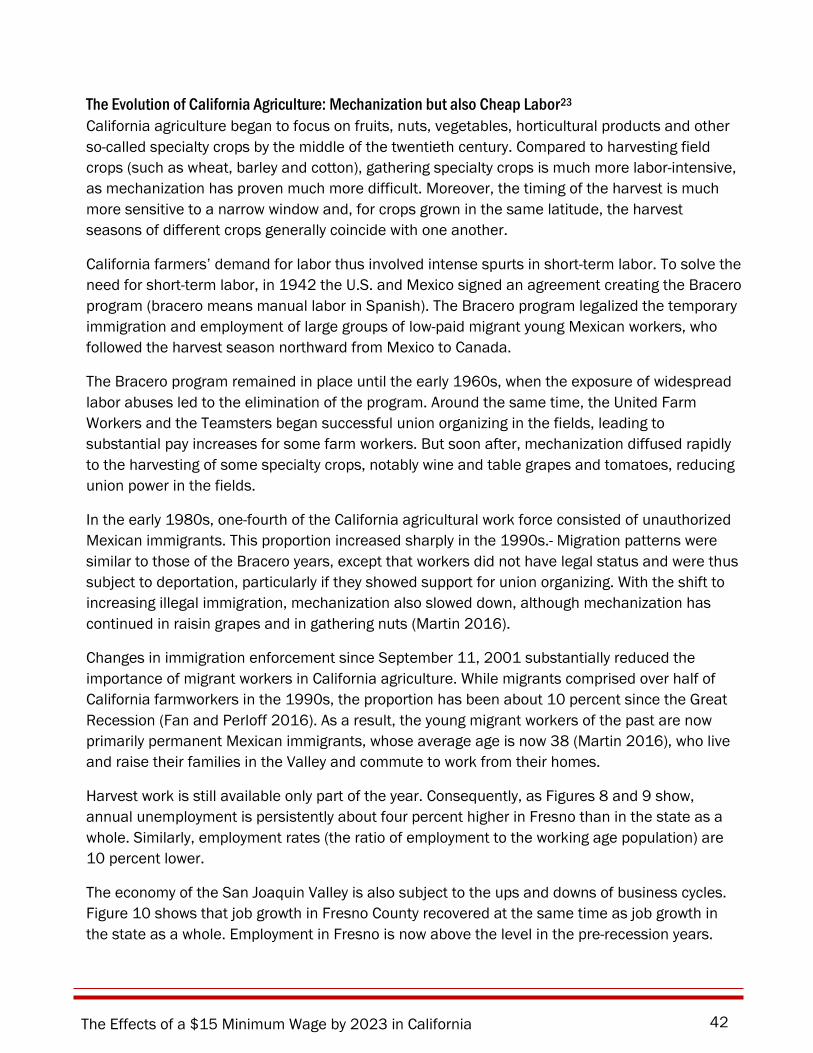
The Effects of a $15 Minimum Wage by 2023 in California 42
The Evolution of California Agriculture: Mechanization but also Cheap Labor23 California agriculture began to focus on fruits, nuts, vegetables, horticultural products and other so-called specialty crops by the middle of the twentieth century. Compared to harvesting field crops (such as wheat, barley and cotton), gathering specialty crops is much more labor-intensive, as mechanization has proven much more difficult. Moreover, the timing of the harvest is much more sensitive to a narrow window and, for crops grown in the same latitude, the harvest seasons of different crops generally coincide with one another.
California farmers’ demand for labor thus involved intense spurts in short-term labor. To solve the need for short-term labor, in 1942 the U.S. and Mexico signed an agreement creating the Bracero program (bracero means manual labor in Spanish). The Bracero program legalized the temporary immigration and employment of large groups of low-paid migrant young Mexican workers, who followed the harvest season northward from Mexico to Canada.
The Bracero program remained in place until the early 1960s, when the exposure of widespread labor abuses led to the elimination of the program. Around the same time, the United Farm Workers and the Teamsters began successful union organizing in the fields, leading to substantial pay increases for some farm workers. But soon after, mechanization diffused rapidly to the harvesting of some specialty crops, notably wine and table grapes and tomatoes, reducing union power in the fields.
In the early 1980s, one-fourth of the California agricultural work force consisted of unauthorized Mexican immigrants. This proportion increased sharply in the 1990s.- Migration patterns were similar to those of the Bracero years, except that workers did not have legal status and were thus subject to deportation, particularly if they showed support for union organizing. With the shift to increasing illegal immigration, mechanization also slowed down, although mechanization has continued in raisin grapes and in gathering nuts (Martin 2016).
Changes in immigration enforcement since September 11, 2001 substantially reduced the importance of migrant workers in California agriculture. While migrants comprised over half of California farmworkers in the 1990s, the proportion has been about 10 percent since the Great Recession (Fan and Perloff 2016). As a result, the young migrant workers of the past are now primarily permanent Mexican immigrants, whose average age is now 38 (Martin 2016), who live and raise their families in the Valley and commute to work from their homes.
Harvest work is still available only part of the year. Consequently, as Figures 8 and 9 show, annual unemployment is persistently about four percent higher in Fresno than in the state as a whole. Similarly, employment rates (the ratio of employment to the working age population) are 10 percent lower.
The economy of the San Joaquin Valley is also subject to the ups and downs of business cycles. Figure 10 shows that job growth in Fresno County recovered at the same time as job growth in the state as a whole. Employment in Fresno is now above the level in the pre-recession years.
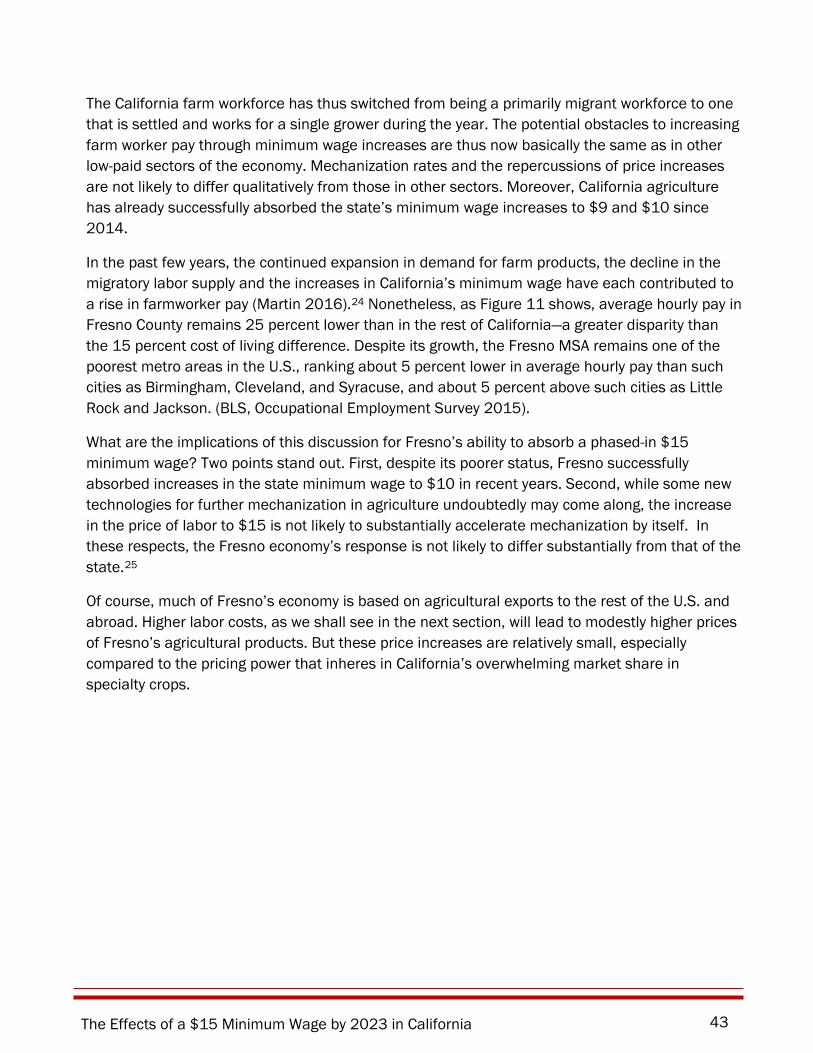
The Effects of a $15 Minimum Wage by 2023 in California 43
The California farm workforce has thus switched from being a primarily migrant workforce to one that is settled and works for a single grower during the year. The potential obstacles to increasing farm worker pay through minimum wage increases are thus now basically the same as in other low-paid sectors of the economy. Mechanization rates and the repercussions of price increases are not likely to differ qualitatively from those in other sectors. Moreover, California agriculture has already successfully absorbed the state’s minimum wage increases to $9 and $10 since 2014.
In the past few years, the continued expansion in demand for farm products, the decline in the migratory labor supply and the increases in California’s minimum wage have each contributed to a rise in farmworker pay (Martin 2016).24 Nonetheless, as Figure 11 shows, average hourly pay in Fresno County remains 25 percent lower than in the rest of California—a greater disparity than the 15 percent cost of living difference. Despite its growth, the Fresno MSA remains one of the poorest metro areas in the U.S., ranking about 5 percent lower in average hourly pay than such cities as Birmingham, Cleveland, and Syracuse, and about 5 percent above such cities as Little Rock and Jackson. (BLS, Occupational Employment Survey 2015).
What are the implications of this discussion for Fresno’s ability to absorb a phased-in $15 minimum wage? Two points stand out. First, despite its poorer status, Fresno successfully absorbed increases in the state minimum wage to $10 in recent years. Second, while some new technologies for further mechanization in agriculture undoubtedly may come along, the increase in the price of labor to $15 is not likely to substantially accelerate mechanization by itself. In these respects, the Fresno economy’s response is not likely to differ substantially from that of the state.25
Of course, much of Fresno’s economy is based on agricultural exports to the rest of the U.S. and abroad. Higher labor costs, as we shall see in the next section, will lead to modestly higher prices of Fresno’s agricultural products. But these price increases are relatively small, especially compared to the pricing power that inheres in California’s overwhelming market share in specialty crops.
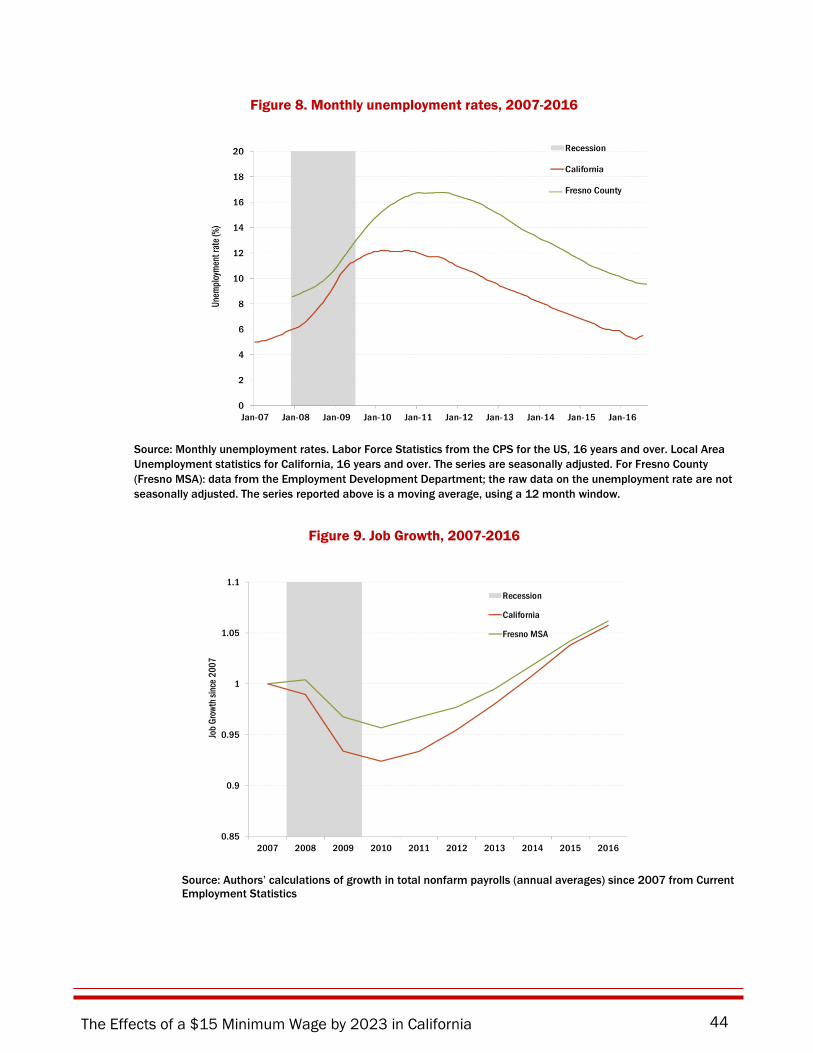
The Effects of a $15 Minimum Wage by 2023 in California 44
Figure 8. Monthly unemployment rates, 2007-2016
Source: Monthly unemployment rates. Labor Force Statistics from the CPS for the US, 16 years and over. Local Area Unemployment statistics for California, 16 years and over. The series are seasonally adjusted. For Fresno County (Fresno MSA): data from the Employment Development Department; the raw data on the unemployment rate are not seasonally adjusted. The series reported above is a moving average, using a 12 month window.
Figure 9. Job Growth, 2007-2016
Source: Authors’ calculations of growth in total nonfarm payrolls (annual averages) since 2007 from Current Employment Statistics
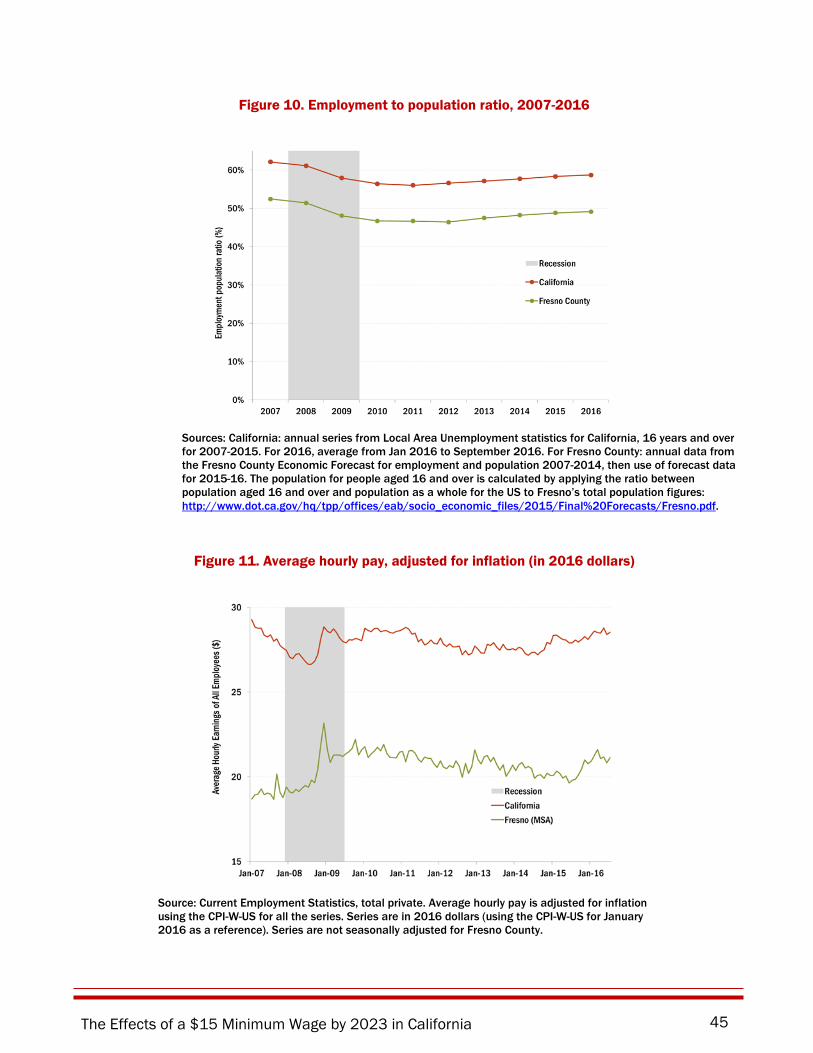
The Effects of a $15 Minimum Wage by 2023 in California 45
Figure 10. Employment to population ratio, 2007-2016
Sources: California: annual series from Local Area Unemployment statistics for California, 16 years and over for 2007-2015. For 2016, average from Jan 2016 to September 2016. For Fresno County: annual data from the Fresno County Economic Forecast for employment and population 2007-2014, then use of forecast data for 2015-16. The population for people aged 16 and over is calculated by applying the ratio between population aged 16 and over and population as a whole for the US to Fresno’s total population figures: http://www.dot.ca.gov/hq/tpp/offices/eab/socio_economic_files/2015/Final%20Forecasts/Fresno.pdf.
Figure 11. Average hourly pay, adjusted for inflation (in 2016 dollars)
Source: Current Employment Statistics, total private. Average hourly pay is adjusted for inflation using the CPI-W-US for all the series. Series are in 2016 dollars (using the CPI-W-US for January 2016 as a reference). Series are not seasonally adjusted for Fresno County.
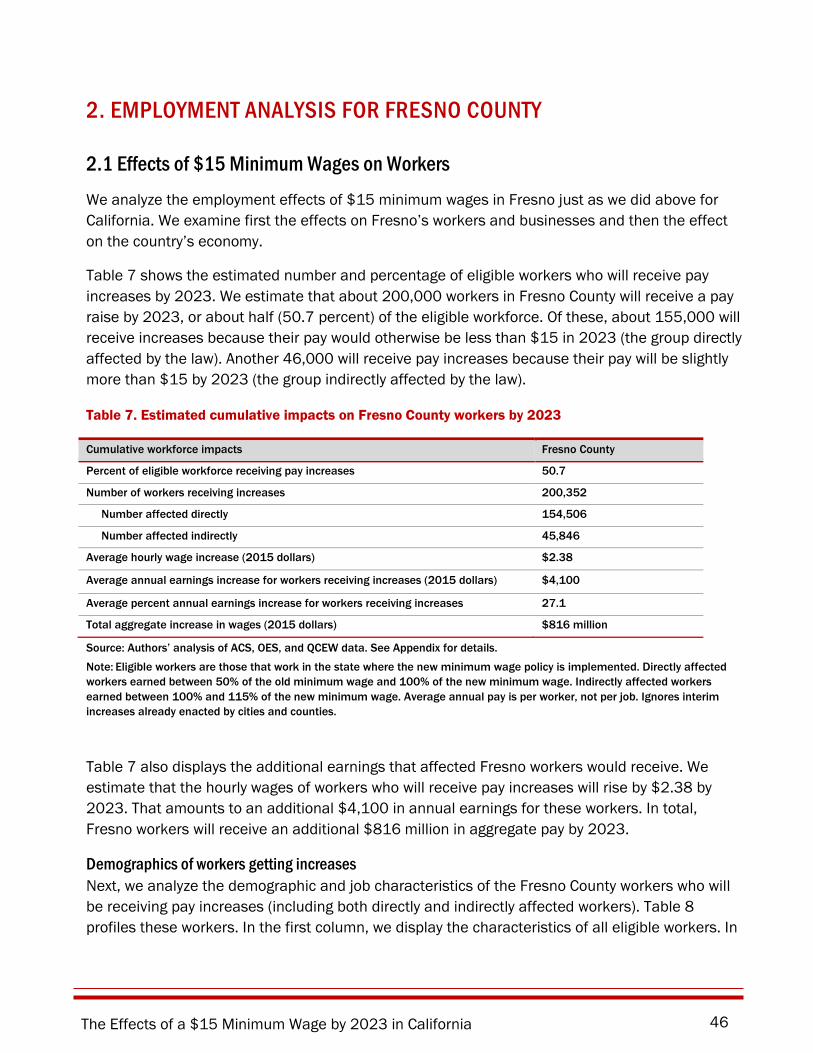
The Effects of a $15 Minimum Wage by 2023 in California 46
2. EMPLOYMENT ANALYSIS FOR FRESNO COUNTY
2.1 Effects of $15 Minimum Wages on Workers We analyze the employment effects of $15 minimum wages in Fresno just as we did above for California. We examine first the effects on Fresno’s workers and businesses and then the effect on the country’s economy.
Table 7 shows the estimated number and percentage of eligible workers who will receive pay increases by 2023. We estimate that about 200,000 workers in Fresno County will receive a pay raise by 2023, or about half (50.7 percent) of the eligible workforce. Of these, about 155,000 will receive increases because their pay would otherwise be less than $15 in 2023 (the group directly affected by the law). Another 46,000 will receive pay increases because their pay will be slightly more than $15 by 2023 (the group indirectly affected by the law).
Table 7. Estimated cumulative impacts on Fresno County workers by 2023
Cumulative workforce impacts Fresno County
Percent of eligible workforce receiving pay increases 50.7
Number of workers receiving increases 200,352
Number affected directly 154,506
Number affected indirectly 45,846
Average hourly wage increase (2015 dollars) $2.38
Average annual earnings increase for workers receiving increases (2015 dollars) $4,100
Average percent annual earnings increase for workers receiving increases 27.1
Total aggregate increase in wages (2015 dollars) $816 million
Source: Authors’ analysis of ACS, OES, and QCEW data. See Appendix for details.
Note: Eligible workers are those that work in the state where the new minimum wage policy is implemented. Directly affected workers earned between 50% of the old minimum wage and 100% of the new minimum wage. Indirectly affected workers earned between 100% and 115% of the new minimum wage. Average annual pay is per worker, not per job. Ignores interim increases already enacted by cities and counties.
Table 7 also displays the additional earnings that affected Fresno workers would receive. We estimate that the hourly wages of workers who will receive pay increases will rise by $2.38 by 2023. That amounts to an additional $4,100 in annual earnings for these workers. In total, Fresno workers will receive an additional $816 million in aggregate pay by 2023.
Demographics of workers getting increases Next, we analyze the demographic and job characteristics of the Fresno County workers who will be receiving pay increases (including both directly and indirectly affected workers). Table 8 profiles these workers. In the first column, we display the characteristics of all eligible workers. In
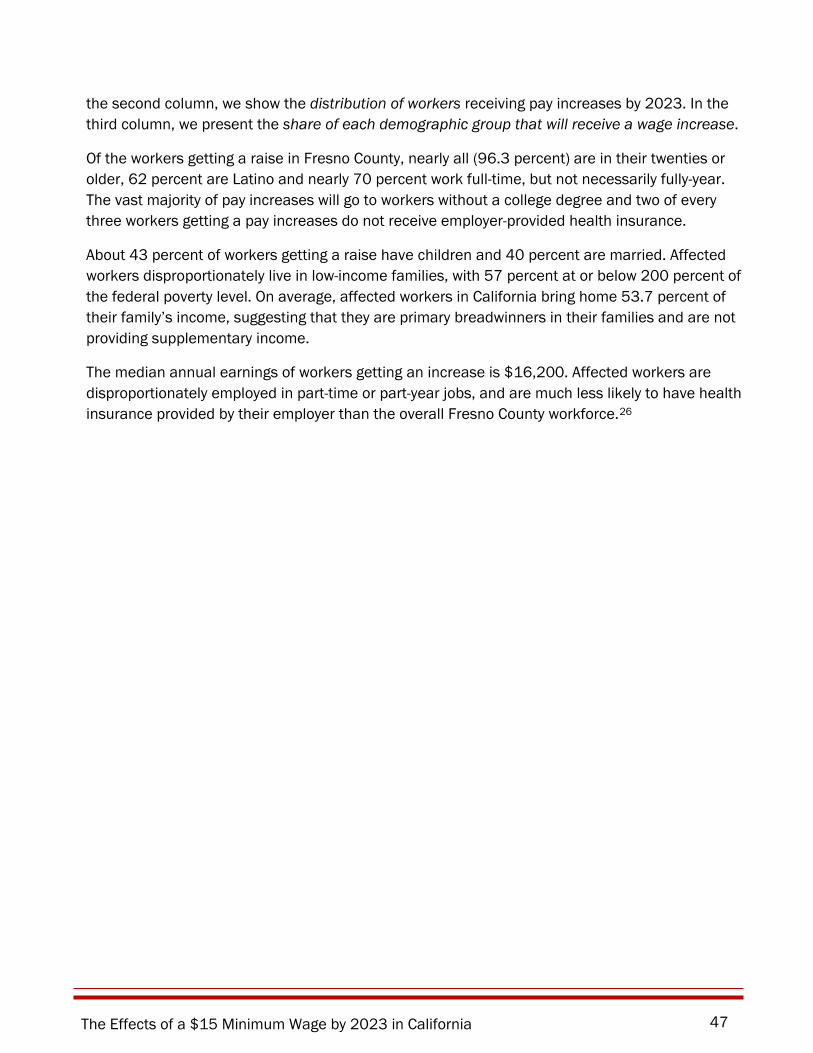
The Effects of a $15 Minimum Wage by 2023 in California 47
the second column, we show the distribution of workers receiving pay increases by 2023. In the third column, we present the share of each demographic group that will receive a wage increase.
Of the workers getting a raise in Fresno County, nearly all (96.3 percent) are in their twenties or older, 62 percent are Latino and nearly 70 percent work full-time, but not necessarily fully-year. The vast majority of pay increases will go to workers without a college degree and two of every three workers getting a pay increases do not receive employer-provided health insurance.
About 43 percent of workers getting a raise have children and 40 percent are married. Affected workers disproportionately live in low-income families, with 57 percent at or below 200 percent of the federal poverty level. On average, affected workers in California bring home 53.7 percent of their family’s income, suggesting that they are primary breadwinners in their families and are not providing supplementary income.
The median annual earnings of workers getting an increase is $16,200. Affected workers are disproportionately employed in part-time or part-year jobs, and are much less likely to have health insurance provided by their employer than the overall Fresno County workforce.26
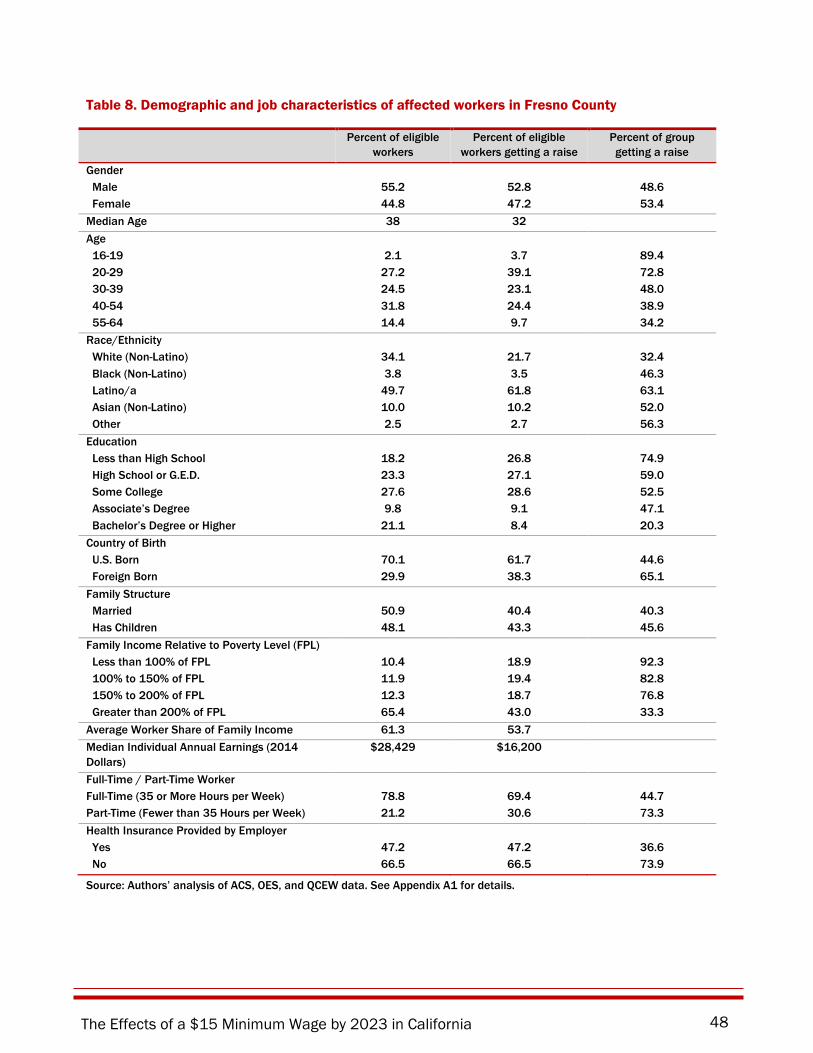
The Effects of a $15 Minimum Wage by 2023 in California 48
Table 8. Demographic and job characteristics of affected workers in Fresno County
Percent of eligible workers
Percent of eligible workers getting a raise
Percent of group getting a raise
Gender Male 55.2 52.8 48.6 Female 44.8 47.2 53.4 Median Age 38 32 Age 16-19 2.1 3.7 89.4 20-29 27.2 39.1 72.8 30-39 24.5 23.1 48.0 40-54 31.8 24.4 38.9 55-64 14.4 9.7 34.2 Race/Ethnicity White (Non-Latino) 34.1 21.7 32.4 Black (Non-Latino) 3.8 3.5 46.3 Latino/a 49.7 61.8 63.1 Asian (Non-Latino) 10.0 10.2 52.0 Other 2.5 2.7 56.3 Education Less than High School 18.2 26.8 74.9 High School or G.E.D. 23.3 27.1 59.0 Some College 27.6 28.6 52.5 Associate’s Degree 9.8 9.1 47.1 Bachelor’s Degree or Higher 21.1 8.4 20.3 Country of Birth U.S. Born 70.1 61.7 44.6 Foreign Born 29.9 38.3 65.1 Family Structure Married 50.9 40.4 40.3 Has Children 48.1 43.3 45.6 Family Income Relative to Poverty Level (FPL) Less than 100% of FPL 10.4 18.9 92.3 100% to 150% of FPL 11.9 19.4 82.8 150% to 200% of FPL 12.3 18.7 76.8 Greater than 200% of FPL 65.4 43.0 33.3 Average Worker Share of Family Income 61.3 53.7 Median Individual Annual Earnings (2014 Dollars)
$28,429 $16,200
Full-Time / Part-Time Worker Full-Time (35 or More Hours per Week) 78.8 69.4 44.7 Part-Time (Fewer than 35 Hours per Week) 21.2 30.6 73.3 Health Insurance Provided by Employer Yes 47.2 47.2 36.6 No 66.5 66.5 73.9
Source: Authors’ analysis of ACS, OES, and QCEW data. See Appendix A1 for details.
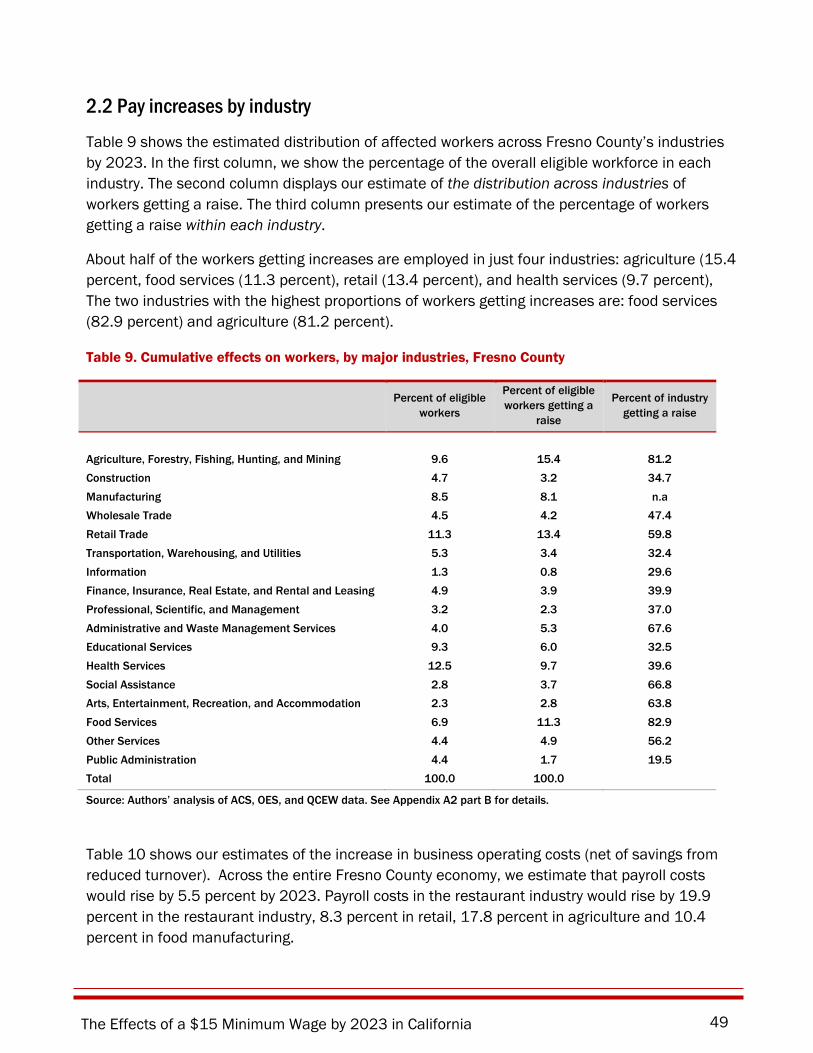
The Effects of a $15 Minimum Wage by 2023 in California 49
2.2 Pay increases by industry Table 9 shows the estimated distribution of affected workers across Fresno County’s industries by 2023. In the first column, we show the percentage of the overall eligible workforce in each industry. The second column displays our estimate of the distribution across industries of workers getting a raise. The third column presents our estimate of the percentage of workers getting a raise within each industry.
About half of the workers getting increases are employed in just four industries: agriculture (15.4 percent, food services (11.3 percent), retail (13.4 percent), and health services (9.7 percent), The two industries with the highest proportions of workers getting increases are: food services (82.9 percent) and agriculture (81.2 percent).
Table 9. Cumulative effects on workers, by major industries, Fresno County
Percent of eligible workers
Percent of eligible workers getting a
raise
Percent of industry getting a raise
Agriculture, Forestry, Fishing, Hunting, and Mining 9.6 15.4 81.2 Construction 4.7 3.2 34.7 Manufacturing 8.5 8.1 n.a Wholesale Trade 4.5 4.2 47.4 Retail Trade 11.3 13.4 59.8 Transportation, Warehousing, and Utilities 5.3 3.4 32.4 Information 1.3 0.8 29.6 Finance, Insurance, Real Estate, and Rental and Leasing 4.9 3.9 39.9 Professional, Scientific, and Management 3.2 2.3 37.0 Administrative and Waste Management Services 4.0 5.3 67.6 Educational Services 9.3 6.0 32.5 Health Services 12.5 9.7 39.6 Social Assistance 2.8 3.7 66.8 Arts, Entertainment, Recreation, and Accommodation 2.3 2.8 63.8 Food Services 6.9 11.3 82.9 Other Services 4.4 4.9 56.2 Public Administration 4.4 1.7 19.5 Total 100.0 100.0
Source: Authors’ analysis of ACS, OES, and QCEW data. See Appendix A2 part B for details.
Table 10 shows our estimates of the increase in business operating costs (net of savings from reduced turnover). Across the entire Fresno County economy, we estimate that payroll costs would rise by 5.5 percent by 2023. Payroll costs in the restaurant industry would rise by 19.9 percent in the restaurant industry, 8.3 percent in retail, 17.8 percent in agriculture and 10.4 percent in food manufacturing.
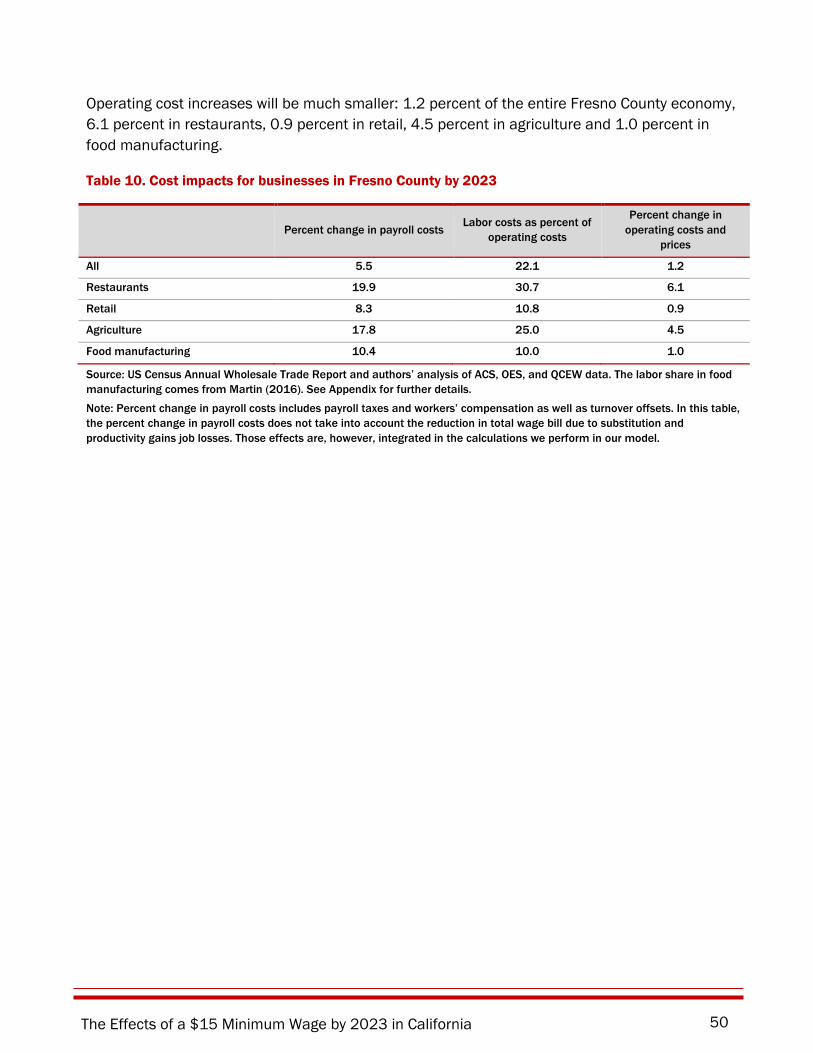
The Effects of a $15 Minimum Wage by 2023 in California 50
Operating cost increases will be much smaller: 1.2 percent of the entire Fresno County economy, 6.1 percent in restaurants, 0.9 percent in retail, 4.5 percent in agriculture and 1.0 percent in food manufacturing.
Table 10. Cost impacts for businesses in Fresno County by 2023
Percent change in payroll costs Labor costs as percent of operating costs
Percent change in operating costs and
prices
All 5.5 22.1 1.2
Restaurants 19.9 30.7 6.1
Retail 8.3 10.8 0.9
Agriculture 17.8 25.0 4.5
Food manufacturing 10.4 10.0 1.0
Source: US Census Annual Wholesale Trade Report and authors’ analysis of ACS, OES, and QCEW data. The labor share in food manufacturing comes from Martin (2016). See Appendix for further details.
Note: Percent change in payroll costs includes payroll taxes and workers’ compensation as well as turnover offsets. In this table, the percent change in payroll costs does not take into account the reduction in total wage bill due to substitution and productivity gains job losses. Those effects are, however, integrated in the calculations we perform in our model.
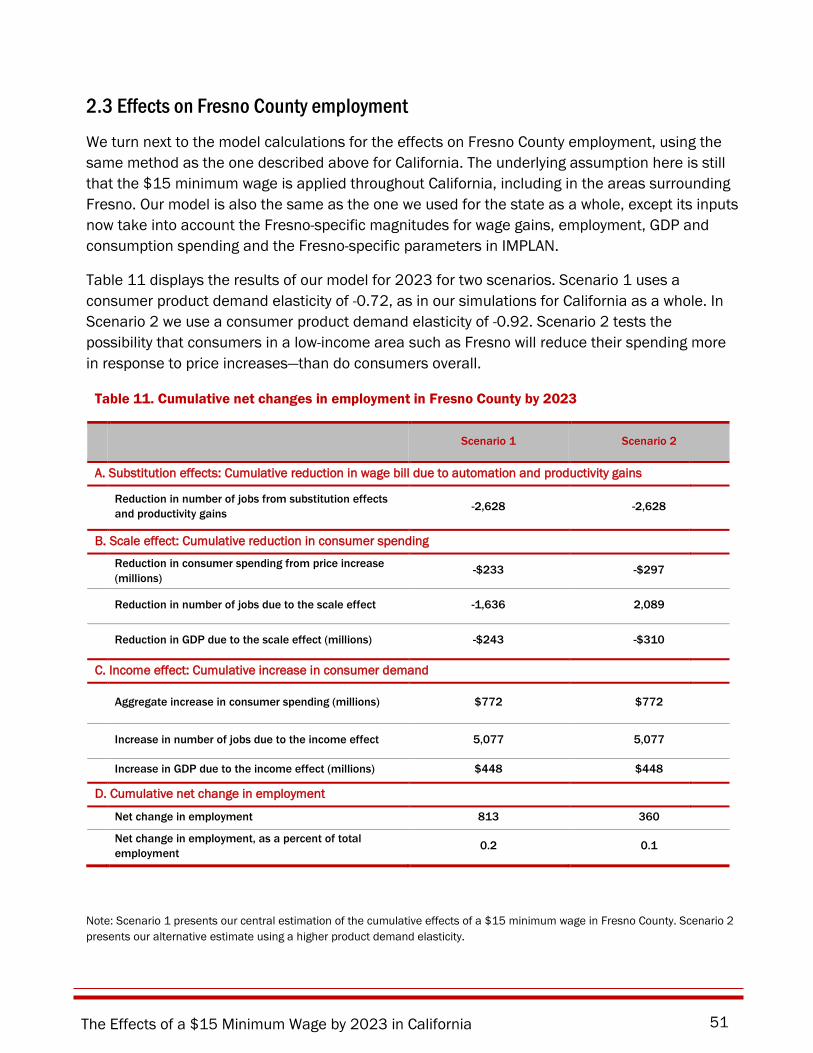
The Effects of a $15 Minimum Wage by 2023 in California 51
2.3 Effects on Fresno County employment We turn next to the model calculations for the effects on Fresno County employment, using the same method as the one described above for California. The underlying assumption here is still that the $15 minimum wage is applied throughout California, including in the areas surrounding Fresno. Our model is also the same as the one we used for the state as a whole, except its inputs now take into account the Fresno-specific magnitudes for wage gains, employment, GDP and consumption spending and the Fresno-specific parameters in IMPLAN.
Table 11 displays the results of our model for 2023 for two scenarios. Scenario 1 uses a consumer product demand elasticity of -0.72, as in our simulations for California as a whole. In Scenario 2 we use a consumer product demand elasticity of -0.92. Scenario 2 tests the possibility that consumers in a low-income area such as Fresno will reduce their spending more in response to price increases—than do consumers overall.
Table 11. Cumulative net changes in employment in Fresno County by 2023
Scenario 1 Scenario 2
A. Substitution effects: Cumulative reduction in wage bill due to automation and productivity gains
Reduction in number of jobs from substitution effects and productivity gains -2,628 -2,628
B. Scale effect: Cumulative reduction in consumer spending
Reduction in consumer spending from price increase (millions)
-$233 -$297
Reduction in number of jobs due to the scale effect -1,636 2,089
Reduction in GDP due to the scale effect (millions) -$243 -$310
C. Income effect: Cumulative increase in consumer demand
Aggregate increase in consumer spending (millions) $772 $772
Increase in number of jobs due to the income effect 5,077 5,077
Increase in GDP due to the income effect (millions) $448 $448
D. Cumulative net change in employment
Net change in employment 813 360
Net change in employment, as a percent of total employment
0.2 0.1
Note: Scenario 1 presents our central estimation of the cumulative effects of a $15 minimum wage in Fresno County. Scenario 2 presents our alternative estimate using a higher product demand elasticity.
The Effects of a $15 Minimum Wage by 2023 in California 52
Panel A: Reduction in employment due to capital-labor substitution and productivity gains Panel A in Table 11 shows our estimates for the reduction in the number of jobs due to both capital-labor substitution effects and productivity gains. With an assumed capital-labor substitution elasticity of 0.2 and a productivity effect of 0.005, we find a negative employment effect of about 5,256 jobs.
Panel B: Scale effects due to reduced consumer spending Panel B in Table 11 presents our estimates of the reductions in consumer spending from the higher prices generated by higher payroll costs, which in turn are generated by the minimum wage increases by 2023.
Our estimate of the reduction in consumer spending from price increases departs in one detail from our estimate for California as a whole. For California as a whole, we estimate that each 1 percent increase in consumer prices results in a -0.72 percent decline in consumer spending. Since Fresno County has a lower income base than the state, in Scenario 2 we apply a higher consumer demand elasticity: -0.92.
The Scenario 1 result for the scale effect is an estimated $233 million reduction in consumer spending by 2023, corresponding to a reduction of 1,636 jobs. The scale effect in Scenario 2 is an estimated consumer spending reduction of $297 million, corresponding to a reduction of 2,089 jobs.
Panel C: Income effect-- cumulative increases in wages from proposed minimum wage increase Panel C of Table 11 presents the estimated income effect: increases in consumer demand deriving from increased incomes of low-paid workers. We estimate that the income effect will generate 4,818 jobs in Fresno County
Panel D: Net effect As we have previously mentioned, the substitution productivity, scale, and income effects in Parts A to C occur simultaneously, not sequentially. It is thus not correct to infer that the employment changes in Parts A to C actually occur. Net employment changes occur only to the extent that is registered after we add Parts A to C together to obtain the net effects.
Panels A to C do tell us that the net effects will likely differ by job wage rates. In particular, the automation and productivity effects in Part A will occur entirely among low-wage jobs. The scale and income effects of Parts B and C, however, will affect jobs throughout the state’s consumer demand industries and among a much broader wage distribution. We have not been able to quantify these differences, as they depend on the relative concentration of scale and income effects in low-wage industries.
Panel D of Table 11 presents our estimate of the net change in employment. In Scenario 1 we estimate a small cumulative gain in employment, due to the policy, of 813 jobs by 2023, equivalent to 0.2 percent of total employment. The corresponding estimate in Scenario 2 is a
The Effects of a $15 Minimum Wage by 2023 in California 53
gain of 360 jobs, equivalent to a gain of 0.1 percent of total employment. The employment change under either scenario is smaller than the statistical margin of error intervals in the underlying data. To put these estimates in context, we project that Fresno employment will grow annually by 1.56 percent from 2014 to 2023.

The Effects of a $15 Minimum Wage by 2023 in California 54
CONCLUSION
The Effects of a $15 Minimum Wage by 2023 in California 55
Like all forecasts, our estimates of the benefits and costs are subject to some uncertainty. First, economic conditions, such as employment and wage growth in the absence of the policy, may differ in future years from the standard forecasts that we rely upon in this report. For example, in a recession employment would fall and wages would not grow as quickly. Our cost estimates might then be somewhat larger, but then so would our benefit estimates. Our estimates of the net effects are therefore likely to change, but not by a large amount. Second, our estimates rely on parameters that are themselves estimated with some uncertainty. We have tested the sensitivity or our calculations to these parameters. The results were encouraging, but require further research.
The law would result in substantial benefits to low-wage workers and their families, raising wages for 5.26 million workers by 2023. Annual pay for these workers will increase by 25.4 percent or $3,900 by 2023.
These large increases in pay will raise overall wages in for-profit businesses by only 2.8 percent in California. This amount is surprisingly small because many businesses already pay their workers more than $15, because many of the workers who are now paid below $15 are already paid above the current minimum wage, and because the pay of low-wage workers makes up a smaller share of total payroll costs.
Businesses will absorb the additional payroll costs partly through savings on employee turnover costs, higher worker productivity gains, and some automation. Most of the increase in costs will likely be passed on to consumers via increased prices. Since labor costs make up only about one-fourth of operating costs, consumer prices will increase only slightly—about 0.6 percent over the entire phase-in period. Prices will be most affected in the restaurant industry, where they will increase by 5.1 percent.
These higher prices by themselves would reduce consumer sales and reduce the demand for labor. But simultaneous positive effects on increased consumer spending from workers receiving wage increases will offset these negative effects.
After taking into account all of these factors, we estimate that the proposed minimum wage policy would increase overall net employment (as a percent of total employment) by 0.1 percent by 2023, over the baseline. Results for Fresno are similar. These estimates are cumulative (and so will be spread over the phase-in period). In comparison, employment in the state is projected to grow 1.40 percent annually in the same time period.
In sum, it is possible to substantially improve living standards for 38 percent of the state’s workforce (and 50 percent of Fresno’s) without generating a significant net adverse employment effect. The minimum wage increase will be paid for primarily by Induced efficiencies (more automation, productivity gains, and turnover savings) and slight price increases borne by all consumers.
The Effects of a $15 Minimum Wage by 2023 in California 56
Based on our analysis, we conclude that the proposed minimum wage will have its intended effects in improving incomes for low-wage workers. Any effects on employment and overall economic growth are likely to be small. The net impact of the policy will therefore be positive.

The Effects of a $15 Minimum Wage by 2023 in California 57
APPENDIX: DATA AND METHODS
The Effects of a $15 Minimum Wage by 2023 in California 58
CALIBRATING THE UC BERKELEY IRLE MINIMUM WAGE MODEL
Structure of the model and step by step calculations Table A1 summarizes the structure of our model. The table has four components. The top part describes the number of workers in the state who will receive pay increases by 2021. Part A describes the effects of automation and worker productivity gains. Part B describes how much consumer prices will increase and how much those increases will reduce consumer demand and employment. Part C describes how we calculate the income effect: how pay increases will increase consumer spending and employment. Part D describes how we calculate the net effect on employment. In this section we document in detail the data and methods that we use in each part of Table A1. In section A2.2, we document the source of the key parameters used to calibrate our model.
Top part: Workers affected and wage increase Lines [1] to [3] in Table A1 use our estimates (described in detail in the first section of the appendix) on how the labor force will grow and how the proposed minimum wage increase would affect the wage distribution of workers in California. The wage estimates include the number of workers directly and indirectly affected by the two scenarios, and their nominal wages with and without the policy. We also use our estimate of the total wage bill by 2023: it will be $867 billion in California with minimum wage increase and $843 billion without the minimum wage increase.
Part A: Impact of capital-labor substitution and productivity gains Part A calculates the impact of capital-labor substitution and productivity gains on employment and the total wage bill. Our estimates are calculated as follows:
The reduction in number of jobs from substitution effects (line [5] in Table A2) is calculated by multiplying four components: (i) the capital-labor substitution elasticity (see section A2.2) (ii) the average wage increase of workers getting increases, that we estimate to be 25 percent based in California, (iii) the profit share of revenues (see section A2.2), and (iv) the total number of affected workers.
The reduction in number of jobs from productivity gains ([6]) is calculated by multiplying two components: (i) the productivity gains (see section A2.2 for a description of the values we use to calibrate the model) and (ii) the total number of affected workers (that we estimate to be 5.26 million in California according to our wage simulation model).
The reduction in wage bill due to substitution effects and productivity gains ([7]) is calculated by multiplying the reduction in number of jobs due to capital-labor substitution and productivity gains ([8]) by the nominal average annual earnings of workers who would otherwise remained employed ([9]).
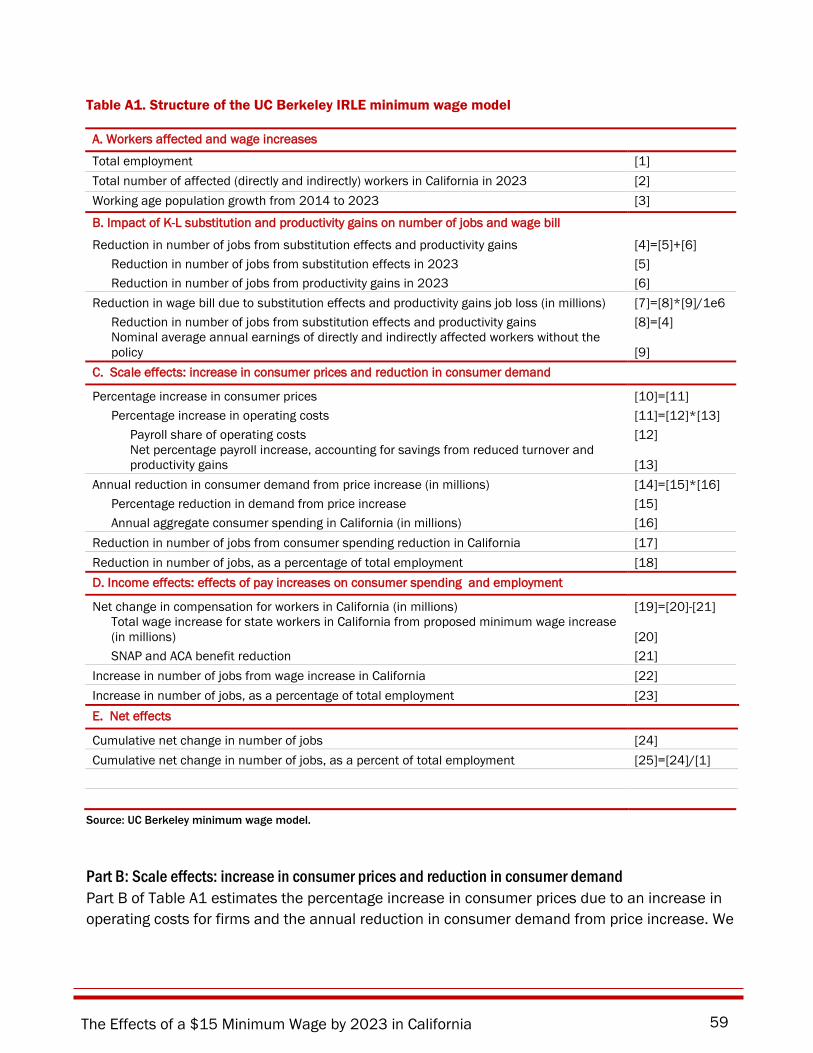
The Effects of a $15 Minimum Wage by 2023 in California 59
Table A1. Structure of the UC Berkeley IRLE minimum wage model
A. Workers affected and wage increases
Total employment [1] Total number of affected (directly and indirectly) workers in California in 2023 [2] Working age population growth from 2014 to 2023 [3]
B. Impact of K-L substitution and productivity gains on number of jobs and wage bill
Reduction in number of jobs from substitution effects and productivity gains [4]=[5]+[6] Reduction in number of jobs from substitution effects in 2023 [5] Reduction in number of jobs from productivity gains in 2023 [6] Reduction in wage bill due to substitution effects and productivity gains job loss (in millions) [7]=[8]*[9]/1e6 Reduction in number of jobs from substitution effects and productivity gains [8]=[4]
Nominal average annual earnings of directly and indirectly affected workers without the policy [9]
C. Scale effects: increase in consumer prices and reduction in consumer demand
Percentage increase in consumer prices [10]=[11] Percentage increase in operating costs [11]=[12]*[13] Payroll share of operating costs [12]
Net percentage payroll increase, accounting for savings from reduced turnover and productivity gains [13]
Annual reduction in consumer demand from price increase (in millions) [14]=[15]*[16] Percentage reduction in demand from price increase [15] Annual aggregate consumer spending in California (in millions) [16] Reduction in number of jobs from consumer spending reduction in California [17] Reduction in number of jobs, as a percentage of total employment [18] D. Income effects: effects of pay increases on consumer spending and employment
Net change in compensation for workers in California (in millions) [19]=[20]-[21]
Total wage increase for state workers in California from proposed minimum wage increase (in millions) [20]
SNAP and ACA benefit reduction [21] Increase in number of jobs from wage increase in California [22] Increase in number of jobs, as a percentage of total employment [23] E. Net effects
Cumulative net change in number of jobs [24] Cumulative net change in number of jobs, as a percent of total employment [25]=[24]/[1]
Source: UC Berkeley minimum wage model.
Part B: Scale effects: increase in consumer prices and reduction in consumer demand Part B of Table A1 estimates the percentage increase in consumer prices due to an increase in operating costs for firms and the annual reduction in consumer demand from price increase. We
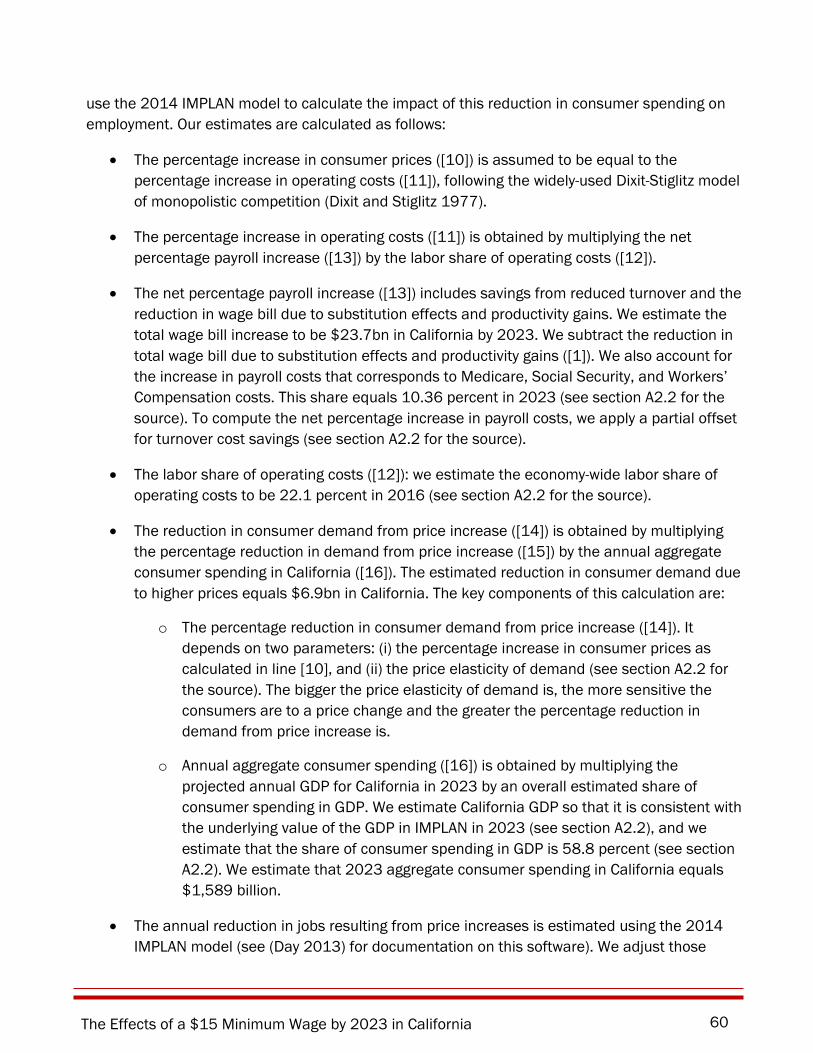
The Effects of a $15 Minimum Wage by 2023 in California 60
use the 2014 IMPLAN model to calculate the impact of this reduction in consumer spending on employment. Our estimates are calculated as follows:
• The percentage increase in consumer prices ([10]) is assumed to be equal to the percentage increase in operating costs ([11]), following the widely-used Dixit-Stiglitz model of monopolistic competition (Dixit and Stiglitz 1977).
• The percentage increase in operating costs ([11]) is obtained by multiplying the net percentage payroll increase ([13]) by the labor share of operating costs ([12]).
• The net percentage payroll increase ([13]) includes savings from reduced turnover and the reduction in wage bill due to substitution effects and productivity gains. We estimate the total wage bill increase to be $23.7bn in California by 2023. We subtract the reduction in total wage bill due to substitution effects and productivity gains ([1]). We also account for the increase in payroll costs that corresponds to Medicare, Social Security, and Workers’ Compensation costs. This share equals 10.36 percent in 2023 (see section A2.2 for the source). To compute the net percentage increase in payroll costs, we apply a partial offset for turnover cost savings (see section A2.2 for the source).
• The labor share of operating costs ([12]): we estimate the economy-wide labor share of operating costs to be 22.1 percent in 2016 (see section A2.2 for the source).
• The reduction in consumer demand from price increase ([14]) is obtained by multiplying the percentage reduction in demand from price increase ([15]) by the annual aggregate consumer spending in California ([16]). The estimated reduction in consumer demand due to higher prices equals $6.9bn in California. The key components of this calculation are:
o The percentage reduction in consumer demand from price increase ([14]). It depends on two parameters: (i) the percentage increase in consumer prices as calculated in line [10], and (ii) the price elasticity of demand (see section A2.2 for the source). The bigger the price elasticity of demand is, the more sensitive the consumers are to a price change and the greater the percentage reduction in demand from price increase is.
o Annual aggregate consumer spending ([16]) is obtained by multiplying the projected annual GDP for California in 2023 by an overall estimated share of consumer spending in GDP. We estimate California GDP so that it is consistent with the underlying value of the GDP in IMPLAN in 2023 (see section A2.2), and we estimate that the share of consumer spending in GDP is 58.8 percent (see section A2.2). We estimate that 2023 aggregate consumer spending in California equals $1,589 billion.
• The annual reduction in jobs resulting from price increases is estimated using the 2014 IMPLAN model (see (Day 2013) for documentation on this software). We adjust those
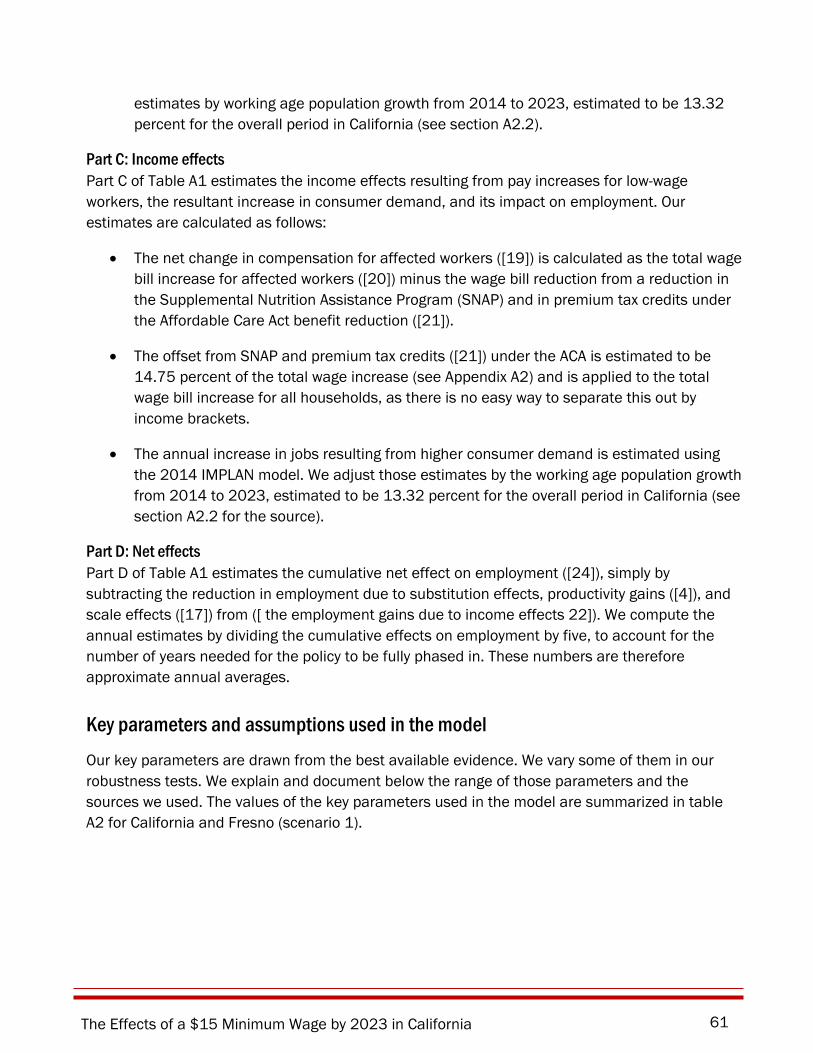
The Effects of a $15 Minimum Wage by 2023 in California 61
estimates by working age population growth from 2014 to 2023, estimated to be 13.32 percent for the overall period in California (see section A2.2).
Part C: Income effects Part C of Table A1 estimates the income effects resulting from pay increases for low-wage workers, the resultant increase in consumer demand, and its impact on employment. Our estimates are calculated as follows:
• The net change in compensation for affected workers ([19]) is calculated as the total wage bill increase for affected workers ([20]) minus the wage bill reduction from a reduction in the Supplemental Nutrition Assistance Program (SNAP) and in premium tax credits under the Affordable Care Act benefit reduction ([21]).
• The offset from SNAP and premium tax credits ([21]) under the ACA is estimated to be 14.75 percent of the total wage increase (see Appendix A2) and is applied to the total wage bill increase for all households, as there is no easy way to separate this out by income brackets.
• The annual increase in jobs resulting from higher consumer demand is estimated using the 2014 IMPLAN model. We adjust those estimates by the working age population growth from 2014 to 2023, estimated to be 13.32 percent for the overall period in California (see section A2.2 for the source).
Part D: Net effects Part D of Table A1 estimates the cumulative net effect on employment ([24]), simply by subtracting the reduction in employment due to substitution effects, productivity gains ([4]), and scale effects ([17]) from ([ the employment gains due to income effects 22]). We compute the annual estimates by dividing the cumulative effects on employment by five, to account for the number of years needed for the policy to be fully phased in. These numbers are therefore approximate annual averages.
Key parameters and assumptions used in the model Our key parameters are drawn from the best available evidence. We vary some of them in our robustness tests. We explain and document below the range of those parameters and the sources we used. The values of the key parameters used in the model are summarized in table A2 for California and Fresno (scenario 1).
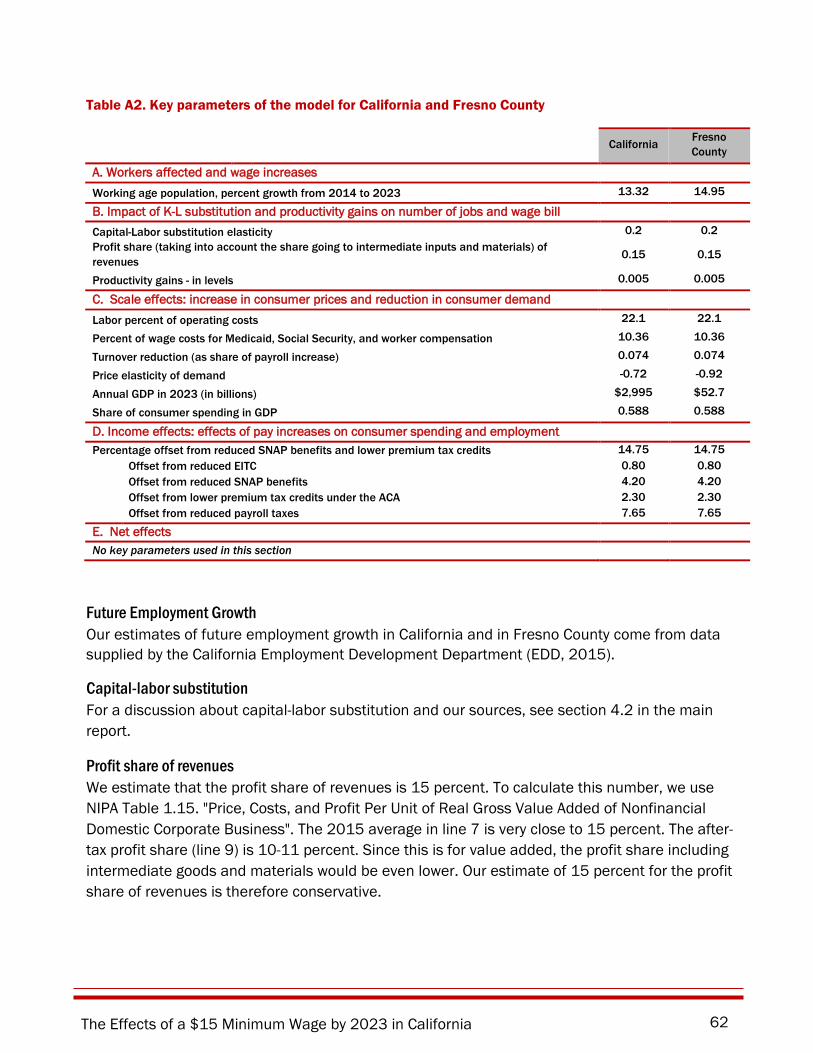
The Effects of a $15 Minimum Wage by 2023 in California 62
Table A2. Key parameters of the model for California and Fresno County
California Fresno
County
A. Workers affected and wage increases Working age population, percent growth from 2014 to 2023 13.32 14.95
B. Impact of K-L substitution and productivity gains on number of jobs and wage bill Capital-Labor substitution elasticity 0.2 0.2 Profit share (taking into account the share going to intermediate inputs and materials) of revenues 0.15 0.15
Productivity gains - in levels 0.005 0.005
C. Scale effects: increase in consumer prices and reduction in consumer demand Labor percent of operating costs 22.1 22.1
Percent of wage costs for Medicaid, Social Security, and worker compensation 10.36 10.36
Turnover reduction (as share of payroll increase) 0.074 0.074
Price elasticity of demand -0.72 -0.92
Annual GDP in 2023 (in billions) $2,995 $52.7
Share of consumer spending in GDP 0.588 0.588
D. Income effects: effects of pay increases on consumer spending and employment Percentage offset from reduced SNAP benefits and lower premium tax credits 14.75 14.75 Offset from reduced EITC 0.80 0.80 Offset from reduced SNAP benefits 4.20 4.20 Offset from lower premium tax credits under the ACA 2.30 2.30 Offset from reduced payroll taxes 7.65 7.65
E. Net effects No key parameters used in this section
Future Employment Growth Our estimates of future employment growth in California and in Fresno County come from data supplied by the California Employment Development Department (EDD, 2015).
Capital-labor substitution For a discussion about capital-labor substitution and our sources, see section 4.2 in the main report.
Profit share of revenues We estimate that the profit share of revenues is 15 percent. To calculate this number, we use NIPA Table 1.15. "Price, Costs, and Profit Per Unit of Real Gross Value Added of Nonfinancial Domestic Corporate Business". The 2015 average in line 7 is very close to 15 percent. The after-tax profit share (line 9) is 10-11 percent. Since this is for value added, the profit share including intermediate goods and materials would be even lower. Our estimate of 15 percent for the profit share of revenues is therefore conservative.
The Effects of a $15 Minimum Wage by 2023 in California 63
Productivity gains For a discussion of productivity gains and the sources we used, see section 5.1 in the main report.
Labor share of operating costs Net payroll cost increases for businesses are a function of three factors: (1) the total wage bill increase, after reduction due to substitution effects and productivity gains; (2) Medicare, Social Security, and Workers’ Compensation increases, and (3) turnover costs savings. The payroll costs increase as total compensation increases and decrease with turnover costs savings.
• The total wage bill increase from 2016 to 2023 is estimated with our wage simulation model based on micro data. For each year, we calculate the reduction in wage bill due to job losses from substitution effects and productivity gains, assuming that capital-labor substitution and productivity gains are constant over the years. We assume in our calculations that capital-labor substitution is equal to 20 percent every year, and that productivity gains are equal to 5 percent every year.
• Employers’ costs for Medicare, Social Security, and Workers’ Compensation will equal 10.36 percent of wages from 2016 to 2023. We estimate the three components—Medicare (1.45 percent), Social Security (6.2 percent), and Workers’ Compensation costs—separately. Since we are estimating only the effects of a minimum wage increase, we assume the Medicare and Social Security rates will not change between 2016 and 2019. For Workers’ Compensation costs, we draw from a report of the National Academy of Social Insurance {Citation}(2013). Table 14 (p. 37) of this report indicates that Workers’ Compensation employer costs in 2013 amounted to $1.50 per $100 of eligible wages. These costs increased $0.11 cent increase a year over 2011–2013, slightly more than the 2009–2011 change. To account for these cost increases, we adjust the 2013 cost by $0.34. Consequently, we estimate that Workers’ Compensation costs will equal 1.84 percent of wages in California and in Fresno County from 2016 to 2023.
• Turnover costs savings are based on the estimates of Pollin and Wicks-Lim (2015), Fairris (2005), Dube, Freeman and Reich (2010), Dube, Lester and Reich (2016), Boushey and Glynn (2012), and Jacobs and Graham-Squire (2010). See section 5.1 in the main report.
The labor share of operating costs by industry For each industry, we estimate labor costs as the sum of the annual wage costs, payroll taxes and employer paid insurance premiums (except health insurance), and other benefits (other than contributions to pension plans). The labor share is estimated using 2012 Census Bureau surveys—the most recent year available. We use these surveys only for select individual industries: retail trade; food services; wholesale trade; manufacturing; administrative and waste management services; health care and social assistance (including ambulatory care, hospitals, and long-term care); and other services. We document here our sources and methods for these
The Effects of a $15 Minimum Wage by 2023 in California 64
individual industries as well as for our estimates of the labor share of operating costs in the overall economy.
• Retail trade (including grocery stores): The 2012 U.S. Census Annual Retail Trade Reports provides data on retail sales, payroll costs, merchandise purchased for resale, and detailed operating expenses. We add operating expenses and purchases together to determine total operating costs. We add the costs of payroll taxes, employer paid insurance premiums, and employer benefits (excluding health insurance and retirement benefits) to annual payroll to estimate total labor costs. Health and retirement benefits are excluded since, unlike payroll taxes and Workers’ Compensation insurance, the costs of the benefits will not change if wages are increased. Dividing labor costs by operating costs gives us the labor share in retail trade.
• Food services industry: Industry data on gross operating surplus are available from the Bureau of Economic Analysis Input-Output Account Data, before Redefinitions, Producer Value. We subtract gross operating surplus from sales to obtain total restaurant operating costs, and then proceed as we did for retail to obtain labor cost data.
• Wholesale trade: Data are from the U.S. Census Annual Wholesale Trade Report. We follow the same methods as with retail trade.
• Manufacturing: Data are from the 2012 Economic Census (Table EC1231I1). To determine operating expenses we add together payroll costs and benefits, total cost of materials, total capital expenditures, depreciation, rental or lease payments, and all other operating expenses. To determine labor costs we add together payroll costs and payroll taxes, employer paid insurance premiums, and employer benefits (excluding health insurance and retirement benefits). To determine the labor share of operating costs in food manufacturing, we take the average between the labor share in operating costs for manufacturing and for non-durable manufacturing.
• Administrative and waste management services, health care and social assistance (including ambulatory care, hospitals, and long-term care), and other services: Data are from the U.S. Census Annual Services Report, which provides data on payroll and operating expenses. Total operating expenses are reported directly in the data. To determine labor costs we add together payroll costs and payroll taxes, employer paid insurance premiums, and employer benefits (excluding health insurance and retirement benefits).
• Overall economy: We sum the total labor and operating costs across all industries with available data and then divide the aggregate labor costs by the aggregate operating costs. In addition to the industries listed above, we are able to use the Annual Services Report to gather data on the following industries: utilities; transportation and warehousing; information; finance and insurance; real estate and rental and leasing; professional, scientific, and

The Effects of a $15 Minimum Wage by 2023 in California 65
technical services; educational services; and arts, entertainment, and recreation. We are missing data for the following industries, and as a result they are not included in our calculation: agriculture, forestry, fishing, and hunting; mining, quarrying, and oil and gas extraction; construction; accommodation; and public administration. Overall, we estimate that the labor share of operating costs is 22.1 percent in 2012 for California and Fresno County, and assume it is constant between 2012 and 2016.
Share of payroll costs for Medicare, Social Security and Workers’ compensation The share of Medicare, Social Security, and Workers’ Compensation is assumed to continue to be 10.36 percent from 2016 to 2023. We estimate the Medicare, Social Security, and Workers’ Compensation costs separately. Employers are liable for 6.2 percent Social Security taxes and 1.45 percent Medicare taxes. We estimate that the Workers’ Compensation employer cost is 2.71 percent of wages in California. The estimate of 2.71 comes from Workers’ Compensation Insurance Rating Bureau of California (2014), Chart 6 for “all industries”: http://www.wcirb.com/sites/default/files/documents/state_of_the_wc_system_report_140815.pdf. We use the same estimates for Fresno County.
Turnover reduction For a discussion on savings generated by turnover reduction and the sources we used, see section 5.1 in the main report.
Price elasticity of demand The price elasticity of demand measures the effect of a price increase on reducing consumer demand. We use a price elasticity of 0.72 for California. We present our calculations with both 0.72 and 0.92 for Fresno County. The 0.72 estimate is based on Taylor and Houthakker (2010), who report price elasticities for six categories of goods and services. We adjust their estimates to account for changes in the elasticity of health care spending attributable to the Affordable Care Act and other changes in the health care system.
GDP for California in 2023 The 2023 GDP used in our model has been forecasted using the following methodology:
• We start with the 2014 GDP reported in IMPLAN: $2,318 billion in California ($40 billion in Fresno County);
• We then forecast the GDP for California by applying the employment growth of 13.32 percent from 2014 to 2023 (respectively 14.95 percent for Fresno County), the projected wage growth using the last 10 years of CPI-W growth of 19.3 percent, and the GDP deflator in IMPLAN for 2023 (1.186 for California and Fresno County).
The Effects of a $15 Minimum Wage by 2023 in California 66
Share of consumer spending in GDP Our estimate of the share of consumer spending in GDP includes only consumer spending that flows through households. We therefore reduce the BEA’s estimate of the consumption share by 14.1 percent.
Offsets from benefit reductions and payroll tax increases We estimate that the total offset from reduced EITC to be 0.8 percent, the offset from reduced SNAP benefits to be 4.20 percent, the offset from lower premium tax credits under the ACA to be 2.3 percent, and the offset from reduced payroll taxes to be 7.65 percent (the remaining personal income taxes are removed by IMPLAN). These estimates have been calculated using Congressional Budget Office (2012). These results are for the year 2012, and we assume they will remain constant until 2021.
The Effects of a $15 Minimum Wage by 2023 in California 67
ENDNOTES
1 See the analysis of the Legislative Analyst’s Office for more information on the schedule and their estimated number of affected workers: http://www.lao.ca.gov/LAOEconTax/Article/Detail/220
2 See http://www.dir.ca.gov/dlse/faq_minimumwage.htm for a complete list of workers that are not eligible for California-based minimum wage increases.
3 However, Aaronson, Agarwal and French (2012), Table A-3, report a positive earnings effect for adults and nonetheless find no detectable effect on employment.
4 Neumark, Salas and Wascher (2014), the best-known researchers who find negative effects, report a 0.06 minimum wage employment elasticity for restaurants, very close to the findings in Allegretto et al. (2016).
5 One exception is Allegretto and Reich, forthcoming, which examined employment changes that resulted from San Jose’s March 2013 minimum wage increase. This policy change generated increased pay for about 25 percent of its workforce. 6 The study was prepared for the Los Angeles City Council; see Reich, Jacobs, Bernhardt and Perry (2015).
7 The capital-labor substitution elasticity is not likely to vary with minimum wage rates.
8 One exception is child care assistance, which does have a maximum income threshold that, once exceeded, results in the immediate loss of benefits. However, since there is a substantial waiting list for child care assistance benefits, any affected workers who lose eligibility will be replaced by lower-wage workers not currently receiving benefits. Workers who are no longer eligible for Medi-Cal will be eligible for subsidized health care through Covered CA. While most families will come out well ahead financially, the change in costs for specific families will depend on income and health care utilization.
9 This analysis is based on data gathered before the full implementation of the Affordable Care Act.
10 Hirsch, Kaufman, and Zelenska (2011) and Reich, Hall, and Jacobs (2003) found improvements in worker productivity following higher wage mandates.
11 The turnover savings are considered constant in 2018, 2019 and 2020, at 17.5 percent of increased labor costs, a midpoint estimate in the literature (Hirsch, Kaufman, and Zelenska 2011; Reich, Hall, and Jacobs 2003). These savings are likely to accrue at smaller rates as wage
The Effects of a $15 Minimum Wage by 2023 in California 68
levels go higher; we therefore assume that by 2023 the marginal increase in earnings relative to 2018 no longer yields any additional turnover savings. As a result, we estimate that the total savings from turnover at a $15 minimum wage in 2023 would be 7.4 percent of increased labor costs for California.
12 We use a payroll tax rate of 7.65 percent (6.2 percent for Social Security and 1.45 percent for Medicare). Workers’ compensation insurance rates vary by industry (see Table 6: http://www.wcirb.com/sites/default/files/documents/state_of_the_wc_system_report_140815.pdf.
13 Since workers often increase their wages by moving from one employer to another, we cannot assume that the correlation between wages and turnover indicates that low wages are causing higher turnover. As we discuss below, however, policy experiments with living wages and minimum wages have provided the evidence needed to determine that wages do, in fact, affect turnover.
14 These averages include the low-turnover period of the Great Recession, and can be expected to increase towards higher pre-recession levels as the labor market tightens.
15 The estimate of 17.5 percent represents the midpoint between the 20 percent estimate of Pollin and Wicks-Lim (2015) and a 15 percent (unpublished) estimate that draws upon Dube, Freeman and Reich (2010) and Dube, Lester and Reich (2016).
16 Burda et al. 2016, Table 6 (cols. 3 and 5) reports that a $1 increase in weekly pay reduces the incidence of shirking by -.027 (.0054), on a base of .032 (from Table 1). For a full-time worker, going from $10 to $15 per hour raises weekly pay by $200, so the effect on productivity would be about .2x.027 = .005, or 0.5 percent. This estimate measures just the effect of reducing idleness. Positive effects on absenteeism and worker engagement would add to the productivity improvement.
17 Taylor and Houthakker’s industry elasticities are based on regressions of U.S. panel data across over 300 cities and pooled over 1996-99. As we discuss below in Section 5.5, we do not expect that a substantial component of consumer sales will move outside the state’s borders. Liu and Chollet (2006)’s review essay suggests that the price elasticity of demand for out-of-pocket individual healthcare expenses is -0.2. Our health care elasticity recognizes that employers shift their cost of health care on to employees. We also recognize that for those with subsidized coverage, increases in premium costs for lower-income families—who are more price-sensitive—are borne by the federal government.
18 Annual consumer spending for California is estimated at 58.8 percent of IMPLAN’s estimated GDP for California. This percentage excludes the government share of health care costs.
The Effects of a $15 Minimum Wage by 2023 in California 69
19 IMPLAN household spending model (proportional to city consumer spending patterns by household income level), using reduced consumer spending in Row 3 and forcing IMPLAN to apply 100 percent of the reduction in the city; see the appendix for details on IMPLAN modeling.
20 This includes an offset of 4.20 percent for reduction in SNAP, and 2.3 percent in lower premium tax credits and cost sharing subsidies under the ACA (Congressional Budget Office 2012). We also reduce the aggregate increase in wages by lost earnings due to estimated job loss in Panel A. This offset may be too high. According to Chodorow-Reich and Karabarbounis (2015), the consumption expenditures of the unemployed equal 75 percent of the consumption expenditures of the employed, even after taking into account the limited duration of unemployment insurance benefits. Their result echoes a similar result by Aguiar and Hurst (2005) for food expenditures only.
21 IMPLAN household income model for California, using net wage increase from Row 5 and subtracting net wage increase going to affected workers who live outside California; see Appendix A2 and Day (2013) for more details on IMPLAN. The net wage increase is distributed across household income categories by the household distribution of increased wages from the minimum wage increase. Our wage simulation model estimates that 6.6 percent of increased wages will go to workers living outside the state.
22 The BEA data are for the Fresno MSA, which consists of Fresno County plus the much smaller neighboring Madera County. 23 This section relies heavily on Olmstead and Rhode (2003) and Martin (2011). 24 Martin (2016) discusses recent institutional changes designed to enhance labor supply, including the increasing use of farm labor contractors and importation of guest workers with H-2A visas. 25 The high rate of unauthorized immigrants in the Fresno agricultural work force raises the question of whether employers comply with high minimum wage standards. However, data from both employers (QCEW) and from worker surveys (such as the National Agricultural Workers Survey) show similar wage trends, suggesting that compliance rates are high and do not fall when minimum wages rise. This view is also held by agricultural labor expert Professor Philip Martin of UC Davis (personal communication, January 3, 2017).
26 This analysis is based on data gathered before the full implementation of the Affordable Care Act.
The Effects of a $15 Minimum Wage by 2023 in California 70
REFERENCES Aaronson, Daniel. 2001. “Price Pass-Through and the Minimum Wage.” Review of Economics and Statistics 83 (1): 158–69.
Aaronson, Daniel, Sumit Agarwal, and Eric French. 2012. “The Spending and Debt Responses to a Minimum Wage Hike.” American Economic Review 102 (7): 3111–39.
Aaronson, Daniel, Eric French, and James MacDonald. 2008. “The Minimum Wage, Restaurant Prices, and Labor Market Structure.” Journal of Human Resources 43 (3): 688–720.
Aaronson, Daniel, Eric French, and Isaac Sorkin. 2015. “Firm Dynamics and the Minimum Wage: A Putty-Clay Approach.” Working Paper 2013-26. Research Department, Federal Reserve Board of Chicago. https://www.chicagofed.org/digital_assets/publications/working_papers/2013/wp2013_26.pdf.
Aaronson, Daniel, and Brian Phelan. 2015. “Wage Shocks and Technological Substitution.” Federal Reserve Bank of Chicago.
Abowd, John, Francis Kramarz, Paul Lengermann, Kevin McKinney, and Sebastien Roux. 2012. “Persistent Inter-Industry Wage Differences: Rent Sharing and Opportunity Costs” 1 (7).
Achdou, Yves, Jiequn Han, Jean-Michel Lasry, Pierre-Louis Lions, and Benjamin Moll. 2014. “Heterogeneous Agent Models in Continuous Time.” Preprint. http://www.princeton.edu/~moll/HACT.pdf.
Aguiar, Mark, and Erik Hurst. 2005. “Consumption versus Expenditure.” Journal of Political Economy 113 (5): 919–48.
Akee, Randall, William Copeland, Gordon Keeler, Adrian Angold, and E. Jane Costello. 2010. “Parents’ Incomes and Children’s Outcomes: A Quasi-Experiment Using Transfer Payments from Casino Profits.” American Economic Journal: Applied Economics 2 (1): 86–115.
Akerlof, George, and Janet Yellen, eds. 1986. Efficiency Wage Models of the Labor Market. New York: Cambridge University Press.
Allegretto, Sylvia and Michael Reich. forthcoming. "Are Minimum Wages Absorbed byPrice Increases? Estimates from Internet-based Restaurant Menus." ILR Review. http://www.irle.berkeley.edu/files/2015/Are-Local-Minimum-Wages-Absorbed-by-Price-Increases.pdf
The Effects of a $15 Minimum Wage by 2023 in California 71
Allegretto, Sylvia, Arindrajit Dube, and Michael Reich. 2011. “Do Minimum Wages Really Reduce Teen Employment? Accounting for Heterogeneity and Selectivity in State Panel Data.” Industrial Relations 50 (5): 205–40.
Allegretto, Sylvia, Arindrajit Dube, Michael Reich, and Ben Zipperer. forthcoming. Credible Research Designs for Minimum Wage Studies: A Response to Neumark, Salas and Wascher. ILR Review.
Allegretto, Sylvia, and Michael Reich. 2016. “The Effects of Minimum Wage on Prices in San Jose: Evidence from Internet Restaurant Menus.” Accepted for ILR Review.
Alvarez-Cuadrado, Francisco, Ngo Van Long, and Markus Poschke. 2015. “Capital-Labor Substitution, Structural Change and the Labor Income Share.".” IZA Discussion Paper 8941. http://papers.ssrn.com/sol3/papers.cfm?abstract_id=2393997.
Autor, David. 2014a. “Polanyi’s Paradox and the Shape of Employment Growth.” Working Paper 20485. NBER. http://www.nber.org/papers/w20485.pdf.
———. 2014b. “Skills, Education and the Rise of Earnings Inequality Among the ‘Other 99 Percent.’” Science 344 (6186): 843–51.
Autor, David H., Alan Manning, and Christopher L. Smith. 2016. “The Contribution of the Minimum Wage to US Wage Inequality over Three Decades: A Reassessment.” American Economic Journal: Applied Economics 8 (1): 58–99. doi:10.1257/app.20140073.
Bastian, Jacob and Katherine Michelmore. 2015. “The Intergenerational Impacts of the Earned Income Tax Credit on Education and Employment Outcomes,” Working Paper
Belman, Dale, and Paul J. Wolfson. 2014. What Does the Minimum Wage Do? Kalamazoo, MI: W.E. Upjohn Institute for Employment Research.
———. 2015. “15 Years of Research on Employment and the Minimum Wage.” Working Paper 2705499. Tuck School of Business. http://papers.ssrn.com/sol3/papers.cfm?abstract_id=2705499.
Blake, Frank. 2000. New Ideas for Retaining Store-Level Employees. Atlanta, GA: Coca-Cola Research Council.
Blundell, Richard, Panos Pashardes, and Guglielmo Weber. 1993. “What Do We Learn About Consumer Demand Patterns from Micro Data?” American Economic Review 83 (3): 570–97.
Boushey, Heather. 2005. “No Way Out: How Prime-Age Workers Get Trapped In Minimum-Wage Jobs.” WorkingUSA 8 (6): 659–670.
The Effects of a $15 Minimum Wage by 2023 in California 72
Boushey, Heather, and Sarah Glynn. 2012. There Are Significant Business Costs to Replacement Employees. Center for American Progress. https://cdn.americanprogress.org/wp-content/uploads/2012/11/CostofTurnover.pdf.
Brown, Charles. 1999. “Minimum Wages and the Distribution of Family Income.” In Handbook of Labor Economics, edited by Orley Ashenfelter and David Card.
Burda, Michael, Katie Genadek, and Daniel Hamermesh. 2016. “Not Working at Work: Loafing, Unemployment and Labor Productivity.” Working Paper 21923. NBER. http://www.nber.org/papers/w21923.
Cahuc, Pierre, Stephane Carcillo, and Andre Zylberberg. 2014. Labor Economics. 2nd ed. Cambridge, MA: MIT Press.
California Agricultural Statistical Review 2014-15. https://www.cdfa.ca.gov/statistics/PDFs/2015Report.pdf
California Department of Industrial Relations. 2013. “Child Labor Laws.” Division of Labor Standards Enforcement. http://www.dir.ca.gov/DLSE/ChildLaborLawPamphlet.pdf.
California Employment Development Department, Labor Market Information Division. 2015. “2012-2022 Industry Employment Projections, San Jose-Sunnyvale-Santa Clara Metropolitan Statistical Area, (Santa Clara and San Benito Counties).” http://www.labormarketinfo.edd.ca.gov/file/indproj/sjos$indproj.xlsx.
Card, David, and Alan Krueger. 1995. Myth and Measurement: The New Economics of the Minimum Wage. Princeton: Princeton University Press.
Casselman, Ben. 2015. “It’s Getting Harder To Move Beyond A Minimum-Wage Job.” FiveThirtyEight. October 8. http://fivethirtyeight.com/features/its-getting-harder-to-move-beyond-a-minimum-wage-job/.
Center on Wisconsin Strategy (COWS). 2002. “A Public Investment in Quality Care for Kids: An Evaluation of the Local Child Care Wage Initiative.” University of Wisconsin-Madison. http://www.cows.org/_data/documents/1018.pdf.
Chetty, Raj, John N. Friedman, and Jonah Rockoff. 2011. “New Evidence on the Long-Term Impacts of Tax Credits,” Statistics of Income Paper Series.
Chirinko, Robert S., and Debdulal Mallick. 2016. “The Substitution Elasticity, Factor Shares, Long-Run Growth, and the Low-Frequency Panel Model.” SSRN Scholarly Paper ID 2479816. Rochester, NY: Social Science Research Network. http://papers.ssrn.com/abstract=2479816.
Chodorow-Reich, Gabriel, and Loukas Karabarbounis. 2016. “The Cyclicality of the Opportunity Cost of Employment.” Journal of Political Economy 124, 6: 1563-1618.
The Effects of a $15 Minimum Wage by 2023 in California 73
Congressional Budget Office. 2012. “Effective Marginal Tax Rates for Low- and Moderate-Income Workers.” U.S. Congress. https://www.cbo.gov/sites/default/files/11-15-2012-MarginalTaxRates.pdf.
Cooper, David. 2013. “Raising the Federal Minimum Wage to $10.10 Would Lift Wage for Millions and Provide Economic Boost.” Briefing Paper 371. Economic Policy Institute. http://s1.epi.org/files/2014/EPI-1010-minimum-wage.pdf.
Cooper, Kerris, and Kitty Stewart. 2013. Does Money Affect Children’s Outcomes? A Systematic Review. Joseph Rowntree Foundation. http://www.jrf.org.uk/sites/files/jrf/money-children-outcomes-full.pdf.
Costello, E. Jane, Scott Compton, Gordon Keeler, and Adrian Angold. 2003. “Relationships between Poverty and Psychopathology: A Natural Experiment.” Journal of the American Medical Association 290 (15): 2023–29.
Cotton, John L., and Jeffrey M. Tuttle. 1986. “Employee Turnover: A Meta-Analysis and Review with Implications for Future Research.” The Academy of Management Review 11 (1): 55–70.
Dahl, Gordon, and Lance Lochner. 2012. “The Impact of Family Income on Child Achievement: Evidence from the Earned Income Tax Credit.” American Economic Review 102 (5): 1927–56.
Day, Frances. 2013. “Principles of Impact Analysis & IMPLAN Applications.” IMPLAN Documentation. http://implan.com/index.php?view=download&alias=32-piaia-sample&category_slug=demo-1&option=com_docman&Itemid=1764.
Dixit, Avinash K., and Joseph E. Stiglitz. 1977. “Monopolistic Competition and Optimum Product Diversity.” The American Economic Review 67 (3): 297–308.
Draca, Mirko, Stephen Machin, and John Van Reenen. 2011. “Minimum Wages and Firm Profitability.” American Economic Journal: Applied Economics 3 (1): 129–51.
Dube, Arindrajit. 2013. “Minimum Wages and the Distribution of Family Incomes.” A Paper Series Commemorating the 75 Th Anniversary of the Fair Labor Standards Act, 172.
———. 2014. “Designing Thoughtful Minimum Wage Policies at the Local and State Levels.” In Policies to Address Poverty in America, edited by S. Kearney Melissa and Benjamin H. Harris. 2014: The Hamilton Project.
Dube, Arindrajit, Eric Freeman, and Michael Reich. 2010. “Employee Replacement Costs.” Working Paper 201–10. IRLE, UC Berkeley. http://www.irle.berkeley.edu/workingpapers/201-10.pdf.
The Effects of a $15 Minimum Wage by 2023 in California 74
Dube, Arindrajit, T. William Lester, and Michael Reich. 2010. “Minimum Wage Effects Across State Borders: Estimates Using Contiguous Counties.” Review of Economics and Statistics 92 (4): 945–64.
———. 2016. “Minimum Wage Shocks, Employment Flows and Labor Market Friction.” Journal of Labor Economics.
Dube, Arindrajit, Suresh Naidu, and Michael Reich. 2007. “The Economic Effects of a Citywide Minimum Wage.” Industrial and Labor Relations Review 60 (4): 522–43.
Evans, William, and Craig Garthwaite. 2010. “Giving Mom a Break: The Impact of Higher EITC Payments on Maternal Health.” Working Paper 16296. NBER. http://www.nber.org/papers/w16296.pdf.
Fairris, David. 2005. “The Impact of Living Wages on Employers: A Control Group Analysis of the Los Angeles Ordinance.” Industrial Relations 44 (1): 84–105.
Fan, Maoyong and Jeffrey M. Perloff. 2016.”Where Did All the Migrants Farm Workers Go?” Policy Brief, Institute for Research on Labor and Employment. http://irle.berkeley.edu/where-did-all-the-migrants-farm-workers-go/
Giuliano, Laura. 2013. “Minimum Wage Effects on Employment, Substitution, and the Teenage Labor Supply: Evidence from Personnel Data.” Journal of Labor Economics 31 (1): 155–94.
“Groups Supporting the Repeal of Section 14(c) of the Fair Labor Standards Act | National Federation of the Blind.” 2016. National Federation of the Blind. February 19. https://nfb.org/groups-supporting-repeal-section-14c-fair-labor-standards-act.
Hall, Robert. 2009. “By How Much Does GDP Rise If the Government Buys More Output?” Brookings Panel on Economic Activity 2: 183–231.
Harasztosi, Peter, and Attila Lindner. 2015. Who Pays for the Minimum Wage? https://www.dropbox.com/s/4wdvae5oo68v8mo/HungaryMW_wpFinal.pdf?dl=0.
Harmuth, Susan, and Susan Dyson. 2005. Results of the 2005 National Survey of State Initiatives on the Long-Term Care Direct-Care Workforce. The National Clearinghouse on the Direct Care Workforce; The Direct Care Workers Association of North Carolina. http://www.phinational.org/sites/phinational.org/files/clearinghouse/RESULTS%20OF%20THE%202005%20NATIONAL%20SURVEY%20FINAL%2092205.pdf.
Hinkin, Timothy, and J. Bruce Tracey. 2000. “The Cost of Turnover: Putting a Price on the Learning Curve.” Cornell Hotel and Restaurant Administration Quarterly 41 (4): 14–21.
The Effects of a $15 Minimum Wage by 2023 in California 75
Hirsch, Barry T., Bruce Kaufman, and Tetyana Zelenska. 2011. “Minimum Wage Channels of Adjustment.” IZA Discussion Paper 6132. Institute for the Study of Labor. http://www2.gsu.edu/ecobth/IZA_HKZ_MinWageCoA_dp6132.pdf.
Hoynes, Hilary W., Dong L. Miller, and David Simon. 2015,"Income, the Earned Income Tax Credit and Infant Health," American Economic Journal: Economic Policy, 7, 1:172-211.
Howes, Candace. 2002. The Impact of a Large Wage Increase on the Workforce Stability of IHSS Home Care Workers in San Francisco County. UC Berkeley: University of California Institute for Labor and the Economy; Center for Labor Education and Research. http://laborcenter.berkeley.edu/pdf/2002/Howes.pdf.
Jacobs, Ken, and Dave Graham-Squire. 2010. “Labor Standards for School Cafeteria Workers, Turnover and Public Program Utilization.” Berkeley Journal of Employment and Labor Law 31 (2): 447–59.
Kerstein, Seth and Carolyn Chu. 2016. "California's New Minimum Wage." http://www.lao.ca.gov/LAOEconTax/Article/Detail/221
Larson, Sheryl, Amy Hewitt, Charlie Lakin, and David Felce. 2004. “Multi-Perspective Analysis of Workforce Challenges and Their Effects on Consumer and Family Quality of Life.” American Journal of Mental Retardation 109 (6): 481–500.
Lawrence, Robert. 2015. “Recent Declines in Labor’s Share in US Income: A Preliminary Neoclassical Account.” Working Paper 15–10. Peterson Institute for International Economics.
Leigh, J. Paul, and Juan Du. 2012. “Are Low Wages Risk Factors for Hypertension?” European Journal of Public Health 22 (6): 854–59.
Liu, Su, and Deborah Chollet. 2006. Price and Income Elasticity of the Demand for Health Insurance and Health Care Services: A Critical Review of the Literature. Mathematica Policy Research. http://www.mathematica-mpr.com/Inc. /media/publications/PDFs/priceincome.pdf.
Manning, Alan. 2016. “CEP Discussion Paper No 1428 May 2016 The Elusive Employment Effect of the Minimum Wage.” http://cep.lse.ac.uk/pubs/download/dp1428.pdf.
Manoli, Dayanand and Nicholas Turner. 2014.”Cash-on-hand and College Enrollment: Evidence from Population Tax Data and Policy Nonlinearities.” NBER Working Paper 19836
Marans, Daniel. 2016. “Hillary Clinton Takes A Stand Against ‘Subminimum Wage’ For People With Disabilities.” The Huffington Post. March 29. http://www.huffingtonpost.com/entry/hillary-clinton-subminimum-wage-people-with-disabilities_us_56faf630e4b083f5c605ef20.
Martin, Philip. 2011. "California Hired Farm Labor 1960-2010-- Change and Continuity." https://migrationfiles.ucdavis.edu/uploads/cf/files/2011-may/martin-california-hired-farm-labor.pdf
The Effects of a $15 Minimum Wage by 2023 in California 76
Martin, Philip. 2016. "California Farm Labor in 2016." https://arefiles.ucdavis.edu/uploads/filer_public/60/31/6031a3e6-b323-4f78-9690-509404d70a2a/martinfarm_labor2016.pdf Maxfield, Michelle. 2014. “The Effects of the Earned Income Tax Credit on Child Achievement and Long-Term Educational Attainment.” Working Paper.
McCully, Clinton. 2011. “Trends in Consumer Spending and Personal Saving, 1959-2009.” Survey of Current Business 91 (6): 14–23.
Montialoux, Claire, Tobias Renkin, and Michael Siegenthaler. Forthcoming. “The Pass-through of Minimum Wages into US Retail Prices: Evidence from Supermarket Scanner Data.” Working Paper.
Morris, Pamela, and Lisa Gennetian. 2003. “Identifying the Effects of Income on Children’s Development Using Experimental Data.” Journal of Marriage & Family 65 (3): 716–29.
Neumark, David, J. M. Ian Salas, and William Wascher. 2014. “More on Recent Evidence on the Effects of Minimum Wages in the United States.” Working Paper Series 20619. NBER. http://www.nber.org/papers/w20619.pdf.
Neumark, David, and William Wascher. 1992. “Employment Effects of Minimum and Subminimum Wages: Panel Data on State Minimum Wage Laws.” Industrial and Labor Relations Review 46 (1): 55–81.
O’Connor, Sarah. 2016. “World Watches Britain’s ‘living Wage’ Experiment.” FT.com. March 29. http://www.ft.com/cms/s/2/2ae61f24-f2a9-11e5-aff5-19b4e253664a.html#axzz48ZT31htR.
Olmstead, Alan and Paul Rhode. 2003. "The Evolution of California Agriculture, 1850 to 2000." https://assets.documentcloud.org/documents/1310090/agriculture-california.pdf
Organization for Economic Co-operation and Development (OECD). 2013. “Minimum Wage Relative to Average Wages of Full-Time Workers.” OECD StatExtracts. http://stats.oecd.org/viewhtml.aspx?datasetcode=MIN2AVE&lang=en.
Perry, Ian, Sarah Thomason, and Annette Bernhardt. 2016. “Data and Methods for Estimating the Impact of Proposed Local Minimum Wage Laws.” UC Berkeley Labor Center. http://irle.berkeley.edu/cwed/briefs/2016-04.pdf.
Pollin, Robert, and Jeannette Wicks-Lim. 2015. “A $15 U.S. Minimum Wage: How the Fast-Food Industry Could Adjust Without Shedding Jobs.” Working Paper 373. Political Economy Research Institute, University of Massachusetts Amherst. http://www.peri.umass.edu/fileadmin/pdf/working_papers/working_papers_351-400/WP373.pdf.
The Effects of a $15 Minimum Wage by 2023 in California 77
Reeves, Aaron, Martin McKee, Johan Mackenbach, Margaret Whitehead, and David Stuckler. 2016. “Introduction of a National Minimum Wage Reduced Depressive Symptoms in Low-Wage Workers: A Quasi-Natural Experiment in the UK.” Health Economics, January, n/a-n/a. doi:10.1002/hec.3336.
Reich, Michael, Sylvia Allegretto, Ken Jacobs, Claire Montialoux, Ken Jacobs, Annette Bernhardt and Saah Thomason. 2016a. “The Effects of a $15 Minimum Wage by 2019 in Santa Clara County and San Jan Jose.” Center on Wage and Employment Dynamics, Institute for Research on Labor and Employment, University of California, Berkeley. http://irle.berkeley.edu/cwed/briefs/2016-01.pdf.
Reich, Michael, Sylvia Allegretto, Ken Jacobs, and Claire Montialoux. 2016b. “The Effects of a $15 Minimum Wage in New York State.” Center on Wage and Employment Dynamics, Institute for Research on Labor and Employment, University of California, Berkeley. http://irle.berkeley.edu/cwed/briefs/2016-01.pdf.
Reich, Michael, Peter Hall, and Ken Jacobs. 2003. “Living Wage Policies at San Francisco Airport: Impacts on Workers and Businesses.” ILRE Working Paper No. 98-03. ILRE.
Reich, Michael, Ken Jacobs, and Miranda Dietz, eds. 2014. When Mandates Work: Raising Labor Standards at the Local Level. Berkeley, CA: University of California Press.
Ruggles, Steven, Katie Genadek, Ronald Goeken, Josiah Grover, and Matthew Sobek. 2015. Integrated Public Use Microdata Series: Version 6.0 [Machine-Readable Database]. Minneapolis: University of Minnesota.
Schmitt, John. 2015. Why Does the Minimum Wage Have No Discernible Effect on Employment? Industrial Relations. http://www.cepr.net/documents/publications/min-wage-2013-02.pdf.
Statistics, U. S. Bureau of Labor. 2014. Job Openings and Labor Turnover Survey. http://www.bls.gov/jlt/data.htm.
Taylor, Lester, and Hendrik Houthakker. 2010. Consumer Demand in the United States: Prices, Income and Consumption Behavior. New York: Springer.
Ton, Zeynep. 2012. Why `Good Jobs’ Are Good for Retailers. Harvard Business Review. https://hbr.org/2012/01/why-good-jobs-are-good-for-retailers.
Whitebook, Marcy, Carollee Howes, and Deborah Phillips. 1989. Who Cares? Child Care Teachers and the Quality of Care in America. Final Report, National Child Care Staffing Study. Child Care Employee Project. http://www.irle.berkeley.edu/cscce/wp-content/uploads/2010/07/Who-Cares-full-report.pdf.
———. 2014. Worthy Work, STILL Unlivable Wages: The Early Childhood Workforce 25 Years after the National Child Care Staffing Study. Center for the Study of Child Care Employment, Institute
The Effects of a $15 Minimum Wage by 2023 in California 78
for Research on Labor and Employment, UC Berkeley. http://www.irle.berkeley.edu/cscce/wp-content/uploads/2014/11/ReportFINAL.pdf.
Wicks-Lim, Jeannette. 2006. “Mandated Wage Floors and the Wage Structure: New Estimates of the Ripple Effects of Minimum Wage Laws.” Working Paper 116. Political Economy Research Institute, University of Massachusetts Amherst. http://www.peri.umass.edu/fileadmin/pdf/WP116.pdf.
Wolfers, Justin, and Jan Zilinsky. 2015. “Higher Wages for Low-Income Workers Lead to Higher Productivity.” PIEE Briefing 2–15. Peterson Institute for International Economics. http://www.iie.com/publications/briefings/piieb15-2.pdf.
The Effects of a $15 Minimum Wage by 2023 in California 79
Institute for Research on Labor and Employment irle.berkeley.edu IRLE promotes multidisciplinary research on all aspects of the world of work and conducts numerous outreach programs. Its funding sources include the University of California, research grants and contracts, revenue from programs and publications, and contributions from individuals, business, unions, and community-based organizations.
Center on Wage and Employment Dynamics
irle.berkeley.edu/cwed CWED was established within IRLE in 2007 to provide a focus for research and policy analysis on wage and employment dynamics in contemporary labor markets.
Center on Wage and Employment Dynamics University of California, Berkeley 2521 Channing Way #5555 Berkeley, CA 94720-5555 (510) 643-8140 http://www.irle.berkeley.edu/cwed