Effects Based Operations Model - Command and Control Research
13
1. Topic: C2 Decision Making & Cognitive Analysis 2. Title : New Effects-Based Operations Models in War Games 3. Author: Lee W. Wagenhals and Larry K. Wentz 4. Organization: C3I Center, George Mason University 5. Address: System Architectures Laboratory C3I Center, MSN 4B5 George Mason University Fairfax, VA 22030-4444 Lee W. Wagenhals Larry Wentz 703-993-1712 (v) 703-993-1725 (v) 703-993-1706 (f) 703-993-1706 (f) [email protected] [email protected] 6. POC: Lee Wagenhals 1
Transcript of Effects Based Operations Model - Command and Control Research

1. Topic: C2 Decision Making & Cognitive Analysis
2. Title : New Effects-Based Operations Models in War Games
3. Author: Lee W. Wagenhals and Larry K. Wentz
4. Organization: C3I Center, George Mason University
5. Address: System Architectures Laboratory
C3I Center, MSN 4B5
George Mason University
Fairfax, VA 22030-4444
Lee W. Wagenhals Larry Wentz
703-993-1712 (v) 703-993-1725 (v)
703-993-1706 (f) 703-993-1706 (f)
[email protected] [email protected]
6. POC: Lee Wagenhals
1
New Effects-Based Operations Models in War Games1
Lee W. Wagenhals and Larry K.Wentz George Mason University
C3I Center, MSN 4B5 Fairfax, VA 22030
703 993 1712 or 1725 703 993 1706 Fax
[email protected]; [email protected]
Abstract
For more than a dozen years most components of the Department of Defense (DoD) have been exploring the means for incorporating effects based thinking into their planning, execution, and assessment activities of the command and control process. Over the same period of time effects based tools that support the development of analytical models relating actions to effects have been developed by the research and development (R&D) community. Researchers from George Mason University (GMU) have used these tools in several war games and have evolved new modeling techniques and uses for these tools. This paper describes how the models were developed and used in these war games. Furthermore, it suggests how the modeling techniques could be better incorporated into the effects-based operations (EBO) planning and execution processes in the future. The authors believe that the lessons learned from the war gaming experience can provide guidance to the further development of tools to support effects based operations, the procedures for incorporating these effects-based concepts into the command and control processes, and provide examples to support the education of the forces in effects based thinking.
1. Introduction
Institutionalizing EBO is a complex undertaking that requires the development of new doctrine, the education of the forces in the EBO concepts along with the development of a common lexicon of terms, the adaptation of the current command and control processes, and the development and use of tools that support effects based analysis.
Since 2000, the DoD components have conducted experiments and war games to develop and test approaches for making effects based operations work in the real world environments. In most cases, there were no tools specifically designed to support effects based thinking. A few organizations such as the Air Force Research Laboratory, IF Division at Rome, NY and George Mason University have developed prototype tools for relating actions to effects in a quantitative manner to support the development of models of situations that can be used to perform trade-off analysis in course of action development and selection. GMU has had the opportunity to use the tool it developed, called CAESAR II/EB, in the Navy Title X war games, Global 2000 and 2001, and the Joint Forces Command (JFCOM) J-9 Joint Experiment, Millennium Challenge 2002 (MC-02). 1 This work was supported by the Office of Naval Research under grant No. N00014-00-1-0267 and by the Air Force Office of Scientific Research under grant No. F49620-02-1-0332
Over the course of the war game participation, the GMU team explored different uses of the CAESAR II/EB tool in support of various decision processes within the command and control organization. GMU worked with Blue’s Red Cell and the Information Operations (IO) planning cell during much of these activities. As experience was gained in using the tool, the team was challenged to see if the tool could be used to answer an expanding set of questions. As a result the GMU team expanded its repertoire of uses for the CAESAR II/EB tool beyond the manner for which it had been originally designed. In this paper we describe four of these techniques. Each is presented as a short case study. Section 2 provides a brief description of the CAESAR II/EB modeling and analysis capability. Section 3 describes each technique. Case 1 describes the uses of the tool to support Course of Action (COA) comparison using a situation in which an adversary possesses chemical or biological weapons. Case 2 describes a technique for developing models to support indications and warning of attack by an adversary to include an estimation of the time of such attack. Case 3 describe a new capability that allows the incorporation of evidence from Intelligence, Surveillance, and Reconnaissance (ISR) sources to support the assessment of progress in achieving desired effects. Case 4 describes how the CAESAR II/EB tool could be used to support an assessment process as plan execution takes place. We summarize our observations in Section 4.
2. CAESAR II/EB Basics
The CAESAR II/EB tool was originally designed to support of the analysis of an adversary’s actions and reactions to Blue activities so that COA options could be evaluated in a rigorous manner. It was inspired by the need to support the development of IO planning and its integration with traditional (non-IO) military operations. We have describe the tool in some detail in previous Command and Control Research and Technology Symposium (CCRTS) papers2, so we will only provide a short summary here.
The tool incorporates influence nets as a probabilistic modeling technique and a discrete event system modeling technique, Colored Petri Nets (CP net), to support the temporal aspects of COA evaluation. These two techniques enable the modeler to create the structure of actions, effects, beliefs and decisions and the influencing relationships between them. The strength of the influencing relationships is also captured. The influence net provides a static equilibrium probabilistic model that indicates the probability of effects given sets of actions. A mapping has been established and an algorithm has been encoded for automatically converting the influence net to a CP net. After an influence net is converted to a CP Net, temporal analysis can be conducted that provides the probability of effects over time given a timed sequence of actions. This tool was designed to develop and assess COAs at the operational and strategic level.
The influence net provides an environment for modeling of the causal relationships between actions by our forces (Blue) and effects on the adversary (Red). It uses a graphical representation comprised of nodes that represent actions or effects and causal relationships between the nodes. In addition to the network structure of the model, estimates of the “strength” of the causal relationships is added and enables an underlying probabilistic model base on Bayesian mathematics to be used for analysis. The construct shown in Figure 1 is used. Starting from the set of desired and undesirable effects that reflect the goals of the mission, analysts work 2 Wagenhals, L. W. and Levis, A. H. (2002). “Modeling support of Effects Based Operations in War Games,” 7th Command and Control Research and Development Symposium, Naval Post Graduate School, Monterey Ca, June 2002.
2

backwards to relate the effects to actions that are under our control. Once the Influence net has been completed, it can be used to evaluate the impact of actions on the effects (decisions) of interest using its underlying Bayesian mathematics.
Once the analysis of the Influence net has been completed and the actionable events for the COA have been selected, planners assess the availability of resources to carry out the tasks that will result in the occurrence of the actionable events. The resultant plan will indicate when each actionable event will occur. Clearly, it is not only the selection of the set of actions that will lead to achieving the overall desired effects while not causing the undesired ones that is important. The timing of those actions is critical to achieving the desired outcomes.
Figure 1. Modeling Actions and Effects
Point of ViewRed’sFrom
Probabilistic Model relating Actions toEffects through a network of influencing relations ipsh
Set of Blue’s potential actionable events that may influence the set of effects on RED
Set of Desired and UndesirableEffects
An algorithm has been implemented3 that converts an influence net into a discrete event dynamical system model. The particular mathematical model used is that of CP Nets and their software implementation in Design/CPN 4. The nodes in the Influence net become transitions in the CP Net and the places hold tokens that carry the marginal probabilities. Since the Influence net does not contain temporal information, it must be provided as an input to the CP Net.
Figure 2 shows the combination of models and results produced by the CAESAR II/EB tool. An Influence net model for a given situation is shown in the upper left of Figure 2. Each node represents an action, event, belief, or decision. A declarative sentence in the form of a proposition is used to express the meaning of each node. The directed arcs between two nodes mean that there is an influencing or causal relation between those nodes. The truth or falsity of the parent node can affect the truth or falsity of the child node. The Influence net has been arranged with potential Blue actions on the left and the key Red decisions on the right. This is to indicate visually that the effects of the actions are expected to propagate to intermediate effects over time until their impact reaches the key decisions. This captures the cascading and accumulation of effects. There are six actionable events on the left side of the Influence net. These are candidate actions (or results of actions) that can comprise a COA that can impact the three Red decisions of interest.
3 Wagenhals, L. W., Shin, I., and Levis, A. H. (1998). “Creating Executable Models of Influence Nets with Coloured Petri Nets,” Int. J. STTT, Springer-Verlag, Vol. 1998, No. 2, pp. 168-181. 4 Jensen K. (1997). Coloured Petri Nets: Basic Concepts, Analysis Methods and Practical Use. Volumes 1, 2, and 3. Basic Concepts. Monographs in Theoretical Computer Science, Springer-Verlag, Berlin, Germany.
3

Once the analysis of the Influence net has been completed and the actionable events for the COA have been selected, the Influence net is automatically converted to an executable model (CP net) so that a temporal analysis of the COA can be performed. Using the executable model, the analyst is able to generate the probability profiles that show the marginal probability for any node in the net as a function of time. These profiles can indicate how long it will take for the effects of the actionable events to affect various nodes in the Influence net. The analyst will most likely concentrate on the probability profiles of the key decision nodes, the nodes with no children. The probability profiles shown in Figure 2 were generated for the COA proposed by the planners. The annotations have been added to indicate the three separate probability profiles. Different timing of the actions can alter the probability profiles, some will be more desirable than others. Some may be unacceptable, so the planners will try to adjust they scheduling of actions.
Blue Actions Probability Profiles
Influence Net
EXECUTABLE MODEL
COAs (actions with times)
Red DecisionsLead to
Indicator
Time (Days)
Red Decides to Terminate Hostilities
Red Decides to negotiate
Red Decides to use WMD
Figure 2. CAEAR II/EB Products
3. Case Studies
In this section we describe four techniques for using the capabilities of the CAESAR II/EB tool to support effects based operations. Each case study is described using a fictitious scenario that has been created by the authors to highlight the capability of the technique. They are not exact examples form any of the war games.
3.1. Case 1, Introducing Forces with Chem/Bio Threat We introduce this case to demonstrate the COA option generation and comparison capability
and techniques of the CAESAR II/EB tool. We use a scenario in which a rebel force occupies a territory, perhaps an island, and potentially possesses chemical or biological weapons. The Blue
4

objective is to land forces in the territory to cause the rebels to either surrender or be captured. The rebels have a leader who can authorize the use of the chemical weapons. This leader believes that he can set conditions that will favor his long term cause. He believes that if he either threatens or actually causes unacceptable casualties to Blue or a high level of casualties to the civilian population, Blue will be dissuaded from continuing to threaten him and the rebel cause. He has two ways of using the chemical weapons. In the first, he can mount them on short range Tactical Ballistic Missiles (TBMs) to be fired at the Blue Forces, but this may expose his TBMs to air strikes. If he is unwilling or unable to use the TBMs, his rebel forces may release the chemical agents to cause the casualties.
The Rebel Leader must have good situational awareness of the territory (island) he occupies. Blue has some control over this. The Rebel forces must be willing to follow the Rebel Leader’s direction, including the possible release of the chemical weapons that may cause casualties not only to Blue, but to the Rebels and the civilian population. Thus Blue may be able to persuade the Rebel forces to not take this action. Blue plans to provide humanitarian assistance (HA) (and potentially Disaster Relief (DR) if there are many casualties) to the civilians in the territory as soon as Blue is able.
The influence net model that captures the features of this situation is shown in Figure 3. It has as the overall effect of interest, “There are Many Causalities on X” (X is the territory or island). The objective is to keep the probability of this undesired effect low. On the left side of the influence net is a set of actionable events that are the potential elements of the COA. These actions include Information Operations to limit Rebel Leader’s situational awareness of Blue and X, actions to discredit the Rebel Leader in the eyes for the Rebels, offering safe passage to the Rebels if they do not follow the Rebel Leader, and the reporting of the impending HA/DR intentions and actions of Blue. The landing of the forces is also an actionable event.
Figure 3. Influence Net for Dealing with Chemical Weapons
5

Five timed sequences of the actionable events that comprise different COAs were analyzed to see the impact of the timing on the probability of the effects. COA 1 was based on Blue Forces landing on X on day 10 followed by an aggressive IO campaign composed of the IO actions. The result, shown in Figure 4, is a 3 day window when the probability of casualties due to the release of chemical weapons increases significantly. We can examine the “cause” of the probability profile by superimposing on the same chart the probability that TBMs are used and the probability the rebels release the chemical agents (Figure 5). Alternate COAs that adjust the timing of the IO actions in relationship with the landing and related probability profiles can be used to assess relative impacts. Some reduced the window of vulnerability such as the profile in Figure 6 that shows a “better” COA. Figure 7 shows the “best” COA that contains early use of IO to restrict the Rebel Leaders Situation Awareness of X and IO to discredit the Rebel Leader to the Rebel forces, while it delays the announcement of the Humanitarian Assistance (that may tip off the Rebel Leader) until just before the landing. The result is the elimination of the window of vulnerability. Further analysis, not shown shows that when the forces land, they must react quickly to disable the chemical systems to minimize the time they are available for release by the Rebels. Figure 8 shows a composite comparing the original COA 1 with the “best” COA. Such a figure could be used to support the argument of accepting the “Best” COA.
Figure 4. Initial COA Figure 5. Initial COA Detailed
Figure 7. “Best” COA Figure 6. “Better” COA
6

3.2. Case 2, Incorporating Evidence from ISR Indicators
Our second case is designed to illustrate how incorporating evidence from ISR observations can enhance assessment of progress of a COA toward achieving overall effects. Incorporating this capability in CAESAR II/EB required adding a backward probability propagation algorithm to the existing forward propagation algorithm. The algorithm has two variants. An un-timed version and a timed version.
To use the capability, certain indicator nodes must be incorporated into the model. These are nodes that represent events or conditions that may be observed by sensors. These indicators must
have a causal relationship with at least one other node in the influence net model. For example, there may be a condition that should occur if the COA is working toward achieving an effect, but that condition may be difficult or impossible to observer directly. However, if that unobservable condition does occur (or does not occur) in may in turn cause (with some probability) another event that could be observed. If the we observe this event or condition, then we can infer the state of the unobserved event that caused it. In general, if such evidence is incorporated in the model, it will reduce the uncertainty in the results.
Figure 8. COA Comparison
We illustrate this capability by modifying our example of the Rebel Forces on X. A more detailed influence net of the situation has been created as shown in Figure 9. The overall desired effect is that the Rebel Forces no longer occupy X militarily. The model has 15 actionable events that could comprise a COA to achieve the effect. Several actions are non-lethal including both IO actions and maneuver of Blue force capability. Assume that initially, non-lethal and lower risk actions are taken in the following manner. On day one, Blue begins an IO campaign to encourage individual members of the Rebel Forces to leave X, and at the same time the IO campaign discredits the Rebel Leader’s cause. On day two, Blue IO sends messages to the Rebels indicating that they will not have any reinforcements if they engage Blue. A little later, Blue offers safe passage to any Rebels willing to leave X. On day three, Blue issues a demarche to the Rebels that includes terms for surrender.
A number of indicators are included in the model. These include the Rebel Forces leaving their tactical positions and the Rebel Forces abandoning their arms. The former is an indication that the rebel forces have accepted the conditions for surrender, but have not yet surrendered. Suppose that ISR observes the first indicator on day 5. In Figure 9, we have pointed out the node to which the evidence has been added. In the tool, the node becomes green in color which indicates that this evidence has been included in the model. When this evidence is incorporated into the model, the probability profile changes significantly (Figure 10). Prior to inputting the evidence only a portion of the COA had been executed. The probability profile showed progress was being made toward achieving the effect of the Rebel no longer being in control of X reaching a maximum probability of 45% by day 7. When the evidence is included in the model, the probability jumps to 80% by day 7. This means that there is much stronger indications that the COA is working. Indeed, it may be possible to alter the COA and not conduct some of the
7

actions that were being contemplated. Addition evidence could re-enforce or contradict this judgement. In any case, having the ability to add evidence to the model can enhance its support to the assessment of progress.
3.3. Case 3, Indications and Warning (of Impending Attack)
In many situations there may be a time when Blue Forces are maneuvering or massing in preparation of action or to present the threat of action to an adversary. One of the concerns of the Blue Forces may be a surprise attack by the adversary. This is particularly true if the Adversary has TBMs.
Figure 9. Influence Net with Evidence of an Indicator
Figure 10. Probability Profile Comparison
We postulate that the CAESAR II/EB type of tool may be useful in providing warning to Blue forces of such attack. The idea is straight forward. We build an
8

influence net that links indicators to the an attack event. The temporal analysis capability then provides the probability profile of an attack given we observe certain indicators of that attack. We use probability that Red will attack (with system Y) as the effect node in the influence net. We then consider the functions and systems that Red must activate to launch the attack. In short, observing certain indicators means that the set of functions necessary to cause the attack has occurred (with some probability). Some of these functions may not be directly observable. We then work backward to find indicators of those actions. In a sense we have reversed the causal relationship. If the function occurred, it will cause an indicator to occur. Our model says that if we observe the indicator, we can say with certain conditional probabilities that the causing function has occurred. Time delay information is added to the executable model in the same fashion as we have done for the traditional models. When we have indicators that are observable we can task ISR assets to look for the indicators. If and when the ISR assets observe and report the indictors, the information is applied to the CAESAR II/EB model. The resultant probability profiles become the indication of the likelihood of attack and also provide an estimate of when the attack may occur.
Figure 11. Influence Net for I&W
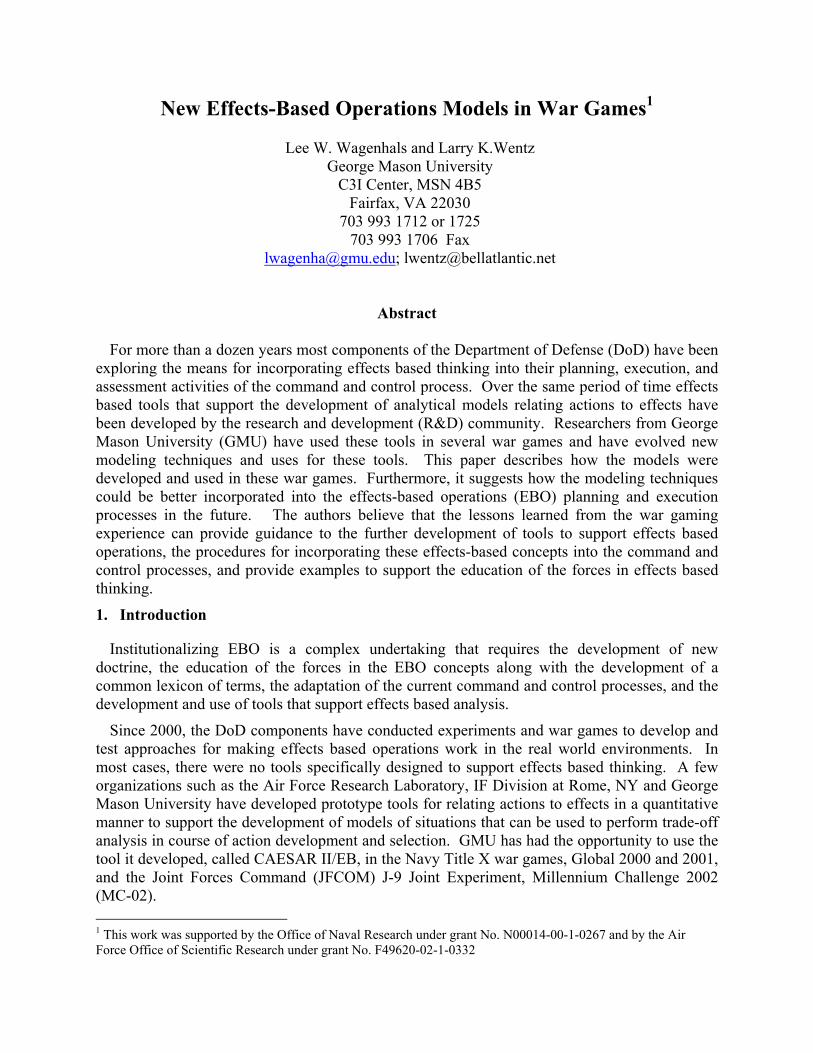
To illustrate the concept, Figure 11shows an influence net model for an adversary that has TBMs that might be used to attack Blue. This three layer model has the indicators on the left, implications of those indicators in the middle, and the effect node for attack on the right. Note that there are 19 indicators. Figures 12, 13, and 14 show how the probability profile changes as different indicators are observed. In a typical scenario, if Red was getting ready to attack, ISR may observe several indicators over time. As more indications are detected, the probability of attack increases allowing Blue to get ready, increase its defensive posture, etc.
In the example, seven indications are detected over the time period 2 to10 as shown in Figure 12. This combination of indicators causes a modest increase in the likelihood of attack. Figure 13 shows that when indicator 2 is observed at time 12, the cumulative effect of the previous indicators when combined with this new indicator cause a more significant jump in the probability of attack at time 18. Figure 14 shows that when indicator number 1 is observed at time 13, when the previous indicators are taken into account, this causes the probability of attack to jump to 90% at time 17 (four time units from the observation of indicator 1). While not contained in this example, there could be counter indicators to attack included. Such indicators would show that the adversary is reducing his attack posture.
An interesting observation is that it is not the number of indications that determines the probability of attack, but rather the accumulation of indications over time. Some indicators have stronger weights then others in their contribution to the overall effect. As with all CAESAR
9
Figure 14. Critical Indicator Figure 13. New Indicator Figure 12. Early Indications
II/EB based models, different timed combinations of indications will result in different probability profiles.
3.4. Case 4, EBO Model Driven Assessment Our last case is motivated by the need for commanders and their staff to be able to assess the
progress that is being made across levels of command for several desired effects. In many cases, this assessment is part science and part art. In general, military planners rely on Measures of Performance (MOPs) and Measures of Effectiveness (MOEs) for these assessments. The MOPs usually are associated with traditional Bomb Damage Assessments (e.g. was the building hit with the correct ordinance at the correct time?). MOEs tend to be more related to higher level objectives or the expected result of cascading effects from tactical actions. The objective is to assess MOPs and MOEs to come to a consensus about the progress that is being made toward the objectives and how long it will take to achieve those objectives.
With an effects based approach, commanders are looking for assessments of how the COA is doing toward achieving the desired overall effects. Currently, this is done with the same combination of evidence and indications of MOPs and MOEs, and a subjective judgment as to how long it will take to achieve the desired effect.
Given that effects-based models have been created for the effects that are to be achieved and these models have been used to select a COA, it seems quite straight forward to use these models to provide the assessment picture. If each desired effect has such a model, the probability profile generated by that model can be used to assess both the trend toward the effect and how long it may take before the effect is achieved. By applying threshold levels for measures of goodness to the probabilities of each effect, the probability profile can be converted into an easy-to-visualize graphical picture. Figure 15 illustrates the concept. The top of Figure 15 shows a notional Effects-Based Assessment Matrix. The left-hand column lists a set of primary effects of concern to the organization using the matrix. The second column provides a graphical depiction of the trend, that is, a summary how the COA is progressing. Up arrows mean that probability of achieving the effect is increasing. A horizontal arrow means the probability is not changing by much. A downward arrow would mean the situation is degrading; an indication that the COA should be re-examined. The remaining columns reflect a time line. Each column represents a time period, for example hours, days, weeks, etc. The symbols in each to these columns reflects the assessment of the probability of achieving the effect in the time interval. The color of the symbol, red, yellow, or green, indicates that the probability, low, medium, or high, respectively, of the effect being achieved in that time interval. There are two types of symbols, circles or “Xs”
10

Figure 15. Creating an Effects Based Assessment Matrix Using CAESAR II/EB Models
The circle, in this example, represents a previous assessment. The “X” indicates the current and future assessments. As shown in the row for the second effect in the eight time period, it is possible also to incorporate an indication that the trend is reversing during this time period. In this case a downward arrow has been added. Again, this may be a flag for examination of the COA.
The overall concept is that the assessments could be driven quantitatively by the probability profile of an underlying CAESAR II/EB model for the effect. Three notional probability profiles provided by the CAESAR II/EB tool are shown below the Matrix. Each probability profile has been annotated with the time interval associated with the columns in the Matrix. In addition, threshold levels for determining the assessment value have been established for each effect. Note that the thresholds do not have to be the same for every effect. Some effects may have lower thresholds than others.
We envision this technique being used in a command and control system that has multiple models supporting the effects based process. At each echelon models supporting the effects of concern at that echelon are developed and maintained. The models are used not only to support COA analysis and selection, but also to drive the Assessment Matrix that the commander and staff can access. The Assessment Matrix functions as a quick look visualization of the overall COA and its past, current, and projected execution over time. The focus is on the desired effects. The command and staff can focus on those effects and the COAs designed to achieve them. It is
11

12
easy to see the COAs that may be not performing to expectations as well as those that are working better than expected. If the underlying effects-based models have the indicators as was shown in Case 2, the arrival of an indicator observation could cause a significant change in the Assessment of the effect. This could be immediately reflected in a change to the Assessment Matrix.
4. Summary
Over the past decade, both the R&D and the operational communities have been evolving and refining the concept of effects based operations. On the R&D side, tools to support an effects based analysis of COAs has been developed. CAESAR II/EB as one instantiation of this type of tool has been used in operationally realistic war games and experiments in collaboration with the operational community. This experience has enable the researches to better understand the needs of the operator and to expand the researcher’s repertoire of modeling types and techniques to provide support to different classes of problems.
In this paper we have presented four variants of basic effects based models that were created with the CAESAR II/EB tool. As in many cases, a good tool has multiple uses. We have discovered several through our war game inspired experimentation with the tool. The uses we have described in this paper span the spectrum from indications and warning, COA development and selection, the inclusion of evidence from ISR to reduce uncertainty in the COA model, to overall assessment of multiple effects. We think that the tool or its successor can provide a unifying framework for effects based operations across echelons and across the process of COA selection, planning, execution and assessment. Perhaps the largest challenge ahead is to develop a cadre of analysts within the operational community who can quickly create these types of models. Members of that cadre should be made available at multiple echelons of the command and control structure. These cadre could continuously coordinate the develop and maintenance of there models as they support the planning, execution and assessment process. As we continue to increase our understanding of the use of this basic model and the techniques and procedures that support those uses, we should begin to be able to better support the operators as they conduct effects-based operations.
Acknowledgement The contribution of the GMU System Architectures Laboratory staff: Dr. Insub Shin, Mr. Daesik Kim, Mr. Sajjad Haider in the development of CAESAR II/EB is gratefully acknowledged.