Effectiveness of International Investment Agreements
25
230 自由論題 [研究論文] Effectiveness of International Investment Agreements 投資協定の締結効果 Akiko Saito Doctoral Program, Graduate School of Media and Governance, Keio University 齊藤 安希子 慶應義塾大学大学院政策・メディア研究科後期博士課程 Correspondence to: [email protected] Osamu Kurita Professor, Faculty of Science and Technology, Department of Administration Engineering, Keio University 栗田 治 慶應義塾大学理工学部管理工学科教授 本稿では、投資協定の締結によりどの国が「効果的」なポジションを築いて いるか、について考察した。締結済の投資協定の数が上位 100 の国を対象とし、 各国が締結した投資協定数及び締結国のデータを用いて固有ベクトル中心性 の計算式に基づき検証した。その結果、対象国のうち、投資協定の締結により 中国が最も効果的なポジションを有している旨等を結論づけた。 This research addressed a question on which country/countries are likely to have developed “effective” positioning by concluding international investment agreements (IIAs), by using data for 100 countries based on the large number of IIAs that each country has concluded. The effectiveness, or the “advantage of position” of IIAs in this research, is examined by the calculation of eigenvector centrality. Our conclusions included that China has the most effective positioning in having IIAs among the selected 100 countries in this research. Abstract: Keywords: international investment agreements, eigenvector centrality, 100 countries 投資協定、固有ベクトル中心性、100 か国
Transcript of Effectiveness of International Investment Agreements
230
自由論題
[研究論文]
Effectiveness of International Investment Agreements 投資協定の締結効果
Akiko SaitoDoctoral Program, Graduate School of Media and Governance, Keio University齊藤 安希子慶應義塾大学大学院政策・メディア研究科後期博士課程Correspondence to: [email protected]
Osamu KuritaProfessor, Faculty of Science and Technology, Department of Administration Engineering, Keio University栗田 治慶應義塾大学理工学部管理工学科教授
本稿では、投資協定の締結によりどの国が「効果的」なポジションを築いているか、について考察した。締結済の投資協定の数が上位100の国を対象とし、各国が締結した投資協定数及び締結国のデータを用いて固有ベクトル中心性の計算式に基づき検証した。その結果、対象国のうち、投資協定の締結により中国が最も効果的なポジションを有している旨等を結論づけた。
This research addressed a question on which country/countries are likely to have developed “effective” positioning by concluding international investment agreements (IIAs), by using data for 100 countries based on the large number of IIAs that each country has concluded. The effectiveness, or the “advantage of position” of IIAs in this research, is examined by the calculation of eigenvector centrality. Our conclusions included that China has the most effective positioning in having IIAs among the selected 100 countries in this research.
Abstract:
Keywords: international investment agreements, eigenvector centrality, 100 countries投資協定、固有ベクトル中心性、100 か国
Effectiveness of International Investment Agreements
KEIO SFC JOURNAL Vol.20 No.2 2020
231
1 Introduction International investment-related agreements primarily consist of either
investment chapters in Economic Partnership Agreements (EPAs)/Free Trade
Agreements (FTAs) or International Investment Agreements (IIAs). The number of
international investment-related agreements has been increasing, especially since the
year 2000. There are more than 2,600 such agreements in force as of September 10,
2020 1). Investment-related rules are also included in World Trade Organization
(WTO) agreements, under the Agreement on Trade-Related Investment Measures
(TRIMS), but no further developments or agreements have been made since, due to
the stagnation of the most recent round of negotiations 2). Instead, and as a result, the
number of concluded EPAs/FTAs with investment related provisions and IIAs is
increasing. Because EPAs/FTAs and IIAs are concluded among the participating
countries (parties) of the negotiations, it is, in general, easier to reach an agreement
compared with those of the WTO, which basically require agreement among its more
than 160 member countries.
IIAs and investment chapters of EPAs/FTAs are important for companies that
invest in overseas countries, as these agreements are relevant to the protection of
investments. There is a high demand from business sectors for the conclusion of
international investment-related agreements. As for Japan, the policy paper “Calling
for Accelerated Conclusion of Investment Agreements” (2015) by Keidanren 3), an
economic organization in Japan in which most of the countryʼs large and leading
companies are the members, asked to conclude more investment-related agreements.
Keidanren also occasionally urges this conclusion, while also requesting the inclusion
of important elements in specific negotiations, such as Japan-EU (European Union)
EPA and the Trans-Pacific Partnership Agreement 4). Similar requests have also been
made by other organizations 5) in Japan. In addition, given the stagnation of WTO
negotiations for rule making, as well as the increase of international investment-
related agreements globally, the Japanese government is proactively trying to
conclude agreements that include international investment-related provisions. For
example, in May 2016, the Japanese government established a plan to work on
232
自由論題
negotiations aiming to sign and/or achieve the enforcement of international
investment-related agreements (IIAs and EPAs/FTAs with investment chapters)
covering 100 countries/regions by 2020, which is also mentioned in Japanʼs policy,
“Growth Strategy 2018 (Basic Outlook and Key Strategies)” 6). The Japanese
government has been working to conclude international investment-related
agreements based on this policy.
One question we need to ask here is the impact of agreements. Previous studies
had examined the impact, political and economic contributions and implications, of
the IIAs. A study by Urata (2015) 7), based on the analysis of foreign direct investment
by Japanese firms by examining the data of 97 countries from 1980-2012, concluded
that EPAs, FTAs, and IIAs have positive impacts on foreign direct investment by
Japanese firms. This research is an example of endeavours to see the impact of
agreement by studying the agreements that were concluded. This research is another
endeavour to see the impact of agreements, analyzing the dynamics among the
countries that concluded IIAs. To be more precise, the purpose of this research is to
address a question on which countries are likely to have “effective” positioning by the
IIAs that they have concluded. The effectiveness, or the “advantage of position” or
effective positioning 8) in this research, is examined by the eigenvector centrality, by
the combination of the number of agreements and the counterpart countries of IIAs
for respective countries. The calculation shows which country/countries are likely to
be at the “center” of IIA agreements globally, which was quantitatively calculated
based on an assumption that the effects of concluded agreements act cumulatively. In
order to address the question, the paper firstly analyzes the relationships among the
15 countries, namely, Japan, Germany, China, Switzerland, Turkey, the United
Kingdom, France, Egypt, South Korea, Luxembourg, the Netherlands, the Russian
Federation, the United States, India, and Brazil. Then, secondly, the paper analyzes a
larger sample of 100 countries, in order to examine their effectiveness or effective
positionings.
Effectiveness of International Investment Agreements
KEIO SFC JOURNAL Vol.20 No.2 2020
233
2 �International Investment Agreement and the definition of “effectiveness”
As overseas investment increases globally, the number of international investment-
related agreements has also increased. The purpose of such agreements is mainly to
protect the “investment” 9). There are also types of agreements that contribute in
liberalization such as gaining market access and covering pre investment, in addition
to protection of the investors and investments. Usually, IIAs are easier to conclude
than EPAs/FTAs, as IIAs are focused specifically on investment, while EPAs/FTAs
generally include other treatments and obligations, such as tariff reduction, services,
etc., which often makes these agreements more complicated and harder to conclude.
Apart from the geopolitical, political, and economic benefits at the State level, the
benefits are for the investors of the country that invest in foreign countries. For
example, if country Aʼs investor invests in country B, country Aʼs investor as well as
its investment are protected under an investment agreement between A and B. Each
agreement is a result of negotiations between or among the negotiating parties, which
theoretically and practically makes each agreement unique. However, many of the
agreements, especially those which were concluded in later years, usually include the
following 10): Definition and Scope (of investment), Most-Favored Nation (MFN),
National Treatment (Pre-establishment/Post-establishment) 11), Prohibition of
Performance Requirements 12), Fair and equitable treatment 13), Umbrella Clause 14),
Expropriation and compensation for losses, Transfer, Subrogation, Dispute Settlement
Mechanism (Investor State Dispute Settlement). Among the provisions, Most Favored
Nation (MFN) is the most relevant clause to this research. MFN is a principle that
prevents countries from discriminating between the respective trading partners 15).
MFN aims to “treat other people equally” 16), and has a function designed to “grant
someone a special favour (such as a lower customs duty rate for one of their
products) and you have to do the same for all other WTO members” 17). Therefore, for
example, when country A concludes an IIA with country B, country A must also
provide the same treatment, including other rights and obligations mentioned above,
to its future counterparts resulting from the IIA as it has given to country B, if the IIA
234
自由論題
between A and B includes an MFN clause stating such obligation18). This, MFN, is
the fundamental concept of the WTO and GATT rules as well, as it facilitates trade
without discrimination 19). With IIAs, the right for foreign investors or obligations to
the host countries transferred through MFN is also important as many of them
included provisions on Investor State Dispute Settlement (ISDS) which works as a
means to settle disputes between investors and Host State. ISDS provides foreign
investors with the right to access an international and third party tribunal to resolve
investment disputes. Among more than 1,000 ISDS cases as of the end of August
2020, there are around 100 ISDS cases that claimed the violation of MFN 20). The
analysis by this research is especially relevant as most of IIAs include the MFN
treatment, and is conducted based on an assumption that all IIAs include an MFN
clause 21). This paper sets an assumption that all IIAs include MFN Clause 22), and
considers that a country that has created the most effective positioning among the
other countries is the one that most cumulatively gathers the rights, including the
transferred ones through MFN23).
The pace and number of the concluded agreements per country differ. The
tendency of the conclusion of IIAs in terms of the numbers by the year was examined
in Figure 1 for the selected 15 countries, namely, Japan, Germany, China,
Switzerland, Turkey, the United Kingdom, France, Egypt, South Korea, Luxembourg,
the Netherlands, the Russian Federation, the United States, India, and Brazil. These
countries were chosen according to the following categories: 1) countries that have a
high number of international investment-related agreements 24) (Germany,
Luxembourg, the Netherlands, Turkey, China, Switzerland, the United Kingdom,
France, Egypt, South Korea), 2) emerging countries (BRICs, Brazil, Russia, India,
(and China, which is also included in the first category)), and 3) the country that
makes the largest overseas investment (the United States), and 4) Japan.
Figure 1 is created based on the number (accumulated) of IIAs for respective
countries. As shown in the graph, the accumulation of the numbers by year for the
respective countries and the tendencies, such as when the respective countries: 1)
started to conclude IIAs, 2) rapidly increased their number of IIAs, and 3) stopped or

Effectiveness of International Investment Agreements
KEIO SFC JOURNAL Vol.20 No.2 2020
235
moderately concluded their IIAs, etc., differ from country to country. Figure 1 shows
that Japan and Brazil are the countries that have increased their numbers of concluded
IIAs at the highest pace in recent years. As for Japan, it could be assumed that its
increase in recent years is in accordance with its aforementioned policy on the
conclusion of international investment-related agreements. Furthermore, it is also
understandable that Japan implemented such a policy, especially when compared
with countries in Europe that have a large number of IIAs. On the other hand, there
are a few countries whose numbers of the IIAs are not increasing or which remain at
a moderate pace. For example, the United States has concluded only few IIAs since
1999. The United States increased its free trade agreements that include chapter on
investments, instead, which might be the cause. Germany, the country that has the
most international investment-related agreements (a combination of IIAs and EPAs/
FTAs), has also only concluded a moderate number of IIAs in recent years. This is
also true for several other countries, especially in European Union (EU), such as the
United Kingdom and the Netherlands. This is relevant to the fact that EU as a whole
negotiates and concludes trade and investment-related agreements such as free trade
agreement. The trend for developing countries, such as India and Brazil, might be in
line with their developments. Both countries concluded their first IIAs in 1994, rather
recent especially compared with other countries. However, they have since increased
their numbers of concluded IIAs. In the case of India, its steady increase in the pace
of its IIAs might be as a result of the interests of its counterpart countries. There is a
possibility that other countries are interested in having IIAs with India as their
investors (namely, the investors of the countries that concluded IIAs with India) aim
to make investments in India.

236
自由論題
Figure 1 IIAs of respective 15 countries Source: United Nations Conference on Trade and Development (UNCTAD)
0
20
40
60
80
100
120
140
160
180
Bef
ore
1989
1990
1991
1992
1993
1994
1995
1996
1997
1998
1999
2000
2001
2002
2003
2004
2005
2006
2007
2008
2009
2010
2011
2012
2013
2014
2015
2016
2017
2018
2019
Num
ber o
f con
clud
ed II
As
Year
International Investment Agreements of respective countries
①Japan ⑤Germany ⑨China ⑬Switzerland
②France ⑥Egypt ⑩UK ⑭Netherlands
③Luxenbourg ⑦South Korea ⑪Turkey ⑮India
④Russian Federation ⑧US ⑫Brazil
①
②
⑫
⑧
④⑮⑪⑦
③
⑭⑥
⑬
⑨⑤
⑩
3 Methodology The benefits gained by each country as a result of concluding IIAs are
considered to be transmitted to partner countries, and vice versa, because of MFN
Clauses; that is, the profit or obligation of one country reflects that of the partner
countries, and there is an inherent structure in which the home country also produces
benefits for the partner countries. The “advantage of position,” or effective
positioning, or the “effectiveness” of IIAs in this research, is examined by the
eigenvector centrality. The eigenvector centrality is a good tool for expressing such a
chained profit propagation structure. This index is mathematically equivalent to what
is called “advantage of position” in the field of urban engineering and “page rank” in
the field of network science. The main point of this research is to examine the
following: to what extent each country plays a central role. To examine, this research
Effectiveness of International Investment Agreements
KEIO SFC JOURNAL Vol.20 No.2 2020
237
mathematically positions each country, based on data that shows the relationships
between and among the countries. In the fields of mathematical sociology,
information engineering, and urban geography, there are indexes for measuring the
centrality of the subject based on the networking structure or state of connection
between subjects such as eigenvector centrality (what is called advantage of position
in the field of urban geography), Katz centrality, page rank, degree centrality,
closeness centrality, and betweenness centrality. This research uses eigenvector
centrality for the following reasons. Firstly, eigenvector centrality is an index that has
a feature of receiving a positive contribution from the centrality of the connected
subjects, and at the same time, exerting the influence of its own centrality to the
connected subjects. As it is assumed that the greater the benefits one country receives
by its connectivity with other countries through agreements, the more it also gives the
benefits to the partner countries, eigenvector centrality is an effective method to
analyze based on the purpose of this research. Secondly, as the network among the
countries which was developed by the concluded agreements constitutes a connected
graph, the adjacency matrix is irreducible. Therefore, this research especially did not
use Katz centrality which is used to analyze the similar cases but only when they are
not irreducible.
The effectiveness in this paper is examined by the combination of the number of
agreements and the counterpart countries of IIAs for respective countries, therefore
showing which country/countries are likely to be at the “center” of IIA agreements
globally or effectively positioning itself among the countries. This research firstly
examines the selected 15 countries (n=15 countries) which were chosen according to
the aforementioned categories. This research then enlarges the number of countries
and examines the 100 countries (n=100 countries) 25). Those 100 countries are
selected by the number of the agreements that they have concluded, from the top to
the 100th. The data on the concluded investment-related agreements of the respective
countries, both data for those 15 and 100 countries in this research, are based on
publicly available data published by the United Nations Conference on Trade and
Development (UNCTAD) (accessed in May and June 2019).

238
自由論題
The relationships among the countries, based on their concluded IIAs, were
examined using the following procedure: 1) to make an n × n square adjacent matrix
A=[aij] among the countries - if there is an investment-related agreement between the
countries, put “1” for the element aij and aji of the matrix A=[aij], and if not, then put
“0” , and 2) to derive the eigenvector of the maximum eigenvalue of the matrix A.
We used Mathmatica for the calculations. The value of the i-th element of the
eigenvector was called the eigenvector centrality of i-th country. If matrix A is given
by the adjacency matrix of the traffic network, the eigenvectors can be regarded as
having “advantage of position”. Furthermore, if the adjacency matrix A is given by
the link relation of the web site, the well-known “page rank” can also be obtained.
The meaning of the elements of the eigenvectors associated with the largest
eigenvalue of the adjacency matrix is explained as follows. The adjacency matrix A is
a (0,1) matrix, which is an n-th order real symmetric matrix corresponding to the
number of vertices of the plotted graph. The eigenvalue λ and eigenvector x of this
adjacency matrix A are expressed as:
(1)
Here, according to the Peron-Frobenius theorem, A has the largest positive
eigenvalue, while the largest eigenvalue belongs to the eigenvector consisting of
nonnegative components. This “component xi of the eigenvector belonging to the
largest eigenvalue” is called the eigenvector centrality of the vertex i. Furthermore,
from equation (1),
(2)
is obtained. If a vertex is connected to either vertices with a large centrality value or
many vertices, the centrality value tends to be large. Thus, this is an effective and
unique method that describes the intensity of vertices recursively, based on the
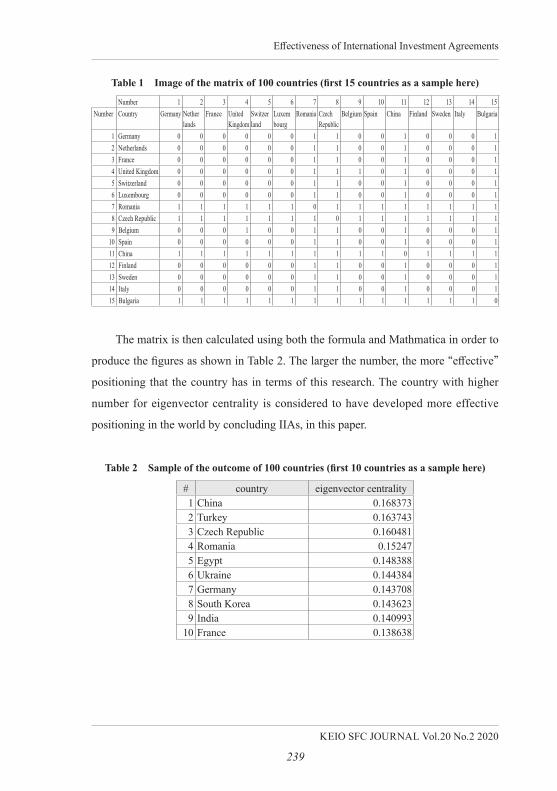
adjacency between vertices. An image of the matrix is shown in Table 1.
Effectiveness of International Investment Agreements
KEIO SFC JOURNAL Vol.20 No.2 2020
239
Table 1 Image of the matrix of 100 countries (first 15 countries as a sample here)
Number 1 2 3 4 5 6 7 8 9 10 11 12 13 14 15Number Country Germany Nether
landsFrance United
KingdomSwitzerland
Luxembourg
Romania Czech Republic
Belgium Spain China Finland Sweden Italy Bulgaria
1 Germany 0 0 0 0 0 0 1 1 0 0 1 0 0 0 12 Netherlands 0 0 0 0 0 0 1 1 0 0 1 0 0 0 13 France 0 0 0 0 0 0 1 1 0 0 1 0 0 0 14 United Kingdom 0 0 0 0 0 0 1 1 1 0 1 0 0 0 15 Switzerland 0 0 0 0 0 0 1 1 0 0 1 0 0 0 16 Luxembourg 0 0 0 0 0 0 1 1 0 0 1 0 0 0 17 Romania 1 1 1 1 1 1 0 1 1 1 1 1 1 1 18 Czech Republic 1 1 1 1 1 1 1 0 1 1 1 1 1 1 19 Belgium 0 0 0 1 0 0 1 1 0 0 1 0 0 0 1
10 Spain 0 0 0 0 0 0 1 1 0 0 1 0 0 0 111 China 1 1 1 1 1 1 1 1 1 1 0 1 1 1 112 Finland 0 0 0 0 0 0 1 1 0 0 1 0 0 0 113 Sweden 0 0 0 0 0 0 1 1 0 0 1 0 0 0 114 Italy 0 0 0 0 0 0 1 1 0 0 1 0 0 0 115 Bulgaria 1 1 1 1 1 1 1 1 1 1 1 1 1 1 0
The matrix is then calculated using both the formula and Mathmatica in order to
produce the figures as shown in Table 2. The larger the number, the more “effective”
positioning that the country has in terms of this research. The country with higher
number for eigenvector centrality is considered to have developed more effective
positioning in the world by concluding IIAs, in this paper.
Table 2 Sample of the outcome of 100 countries (first 10 countries as a sample here)
# country eigenvector centrality1 China 0.1683732 Turkey 0.1637433 Czech Republic 0.1604814 Romania 0.152475 Egypt 0.1483886 Ukraine 0.1443847 Germany 0.1437088 South Korea 0.1436239 India 0.140993
10 France 0.138638
240
自由論題
4 Literature studies There is no previous research that examined IIAs and/or effectiveness of MFN
by using the same methodology of this research. Previous studies which are relevant
to this research could primarily be those that dealt with networking. There is an
accumulation of studies that investigated the networks and connections between or
among places on trade and investments, especially in the field of economics. Studies
include categories such as spatial economy and gravity model. Baldwin and Okubo
(2005) concluded that re-locating to the big region is most attractive for the most
productive firms, and Baldwin and Okubo (2006) showed “how more productive
firms sort themselves to the large core region” 26). Those studies, however, did not use
eigenvector centrality to analyze. Other researches on networking that used
eigenvector centrality are the following. Iino et al. (2018) examined how the research
collaboration of firms affects the quality of their innovation outcomes by using
comprehensive patent data for firms in the world, and showed that research
collaboration substantially improves the quality of innovation of firms by combining
a variety of knowledge in the collaboration. This study was based on a paper in
Japanese, Iino et al. (2017), which considered eigenvector centrality to examine the
effects. Yasumono and Itohisa (2013) investigated the networks in the process of
cross-industrial standardization by using eigenvector centrality. Ukai and Kurita
(2003) examined theoretical value for advantage of position associated with traffic
network, by analyzing an eigenvector of the adjacency matrix corresponding to traffic
network. In addition, in terms of MFN and its effects, among the accumulations of
studies on MFN, a few studies examined the effects of MFN relevant to tariff
reduction which could also be considered as the effects of networking among the
countries. These studies considered more on trade side of WTO and FTA schemes,
rather than MFN in IIAs, and did not use the same methodology of this research 27).
5 Analysis on 15 selected countries The analysis was conducted, firstly, among the selected 15 countries. Following
the aforementioned methodology, if there is an agreement between country A and
Effectiveness of International Investment Agreements
KEIO SFC JOURNAL Vol.20 No.2 2020
241
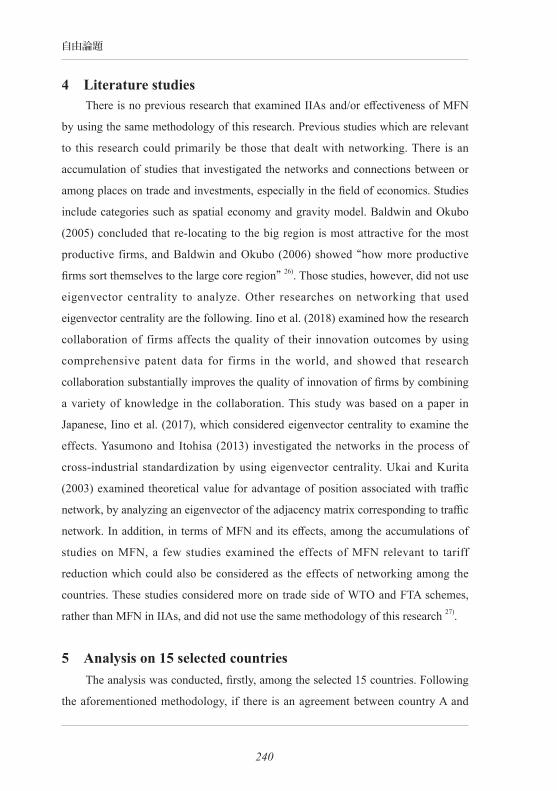
country B, then “1” was recorded in the cell where country A and country B intersect.
If there is none, then a “0” was used, as shown in Table 3.
Table 3 The matrix of IIAs concluded among the 15 countries
# country Egypt TurkeySouth Korea
ChinaRussian
FederationIndia Brazil
Switzerland
UK FranceLuxenbourg
Netherlands
Germany Japan US
1 Egypt 0 1 1 1 1 1 0 1 1 1 1 1 1 1 12 Turkey 1 0 1 1 1 1 0 1 1 1 1 1 1 1 13 South Korea 1 1 0 1 1 1 1 1 1 1 1 1 1 1 04 China 1 1 1 0 1 1 0 1 1 1 1 1 1 1 0
5Russian Federation
1 1 1 1 0 1 0 1 1 1 1 1 0 0 1
6 India 1 1 1 1 1 0 0 1 1 1 1 1 1 0 07 Brazil 0 0 1 0 0 0 0 1 1 1 1 1 1 0 08 Switzerland 1 1 1 1 1 1 1 0 0 0 0 0 0 0 09 UK 1 1 1 1 1 1 1 0 0 0 0 0 0 0 0
10 France 1 1 1 1 1 1 1 0 0 0 0 0 0 0 011 Luxenbourg 1 1 1 1 1 1 1 0 0 0 0 0 0 0 012 Netherlands 1 1 1 1 1 1 1 0 0 0 0 0 0 0 013 Germany 1 1 1 1 0 1 1 0 0 0 0 0 0 0 014 Japan 1 1 1 1 0 0 0 0 0 0 0 0 0 0 015 US 1 1 0 0 1 0 0 0 0 0 0 0 0 0 0
Total 13 13 13 12 11 11 7 7 7 7 7 7 6 4 3
The results were calculated and plotted using Mathematica under the
aforementioned methodology, which is shown in Table 4. The plotted graph based on
the results is shown in Figure 2. The vertical line of Figure 2 shows the result of
eigenvector centrality and the horizontal line is the attributed number of the countries
in the data table, Table 3 (first one is Egypt and the last one is the United States for
Figure 2, based on the order in Table 3).
242
自由論題
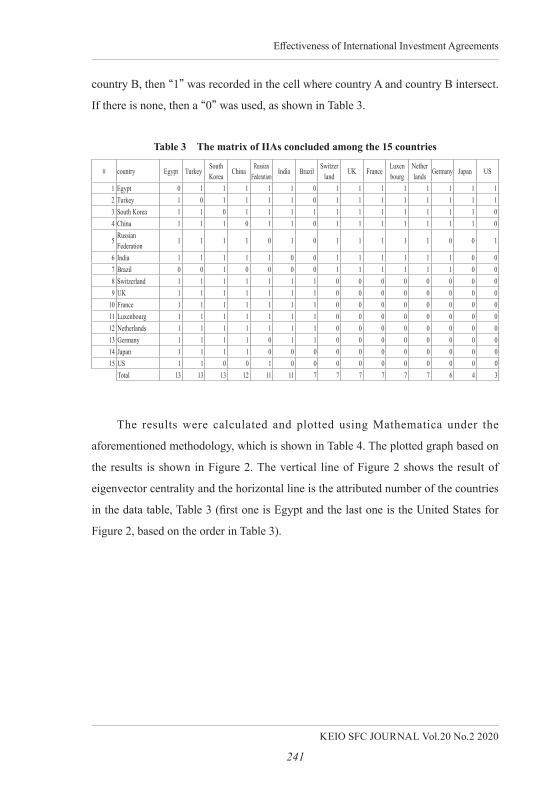
Table 4 Results of the 15 countries
# country eigenvector centrality times (#15's as 1) number of IIAs1 South Korea 0.344309 3.3296 132 Turkey 0.337382 3.26261 133 Egypt 0.337382 3.26261 134 China 0.327512 3.16717 125 India 0.313953 0.03605 116 Russian Federation 0.305329 2.95265 117 Switzerland 0.225985 2.18536 78 UK 0.225985 2.18536 79 France 0.225985 2.18536 7
10 Luxenbourg 0.225985 2.18536 711 Netherlands 0.225985 2.18536 712 Germany 0.19377 1.87383 613 Brazil 0.175989 1.70188 714 Japan 0.142077 1.37394 415 US 0.103408 1 3
0.35
0.30
0.25
0.20
0.15
0.10
0.05
2 4 6 8 10 12 14
Figure 2 Plotted graph by the eigenvector centrality based on Table 4 28)
South Korea is marked in a circle, Turkey is marked in a square, Egypt is
marked in a triangle, in Figure 2. These countries are the top three countries in terms
of having “effectiveness.” China, marked in doubled circle, is the fourth. The results
shown above imply the following: the number of IIAs works positively to the result,
Effectiveness of International Investment Agreements
KEIO SFC JOURNAL Vol.20 No.2 2020
243
as those three countries that have the highest number of IIAs (South Korea, Turkey,
and Egypt) all came in the top three of the calculation. However, the results regarding
the outcome figure highlight the difference, which is relevant to the counterpart
countries of the respective countries. The same applies to those countries that have
seven IIAs respectively, namely, Switzerland, the United Kingdom, France,
Luxenbourg, the Netherlands, and Brazil. While all countries except Brazil have the
same figure for eigenvector centrality, Brazilʼs eigenvector centrality is lower than the
others. Among those top three countries that had the same number of IIAs, as well as
the 15 countries as a whole, South Korea has the most effective positioning due to the
IIAs that it had concluded. This shows that South Korea has more benefit compared
with other countries, including those countries which had the same number of IIAs,
due to its counterpart countries. Japan ranked fourteenth, the second to the last of the
15 countries, which is primarily due to its small number of IIAs among the countries.
Separately, Japan has been increasing EPAs/FTAs that included investment chapter.
This research only covers IIAs and does not cover EPAs/FTAs, but if it did, the
ranking would be different. This also applies to other countries such as the United
States that tend to conclude EPAs/FTAs in recent years.
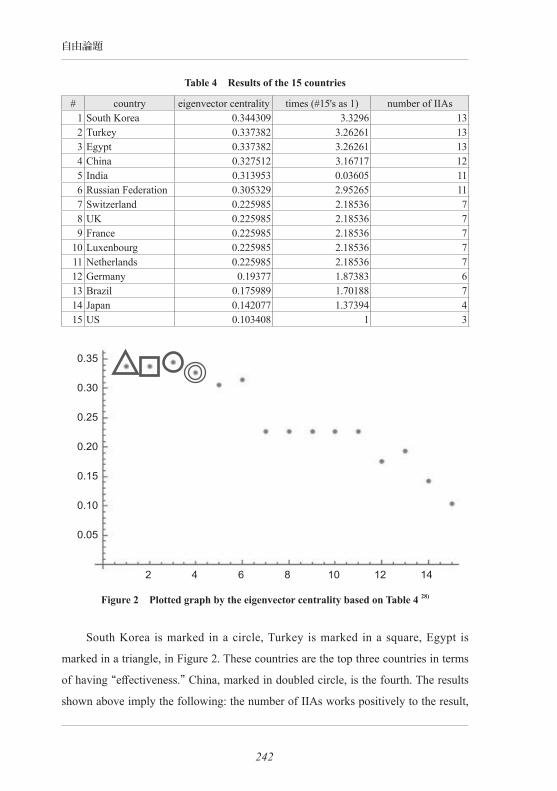
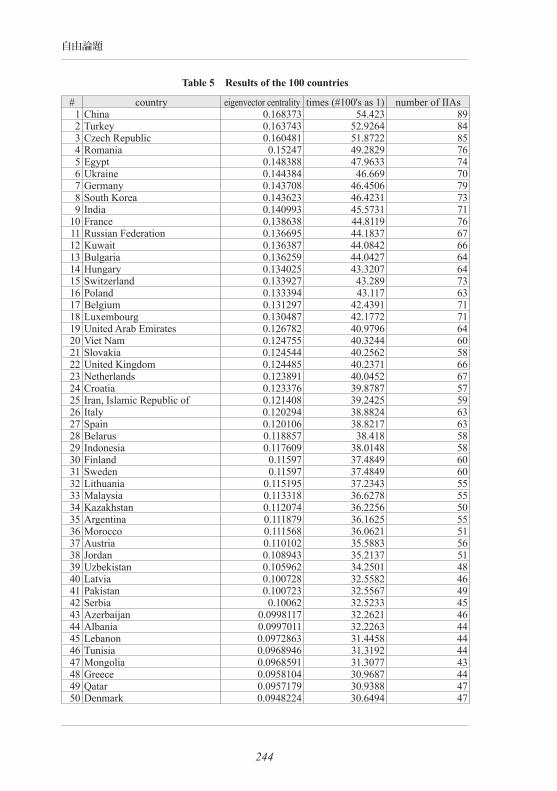
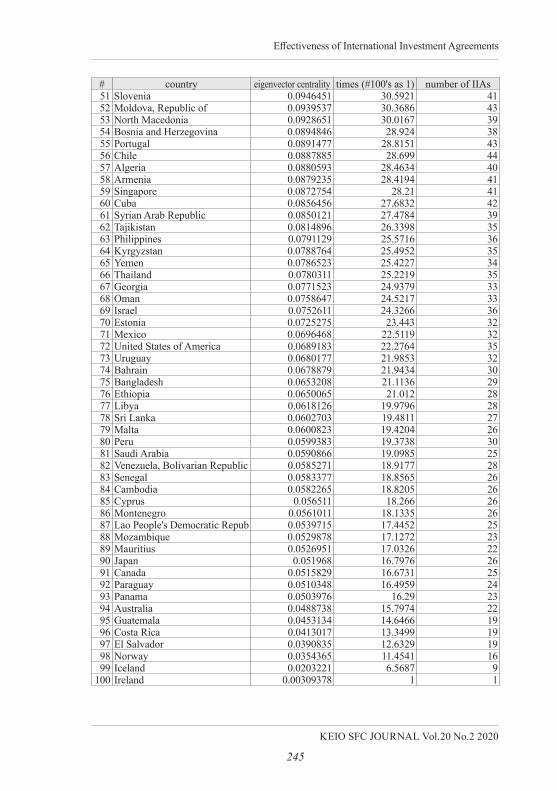
6 Analysis on 100 countries This research then expanded the scope to 100 countries, following the same
procedure as that used with the initial 15 countries, as described above. The results,
ranked from the higher figures to lower of the eigenvector centrality, are shown in
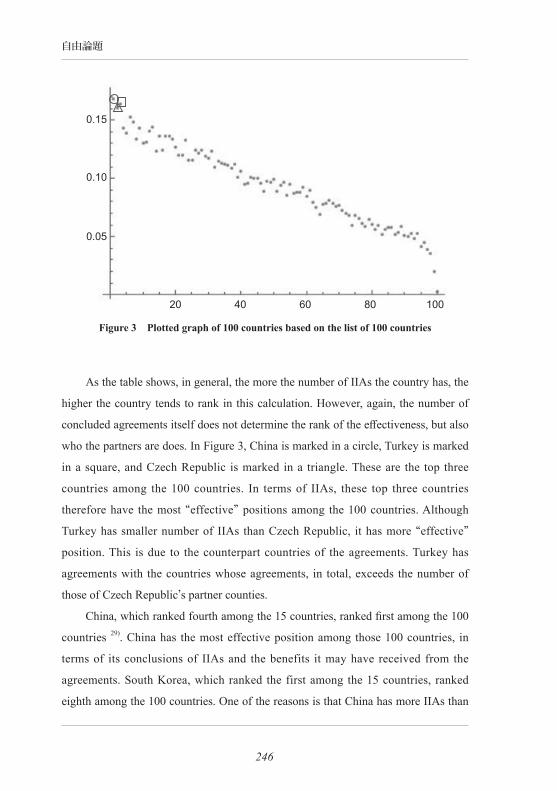
Table 5. Figure 3 used a data table in which the numbers were attributed according to
the number of concluded IIAs (the largest is on the left). The vertical in Figure 3
shows the effectiveness of the respective countries (the larger the amount, the more
effective).
244
自由論題
Table 5 Results of the 100 countries
# country eigenvector centrality times (#100's as 1) number of IIAs1 China 0.168373 54.423 892 Turkey 0.163743 52.9264 843 Czech Republic 0.160481 51.8722 854 Romania 0.15247 49.2829 765 Egypt 0.148388 47.9633 746 Ukraine 0.144384 46.669 707 Germany 0.143708 46.4506 798 South Korea 0.143623 46.4231 739 India 0.140993 45.5731 71
10 France 0.138638 44.8119 7611 Russian Federation 0.136695 44.1837 6712 Kuwait 0.136387 44.0842 6613 Bulgaria 0.136259 44.0427 6414 Hungary 0.134025 43.3207 6415 Switzerland 0.133927 43.289 7316 Poland 0.133394 43.117 6317 Belgium 0.131297 42.4391 7118 Luxembourg 0.130487 42.1772 7119 United Arab Emirates 0.126782 40.9796 6420 Viet Nam 0.124755 40.3244 6021 Slovakia 0.124544 40.2562 5822 United Kingdom 0.124485 40.2371 6623 Netherlands 0.123891 40.0452 6724 Croatia 0.123376 39.8787 5725 Iran, Islamic Republic of 0.121408 39.2425 5926 Italy 0.120294 38.8824 6327 Spain 0.120106 38.8217 6328 Belarus 0.118857 38.418 5829 Indonesia 0.117609 38.0148 5830 Finland 0.11597 37.4849 6031 Sweden 0.11597 37.4849 6032 Lithuania 0.115195 37.2343 5533 Malaysia 0.113318 36.6278 5534 Kazakhstan 0.112074 36.2256 5035 Argentina 0.111879 36.1625 5536 Morocco 0.111568 36.0621 5137 Austria 0.110102 35.5883 5638 Jordan 0.108943 35.2137 5139 Uzbekistan 0.105962 34.2501 4840 Latvia 0.100728 32.5582 4641 Pakistan 0.100723 32.5567 4942 Serbia 0.10062 32.5233 4543 Azerbaijan 0.0998117 32.2621 4644 Albania 0.0997011 32.2263 4445 Lebanon 0.0972863 31.4458 4446 Tunisia 0.0968946 31.3192 4447 Mongolia 0.0968591 31.3077 4348 Greece 0.0958104 30.9687 4449 Qatar 0.0957179 30.9388 4750 Denmark 0.0948224 30.6494 47
Effectiveness of International Investment Agreements
KEIO SFC JOURNAL Vol.20 No.2 2020
245
# country eigenvector centrality times (#100's as 1) number of IIAs51 Slovenia 0.0946451 30.5921 4152 Moldova, Republic of 0.0939537 30.3686 4353 North Macedonia 0.0928651 30.0167 3954 Bosnia and Herzegovina 0.0894846 28.924 3855 Portugal 0.0891477 28.8151 4356 Chile 0.0887885 28.699 4457 Algeria 0.0880593 28.4634 4058 Armenia 0.0879235 28.4194 4159 Singapore 0.0872754 28.21 4160 Cuba 0.0856456 27.6832 4261 Syrian Arab Republic 0.0850121 27.4784 3962 Tajikistan 0.0814896 26.3398 3563 Philippines 0.0791129 25.5716 3664 Kyrgyzstan 0.0788764 25.4952 3565 Yemen 0.0786523 25.4227 3466 Thailand 0.0780311 25.2219 3567 Georgia 0.0771523 24.9379 3368 Oman 0.0758647 24.5217 3369 Israel 0.0752611 24.3266 3670 Estonia 0.0725275 23.443 3271 Mexico 0.0696468 22.5119 3272 United States of America 0.0689183 22.2764 3573 Uruguay 0.0680177 21.9853 3274 Bahrain 0.0678879 21.9434 3075 Bangladesh 0.0653208 21.1136 2976 Ethiopia 0.0650065 21.012 2877 Libya 0.0618126 19.9796 2878 Sri Lanka 0.0602703 19.4811 2779 Malta 0.0600823 19.4204 2680 Peru 0.0599383 19.3738 3081 Saudi Arabia 0.0590866 19.0985 2582 Venezuela, Bolivarian Republic 0.0585271 18.9177 2883 Senegal 0.0583377 18.8565 2684 Cambodia 0.0582265 18.8205 2685 Cyprus 0.056511 18.266 2686 Montenegro 0.0561011 18.1335 2687 Lao People's Democratic Repub 0.0539715 17.4452 2588 Mozambique 0.0529878 17.1272 2389 Mauritius 0.0526951 17.0326 2290 Japan 0.051968 16.7976 2691 Canada 0.0515829 16.6731 2592 Paraguay 0.0510348 16.4959 2493 Panama 0.0503976 16.29 2394 Australia 0.0488738 15.7974 2295 Guatemala 0.0453134 14.6466 1996 Costa Rica 0.0413017 13.3499 1997 El Salvador 0.0390835 12.6329 1998 Norway 0.0354365 11.4541 1699 Iceland 0.0203221 6.5687 9
100 Ireland 0.00309378 1 1
246
自由論題
0.15
0.10
0.05
20 40 60 80 100
Figure 3 Plotted graph of 100 countries based on the list of 100 countries
As the table shows, in general, the more the number of IIAs the country has, the
higher the country tends to rank in this calculation. However, again, the number of
concluded agreements itself does not determine the rank of the effectiveness, but also
who the partners are does. In Figure 3, China is marked in a circle, Turkey is marked
in a square, and Czech Republic is marked in a triangle. These are the top three
countries among the 100 countries. In terms of IIAs, these top three countries
therefore have the most “effective” positions among the 100 countries. Although
Turkey has smaller number of IIAs than Czech Republic, it has more “effective”
position. This is due to the counterpart countries of the agreements. Turkey has
agreements with the countries whose agreements, in total, exceeds the number of
those of Czech Republicʼs partner counties.
China, which ranked fourth among the 15 countries, ranked first among the 100
countries 29). China has the most effective position among those 100 countries, in
terms of its conclusions of IIAs and the benefits it may have received from the
agreements. South Korea, which ranked the first among the 15 countries, ranked
eighth among the 100 countries. One of the reasons is that China has more IIAs than
Effectiveness of International Investment Agreements
KEIO SFC JOURNAL Vol.20 No.2 2020
247
South Korea when the counterpart countries are expanded to 100. The results also
imply that China could be at the center of the rule making process of international
investment-related agreements in terms of IIAs, especially as it has been concluding
so many IIAs. Again, each agreement is the result of mutual agreements of the
participating countries. Each agreement is unique though there are some tendencies
in what kinds of obligations are included in the agreements which are relevant to
protection of foreign investors and investments in host countries. The degree of such
protection, as well as whether or not to include obligations relevant to liberalization
of investment differentiate the quality of the agreements.
It could be assumed in terms of the Czech Republic, which is a current EU
member country but which only joined in 2004, much later than the bloc's founding
members, that other countries, including developed countries of EU members, needed
an investment-related agreement with the Czech Republic, and that this resulted in
the country's large number of concluded IIAs. A similar situation may also be true for
other countries in Eastern Europe given their high ranks, Romania ranking in fourth,
Ukraine in sixth, Bulgaria in thirteenth, and Hungary in fourteenth. These countries'
economic relationships with the most developed countries in EU, such as Germany,
France, and the United Kingdom, might be the key for the large number of concluded
IIAs for Turkey, the Czech Republic, and other countries in Eastern Europe that are
tightly clustered to those developing countries.
Japan ranked fourteenth among the 15 countries and ranked ninetieth among the
100 countries. These ranks illustrate that Japan is not currently in a position to have
the effective or influential position among these countries, be it the selected 15 or
100, in terms of concluding IIAs. Japanʼs relatively small number of IIAs may be the
result of its policy prioritizing multilateral schemes, such as WTO agreements, rather
than concluding bilateral agreements such as IIAs and EPAs/FTAs, until in the early
2000s. It is possible that effectiveness of Japan may increase in due course though,
especially as the number of concluded IIAs is expected to increase following the
aforementioned policy to conclude more international investment-related agreements.
As for the United States, the data shows its weak effectiveness compared to the
248
自由論題
other 99 countries, while the same was also true among the selected 15 countries.
This is a result of the relatively small number of IIAs that the United States had
concluded compared with those countries which ranked highly. The United States has
only concluded a small number of IIAs since 1999 and is more inclined to conclude
EPAs/FTAs, which is assumed to be the main reasons of its low rank in this research.
7 Conclusion This research addressed which country/countries are likely to have “effective”
positioning by the IIAs, by using compiled data for total of 100 countries based on
the large number of IIAs that each country has concluded. The research results show
the following: Firstly, a country that has the most effective positioning among the 100
countries, thus in the world, is China. China has created the most effective positioning
with the conclusions of IIAs among the selected 100 countries, which may also imply
that China could be at the center of the rule making process of international
investment-related agreements in terms of IIAs. China may also be a country that
accumulate the rights and obligations relevant to foreign investment at the most
through MFN provisions, as MFN provisions enables to transfer the rights and
obligations of the agreements. As Chinese investors, including government funded
ones, are vigorously making overseas investments, having international related
agreements and gaining the feasibilities for protections of investors and investment as
well as liberalization and market access would positively work for their activities.
This also applies to overseas investments under Chinaʼs Belt and Road initiatives.
Secondly, though China positions itself effectively among the 100 countries, South
Korea positions itself effectively among the selected 15 countries, many of which are
developed countries. As developed countries, especially the United States and some
of the countries in Europe, led in developing new types of provisions that contribute
in protection and liberalization of investment, in general, it may be assumed that
South Korea has the benefit of being transmitted rights for its investors with more
sophisticated provisions.
There are also some possibilities for further studies based on this research. The
Effectiveness of International Investment Agreements
KEIO SFC JOURNAL Vol.20 No.2 2020
249
first would be a study that considers EPAs/FTAs and other regional and comprehensive
agreements. This research primarily covered IIAs and not EPAs/FTAs. However, as
there are also similarities between the obligations stated in EPAs/FTAs and those of
IIAs, similar analysis focusing on EPAs/FTAs, or the combinations of EPAs/FTAs/
IIAs, may also produce interesting results. This is especially so due to the fact that
many countries are currently inclined to conclude EPAs/FTAs that have provisions on
investment-related obligations. Comparing those may provide insights regarding other
aspects of international investment-related agreement, as well. The second potential
avenue for future research concerns the contents of the concluded IIAs. While this
research conducted a quantitative analysis on effectiveness under a definition set for
the purpose of this research, there are other ways to analyze the “effectiveness”. One
such way would be to analyze qualitatively, especially in terms of the top ranked
countries including China. Even though many of the elements in the investment-
related provisions may be similar to each other, each agreement could be unique.
While many of the previous research on the qualitative analysis on the agreements
were conducted separately, rather than looking at proliferation of the rights and
obligation through networks of countries, it may bring an interesting outcome if the
research would successfully be able to combine the qualitative analysis of the
provisions and the qualitative analysis on proliferations as this research did. Such
research would be relevant to examining the contents of agreements that China has
concluded and to find the implications to the rule making in the world regarding
foreign investment. Such endevour is also relevant to a question if individual
agreement or a group of individual agreements is contributing in creating an
environment for free trade. The third would be to examine the process of gaining
effectiveness. This research was based on the recent number of agreements. However,
as Figure 1 of this research shows, there are difference in the development, the pace
and the number of agreements, among the countries. For example, by conducting the
same analysis following the same procedure of this research for different times, such
as by 10 years range, it may give us the idea on how certain countries have developed
the effective positioning as well as the dynamics among the countries at certain times.
250
自由論題
Endnotes
1) United Nations Conference on Trade and Development (UNCTAD), <https://investmentpolicy.unctad.org/international-investment-agreements> accessed on September 10, 2020.
2) Negotiations on international investment-related agreement at the WTO are in stagnation primarily due to opposition from developing countries. As for the recent Doha Round, which started in 2001, it was already decided in 2003 that investment-related negotiations would not be discussed within the round.
3) Keidanren <http://www.keidanren.or.jp/en/policy/2015/119.html> accessed 18 June 2019.4) Trans-Pacific Partnership Agreement later changed to Comprehensive and Progressive
Agreement for Trans-Pacific Partnership (CPTPP). 5) For example, Japan Foreign Trade Council, Inc., an economic organization in Japan, issued
two requests for the facilitation for conclusion of Investment related Agreements on 18 June, 2016 (http://www.jftc.or.jp/proposals/2015/20160121_2.pdf), and June 25, 2018, (http://www.jftc.or.jp/proposals/2018/20180625_1.pdf, both in Japanese only, accessed 18 June 2019.
6) The Plan includes the following: “IV. Taking in Overseas Growing Markets (2) Specific measures to be newly taken i) Supporting overseas business expansion of Japanese companies ② Promoting Economic partnership negotiations, and conclusion/amendment of
investment-related agreements and tax treaties • In order to expand free and fair markets in Asia-Pacific region and across the world, the
Government will push forward to achieve entry into force of the TPP Agreement which Japan has concluded, and continue discussions on expansion of its member countries/regions. The Government will also promote negotiations on other economic partnerships strategically and expeditiously, including Japan-EU EPA, RCEP, and Japan-China-Republic of Korea FTA. Playing central roles in building such wide-area new economic order, Japan, as the standard-bearer of free trade, aim to take the lead in establishing comprehensive, balanced, and high-level global rules. The Government will implement cooperation with ASEAN to realize inclusive and innovative growth in Asian regions, and high-quality RCEP.
• Based on the ʼAction Plan for improvement of investment climate through promoting the conclusion of investment-related agreementsʼ (announced in May 2016), the Government will work on negotiations aiming to sign and/or achieve entry into force of investment-related agreements (investment agreements and economic partnership agreements with Investment Chapters) covering 100 countries/regions by 2020, while strengthening organization. Expecting to cover eighty-two countries/regions in total, including those that are currently under negotiation, the Government will aim to launch new negotiations with thirteen other countries by the end of this year through consultation with them.”
Prime Minister of Japan and His Cabinet, <http://www.kantei.go.jp/jp/singi/keizaisaisei/pdf/ miraitousi2017_inttv_prgrm.pdf> accessed 18 June 2019.
7) Urata, Shujiro (2015) “Impacts of FTAs and BITs on the Locational Choice of Foreign Direct Investment: The Case of Japanese Firms” RIETI Discussion Paper Series 15-E-066 <https://www.rieti.go.jp/jp/publications/dp/15e066.pdf> accessed 18 June 2019.
Effectiveness of International Investment Agreements
KEIO SFC JOURNAL Vol.20 No.2 2020
251
8) This research focused specifically on IIAs, excluding EPAs/FTAs and any other comprehensive regional agreements that contain investment-related agreements. This is because this research primarily addresses rules on investment, and therefore tries to exclude other influences related to some of the other aspects of EPAs/FTAs, which are more comprehensive agreements than IIAs, such as tariff reduction. As this research covers only IIAs of the respective countries, the result may be different if all investment-related agreements, namely the investment chapters of EPAs/FTAs and the regional agreements are covered. For example, the member countries of the European Union, such as Germany and France, have more investment-related agreements when regional agreements are covered. This also applies to other countries including Japan.
9) The definition of “investment” or what to consider “investment” is usually stated at the beginning of the respective investment-related agreement. There are also IIAs that include elements of promotion and liberalization, in addition to protection.
10) The primary obligations of each clause or provisions are basically the same for most IIAs. However, the detail could be different among agreements, as each is the result of negotiations by the participating states.
11) “Under the national treatment rule, Members must not accord discriminatory treatment between imports and “like” domestic products (with the exception of the imposition of tariffs, which is a border measure).” extracted from a report by Ministry of Economy, Trade and Industry, <https://www.meti.go.jp/english/report/downloadfiles/gCT0213e.pdf>, p227 accessed 18 June 2019.
12) “This provision prohibits a contracting party from imposing performance requirements that hinder the free investment activities of investors, such as export requirements, local procurement requirements and technology transfer requirements, as conditions for investment and business activities of the investor in the other contracting party.” extracted from METI, “2017 Report on Compliance by Major Trading Partners with Trade Agreements—WTO, EPA/FTA and IIA,” 792.
13) “It is an “absolute”, “non-contingent” standard of treatment, i.e. a standard that states the treatment to be accorded in terms whose exact meaning has to be determined, by reference to specific circumstances of application, as opposed to the “relative” standards embodied in “national treatment” and “most favoured nation” principles which define the required treatment by reference to the treatment accorded to other investment”. extracted from OECD working papers on international investment 2004/04 “Fair and Equitable Treatment Standard in International Investment Law” <https://www.oecd.org/daf/inv/investment-policy/WP-2004_3.pdf> accessed 22 June 2019.
14) METI explains the Umbrella Clause this way: “The host country has an obligation to fulfill the promises made by itself to the investors (for example, permits for infrastructure projects and resource development, granting investment incentives, contracts with investors, etc.). If the host country violates the commitment, the investor could use international arbitration claiming a breach of the investment treaty, in addition to the domestic trial based on the breach of the contract.” (Translated by the author). extracted from METI, <http://www.meti.go.jp/policy/trade_policy/epa/investment/cases.html> accessed 15 June, 2019.
15) WTO, <https://www.wto.org/english/thewto_e/whatis_e/tif_e/fact2_e.htm> accessed 15 June, 2019.
16) Ibid. 17) Ibid.
252
自由論題
18) There are treaties that are specifying the scope of application of MFN treatment to certain types of activities, especially by clarifying the nature of “treatment” under the IIA. There are treaties that excludes certain types of applications by stating in non-conforming measures.
19) WTO website states that MFN as the principle of trade without discrimination and foundation of the multilateral trading system. WTO, <https://www.wto.org/english/thewto_e/whatis_e/tif_e/fact2_e.htm> accessed August 5, 2020.
20) UNCTAD, <https://investmentpolicy.unctad.org/investment-dispute-settlement> accessed August 5, 2020.
21) Though there are agreements without MFN, most of the agreements include MFN, especially as it is one of the fundamental of WTO and GATT principles, in order to develop “free and fair” trade and investment environment. Also, for those agreements that do not have MFN Clause may include the clause when concluded States make revisions or renewed agreements. Thus, this research also does not distinguish between agreements with MFN Clause and those without it.
22) Under MFN, receiving the “transferred rights” by MFN gives benefits to foreign investors of Country A investing in the Country B, host country, which is the counterpart country of an IIA.
23) The authors also acknowledge that a country that receives certain rights under MFN Clause also gives the similar rights to the third country. This means that it may increase the possibility for the country to become a respondent of ISDS case, too, if there are relevant obligations in the agreements.
24) These 15 countries, as well as the 100 countries of this research, were selected based on their number of concluded EPAs/FTAs. Though this study is focused on IIAs only, it was more relevant to consider the number of EPAs/FTAs when choosing the countries, as some of the countries have no or only a few IIAs, but also have EPAs/FTAs that include investment chapters. Those countries also have certain presence in the world due to their EPA/FTA agreements.
25) Though this research focuses on IIAs, those 100 countries were selected based on their number of concluded IIAs and Free Trade Agreements (FTAs). This is due to an expected future research that considers FTAs. This, the selection process of those 100 countries in this paper, does not violate the purpose of this paper. In addition, the numbers used in this research were based on the numbers of IIAs.
26) Baldwin, Richard and Okubo, Toshihiro (2006) “Heterogenous Firms, Agglomeration and Economic Geography: Spatial Selection and Sorting”, Journal of Economic Geography, 6(3), p323.
27) These studies include Chowdhury (2011), Ghosh et al. (2003), Tabakis (2014), Barbalet et al. (2015), and Vanegas and Baena (2019).
28) As the numbers on the horizontal line are the attributed numbers of the respective countries of those 15 countries, there is no correlation regarding the numbers on the horizontal line.
29) China may also be the first in the world. This assumption is based on the fact that other countries outside the 100 countries listed here have a limited number of IIAs and are not likely to affect the result of the research. There are a few countries that do not have any IIAs.
Effectiveness of International Investment Agreements
KEIO SFC JOURNAL Vol.20 No.2 2020
253
References
Ahn, D. (2016) The Legal and Economic Analysis of the WTO/FTA System, World Scientific Publishing.
Baldwin, R. and Okubo, T. (2005) “Heterogeneous firms, agglomeration and economic geography: Spatial selection and sorting”, NBER Working Paper, No. 11650, https://www.nber.org/papers/w11650.pdf (Accessed 15 August, 2020)
Baldwin, R. and Okubo, T. (2006) “Heterogenous Firms, Agglomeration and Economic Geography: Spatial Selection and Sorting”, Journal of Economic Geography. 6(3), pp. 323-346.
Barbalet, F., Greenville, J., Crook, W., Gretton, P. and Breunig, R. (2015) “Exploring the Links between Bilateral and Regional Trade Agreements and Merchandise Trade”, Asia & the Pacific Policy Studies. 2(3), pp. 467-484.
Barton, J. H. et al. (2006) The Evolution of the Trade Regime, Princeton University Press.Basu Das, S. (2013) “Moving ASEAN +1 FTAs towards an Effective RCEP” ISEAS Perspective
No. 29. Singapore: Institute of Southeast Asian Studies.Basu Das, S. and Jagtiani, R. B. (2014) “The Regional Comprehensive Economic Partnership: New
Paradigm or Old Wine in a New Bottle?”, ISEAS Economics Working Paper No.2014-3.Baumgartner, J. (2016) Treaty Shopping in International Investment Law, Oxford University
Press.Bhagwati, J. and Hudec, R. eds.(1996) Fair Trade and Harmonization Vol.2, The MIT Press.Chowdhury, S. (2011) “The Discriminatory Nature of Specific Tariffs”, The World Bank
Economic Review. 26(1), pp. 147-163.Correa, C. M. (2004), “Investment Protection in Bilateral and Free Trade Agreements:
Implications for the Granting of Compulsory Licenses”, Michigan Journal of International Law. 26(1), pp. 331-353. https://repository.law.umich.edu/cgi/viewcontent.cgi?article= 1223&context=mjil
Felbermayr, G., Kimura, F., Okubo, T., Steininger, M. (2019) “Quantifying the EU-Japan Economic Partnership Agreement”, Journal of the Japanese and International Economies. 51, pp. 110-128.
Fukunaga, Y. and Isono, I. (2013) “Taking ASEAN+1 FTAs towards the RCEP: A Mapping Study”, ERIA Discussion Paper Series 2013-02. Jakarta: Economic Research Institute for ASEAN and East Asia.
Ghosh, M., Perroni, C., and Whalley, J. (2003) “Developing-Country Benefits from MFN Relative to Regional/Bilateral Trade Arrangements”, Review of International Economics. 11(4), pp. 712-728.
Hamanaka, S. (2014) Asian Free Trade Agreements and WTO Compatibility Goods, Services, Trade Facilitation and Economic Cooperation, World Scientific.
Hayakawa, K., Ito, T., and Kimura, F. (2016) “Trade Creation Effects of Regional Trade Agreements: Tariff Reduction versus Non-tariff Barrier Removal”, Review of Development Economics. 20(1), pp. 317-326.
Heydon, K. and Woolcock, S. (2009) The rise of bilateralism: Comparing American, European and Asian approaches to preferential trade agreements, United Nations University Press.
Iino, T., Inoue, H., Saito, Y., Todo, Y. (2017) “Kigyo kan no kyodo kenkyu network ha innovation no shituteki performance wo kojo saseruka? (Does the Global Network of Research Collaboration Affect the Quality of Innovation?)” RIETI Discussion Paper Series 17-J-034, https://www.rieti.go.jp/jp/publications/dp/17j034.pdf (Accessed 15 August, 2020)
Iino, T., Inoue, H., Saito, Y., Todo, Y. (2018) “How Does the Global Network of Research
254
自由論題
Collaboration Affect the Quality of Innovation?” RIETI Discussion Paper Series 18-E-070, https://www.rieti.go.jp/jp/publications/dp/18e070.pdf (Accessed 15 August, 2020)
Kawai, M. and Ganeshan W. (Eds.) (2011) Asia’s Free Trade Agreements: How Is Business Responding?, Asian Development Bank and Asian Development Bank Institute, Edward Elgar.
Qureshi, A. H. (Eds.) (2002) Perspectives in International Economic Law, Kluwer Law International.
Tabakis, C. (2014) “Free-trade areas and special protection”, The Journal of International Trade & Economic Development. 24(8), pp. 1054-1076.
Ukai, T. and Kurita, O. (2003) “A Study on Distribution of Advantage of Position in Planar Region Associated with Traffic Network - Mesh Map of Advantage of Position Based on Tokyo Metropolitan Railway Network –”, City planning review. Special issue, Papers on city planning. 38(3), pp. 163-168.
Ukai, T. and Kurita, O. (2005) “Theory of Activity Distribution Based on Spatial Interaction and Its Generalization to Continuous Plane”, Architectural Institute of Japan, AIJ. (616), pp. 103-108.
Ukai, T. and Kurita, O. (2007) “A theory of geographical significance based on spatial interaction”, Journal of the City Planning Institute of Japan. 40(3), pp. 129-135.
Urata, S. (2015) “Impacts of FTAs and BITs on the Locational Choice of Foreign Direct Investment: The Case of Japanese Firms” RIETI Discussion Paper Series. 15-E-066, https://www.rieti.go.jp/jp/publications/dp/15e066.pdf (Accessed 18 June, 2019)
Vanegas, J., and Baena, J. (2019) “Virtual protectionism: Overview of MFN tariffs and bound tariffs in South America”, Journal of International Studies. 12(4), pp. 63-78.
Yasumoto, M. and Itohisa, M. (2013) “Investigating the Networks in the Process of Cross-Industrial Standardization: The Case of the EV (Electronic Vehicle) Standardization in Germany”, Manufacturing Management Research Center (MMRC) of Tokyo University Discussion Paper, http://merc.e.u-tokyo.ac.jp/mmrc/dp/pdf/MMRC441_2013.pdf (Accessed 15 August, 2020)
〔投稿日 2020. 3. 30〕 〔採録日 2020. 9. 24〕