Effectiveness of Collision Avoidance Technology
59
Effectiveness of Collision Avoidance Technology Jung-Hyup Kim, PhD ([email protected]) Department of Industrial & Mfg Systems Engineering E3437 Lafferre Hall University of Missouri Columbia, MO 65211 Tel: (573) 884-0354; Fax (573) 882-2693
Transcript of Effectiveness of Collision Avoidance Technology
Effectiveness of Collision Avoidance Technology
Jung-Hyup Kim, PhD ([email protected])
Department of Industrial & Mfg Systems Engineering
E3437 Lafferre Hall
University of Missouri
Columbia, MO 65211
Tel: (573) 884-0354; Fax (573) 882-2693
i
Table of Contents
List of Figures ........................................................................................................................... ii
List of Tables ............................................................................................................................ iii
Executive Summary .................................................................................................................. 1
1. Introduction ........................................................................................................................... 2
2. Market Research on the State of industry .......................................................................... 3
2.1. Garmin NuviCam LMTHD ................................................................................................ 3
2.2. Audiovox LDWS 100 ......................................................................................................... 4
2.3. Mobileye 560 .................................................................................................................... 4
2.4. Safe Drive System RD140 ................................................................................................ 5
3. Testing CAT Devices (Phase 1 Study) ................................................................................. 6
3.1. Participants ....................................................................................................................... 6
3.2. Testing Vehicle ................................................................................................................. 6
3.3. Test Driving Route and Procedure .................................................................................... 6
3.4. Equipment ........................................................................................................................ 8
3.5. Measure ......................................................................................................................... 11
3.5.1. Eye Gazing Points with area of Interest (AOI) ..................................................... 11
3.5.2. Electromyography (EMG) ................................................................................... 12
3.5.3. NASA-TLX Questionnaire ................................................................................... 12
3.5.4. Sensitivity analysis using Signal Detection theory (SDT) .................................... 13
3.5.5. Hierarchical Task Analysis (HTA) and Reaction Time ......................................... 17
4. Phase 1 Study Results ........................................................................................................ 17
4.1. Eye-tracking Data ............................................................................................................ 17
4.2. EMG Data ....................................................................................................................... 19
4.2.1. Comparison between baseline and warning events ............................................ 19
4.2.2. Comparison between FCW and LDW ................................................................. 20
4.3. NASA TLX Workload data .............................................................................................. 22
4.4. Performance analysis using SDT .................................................................................... 23
4.4.1. Effective warning rate (ER) Vs False warning rate (FR) ....................................... 24
4.4.2. False warning Rate Comparison between FCW and LDW .................................. 25
4.4.3. Sensitivity analysis between Mobileye and RD_140 ............................................ 25
ii
4.5. Reaction Time analysis ................................................................................................... 27
4.6. Hierarchical Task Analysis (HTA) Charts for Driving Behavior ........................................ 27
5. Mobileye Pilot Program (Phase 2) ...................................................................................... 31
5.1. Participants ..................................................................................................................... 31
5.2. Apparatus ....................................................................................................................... 32
5.3. Measure ......................................................................................................................... 33
5.3.1. Warning Report .................................................................................................. 33
5.3.2. Questionnaire ..................................................................................................... 33
5.3.1. User Acceptance Model ...................................................................................... 33
6. Phase 2 Study Results ........................................................................................................ 34
6.1. Warning Data analysis .................................................................................................... 34
6.2. Questionnaires ............................................................................................................... 36
6.3. User Acceptance Level ................................................................................................... 37
7. Discussion and Conclusion ............................................................................................... 38
7.1. Overview ........................................................................................................................ 38
7.2 Main Points ...................................................................................................................... 39
7.3. Limitations ...................................................................................................................... 39
7.4. Conclusion and Recommendations ................................................................................ 40
8. Future Collision Avoidance Technology ........................................................................... 41
9. References........................................................................................................................... 44
10. Appendixes ........................................................................................................................ 46
Appendix A: List of CAT Systems .......................................................................................... 46
Appendix B: Arm Posture during the Phase 1 experiment ..................................................... 47
Appendix C: NASA-TLX survey form ..................................................................................... 48
Appendix D: Survey Questions .............................................................................................. 49
iii
List of Figures
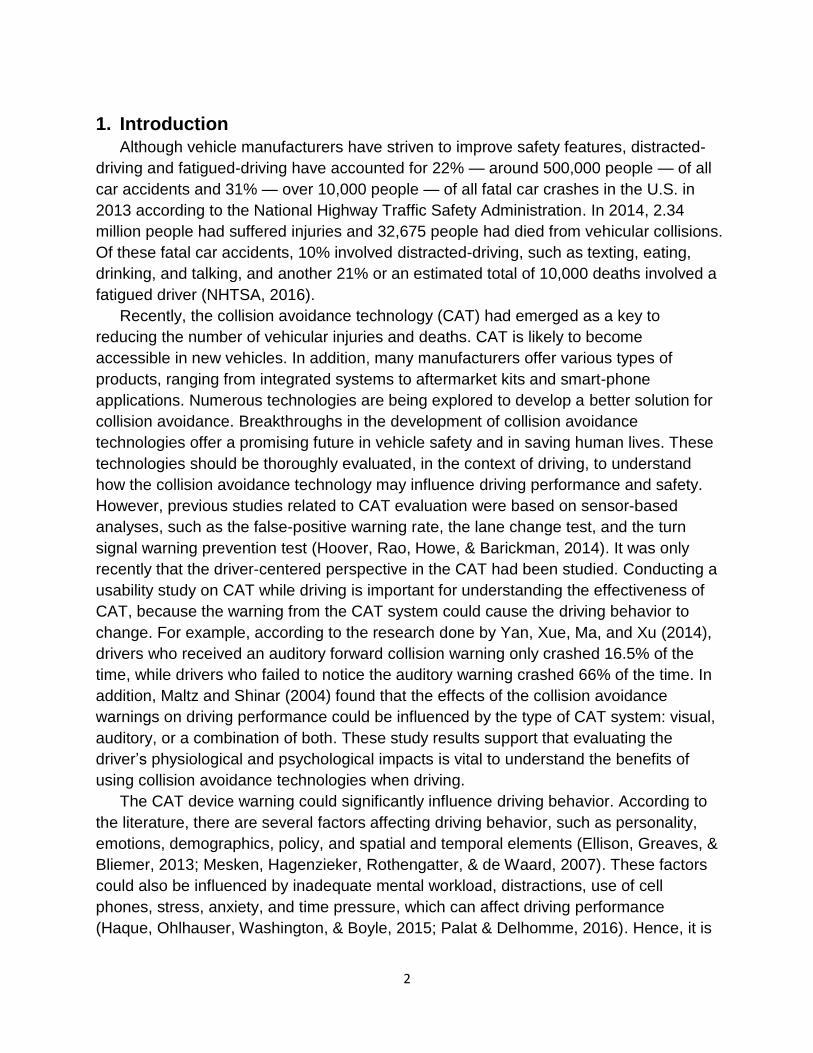
Figure 2.1 Garmin NuviCam Camera (left), Recording view (right) .............................................. 4
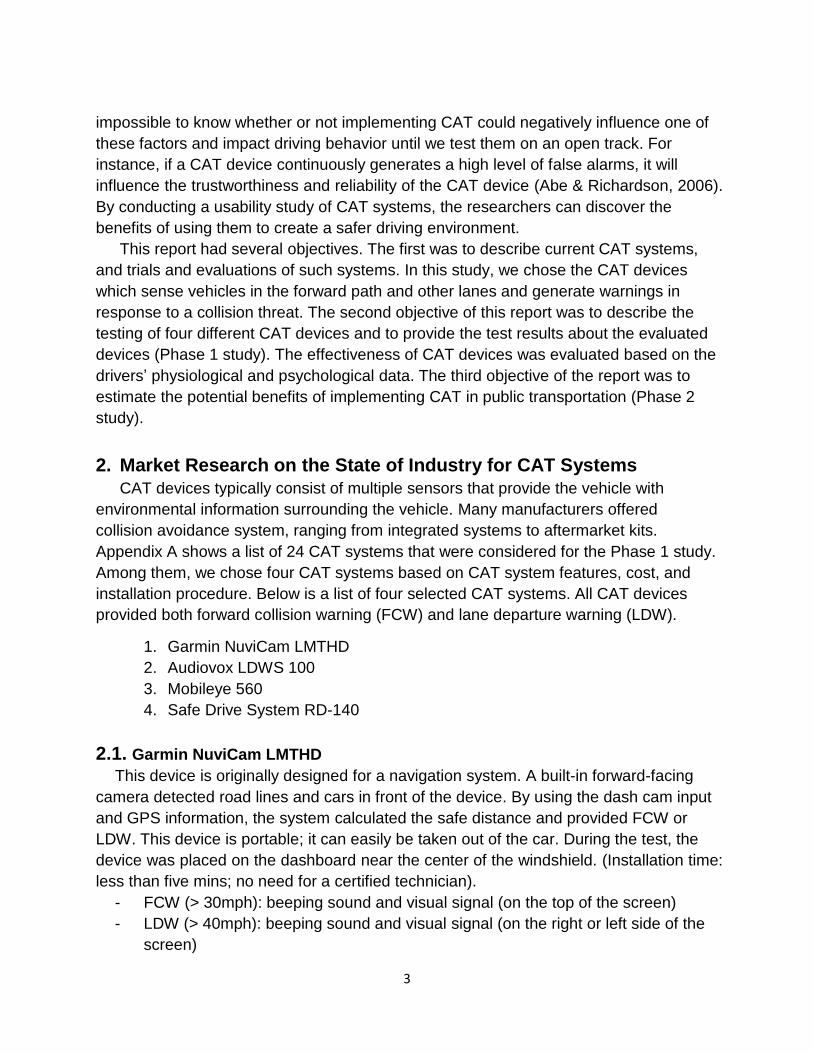
Figure 2.2 LDWS100 – Camera and Controller (left), Lane Tracking Road Scene (right) ............ 4
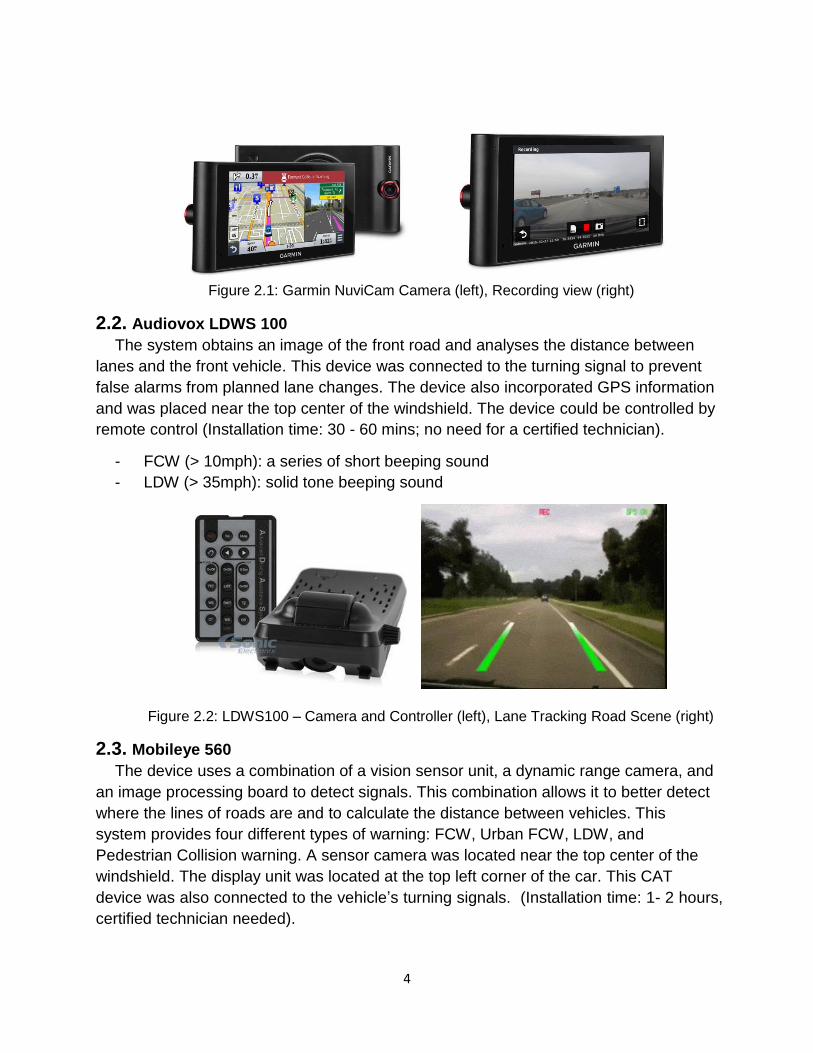
Figure 2.3 Mobileye 560 Camera (left), Overhead Windshield Mount View (right) ....................... 5
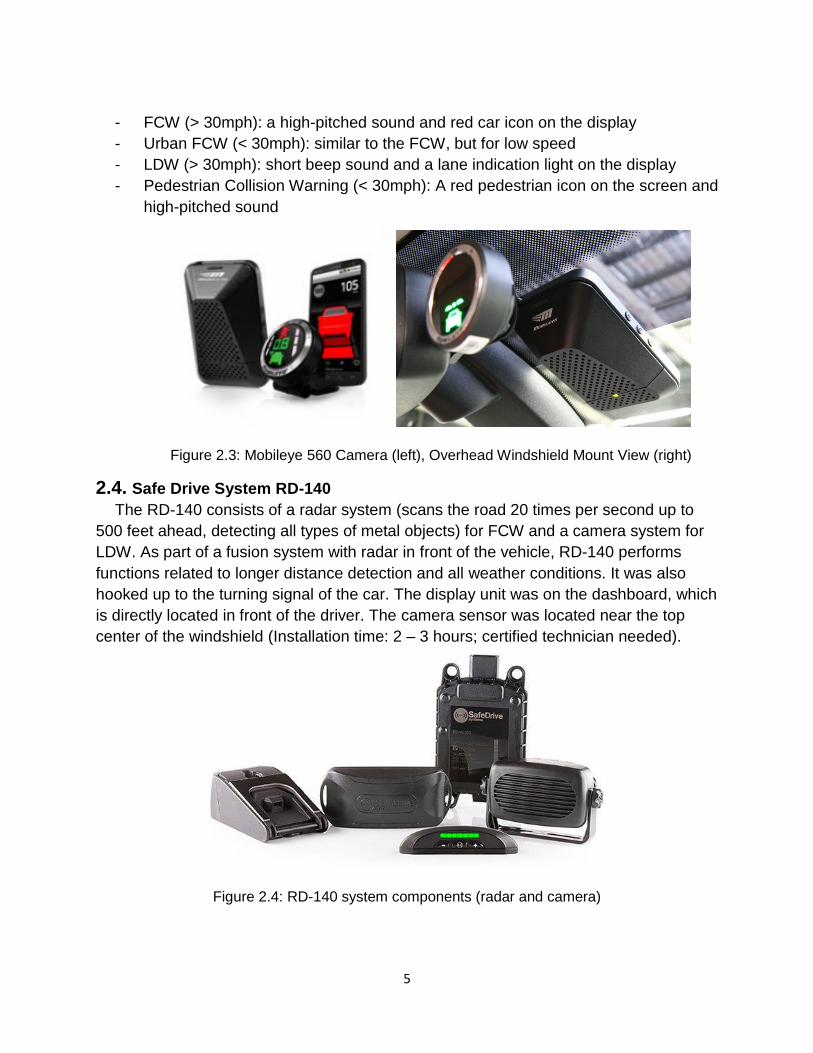
Figure 2.4 RD-140 system components (radar and camera) ...................................................... 5
Figure 3.1 CAT Fleet Vehicle – 2008 Chevy Malibu ................................................................... 6
Figure 3.2 Overview of Driving Path ........................................................................................... 7
Figure 3.3 Experimental Setup ................................................................................................... 8
Figure 3.4 EMG armband and Eye Tracking Glasses ................................................................. 9
Figure 3.5 360-degree Camera: (a) front, (b) right, (c) left, (d) rear view .................................. 10
Figure 3.6 Screenshots from the Recorded Videos .................................................................. 10
Figure 3.7 A screenshot of Areas of Interest (AOI) Map ........................................................... 11
Figure 3.8 EMG Data Outcome ................................................................................................ 12
Figure 4.1 Interval Plots for AOI results of the Front view and the Unknown area .................... 18
Figure 4.2 EMG Comparisons between baseline (Trial 1) and Warnings (Trial 2, 3,&4) ............ 20
Figure 4.3 Interval Plots for EMG results .................................................................................. 21
Figure 4.4 NASA-TLX Perceived Workload Average ................................................................ 22
Figure 4.5 NASA-TLX Comparisons between Six Ratings ....................................................... 23
Figure 4.6 ER and FR Mean Comparisons between Garmin, Mobileye, and RD-140 ................ 24
Figure 4.7 Receiver Operating Characteristic (ROC) Curves for RD-140 and Mobileye ........... 26
Figure 4.8 Plan 0 – Overall HTA Chart for Driving Behavior ..................................................... 28
Figure 4.9 Plan 1 – HTA for Collecting Information from the Driving Environments .................. 29
Figure 4.10 Plan 2 – HTA for Evaluating the Gathered Information .......................................... 30
Figure 4.11 Plan 3 – HTA for Executing the Motor System ....................................................... 30
Figure 5.1 Phase 2 Study Vehicle ............................................................................................ 32
Figure 5.2 Phase 2 Mobileye Pilot Test Setup .......................................................................... 32
Figure 6.1 Tendency of warning number during the Mobileye Pilot Program ............................ 35
Figure 8.1: Driver Assistance features ...................................................................................... 41
iv
List of Tables
Table 3.1 NASA-TLX Rating Scale Description ........................................................................ 13
Table 3.2 Four Possible Responses to the CAT Warning ......................................................... 14
Table 3.3 Examples of Behavior Modification Caused by CAT Warning ................................... 15
Table 4.1 Descriptive Statistic Results of Eye tracking data ..................................................... 19
Table 4.2 Descriptive Statistic Results of Baseline and Warning events ................................... 20
Table 4.3 Descriptive Statistic Results of FCW and LDW ......................................................... 21
Table 4.4 Descriptive Statistic Results of NASA-TLX ............................................................... 22
Table 4.5 Descriptive Statistic Results of NASA-TLX Six Ratings ............................................ 23
Table 4.6 Descriptive Statistic Result of FR .............................................................................. 25
Table 4.7 Sensitivity and Bias Comparisons between Mobileye and RD-140 ............................ 25
Table 4.8 Reaction Time Comparisons between RD-140 and Mobileye ................................... 27
Table 6.1 Comparison of Normalized Weekly Warning ............................................................ 34
Table 6.2 Number of LDW in different mode ............................................................................ 36
Table 6.3 Number of FCW in different mode ............................................................................ 36
Table 6.4 Phase 2 Survey Results ........................................................................................... 37
Table 6.5 Acceptance Level (Scale 0 – 100%) .......................................................................... 37
1
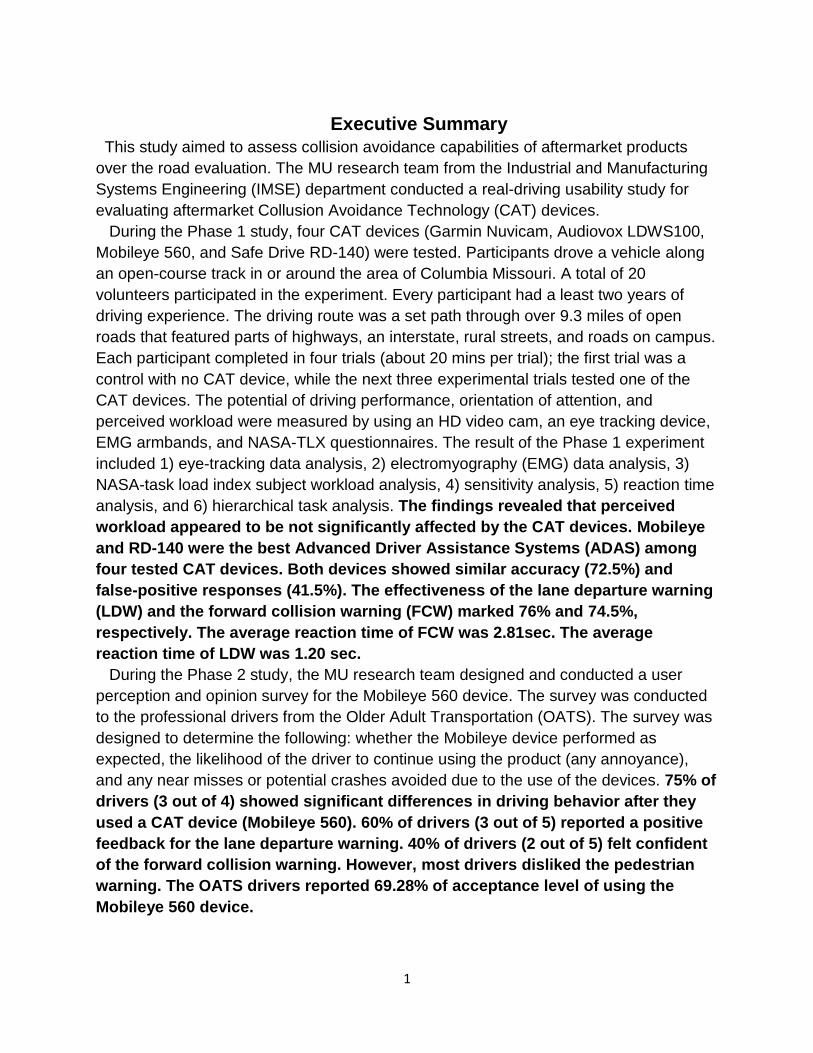
Executive Summary
This study aimed to assess collision avoidance capabilities of aftermarket products
over the road evaluation. The MU research team from the Industrial and Manufacturing
Systems Engineering (IMSE) department conducted a real-driving usability study for
evaluating aftermarket Collusion Avoidance Technology (CAT) devices.
During the Phase 1 study, four CAT devices (Garmin Nuvicam, Audiovox LDWS100,
Mobileye 560, and Safe Drive RD-140) were tested. Participants drove a vehicle along
an open-course track in or around the area of Columbia Missouri. A total of 20
volunteers participated in the experiment. Every participant had a least two years of
driving experience. The driving route was a set path through over 9.3 miles of open
roads that featured parts of highways, an interstate, rural streets, and roads on campus.
Each participant completed in four trials (about 20 mins per trial); the first trial was a
control with no CAT device, while the next three experimental trials tested one of the
CAT devices. The potential of driving performance, orientation of attention, and
perceived workload were measured by using an HD video cam, an eye tracking device,
EMG armbands, and NASA-TLX questionnaires. The result of the Phase 1 experiment
included 1) eye-tracking data analysis, 2) electromyography (EMG) data analysis, 3)
NASA-task load index subject workload analysis, 4) sensitivity analysis, 5) reaction time
analysis, and 6) hierarchical task analysis. The findings revealed that perceived
workload appeared to be not significantly affected by the CAT devices. Mobileye
and RD-140 were the best Advanced Driver Assistance Systems (ADAS) among
four tested CAT devices. Both devices showed similar accuracy (72.5%) and
false-positive responses (41.5%). The effectiveness of the lane departure warning
(LDW) and the forward collision warning (FCW) marked 76% and 74.5%,
respectively. The average reaction time of FCW was 2.81sec. The average
reaction time of LDW was 1.20 sec.
During the Phase 2 study, the MU research team designed and conducted a user
perception and opinion survey for the Mobileye 560 device. The survey was conducted
to the professional drivers from the Older Adult Transportation (OATS). The survey was
designed to determine the following: whether the Mobileye device performed as
expected, the likelihood of the driver to continue using the product (any annoyance),
and any near misses or potential crashes avoided due to the use of the devices. 75% of
drivers (3 out of 4) showed significant differences in driving behavior after they
used a CAT device (Mobileye 560). 60% of drivers (3 out of 5) reported a positive
feedback for the lane departure warning. 40% of drivers (2 out of 5) felt confident
of the forward collision warning. However, most drivers disliked the pedestrian
warning. The OATS drivers reported 69.28% of acceptance level of using the
Mobileye 560 device.
2
1. Introduction
Although vehicle manufacturers have striven to improve safety features, distracted-
driving and fatigued-driving have accounted for 22% — around 500,000 people — of all
car accidents and 31% — over 10,000 people — of all fatal car crashes in the U.S. in
2013 according to the National Highway Traffic Safety Administration. In 2014, 2.34
million people had suffered injuries and 32,675 people had died from vehicular collisions.
Of these fatal car accidents, 10% involved distracted-driving, such as texting, eating,
drinking, and talking, and another 21% or an estimated total of 10,000 deaths involved a
fatigued driver (NHTSA, 2016).
Recently, the collision avoidance technology (CAT) had emerged as a key to
reducing the number of vehicular injuries and deaths. CAT is likely to become
accessible in new vehicles. In addition, many manufacturers offer various types of
products, ranging from integrated systems to aftermarket kits and smart-phone
applications. Numerous technologies are being explored to develop a better solution for
collision avoidance. Breakthroughs in the development of collision avoidance
technologies offer a promising future in vehicle safety and in saving human lives. These
technologies should be thoroughly evaluated, in the context of driving, to understand
how the collision avoidance technology may influence driving performance and safety.
However, previous studies related to CAT evaluation were based on sensor-based
analyses, such as the false-positive warning rate, the lane change test, and the turn
signal warning prevention test (Hoover, Rao, Howe, & Barickman, 2014). It was only
recently that the driver-centered perspective in the CAT had been studied. Conducting a
usability study on CAT while driving is important for understanding the effectiveness of
CAT, because the warning from the CAT system could cause the driving behavior to
change. For example, according to the research done by Yan, Xue, Ma, and Xu (2014),
drivers who received an auditory forward collision warning only crashed 16.5% of the
time, while drivers who failed to notice the auditory warning crashed 66% of the time. In
addition, Maltz and Shinar (2004) found that the effects of the collision avoidance
warnings on driving performance could be influenced by the type of CAT system: visual,
auditory, or a combination of both. These study results support that evaluating the
driver’s physiological and psychological impacts is vital to understand the benefits of
using collision avoidance technologies when driving.
The CAT device warning could significantly influence driving behavior. According to
the literature, there are several factors affecting driving behavior, such as personality,
emotions, demographics, policy, and spatial and temporal elements (Ellison, Greaves, &
Bliemer, 2013; Mesken, Hagenzieker, Rothengatter, & de Waard, 2007). These factors
could also be influenced by inadequate mental workload, distractions, use of cell
phones, stress, anxiety, and time pressure, which can affect driving performance
(Haque, Ohlhauser, Washington, & Boyle, 2015; Palat & Delhomme, 2016). Hence, it is
3
impossible to know whether or not implementing CAT could negatively influence one of
these factors and impact driving behavior until we test them on an open track. For
instance, if a CAT device continuously generates a high level of false alarms, it will
influence the trustworthiness and reliability of the CAT device (Abe & Richardson, 2006).
By conducting a usability study of CAT systems, the researchers can discover the
benefits of using them to create a safer driving environment.
This report had several objectives. The first was to describe current CAT systems,
and trials and evaluations of such systems. In this study, we chose the CAT devices
which sense vehicles in the forward path and other lanes and generate warnings in
response to a collision threat. The second objective of this report was to describe the
testing of four different CAT devices and to provide the test results about the evaluated
devices (Phase 1 study). The effectiveness of CAT devices was evaluated based on the
drivers’ physiological and psychological data. The third objective of the report was to
estimate the potential benefits of implementing CAT in public transportation (Phase 2
study).
2. Market Research on the State of Industry for CAT Systems
CAT devices typically consist of multiple sensors that provide the vehicle with
environmental information surrounding the vehicle. Many manufacturers offered
collision avoidance system, ranging from integrated systems to aftermarket kits.
Appendix A shows a list of 24 CAT systems that were considered for the Phase 1 study.
Among them, we chose four CAT systems based on CAT system features, cost, and
installation procedure. Below is a list of four selected CAT systems. All CAT devices
provided both forward collision warning (FCW) and lane departure warning (LDW).
1. Garmin NuviCam LMTHD
2. Audiovox LDWS 100
3. Mobileye 560
4. Safe Drive System RD-140
2.1. Garmin NuviCam LMTHD
This device is originally designed for a navigation system. A built-in forward-facing
camera detected road lines and cars in front of the device. By using the dash cam input
and GPS information, the system calculated the safe distance and provided FCW or
LDW. This device is portable; it can easily be taken out of the car. During the test, the
device was placed on the dashboard near the center of the windshield. (Installation time:
less than five mins; no need for a certified technician).
- FCW (> 30mph): beeping sound and visual signal (on the top of the screen)
- LDW (> 40mph): beeping sound and visual signal (on the right or left side of the
screen)
4
Figure 2.1: Garmin NuviCam Camera (left), Recording view (right)
2.2. Audiovox LDWS 100
The system obtains an image of the front road and analyses the distance between
lanes and the front vehicle. This device was connected to the turning signal to prevent
false alarms from planned lane changes. The device also incorporated GPS information
and was placed near the top center of the windshield. The device could be controlled by
remote control (Installation time: 30 - 60 mins; no need for a certified technician).
- FCW (> 10mph): a series of short beeping sound
- LDW (> 35mph): solid tone beeping sound
Figure 2.2: LDWS100 – Camera and Controller (left), Lane Tracking Road Scene (right)
2.3. Mobileye 560
The device uses a combination of a vision sensor unit, a dynamic range camera, and
an image processing board to detect signals. This combination allows it to better detect
where the lines of roads are and to calculate the distance between vehicles. This
system provides four different types of warning: FCW, Urban FCW, LDW, and
Pedestrian Collision warning. A sensor camera was located near the top center of the
windshield. The display unit was located at the top left corner of the car. This CAT
device was also connected to the vehicle’s turning signals. (Installation time: 1- 2 hours,
certified technician needed).
5
- FCW (> 30mph): a high-pitched sound and red car icon on the display
- Urban FCW (< 30mph): similar to the FCW, but for low speed
- LDW (> 30mph): short beep sound and a lane indication light on the display
- Pedestrian Collision Warning (< 30mph): A red pedestrian icon on the screen and
high-pitched sound
Figure 2.3: Mobileye 560 Camera (left), Overhead Windshield Mount View (right)
2.4. Safe Drive System RD-140
The RD-140 consists of a radar system (scans the road 20 times per second up to
500 feet ahead, detecting all types of metal objects) for FCW and a camera system for
LDW. As part of a fusion system with radar in front of the vehicle, RD-140 performs
functions related to longer distance detection and all weather conditions. It was also
hooked up to the turning signal of the car. The display unit was on the dashboard, which
is directly located in front of the driver. The camera sensor was located near the top
center of the windshield (Installation time: 2 – 3 hours; certified technician needed).
Figure 2.4: RD-140 system components (radar and camera)
6
- FCW (> 15mph): different levels of sound and visual warning ( proper distance:
display light – green, no alert sounds; unsafe distance: display light – orange, no
alert sounds; dangerous distance: display light – red, a loud and high beep
sounds; risk of collision: display light – flashing and, rapid beeps)
- LDW (> 37mph): generate audio (a series of high-pitched beeping sound) and
visual (flashing white sign on the display) alerts
3. Testing CAT Devices (Phase 1 Study)
3.1. Participant
Twenty students from the University of Missouri – Columbia participated in the
phase 1 study. Every participant was male. The average age was 20.52 (StDev: 1.47),
and the participants had at least two years of driving experience. They could not wear
glasses during the study, so their normal or corrected visual acuity had to be at least
20/50. Compensation was $37.50 for approximately 2.5 hours of participation in the
study.
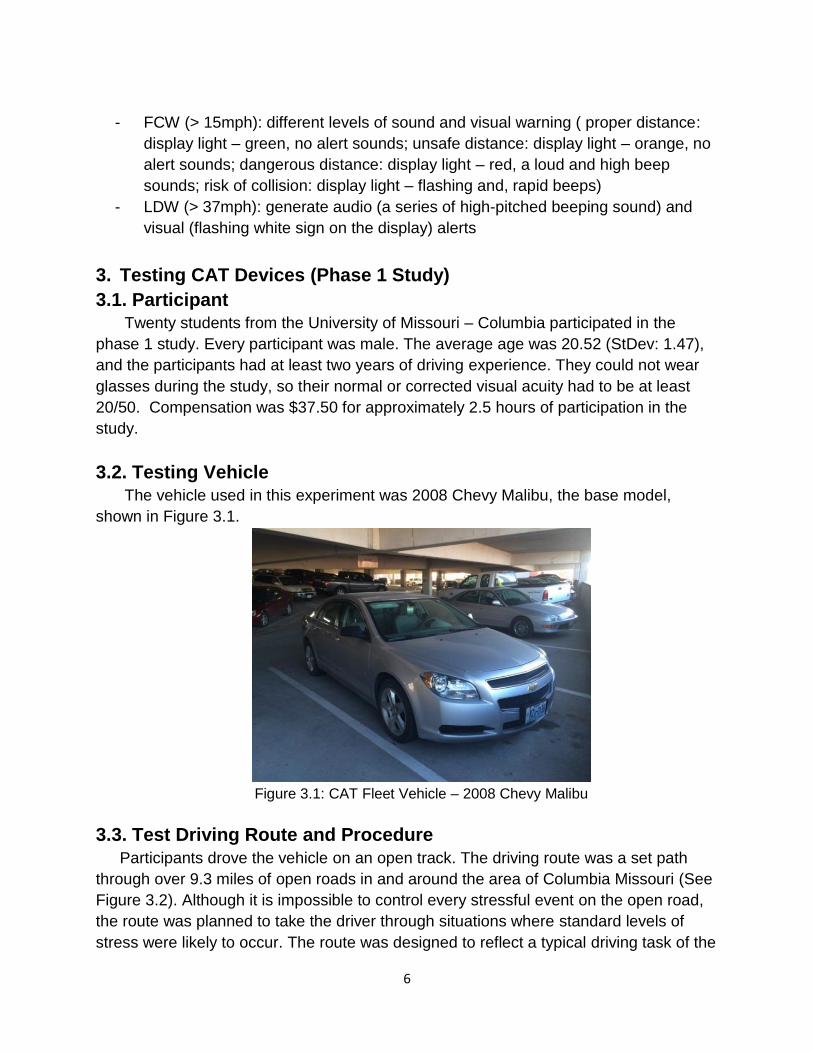
3.2. Testing Vehicle
The vehicle used in this experiment was 2008 Chevy Malibu, the base model,
shown in Figure 3.1.
Figure 3.1: CAT Fleet Vehicle – 2008 Chevy Malibu
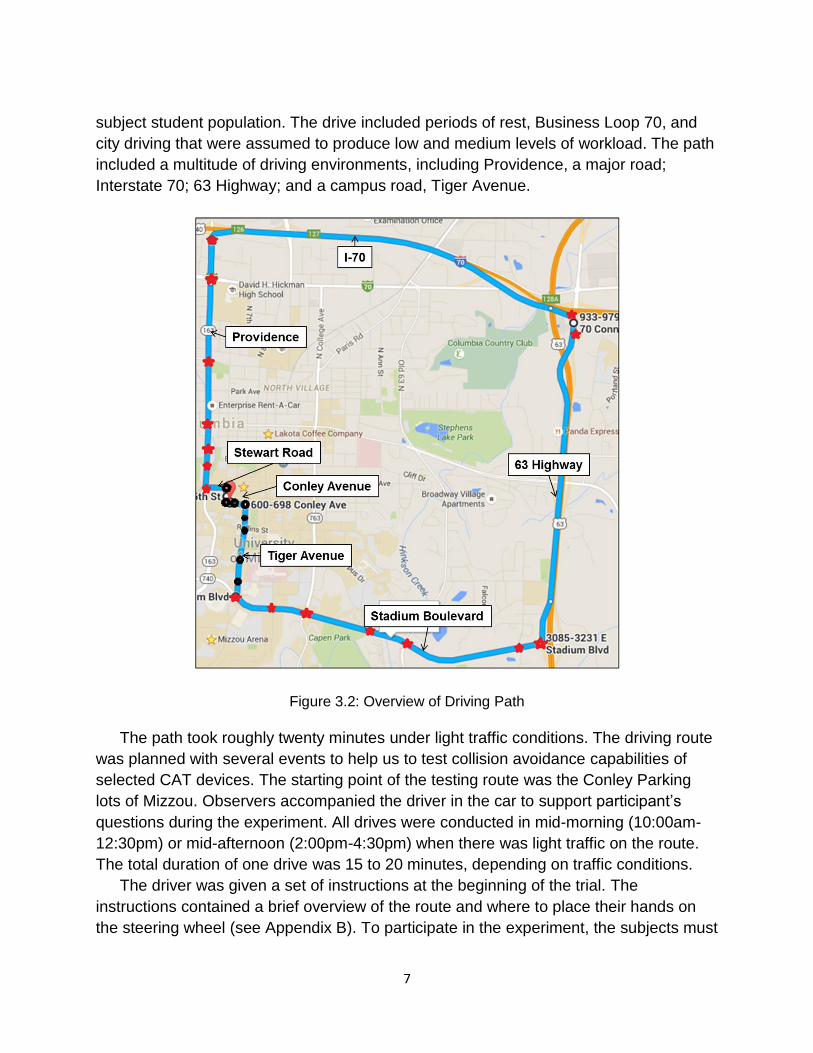
3.3. Test Driving Route and Procedure
Participants drove the vehicle on an open track. The driving route was a set path
through over 9.3 miles of open roads in and around the area of Columbia Missouri (See
Figure 3.2). Although it is impossible to control every stressful event on the open road,
the route was planned to take the driver through situations where standard levels of
stress were likely to occur. The route was designed to reflect a typical driving task of the
7
subject student population. The drive included periods of rest, Business Loop 70, and
city driving that were assumed to produce low and medium levels of workload. The path
included a multitude of driving environments, including Providence, a major road;
Interstate 70; 63 Highway; and a campus road, Tiger Avenue.
Figure 3.2: Overview of Driving Path
The path took roughly twenty minutes under light traffic conditions. The driving route
was planned with several events to help us to test collision avoidance capabilities of
selected CAT devices. The starting point of the testing route was the Conley Parking
lots of Mizzou. Observers accompanied the driver in the car to support participant’s
questions during the experiment. All drives were conducted in mid-morning (10:00am-
12:30pm) or mid-afternoon (2:00pm-4:30pm) when there was light traffic on the route.
The total duration of one drive was 15 to 20 minutes, depending on traffic conditions.
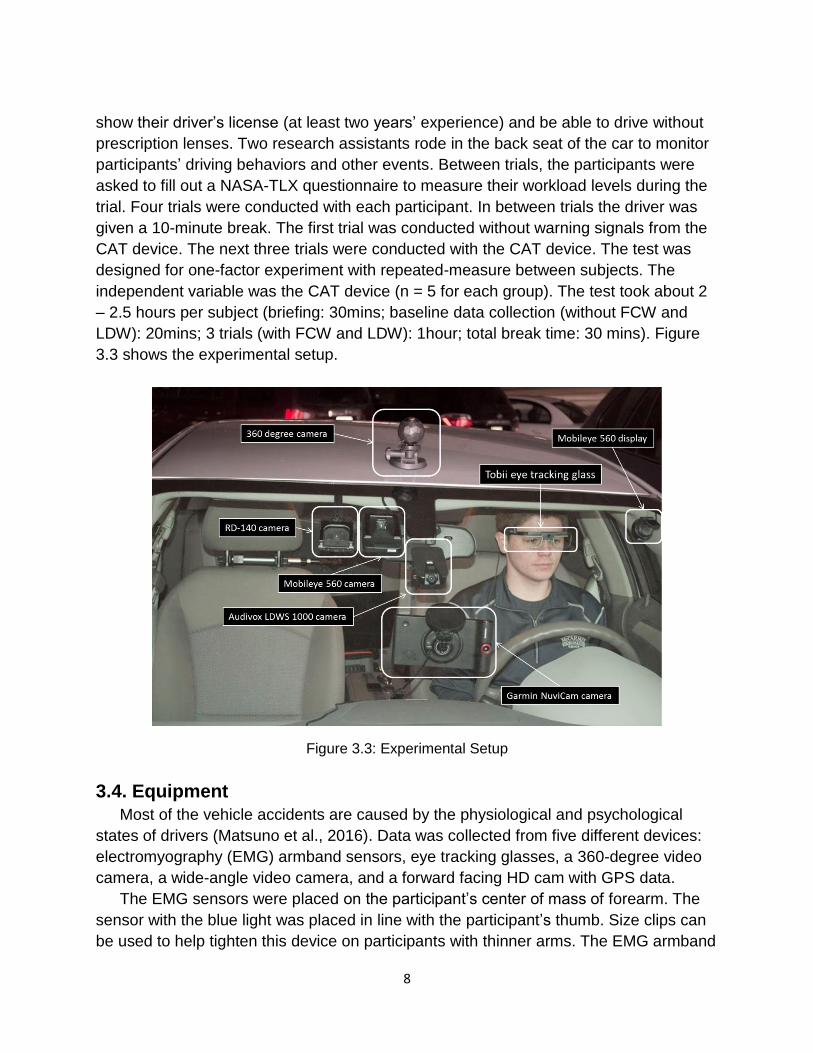
The driver was given a set of instructions at the beginning of the trial. The
instructions contained a brief overview of the route and where to place their hands on
the steering wheel (see Appendix B). To participate in the experiment, the subjects must
8
show their driver’s license (at least two years’ experience) and be able to drive without
prescription lenses. Two research assistants rode in the back seat of the car to monitor
participants’ driving behaviors and other events. Between trials, the participants were
asked to fill out a NASA-TLX questionnaire to measure their workload levels during the
trial. Four trials were conducted with each participant. In between trials the driver was
given a 10-minute break. The first trial was conducted without warning signals from the
CAT device. The next three trials were conducted with the CAT device. The test was
designed for one-factor experiment with repeated-measure between subjects. The
independent variable was the CAT device (n = 5 for each group). The test took about 2
– 2.5 hours per subject (briefing: 30mins; baseline data collection (without FCW and
LDW): 20mins; 3 trials (with FCW and LDW): 1hour; total break time: 30 mins). Figure
3.3 shows the experimental setup.
Figure 3.3: Experimental Setup
3.4. Equipment
Most of the vehicle accidents are caused by the physiological and psychological
states of drivers (Matsuno et al., 2016). Data was collected from five different devices:
electromyography (EMG) armband sensors, eye tracking glasses, a 360-degree video
camera, a wide-angle video camera, and a forward facing HD cam with GPS data.
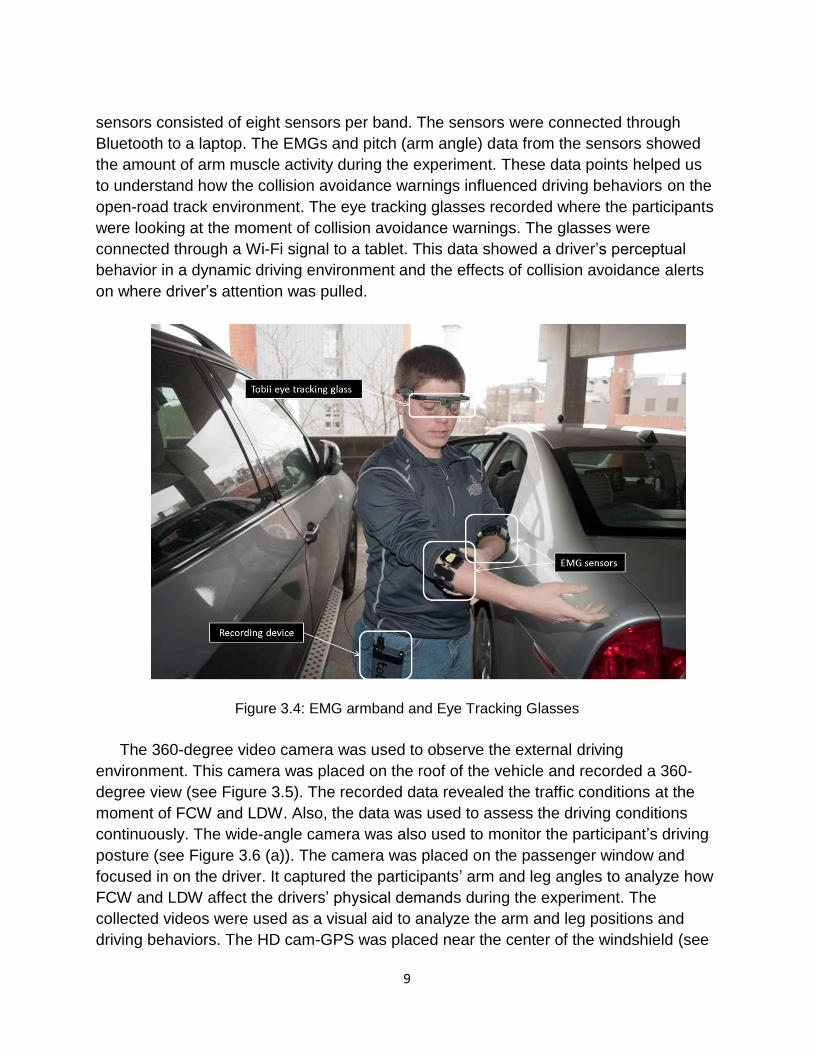
The EMG sensors were placed on the participant’s center of mass of forearm. The
sensor with the blue light was placed in line with the participant’s thumb. Size clips can
be used to help tighten this device on participants with thinner arms. The EMG armband
9
sensors consisted of eight sensors per band. The sensors were connected through
Bluetooth to a laptop. The EMGs and pitch (arm angle) data from the sensors showed
the amount of arm muscle activity during the experiment. These data points helped us
to understand how the collision avoidance warnings influenced driving behaviors on the
open-road track environment. The eye tracking glasses recorded where the participants
were looking at the moment of collision avoidance warnings. The glasses were
connected through a Wi-Fi signal to a tablet. This data showed a driver’s perceptual
behavior in a dynamic driving environment and the effects of collision avoidance alerts
on where driver’s attention was pulled.
Figure 3.4: EMG armband and Eye Tracking Glasses
The 360-degree video camera was used to observe the external driving
environment. This camera was placed on the roof of the vehicle and recorded a 360-
degree view (see Figure 3.5). The recorded data revealed the traffic conditions at the
moment of FCW and LDW. Also, the data was used to assess the driving conditions
continuously. The wide-angle camera was also used to monitor the participant’s driving
posture (see Figure 3.6 (a)). The camera was placed on the passenger window and
focused in on the driver. It captured the participants’ arm and leg angles to analyze how
FCW and LDW affect the drivers’ physical demands during the experiment. The
collected videos were used as a visual aid to analyze the arm and leg positions and
driving behaviors. The HD cam-GPS was placed near the center of the windshield (see
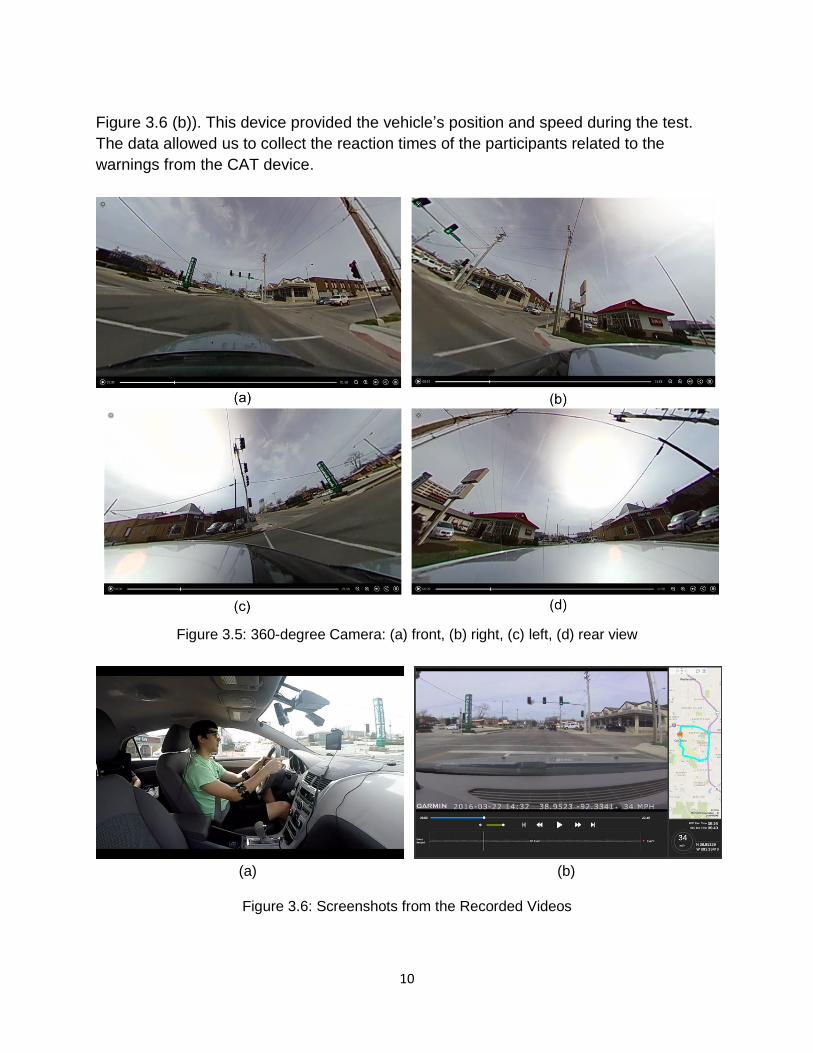
10
Figure 3.6 (b)). This device provided the vehicle’s position and speed during the test.
The data allowed us to collect the reaction times of the participants related to the
warnings from the CAT device.
Figure 3.5: 360-degree Camera: (a) front, (b) right, (c) left, (d) rear view
(a) (b)
Figure 3.6: Screenshots from the Recorded Videos
11
3.5. Measure
3.5.1. Eye Gazing Points with Areas of Interest (AOI)
Visual attention was captured with the Tobii glasses (see Figure 3.4). This is a
wearable eye-tracking unit that can be used in multiple research settings. The sampling
rate is 100 Hz. The device consists of an ultra-lightweight and unobtrusive head unit to
make sure that the participants feel comfortable and act naturally anywhere fitted with a
high-definition scene camera. The resolution of the camera is 1920×1080 at 25 fps. It
can track 82° horizontal and 48°vertical. The eye-tracking method is based on corneal
reflection and binocular and dark pupil tracking. The system comes with analysis
software to assess gaze locations and glance duration. The glasses recorded a series
of eye-gaze data of the driver’s visual attention within the driving environment. The
software calculated the allocation of attention to different areas of interests (AOI). In this
study, the driver’s visual attention related to each AOI was calculated and compared
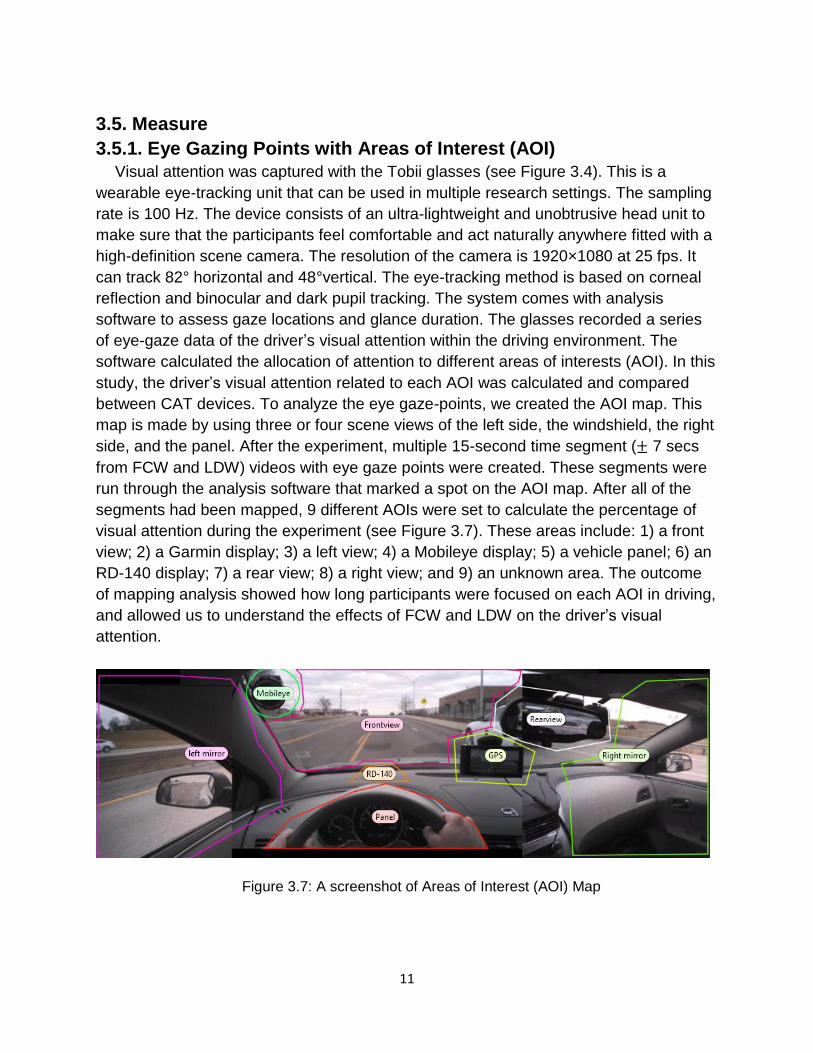
between CAT devices. To analyze the eye gaze-points, we created the AOI map. This
map is made by using three or four scene views of the left side, the windshield, the right
side, and the panel. After the experiment, multiple 15-second time segment (± 7 secs
from FCW and LDW) videos with eye gaze points were created. These segments were
run through the analysis software that marked a spot on the AOI map. After all of the
segments had been mapped, 9 different AOIs were set to calculate the percentage of
visual attention during the experiment (see Figure 3.7). These areas include: 1) a front
view; 2) a Garmin display; 3) a left view; 4) a Mobileye display; 5) a vehicle panel; 6) an
RD-140 display; 7) a rear view; 8) a right view; and 9) an unknown area. The outcome
of mapping analysis showed how long participants were focused on each AOI in driving,
and allowed us to understand the effects of FCW and LDW on the driver’s visual
attention.
Figure 3.7: A screenshot of Areas of Interest (AOI) Map

12
3.5.2. Electromyography (EMG)
Electromyography (EMG) measures muscle activity and quantifies force levels. Two
armbands recorded the changes in electrical potential around the muscle due to the
depolarization of the cell muscle during muscle contraction. During the experiment, the
EMG sensor was placed on both left and right forearm and used as an indicator of
mental stress (see Figure 3.4). Each device contained 8 separate EMG sensors and 3
accelerometers. The drivers’ muscle activity and posture of the forearm were collected
during the experiment. By analyzing the forearm movement and EMG signals, we were
able to find additional stress caused by FCW and LDW. Several studies support the
relationship between mental stress or fatigue and EMG activity of muscle (Bansevicius,
Westgaard, & Jensen, 1997; Brookhuis & de Waard, 2010; De Waard & Studiecentrum,
1996). For the data analysis, similar to the eye tracking analysis, we marked all time
segments of the FCW and LDW (± 7 secs from the warning). Then the average EMG
value of the warning segment was compared to its baseline. If this average is
significantly higher or lower than the baseline, then it indicates that the drivers
experienced the additional stress because of the warnings from the CAT devices.
Figure 3.8: EMG Data Outcome
3.5.3. NASA-TLX Questionnaire
The NASA-TLX (NASA Task Load Index) is a multidimensional subjective workload
rating technique. NASA TLX is commonly used to measure operators’ workload (Cao,
Chintamani, Pandya, & Ellis, 2009; Hancock, Williams, & Manning, 1995; Hart &
Staveland, 1988). This technique considers the magnitude of six possible load types:
mental demand, physical demand, and temporal demand, own performance, effort, and
frustration. It weighs the six types of load through a series of 15 combinations (close to
100 – high workload; close to 0 - low workload). The NASA-Task Load Index ratings
were collected after each trial. In order to obtain an overall workload estimate, a
weighting procedure (Hart & Staveland, 1988) was used to combine the six individual
13
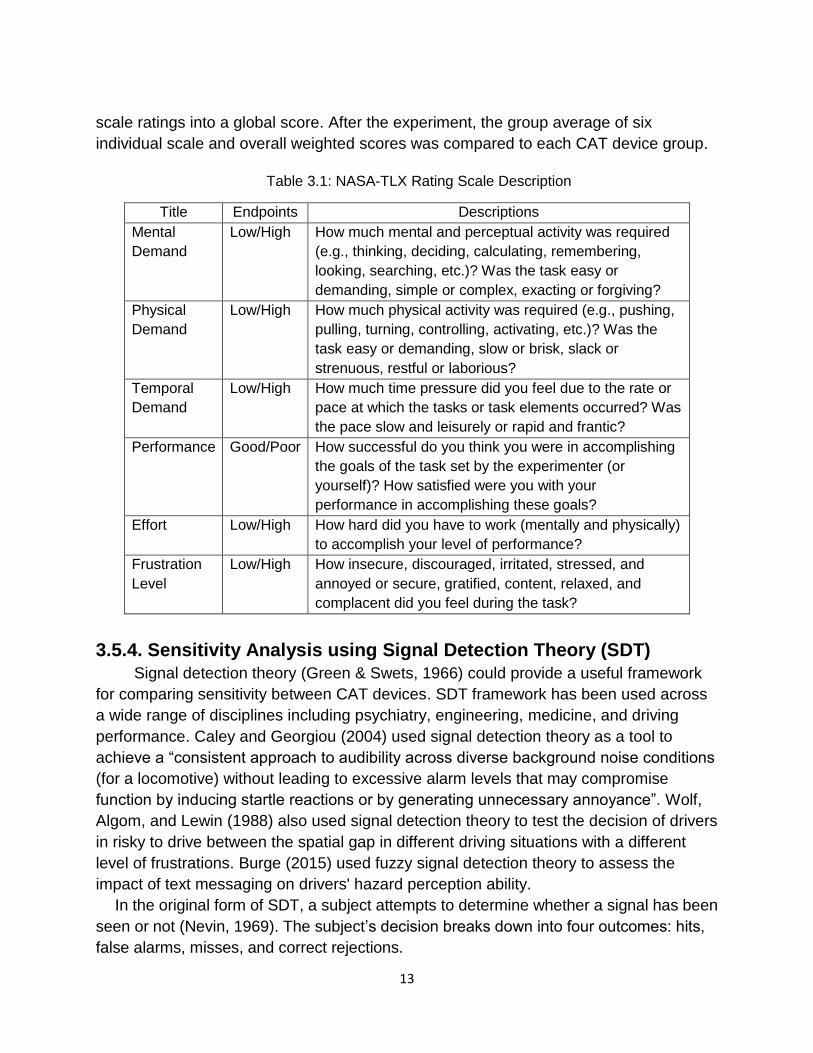
scale ratings into a global score. After the experiment, the group average of six
individual scale and overall weighted scores was compared to each CAT device group.
Table 3.1: NASA-TLX Rating Scale Description
Title Endpoints Descriptions
Mental
Demand
Low/High How much mental and perceptual activity was required
(e.g., thinking, deciding, calculating, remembering,
looking, searching, etc.)? Was the task easy or
demanding, simple or complex, exacting or forgiving?
Physical
Demand
Low/High How much physical activity was required (e.g., pushing,
pulling, turning, controlling, activating, etc.)? Was the
task easy or demanding, slow or brisk, slack or
strenuous, restful or laborious?
Temporal
Demand
Low/High How much time pressure did you feel due to the rate or
pace at which the tasks or task elements occurred? Was
the pace slow and leisurely or rapid and frantic?
Performance Good/Poor How successful do you think you were in accomplishing
the goals of the task set by the experimenter (or
yourself)? How satisfied were you with your
performance in accomplishing these goals?
Effort Low/High How hard did you have to work (mentally and physically)
to accomplish your level of performance?
Frustration
Level
Low/High How insecure, discouraged, irritated, stressed, and
annoyed or secure, gratified, content, relaxed, and
complacent did you feel during the task?
3.5.4. Sensitivity Analysis using Signal Detection Theory (SDT)
Signal detection theory (Green & Swets, 1966) could provide a useful framework
for comparing sensitivity between CAT devices. SDT framework has been used across
a wide range of disciplines including psychiatry, engineering, medicine, and driving
performance. Caley and Georgiou (2004) used signal detection theory as a tool to
achieve a “consistent approach to audibility across diverse background noise conditions
(for a locomotive) without leading to excessive alarm levels that may compromise
function by inducing startle reactions or by generating unnecessary annoyance”. Wolf,
Algom, and Lewin (1988) also used signal detection theory to test the decision of drivers
in risky to drive between the spatial gap in different driving situations with a different
level of frustrations. Burge (2015) used fuzzy signal detection theory to assess the
impact of text messaging on drivers' hazard perception ability.
In the original form of SDT, a subject attempts to determine whether a signal has been
seen or not (Nevin, 1969). The subject’s decision breaks down into four outcomes: hits,
false alarms, misses, and correct rejections.
14
To understand the driving behavior related to warning signals, the hazard perception
threshold of each driver should be analyzed. In this study, we used SDT framework as a
tool to compare the sensitivity of the different warning signals from a CAT device. d’ and
β of each CAT device was calculated by using the video data from 360-degree and The
HD cam-GPS cameras. The filmed footage of various traffic situations and their
responses of detecting potential traffic hazards were examined to determine whether a
warning signal has been responded or not. Although it was hard to understand the
underlying cognitive mechanism of driver’s decision-making process during the warning
response, the participant’s decision could break down into four outcomes: effective
warning (EW), false warning (FW), aware warning (AW), and ignored warning (IW).
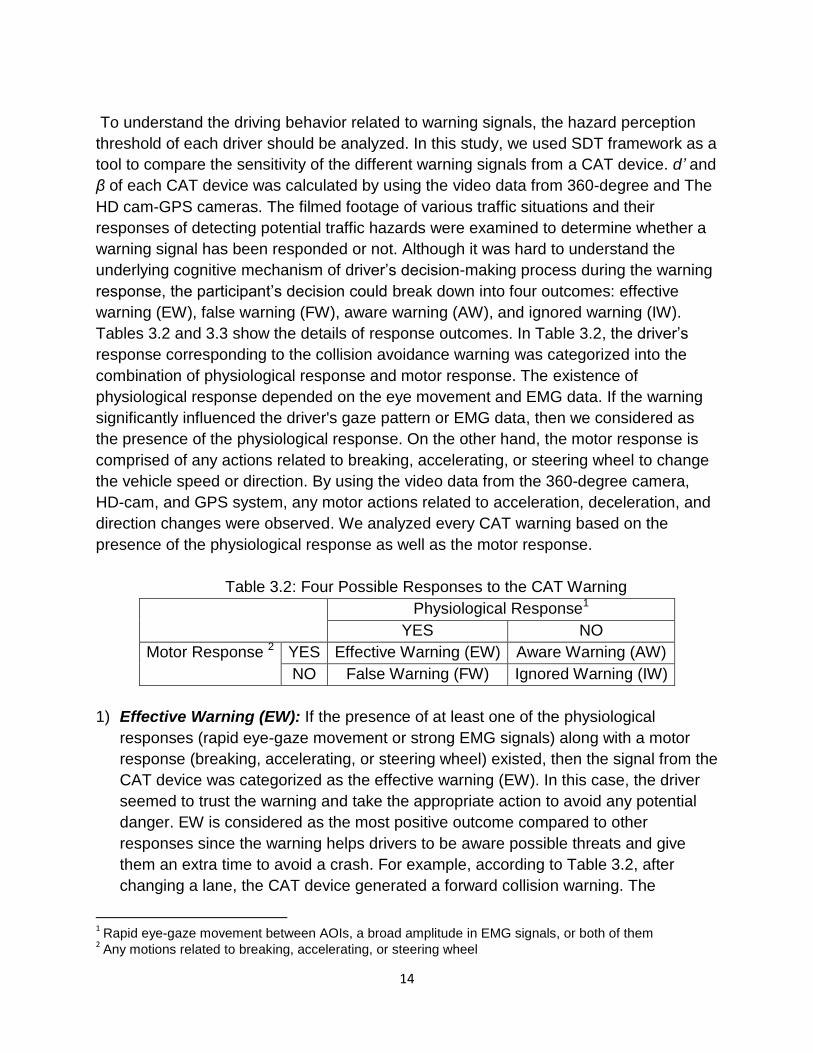
Tables 3.2 and 3.3 show the details of response outcomes. In Table 3.2, the driver’s
response corresponding to the collision avoidance warning was categorized into the
combination of physiological response and motor response. The existence of
physiological response depended on the eye movement and EMG data. If the warning
significantly influenced the driver's gaze pattern or EMG data, then we considered as
the presence of the physiological response. On the other hand, the motor response is
comprised of any actions related to breaking, accelerating, or steering wheel to change
the vehicle speed or direction. By using the video data from the 360-degree camera,
HD-cam, and GPS system, any motor actions related to acceleration, deceleration, and
direction changes were observed. We analyzed every CAT warning based on the
presence of the physiological response as well as the motor response.
Table 3.2: Four Possible Responses to the CAT Warning
Physiological Response1
YES NO
Motor Response 2 YES Effective Warning (EW) Aware Warning (AW)
NO False Warning (FW) Ignored Warning (IW)
1) Effective Warning (EW): If the presence of at least one of the physiological
responses (rapid eye-gaze movement or strong EMG signals) along with a motor
response (breaking, accelerating, or steering wheel) existed, then the signal from the
CAT device was categorized as the effective warning (EW). In this case, the driver
seemed to trust the warning and take the appropriate action to avoid any potential
danger. EW is considered as the most positive outcome compared to other
responses since the warning helps drivers to be aware possible threats and give
them an extra time to avoid a crash. For example, according to Table 3.2, after
changing a lane, the CAT device generated a forward collision warning. The
1 Rapid eye-gaze movement between AOIs, a broad amplitude in EMG signals, or both of them
2 Any motions related to breaking, accelerating, or steering wheel
15
participant responded to the warning by reducing the speed to avoid any collision.
Before the driver executed breaking motion, both eye-gaze and EMG signal
responses were detected.
2) Aware Warning (AW): If there was no physiological response and only a motor
response existed, then this signal was considered as an aware warning (AW). In this
case, drivers already detected the potential threats before the alarm occurred.
Although the warning signal did not provide any additional information to drivers, it
helped them to recheck their decisions regarding what kind of motor response
should be performed to minimize a vehicle collision. In the example below Table 3.3,
the driver reduced the vehicle speed when he heard a forward collision warning.
However, he kept looking at the front view, and there was no significant difference in
EMG signals between before and after the alarm.
3) False warning (FW): If there was no motor response about the warning (only
physiological response existed), then it was classified as false warning (FW). In this
case, the driver did not detect any potential hazards surrounding the vehicle after he
heard the alarm. For that reason, he did not make any motor response. This is one
of the negative outcomes, because FW may cause the sense of distrust. It could
impede appropriate compliance and response on warnings.
4) Ignored warning (IW): In this case, the driver ignored the warning (no physiological
and motor response). IW is considered as the most negative outcomes compared to
other responses, because it creates a visible or auditory annoyance to drivers. In the
example showed in Table 3.3, the driver completely ignored the warning after he
experienced a high rate of false warning during the trial.
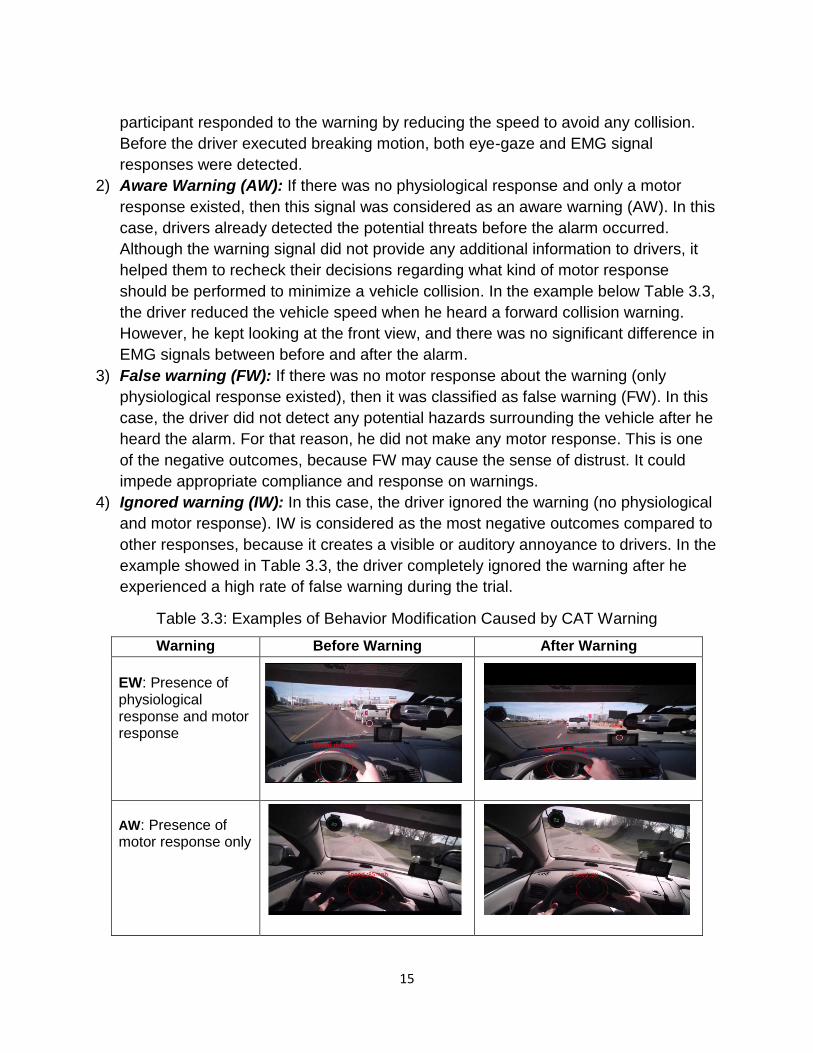
Table 3.3: Examples of Behavior Modification Caused by CAT Warning
Warning Before Warning After Warning
EW: Presence of physiological response and motor response
AW: Presence of motor response only
16
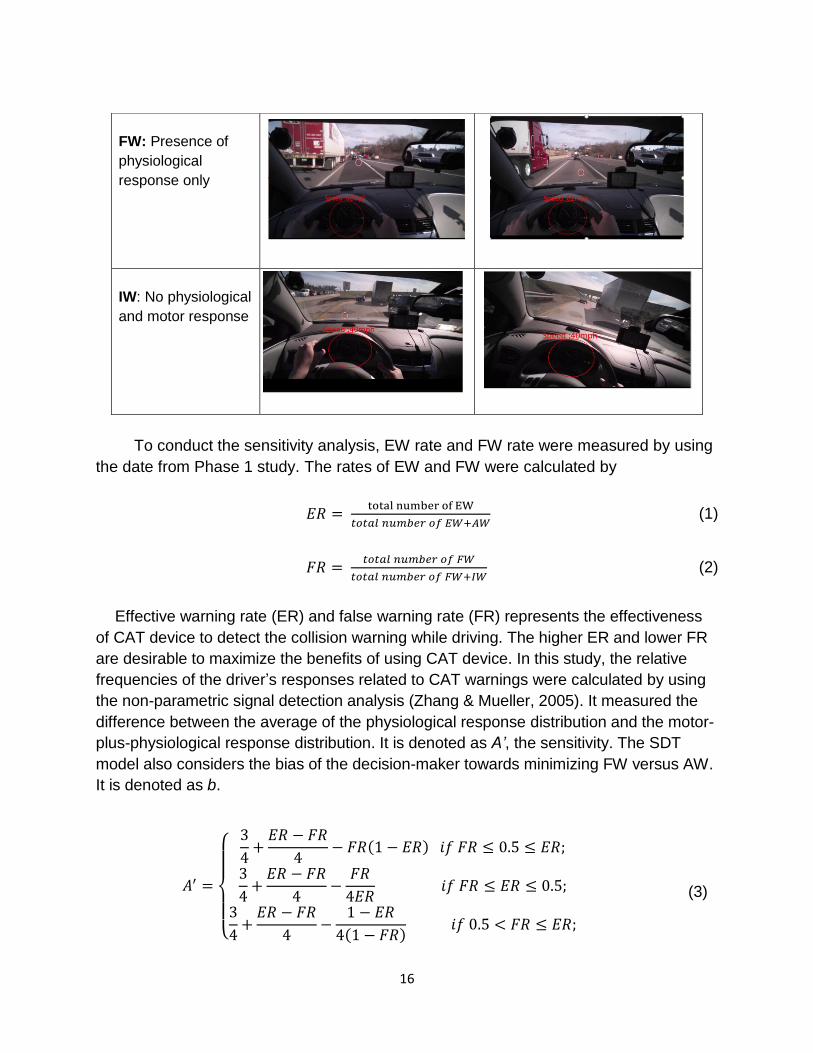
To conduct the sensitivity analysis, EW rate and FW rate were measured by using
the date from Phase 1 study. The rates of EW and FW were calculated by
𝐸𝑅 = total number of EW
𝑡𝑜𝑡𝑎𝑙 𝑛𝑢𝑚𝑏𝑒𝑟 𝑜𝑓 𝐸𝑊+𝐴𝑊 (1)
𝐹𝑅 = 𝑡𝑜𝑡𝑎𝑙 𝑛𝑢𝑚𝑏𝑒𝑟 𝑜𝑓 𝐹𝑊
𝑡𝑜𝑡𝑎𝑙 𝑛𝑢𝑚𝑏𝑒𝑟 𝑜𝑓 𝐹𝑊+𝐼𝑊 (2)
Effective warning rate (ER) and false warning rate (FR) represents the effectiveness
of CAT device to detect the collision warning while driving. The higher ER and lower FR
are desirable to maximize the benefits of using CAT device. In this study, the relative
frequencies of the driver’s responses related to CAT warnings were calculated by using
the non-parametric signal detection analysis (Zhang & Mueller, 2005). It measured the
difference between the average of the physiological response distribution and the motor-
plus-physiological response distribution. It is denoted as A’, the sensitivity. The SDT
model also considers the bias of the decision-maker towards minimizing FW versus AW.
It is denoted as b.
𝐴′ =
{
3
4+𝐸𝑅 − 𝐹𝑅
4− 𝐹𝑅(1 − 𝐸𝑅) 𝑖𝑓 𝐹𝑅 ≤ 0.5 ≤ 𝐸𝑅;
3
4+𝐸𝑅 − 𝐹𝑅
4−𝐹𝑅
4𝐸𝑅 𝑖𝑓 𝐹𝑅 ≤ 𝐸𝑅 ≤ 0.5;
3
4+𝐸𝑅 − 𝐹𝑅
4−
1 − 𝐸𝑅
4(1 − 𝐹𝑅) 𝑖𝑓 0.5 < 𝐹𝑅 ≤ 𝐸𝑅;
(3)
FW: Presence of
physiological
response only
IW: No physiological
and motor response

17
𝑏 =
{
5 − 4𝐸𝑅
1 + 4𝐹𝑅 𝑖𝑓 𝐹 ≤ 0.5 ≤ 𝐸𝑅;
𝐸𝑅2 + 𝐸𝑅
𝐸𝑅2 + 𝐹𝑅 𝑖𝑓 𝐹𝑅 ≤ 𝐸𝑅 ≤ 0.5;
(1 − 𝐹𝑅)2 + (1 − 𝐸𝑅)
(1 − 𝐹𝑅)2 + (1 − 𝐹𝑅) 𝑖𝑓 0.5 < 𝐹𝑅 ≤ 𝐸𝑅;
(4)
3.5.5. Hierarchical Task Analysis (HTA) and Reaction Time
The MU research team used hierarchical task analysis (HTA) technique to analyze
the participants’ driving behaviors. HTA is one of the standard methods to break down
a human activity into a set of simple actions. The HTA technique is a central ergonomic
approach to evaluating tasks (Stanton, 2006). In this project, the observed activities
were decomposed into multi-level task elements. Each element had a measured time
associated with the certain motor response. The overall HTA chart across multiple
participants showed different driving behaviors based on their responses: effective
warning (EW), false warning (FW), aware warning (AW), and ignored warning (IW).
The team also conducted the reaction time analysis. According to the research done
by McGehee, Mazzae, and Baldwin (2000), the early warning condition showed
significantly shorter accelerator release reaction times, fewer crashes, and less severe
crashes than both the baseline condition and the late warning condition. The results
indicated that the timing of a warning is important in the design of collision warning
systems.” For that reason, it is essential to analyze the effect of driver’s decision-making
time caused by CAT warnings and other environmental factors, such as traffic and
weather. For the reaction time analysis, we analyzed the motor response time based on
the presence of the physiological response (effective warning).
4. Phase 1 Study Results
4.1. Eye-tracking Data
According to the eye-gaze data, there were significant differences between CAT
devices regarding driver’s visual attentions. One-way ANOVA test showed that their
attentions on the AOI map (Front view, Garmin, Left view, Mobileye, Panel, RD-140,
Rear view, Right view and Unknown part) were significantly influenced by the warnings
from the CAT devices. For the front view (area #1), the drivers paid more attention when
they used RD-140 compared to other CAT devices [F (3, 15) =6.55, P< 0.01]. Post hoc
comparison using the Tukey HSD test indicated that the mean score for the RD-140 (M
= 83.8%, SD = 6.3%) was significantly different than others (Mobileye 560: M = 79.2%,
SD = 4.2%; Garmin: M = 76.3%, SD = 6.9%; Audiovox: M = 73.8%, SD = 8.1%). In
addition, the eye gaze percentage of the RD-140 in the Unknown part (area #9) was
significantly lower than others [F (3, 15) =3.90, P< 0.05]. Moreover, post hoc
comparison using the Tukey HSD test indicated that the mean score for the Audiovox
18
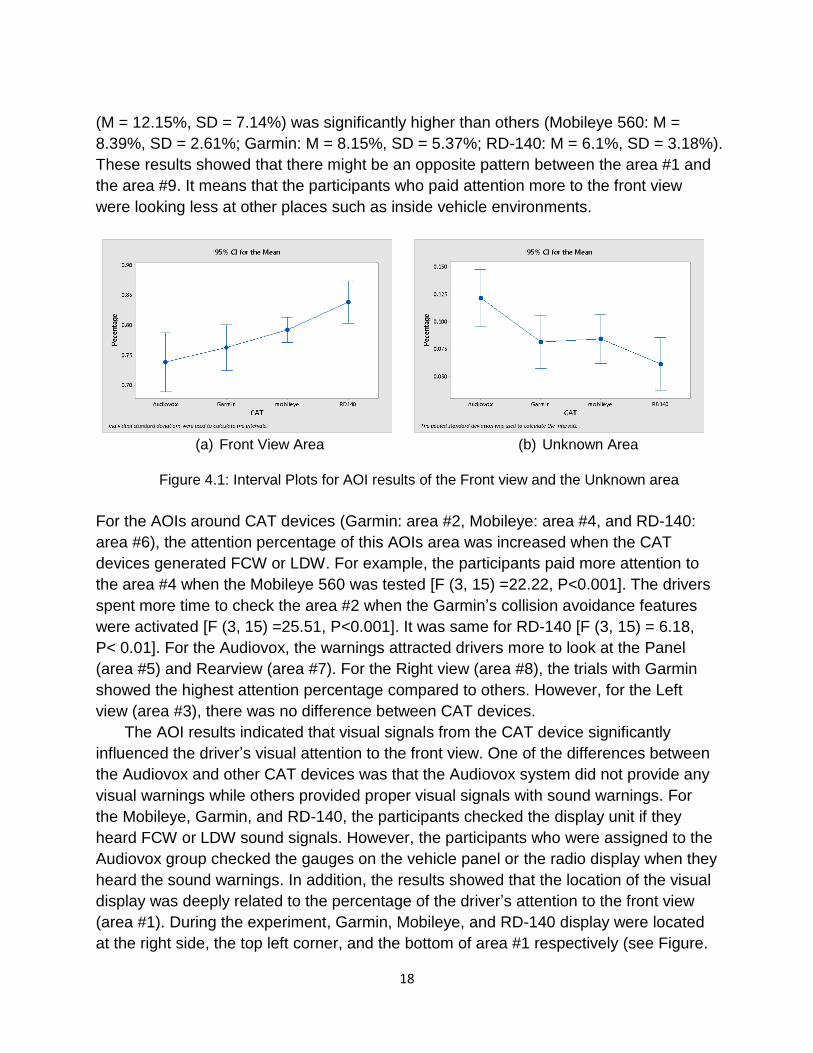
(M = 12.15%, SD = 7.14%) was significantly higher than others (Mobileye 560: M =
8.39%, SD = 2.61%; Garmin: M = 8.15%, SD = 5.37%; RD-140: M = 6.1%, SD = 3.18%).
These results showed that there might be an opposite pattern between the area #1 and
the area #9. It means that the participants who paid attention more to the front view
were looking less at other places such as inside vehicle environments.
(a) Front View Area (b) Unknown Area
Figure 4.1: Interval Plots for AOI results of the Front view and the Unknown area
For the AOIs around CAT devices (Garmin: area #2, Mobileye: area #4, and RD-140:
area #6), the attention percentage of this AOIs area was increased when the CAT
devices generated FCW or LDW. For example, the participants paid more attention to
the area #4 when the Mobileye 560 was tested [F (3, 15) =22.22, P<0.001]. The drivers
spent more time to check the area #2 when the Garmin’s collision avoidance features
were activated [F (3, 15) =25.51, P<0.001]. It was same for RD-140 [F (3, 15) = 6.18,
P< 0.01]. For the Audiovox, the warnings attracted drivers more to look at the Panel
(area #5) and Rearview (area #7). For the Right view (area #8), the trials with Garmin
showed the highest attention percentage compared to others. However, for the Left
view (area #3), there was no difference between CAT devices.
The AOI results indicated that visual signals from the CAT device significantly
influenced the driver’s visual attention to the front view. One of the differences between
the Audiovox and other CAT devices was that the Audiovox system did not provide any
visual warnings while others provided proper visual signals with sound warnings. For
the Mobileye, Garmin, and RD-140, the participants checked the display unit if they
heard FCW or LDW sound signals. However, the participants who were assigned to the
Audiovox group checked the gauges on the vehicle panel or the radio display when they
heard the sound warnings. In addition, the results showed that the location of the visual
display was deeply related to the percentage of the driver’s attention to the front view
(area #1). During the experiment, Garmin, Mobileye, and RD-140 display were located
at the right side, the top left corner, and the bottom of area #1 respectively (see Figure.
19
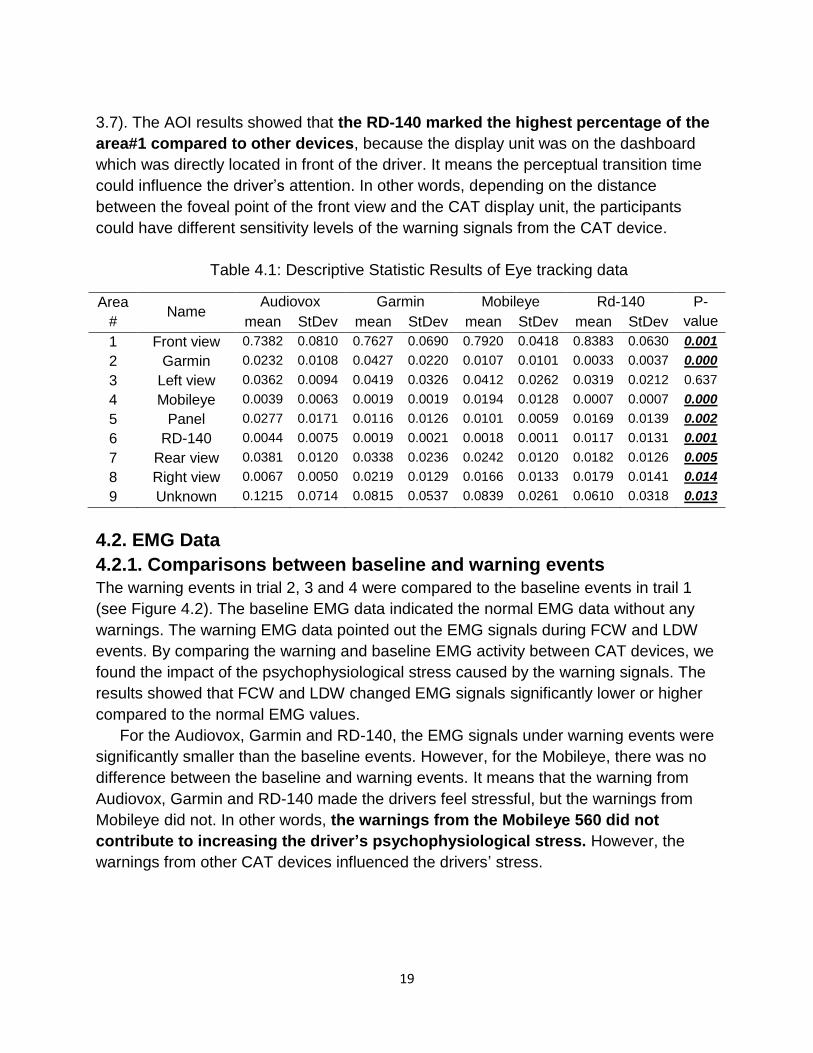
3.7). The AOI results showed that the RD-140 marked the highest percentage of the
area#1 compared to other devices, because the display unit was on the dashboard
which was directly located in front of the driver. It means the perceptual transition time
could influence the driver’s attention. In other words, depending on the distance
between the foveal point of the front view and the CAT display unit, the participants
could have different sensitivity levels of the warning signals from the CAT device.
Table 4.1: Descriptive Statistic Results of Eye tracking data
Area
# Name
Audiovox Garmin Mobileye Rd-140 P-
value mean StDev mean StDev mean StDev mean StDev
1 Front view 0.7382 0.0810 0.7627 0.0690 0.7920 0.0418 0.8383 0.0630 0.001
2 Garmin 0.0232 0.0108 0.0427 0.0220 0.0107 0.0101 0.0033 0.0037 0.000
3 Left view 0.0362 0.0094 0.0419 0.0326 0.0412 0.0262 0.0319 0.0212 0.637
4 Mobileye 0.0039 0.0063 0.0019 0.0019 0.0194 0.0128 0.0007 0.0007 0.000
5 Panel 0.0277 0.0171 0.0116 0.0126 0.0101 0.0059 0.0169 0.0139 0.002
6 RD-140 0.0044 0.0075 0.0019 0.0021 0.0018 0.0011 0.0117 0.0131 0.001
7 Rear view 0.0381 0.0120 0.0338 0.0236 0.0242 0.0120 0.0182 0.0126 0.005
8 Right view 0.0067 0.0050 0.0219 0.0129 0.0166 0.0133 0.0179 0.0141 0.014
9 Unknown 0.1215 0.0714 0.0815 0.0537 0.0839 0.0261 0.0610 0.0318 0.013
4.2. EMG Data
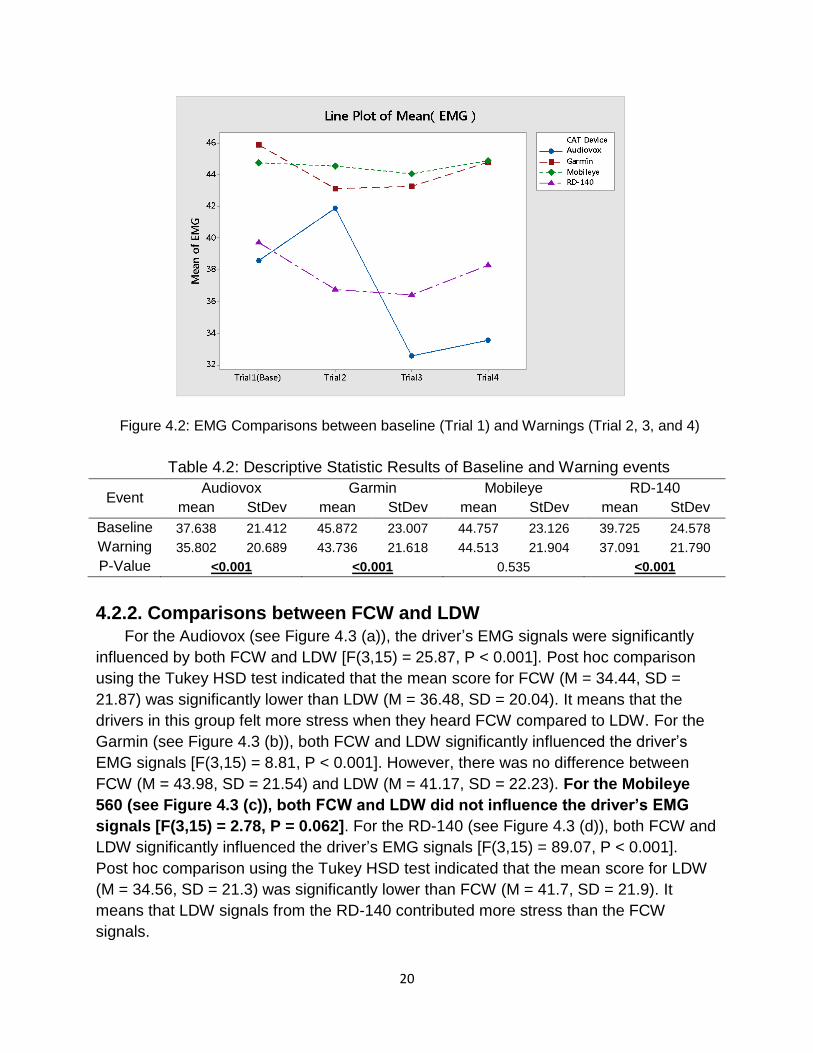
4.2.1. Comparisons between baseline and warning events
The warning events in trial 2, 3 and 4 were compared to the baseline events in trail 1
(see Figure 4.2). The baseline EMG data indicated the normal EMG data without any
warnings. The warning EMG data pointed out the EMG signals during FCW and LDW
events. By comparing the warning and baseline EMG activity between CAT devices, we
found the impact of the psychophysiological stress caused by the warning signals. The
results showed that FCW and LDW changed EMG signals significantly lower or higher
compared to the normal EMG values.
For the Audiovox, Garmin and RD-140, the EMG signals under warning events were
significantly smaller than the baseline events. However, for the Mobileye, there was no
difference between the baseline and warning events. It means that the warning from
Audiovox, Garmin and RD-140 made the drivers feel stressful, but the warnings from
Mobileye did not. In other words, the warnings from the Mobileye 560 did not
contribute to increasing the driver’s psychophysiological stress. However, the
warnings from other CAT devices influenced the drivers’ stress.
20
Figure 4.2: EMG Comparisons between baseline (Trial 1) and Warnings (Trial 2, 3, and 4)
Table 4.2: Descriptive Statistic Results of Baseline and Warning events
Event Audiovox Garmin Mobileye RD-140
mean StDev mean StDev mean StDev mean StDev
Baseline 37.638 21.412 45.872 23.007 44.757 23.126 39.725 24.578
Warning 35.702 35.802 20.689 43.736 21.618 44.513 21.904 37.091 21.790
P-Value <0.001 <0.001 0.535 <0.001
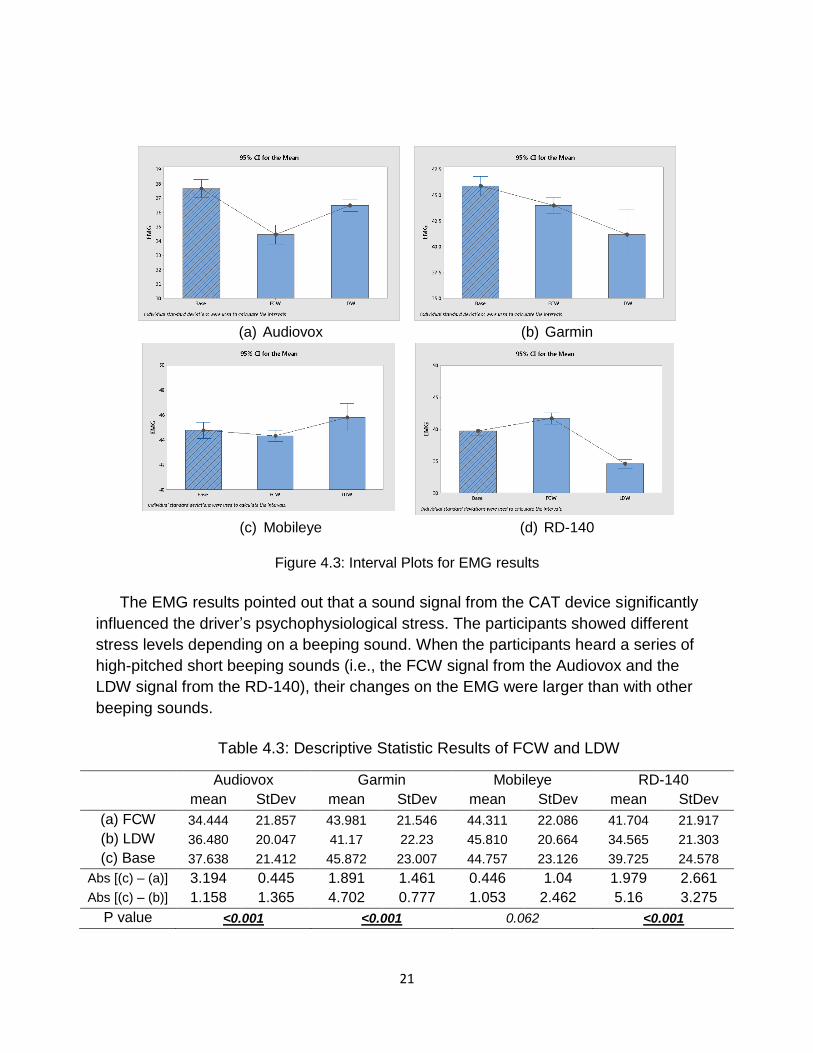
4.2.2. Comparisons between FCW and LDW
For the Audiovox (see Figure 4.3 (a)), the driver’s EMG signals were significantly
influenced by both FCW and LDW [F(3,15) = 25.87, P < 0.001]. Post hoc comparison
using the Tukey HSD test indicated that the mean score for FCW (M = 34.44, SD =
21.87) was significantly lower than LDW (M = 36.48, SD = 20.04). It means that the
drivers in this group felt more stress when they heard FCW compared to LDW. For the
Garmin (see Figure 4.3 (b)), both FCW and LDW significantly influenced the driver’s
EMG signals [F(3,15) = 8.81, P < 0.001]. However, there was no difference between
FCW (M = 43.98, SD = 21.54) and LDW (M = 41.17, SD = 22.23). For the Mobileye
560 (see Figure 4.3 (c)), both FCW and LDW did not influence the driver’s EMG
signals [F(3,15) = 2.78, P = 0.062]. For the RD-140 (see Figure 4.3 (d)), both FCW and
LDW significantly influenced the driver’s EMG signals [F(3,15) = 89.07, P < 0.001].
Post hoc comparison using the Tukey HSD test indicated that the mean score for LDW
(M = 34.56, SD = 21.3) was significantly lower than FCW (M = 41.7, SD = 21.9). It
means that LDW signals from the RD-140 contributed more stress than the FCW
signals.
21
(a) Audiovox (b) Garmin
(c) Mobileye (d) RD-140
Figure 4.3: Interval Plots for EMG results
The EMG results pointed out that a sound signal from the CAT device significantly
influenced the driver’s psychophysiological stress. The participants showed different
stress levels depending on a beeping sound. When the participants heard a series of
high-pitched short beeping sounds (i.e., the FCW signal from the Audiovox and the
LDW signal from the RD-140), their changes on the EMG were larger than with other
beeping sounds.
Table 4.3: Descriptive Statistic Results of FCW and LDW
Audiovox Garmin Mobileye RD-140
mean StDev mean StDev mean StDev mean StDev
(a) FCW 34.444 21.857 43.981 21.546 44.311 22.086 41.704 21.917
(b) LDW 36.480 20.047 41.17 22.23 45.810 20.664 34.565 21.303
(c) Base 37.638 21.412 45.872 23.007 44.757 23.126 39.725 24.578
Abs [(c) – (a)] 3.194 0.445 1.891 1.461 0.446 1.04 1.979 2.661
Abs [(c) – (b)] 1.158 1.365 4.702 0.777 1.053 2.462 5.16 3.275
P value <0.001 <0.001 0.062 <0.001
22
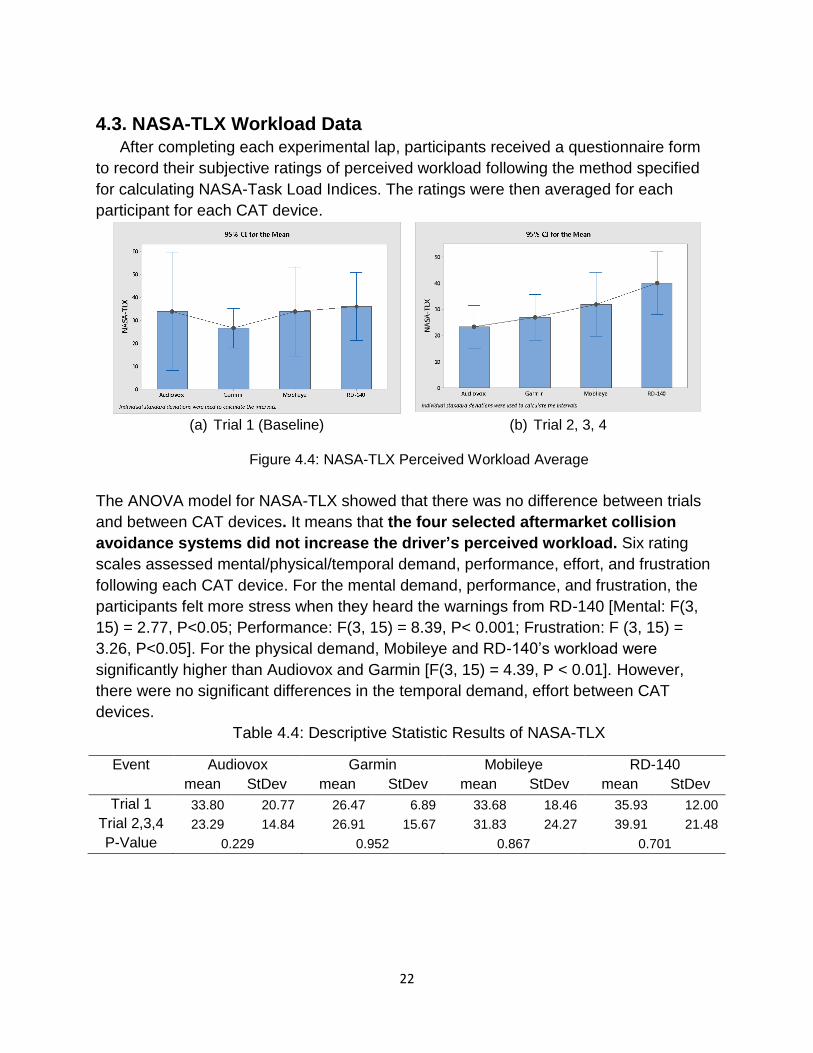
4.3. NASA-TLX Workload Data
After completing each experimental lap, participants received a questionnaire form
to record their subjective ratings of perceived workload following the method specified
for calculating NASA-Task Load Indices. The ratings were then averaged for each
participant for each CAT device.
(a) Trial 1 (Baseline) (b) Trial 2, 3, 4
Figure 4.4: NASA-TLX Perceived Workload Average
The ANOVA model for NASA-TLX showed that there was no difference between trials
and between CAT devices. It means that the four selected aftermarket collision
avoidance systems did not increase the driver’s perceived workload. Six rating
scales assessed mental/physical/temporal demand, performance, effort, and frustration
following each CAT device. For the mental demand, performance, and frustration, the
participants felt more stress when they heard the warnings from RD-140 [Mental: F(3,
15) = 2.77, P<0.05; Performance: F(3, 15) = 8.39, P< 0.001; Frustration: F (3, 15) =
3.26, P<0.05]. For the physical demand, Mobileye and RD-140’s workload were
significantly higher than Audiovox and Garmin [F(3, 15) = 4.39, P < 0.01]. However,
there were no significant differences in the temporal demand, effort between CAT
devices.
Table 4.4: Descriptive Statistic Results of NASA-TLX
Event Audiovox Garmin Mobileye RD-140
mean StDev mean StDev mean StDev mean StDev
Trial 1 33.80 20.77 26.47 6.89 33.68 18.46 35.93 12.00
Trial 2,3,4 23.29 14.84 26.91 15.67 31.83 24.27 39.91 21.48
P-Value 0.229 0.952 0.867 0.701
23
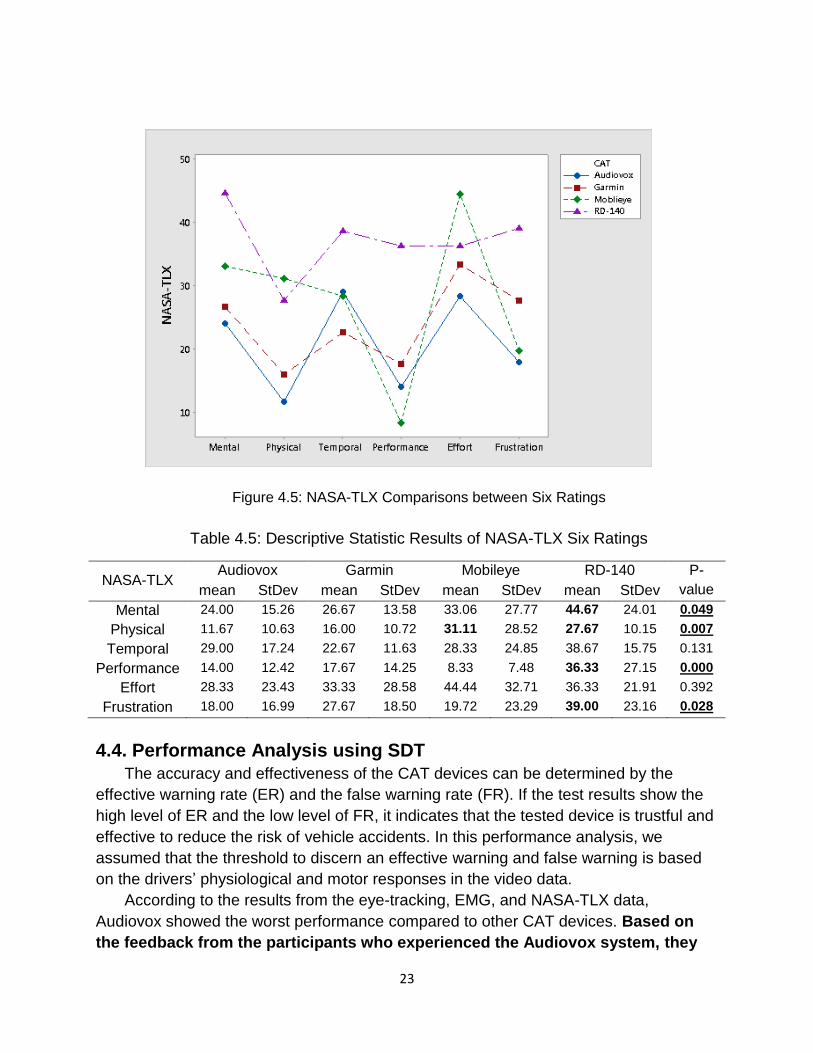
Figure 4.5: NASA-TLX Comparisons between Six Ratings
Table 4.5: Descriptive Statistic Results of NASA-TLX Six Ratings
NASA-TLX Audiovox Garmin Mobileye RD-140 P-
value mean StDev mean StDev mean StDev mean StDev
Mental 24.00 15.26 26.67 13.58 33.06 27.77 44.67 24.01 0.049
Physical 11.67 10.63 16.00 10.72 31.11 28.52 27.67 10.15 0.007
Temporal 29.00 17.24 22.67 11.63 28.33 24.85 38.67 15.75 0.131
Performance 14.00 12.42 17.67 14.25 8.33 7.48 36.33 27.15 0.000
Effort 28.33 23.43 33.33 28.58 44.44 32.71 36.33 21.91 0.392
Frustration 18.00 16.99 27.67 18.50 19.72 23.29 39.00 23.16 0.028
4.4. Performance Analysis using SDT The accuracy and effectiveness of the CAT devices can be determined by the
effective warning rate (ER) and the false warning rate (FR). If the test results show the
high level of ER and the low level of FR, it indicates that the tested device is trustful and
effective to reduce the risk of vehicle accidents. In this performance analysis, we
assumed that the threshold to discern an effective warning and false warning is based
on the drivers’ physiological and motor responses in the video data.
According to the results from the eye-tracking, EMG, and NASA-TLX data,
Audiovox showed the worst performance compared to other CAT devices. Based on
the feedback from the participants who experienced the Audiovox system, they
24
lost confidence in the system over the time and adjudged the alarms from
Audiovox as a nuisance. Eventually, they ignored the warnings from Audiovox.
Hence, we did not include Audiovox in the performance analysis.
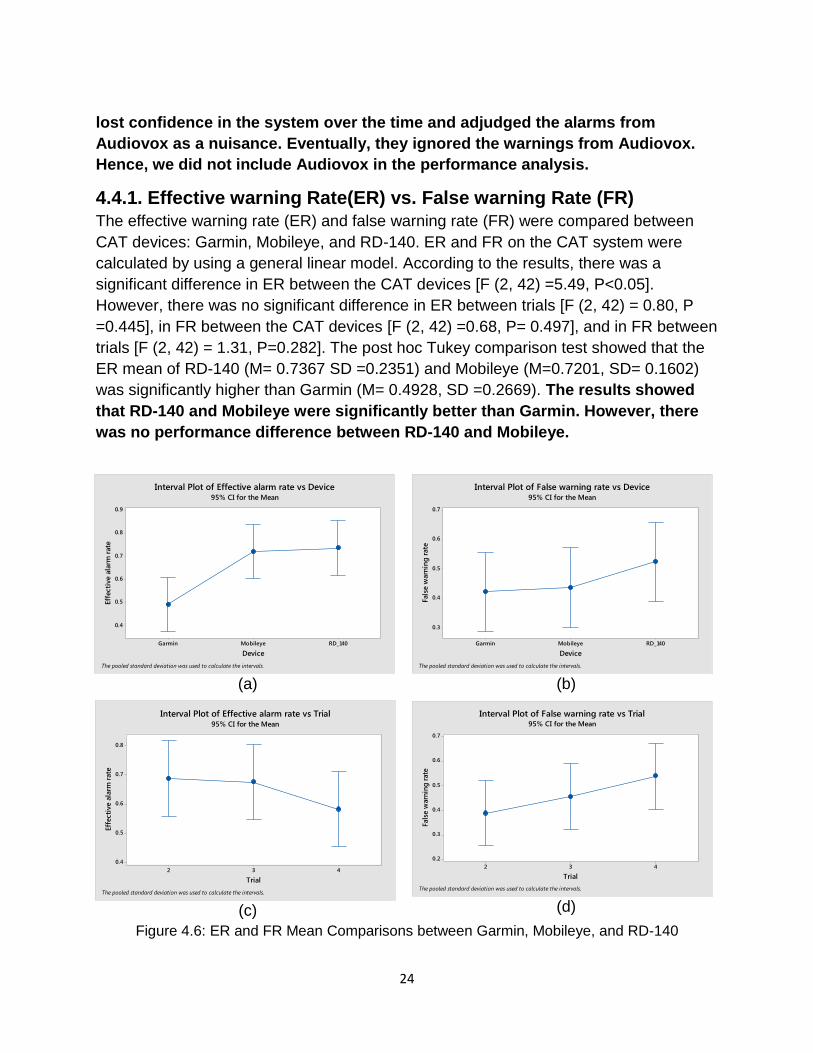
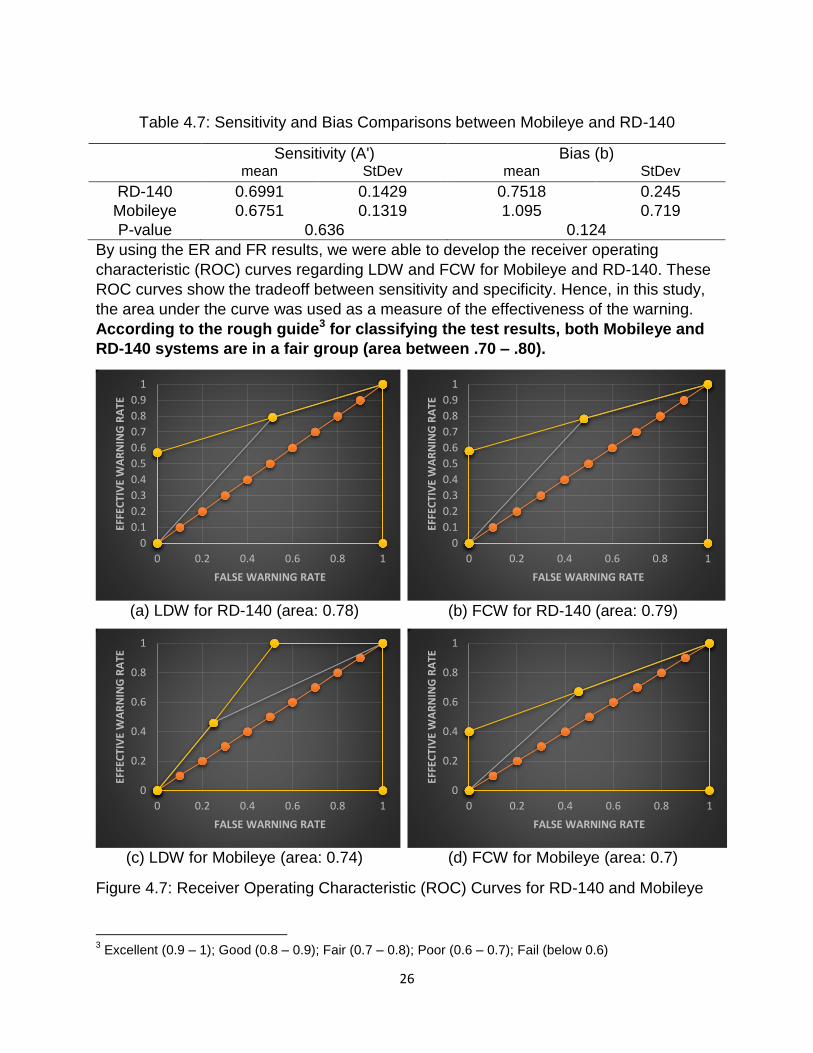
4.4.1. Effective warning Rate(ER) vs. False warning Rate (FR) The effective warning rate (ER) and false warning rate (FR) were compared between
CAT devices: Garmin, Mobileye, and RD-140. ER and FR on the CAT system were
calculated by using a general linear model. According to the results, there was a
significant difference in ER between the CAT devices [F (2, 42) =5.49, P<0.05].
However, there was no significant difference in ER between trials [F (2, 42) = 0.80, P
=0.445], in FR between the CAT devices [F (2, 42) =0.68, P= 0.497], and in FR between
trials [F (2, 42) = 1.31, P=0.282]. The post hoc Tukey comparison test showed that the
ER mean of RD-140 (M= 0.7367 SD =0.2351) and Mobileye (M=0.7201, SD= 0.1602)
was significantly higher than Garmin (M= 0.4928, SD =0.2669). The results showed
that RD-140 and Mobileye were significantly better than Garmin. However, there
was no performance difference between RD-140 and Mobileye.
(a) (b)
(c) (d)
Figure 4.6: ER and FR Mean Comparisons between Garmin, Mobileye, and RD-140
RD_140MobileyeGarmin
0.9
0.8
0.7
0.6
0.5
0.4
Device
Eff
ecti
ve a
larm
rate
Interval Plot of Effective alarm rate vs Device95% CI for the Mean
The pooled standard deviation was used to calculate the intervals.
RD_140MobileyeGarmin
0.7
0.6
0.5
0.4
0.3
Device
Fals
e w
arn
ing
rate
Interval Plot of False warning rate vs Device95% CI for the Mean
The pooled standard deviation was used to calculate the intervals.
432
0.8
0.7
0.6
0.5
0.4
Trial
Eff
ecti
ve a
larm
rate
Interval Plot of Effective alarm rate vs Trial95% CI for the Mean
The pooled standard deviation was used to calculate the intervals.
432
0.7
0.6
0.5
0.4
0.3
0.2
Trial
Fals
e w
arn
ing
rate
Interval Plot of False warning rate vs Trial95% CI for the Mean
The pooled standard deviation was used to calculate the intervals.
25
4.4.2. False Warning Rate Comparisons between FCW and LDW
False warning rate (FR) is related to the reliability of the CAT device. When FR is
higher, the driver ignores a warning more often. FR could be influenced by the type of
warning and device. Table 4.6 showed the FR between the type of warning (LDW and
FCW) and between CAT devices (Mobileye and RD-140).
Table 4.6: Descriptive Statistic Result of FR
Event Mobileye RD-140
mean StDev mean StDev
LDW 0.2879 0.3059 0.6171 0.023
FCW 0.5170 0.2751 0.2619 0.3081
P-Value 0.072 <0.001
Although RD-140 is the best CAT device for FCW, there was a significant FR
difference between LDW and FCW. On the other hand, Mobileye did not show any
significant FR difference between LDW and FCW (see Table 4.6), and Mobileye is the
best CAT device for LDW. According to the result of the false FCW rate, there was a
significant difference between Mobileye and RD-140 [F(3,15) = 7.04, P < 0.001]. The
mean of the false FCW rate for Mobileye (M=0.5170, SD= 0.2751) was much higher
than RD-140 (M=0.5170, SD= 0.2751). It means that RD-140 showed the best
performance for the FCW compared to other tested CAT devices. For the LDW,
there was a significant difference between Mobileye and RD-140 on the FR [F (3, 15) =
10.94, P<0.001]. The mean of false LDW for RD-140 (M= 0.6171, SD =0.2023) is much
higher than Mobileye (M= 0.2879, SD =0.3059). Hence, we can conclude that
Mobileye is the most effective device for LDW among the tested CAT devices.
4.4.3. Sensitivity Analysis between Mobileye and RD-140
CAT system should be designed to maximize the detectability of any potential
collision while driving. Hence, it is desirable to use the CAT system with the high
sensitivity level, which means the high level of ER and the low level of FR. Satisfying
one of them does not guarantee a safe design (Sullivan 2015).
The effective warning rate (ER) and false warning rate (FR) were used to calculate the
sensitivity (A’) and bias (b) and were compared between Mobileye and RD-140 (see
Table 4.7). According to the results, there was no significant difference between
Mobileye and Rd-140 regarding the level of sensitivity A’ (P = 0.636) and bias (P =
0.124).
26
Table 4.7: Sensitivity and Bias Comparisons between Mobileye and RD-140
Sensitivity (A') Bias (b) mean StDev mean StDev
RD-140 0.6991 0.1429 0.7518 0.245
Mobileye 0.6751 0.1319 1.095 0.719
P-value 0.636 0.124
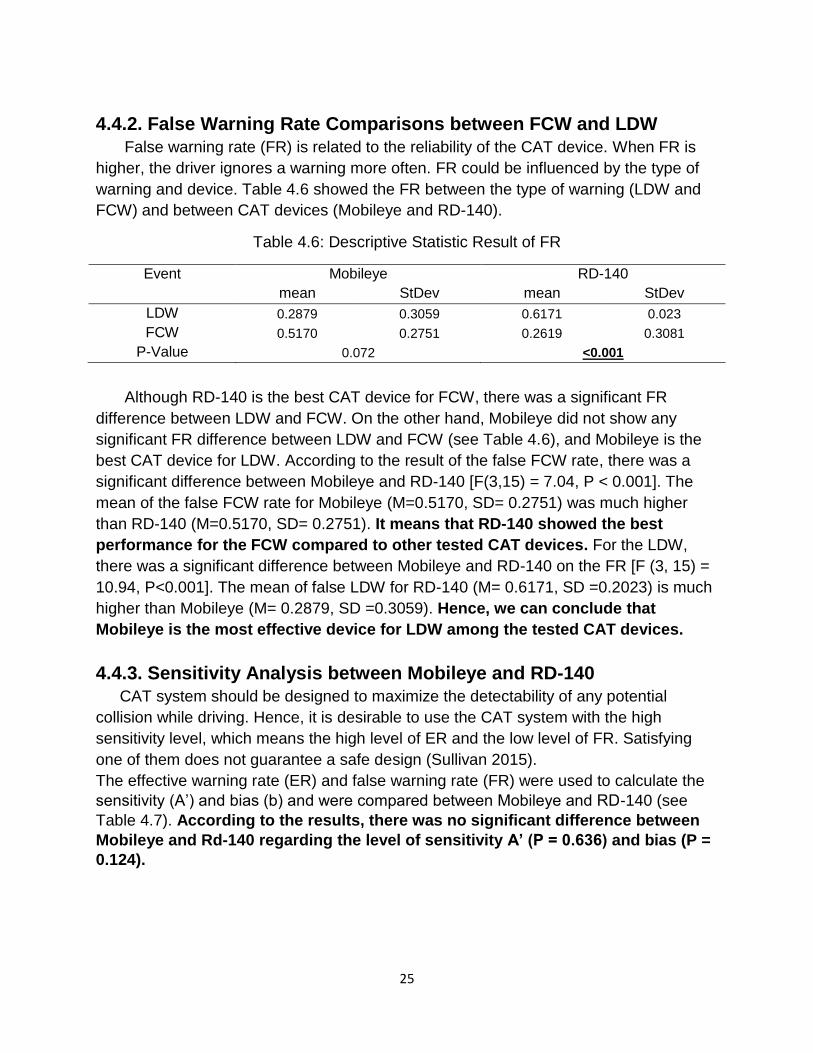
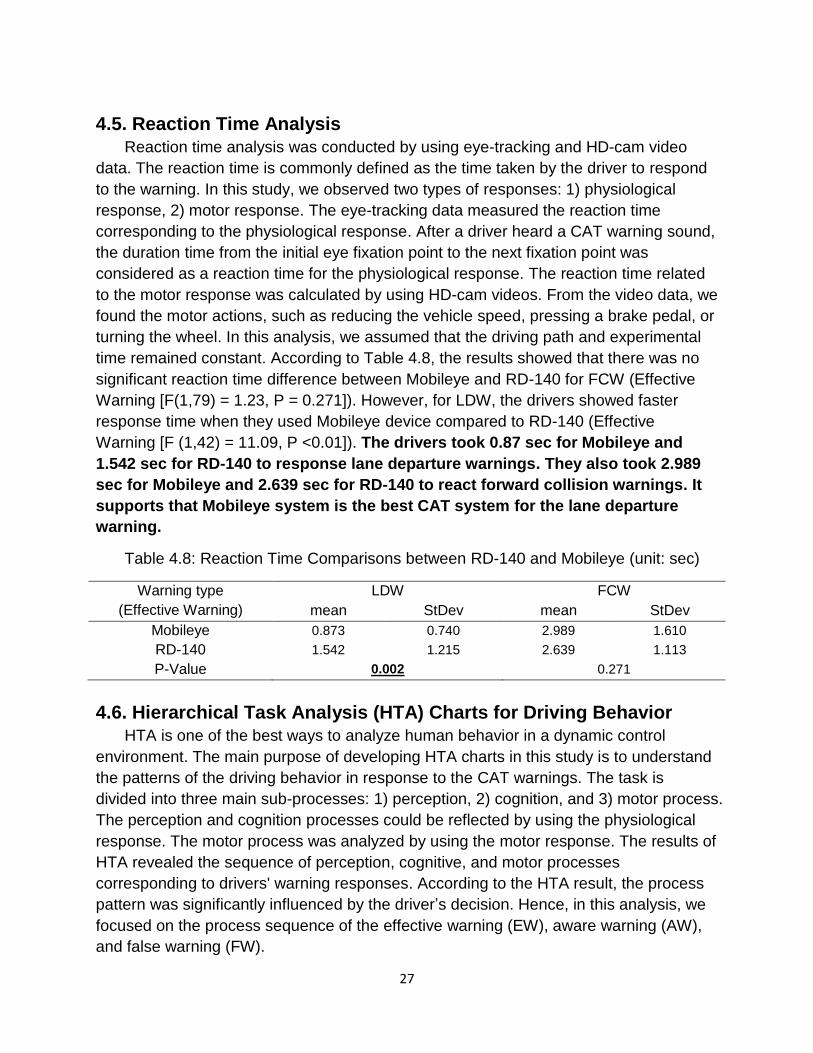
By using the ER and FR results, we were able to develop the receiver operating
characteristic (ROC) curves regarding LDW and FCW for Mobileye and RD-140. These
ROC curves show the tradeoff between sensitivity and specificity. Hence, in this study,
the area under the curve was used as a measure of the effectiveness of the warning.
According to the rough guide3 for classifying the test results, both Mobileye and
RD-140 systems are in a fair group (area between .70 – .80).
(a) LDW for RD-140 (area: 0.78) (b) FCW for RD-140 (area: 0.79)
(c) LDW for Mobileye (area: 0.74) (d) FCW for Mobileye (area: 0.7)
Figure 4.7: Receiver Operating Characteristic (ROC) Curves for RD-140 and Mobileye
3 Excellent (0.9 – 1); Good (0.8 – 0.9); Fair (0.7 – 0.8); Poor (0.6 – 0.7); Fail (below 0.6)
0
0.1
0.2
0.3
0.4
0.5
0.6
0.7
0.8
0.9
1
0 0.2 0.4 0.6 0.8 1
EFFE
CTI
VE
WA
RN
ING
RA
TE
FALSE WARNING RATE
0
0.1
0.2
0.3
0.4
0.5
0.6
0.7
0.8
0.9
1
0 0.2 0.4 0.6 0.8 1
EFFE
CTI
VE
WA
RN
ING
RA
TE
FALSE WARNING RATE
0
0.2
0.4
0.6
0.8
1
0 0.2 0.4 0.6 0.8 1
EFFE
CTI
VE
WA
RN
ING
RA
TE
FALSE WARNING RATE
0
0.2
0.4
0.6
0.8
1
0 0.2 0.4 0.6 0.8 1
EFFE
CTI
VE
WA
RN
ING
RA
TE
FALSE WARNING RATE
27
4.5. Reaction Time Analysis
Reaction time analysis was conducted by using eye-tracking and HD-cam video
data. The reaction time is commonly defined as the time taken by the driver to respond
to the warning. In this study, we observed two types of responses: 1) physiological
response, 2) motor response. The eye-tracking data measured the reaction time
corresponding to the physiological response. After a driver heard a CAT warning sound,
the duration time from the initial eye fixation point to the next fixation point was
considered as a reaction time for the physiological response. The reaction time related
to the motor response was calculated by using HD-cam videos. From the video data, we
found the motor actions, such as reducing the vehicle speed, pressing a brake pedal, or
turning the wheel. In this analysis, we assumed that the driving path and experimental
time remained constant. According to Table 4.8, the results showed that there was no
significant reaction time difference between Mobileye and RD-140 for FCW (Effective
Warning [F(1,79) = 1.23, P = 0.271]). However, for LDW, the drivers showed faster
response time when they used Mobileye device compared to RD-140 (Effective
Warning [F (1,42) = 11.09, P <0.01]). The drivers took 0.87 sec for Mobileye and
1.542 sec for RD-140 to response lane departure warnings. They also took 2.989
sec for Mobileye and 2.639 sec for RD-140 to react forward collision warnings. It
supports that Mobileye system is the best CAT system for the lane departure
warning.
Table 4.8: Reaction Time Comparisons between RD-140 and Mobileye (unit: sec)
Warning type
(Effective Warning)
LDW FCW
mean StDev mean StDev
Mobileye 0.873 0.740 2.989 1.610
RD-140 1.542 1.215 2.639 1.113
P-Value 0.002 0.271
4.6. Hierarchical Task Analysis (HTA) Charts for Driving Behavior
HTA is one of the best ways to analyze human behavior in a dynamic control
environment. The main purpose of developing HTA charts in this study is to understand
the patterns of the driving behavior in response to the CAT warnings. The task is
divided into three main sub-processes: 1) perception, 2) cognition, and 3) motor process.
The perception and cognition processes could be reflected by using the physiological
response. The motor process was analyzed by using the motor response. The results of
HTA revealed the sequence of perception, cognitive, and motor processes
corresponding to drivers' warning responses. According to the HTA result, the process
pattern was significantly influenced by the driver’s decision. Hence, in this analysis, we
focused on the process sequence of the effective warning (EW), aware warning (AW),
and false warning (FW).

28
Plan 0: Responding to the CAT device warnings
This is the overall goal of the task. The aim of Plan 0 is to response the alarms from the
CAT device. Each driver responded LDW and FCW differently. The driver’s reaction
was also significantly influenced by traffic and weather conditions. The goal of Plan 0
was achieved by accomplishing three sub-goals: 1) collecting information from the
driving environment, 2) evaluating the gathered information, 3) executing the motor
system. Figure 4.8 shows the overall HTA regarding the driver’s response to the CAT
warnings. For the effective warning (EW), the drivers executed Plan 1 and Plan 2 in
loops until they decide to perform an appropriate motor response (Plan 1 Plan 2
Plan 3 END). If the driver noticed any emergency situations during Plans 1 or 2, then
the driver moved to Plan 3 immediately. For the aware warning (AW), since the drivers
were already aware of the potential hazards before the warning occurred, they
performed actions without any cognitive process (Plan 1 Plan 3 END). For the
false warning (FW), the drivers evaluated the meaning of warnings and concluded that
no motor response was necessary in this case (Plan 1 Plan 2 END).
0. Responding to CAT
device warnings
2. Evaluating the gathered
information
1. Collecting information
from the driving
environment
Plan0: Do Plan 1 Plan 2
More information required to decide
the response
Yes
Plan 3No
3. Executing the motor
system
Emergency No
Yes
Figure 4.8: Plan 0 – Overall HTA Chart for Driving Behavior
Plan 1: Collecting information from the driving environment
The main goal of Plan 1 is to collect the information from all surrounding environments
to identify any potential hazards. Continuous monitoring is required without any
distractions during the plan 1process. Figure 4.9 shows the detailed map of the plan 1.
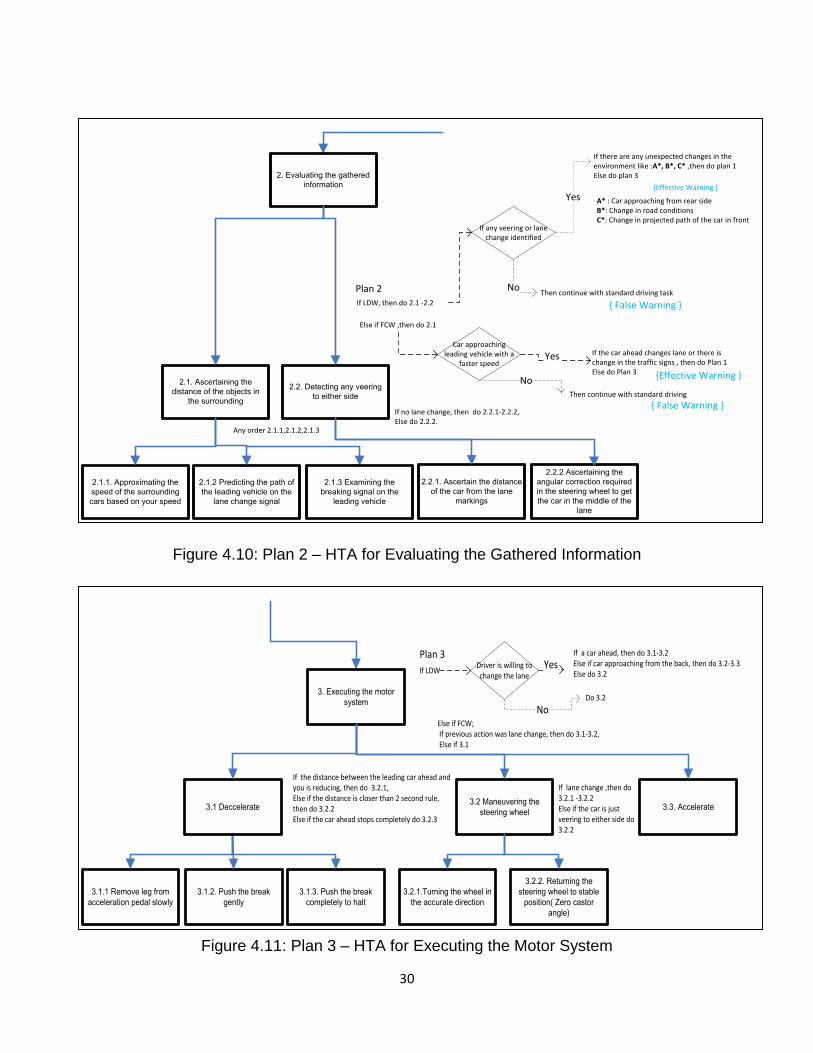
Plan 2: Evaluating the gathered information
After drivers gathered the information, they need to interpret the meaning of the
information and understand the consequences caused by these possible threats that
might lead to vehicle accidents. This is the most important plan to prevent any
erroneous judgments while driving. Figure 4.10 shows the detailed map of the plan 2.
29
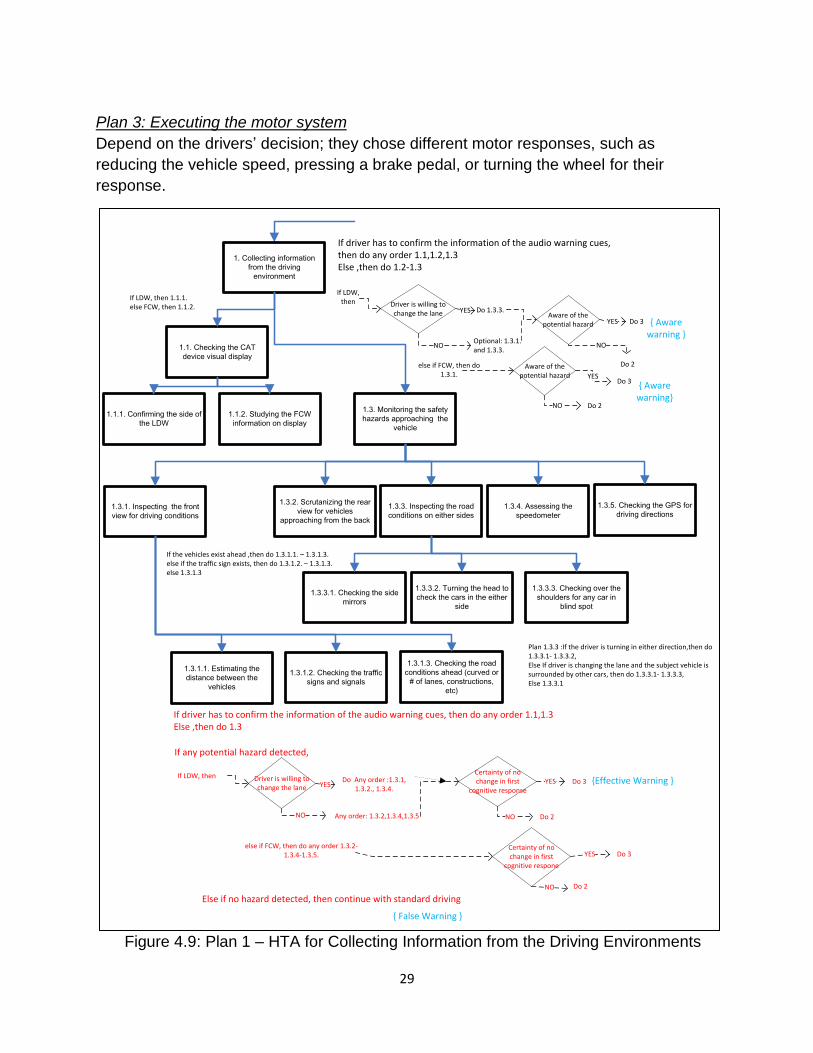
Plan 3: Executing the motor system
Depend on the drivers’ decision; they chose different motor responses, such as
reducing the vehicle speed, pressing a brake pedal, or turning the wheel for their
response.
Figure 4.9: Plan 1 – HTA for Collecting Information from the Driving Environments
1.1. Checking the CAT
device visual display
1.3.3.2. Turning the head to
check the cars in the either
side
1. Collecting information
from the driving
environment
1.3. Monitoring the safety
hazards approaching the
vehicle
1.3.1. Inspecting the front
view for driving conditions
1.3.1.1. Estimating the
distance between the
vehicles
1.3.1.2. Checking the traffic
signs and signals
1.3.1.3. Checking the road
conditions ahead (curved or
# of lanes, constructions,
etc)
1.3.2. Scrutanizing the rear
view for vehicles
approaching from the back
1.1.1. Confirming the side of
the LDW
1.1.2. Studying the FCW
information on display
1.3.3. Inspecting the road
conditions on either sides
1.3.3.1. Checking the side
mirrors
1.3.4. Assessing the
speedometer
1.3.5. Checking the GPS for
driving directions
1.3.3.3. Checking over the
shoulders for any car in
blind spot
If driver has to confirm the information of the audio warning cues, then do any order 1.1,1.2,1.3Else ,then do 1.2-1.3
Driver is willing to change the lane YES
NO
If LDW, then
else if FCW, then do 1.3.1.
Do 1.3.3.
Optional: 1.3.1. and 1.3.3.
Aware of the potential hazard YES
NO
Do 3
Do 2
Aware of the potential hazard
NO
Do 3
Do 2
YES { Aware warning }
{ Aware warning}
If LDW, then 1.1.1.else FCW, then 1.1.2.
If the vehicles exist ahead ,then do 1.3.1.1. – 1.3.1.3.else if the traffic sign exists, then do 1.3.1.2. – 1.3.1.3.else 1.3.1.3
Plan 1.3.3 :If the driver is turning in either direction,then do 1.3.3.1- 1.3.3.2,Else If driver is changing the lane and the subject vehicle is surrounded by other cars, then do 1.3.3.1- 1.3.3.3,Else 1.3.3.1
If driver has to confirm the information of the audio warning cues, then do any order 1.1,1.3Else ,then do 1.3
Driver is willing to change the lane YES
NO
If LDW, thenDo Any order :1.3.1,
1.3.2., 1.3.4.
Any order: 1.3.2,1.3.4,1.3.5
else if FCW, then do any order 1.3.2-1.3.4-1.3.5.
Certainty of no change in first
cognitive respone
Do 2
Else if no hazard detected, then continue with standard driving
YES Do 3
NO
Certainty of no change in first
cognitive responseYES
NO
Do 3
Do 2
If any potential hazard detected,
{ False Warning }
{Effective Warning }
30
Figure 4.10: Plan 2 – HTA for Evaluating the Gathered Information
Figure 4.11: Plan 3 – HTA for Executing the Motor System
2.2.2 Ascertaining the
angular correction required
in the steering wheel to get
the car in the middle of the
lane
2. Evaluating the gathered
information
2.1. Ascertaining the
distance of the objects in
the surrounding
2.1.1. Approximating the
speed of the surrounding
cars based on your speed
2.1.2 Predicting the path of
the leading vehicle on the
lane change signal
2.2. Detecting any veering
to either side
2.2.1. Ascertain the distance
of the car from the lane
markings
If no lane change, then do 2.2.1-2.2.2, Else do 2.2.2.
2.1.3 Examining the
breaking signal on the
leading vehicle
Any order 2.1.1,2.1.2,2.1.3
A* : Car approaching from rear sideB*: Change in road conditionsC*: Change in projected path of the car in front
If LDW, then do 2.1 -2.2
If any veering or lane change identified
No
If there are any unexpected changes in the environment like :A*, B*, C* ,then do plan 1Else do plan 3
Car approaching leading vehicle with a
faster speedYes
No
Else if FCW ,then do 2.1
If the car ahead changes lane or there is change in the traffic signs , then do Plan 1Else do Plan 3
Yes
Then continue with standard driving
Then continue with standard driving taskPlan 2
{ False Warning }
{ False Warning }
{Effective Warning }
{Effective Warning }
3.3. Accelerate
3.1.1 Remove leg from
acceleration pedal slowly
3. Executing the motor
system
3.1.2. Push the break
gently
3.1.3. Push the break
completely to halt
3.2 Maneuvering the
steering wheel
3.2.1.Turning the wheel in
the accurate direction
3.2.2. Returning the
steering wheel to stable
position( Zero castor
angle)
If lane change ,then do 3.2.1 -3.2.2 Else if the car is just veering to either side do 3.2.2
3.1 Deccelerate
If the distance between the leading car ahead and you is reducing, then do 3.2.1,Else if the distance is closer than 2 second rule, then do 3.2.2 Else if the car ahead stops completely do 3.2.3
Driver is willing to change the lane
If LDW Yes
NoDo 3.2
If a car ahead, then do 3.1-3.2Else if car approaching from the back, then do 3.2-3.3Else do 3.2
Else if FCW; If previous action was lane change, then do 3.1-3.2, Else if 3.1
Plan 3
31
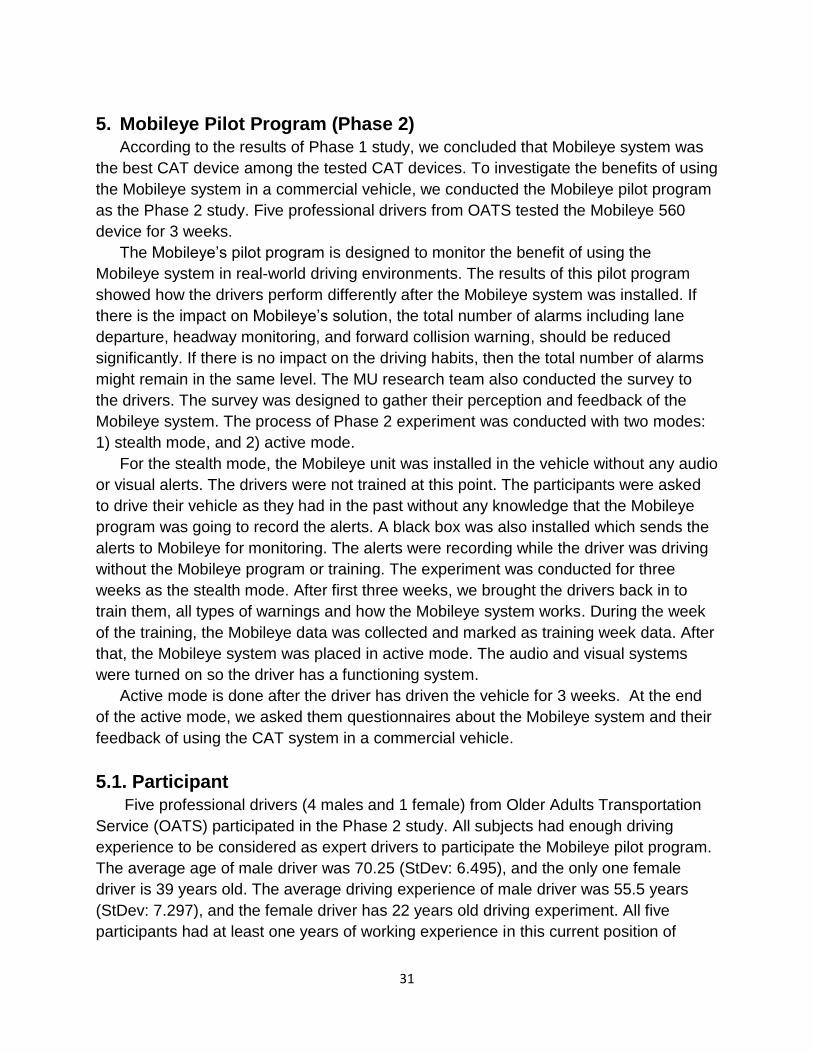
5. Mobileye Pilot Program (Phase 2)
According to the results of Phase 1 study, we concluded that Mobileye system was
the best CAT device among the tested CAT devices. To investigate the benefits of using
the Mobileye system in a commercial vehicle, we conducted the Mobileye pilot program
as the Phase 2 study. Five professional drivers from OATS tested the Mobileye 560
device for 3 weeks.
The Mobileye’s pilot program is designed to monitor the benefit of using the
Mobileye system in real-world driving environments. The results of this pilot program
showed how the drivers perform differently after the Mobileye system was installed. If
there is the impact on Mobileye’s solution, the total number of alarms including lane
departure, headway monitoring, and forward collision warning, should be reduced
significantly. If there is no impact on the driving habits, then the total number of alarms
might remain in the same level. The MU research team also conducted the survey to
the drivers. The survey was designed to gather their perception and feedback of the
Mobileye system. The process of Phase 2 experiment was conducted with two modes:
1) stealth mode, and 2) active mode.
For the stealth mode, the Mobileye unit was installed in the vehicle without any audio
or visual alerts. The drivers were not trained at this point. The participants were asked
to drive their vehicle as they had in the past without any knowledge that the Mobileye
program was going to record the alerts. A black box was also installed which sends the
alerts to Mobileye for monitoring. The alerts were recording while the driver was driving
without the Mobileye program or training. The experiment was conducted for three
weeks as the stealth mode. After first three weeks, we brought the drivers back in to
train them, all types of warnings and how the Mobileye system works. During the week
of the training, the Mobileye data was collected and marked as training week data. After
that, the Mobileye system was placed in active mode. The audio and visual systems
were turned on so the driver has a functioning system.
Active mode is done after the driver has driven the vehicle for 3 weeks. At the end
of the active mode, we asked them questionnaires about the Mobileye system and their
feedback of using the CAT system in a commercial vehicle.
5.1. Participant
Five professional drivers (4 males and 1 female) from Older Adults Transportation
Service (OATS) participated in the Phase 2 study. All subjects had enough driving
experience to be considered as expert drivers to participate the Mobileye pilot program.
The average age of male driver was 70.25 (StDev: 6.495), and the only one female
driver is 39 years old. The average driving experience of male driver was 55.5 years
(StDev: 7.297), and the female driver has 22 years old driving experiment. All five
participants had at least one years of working experience in this current position of
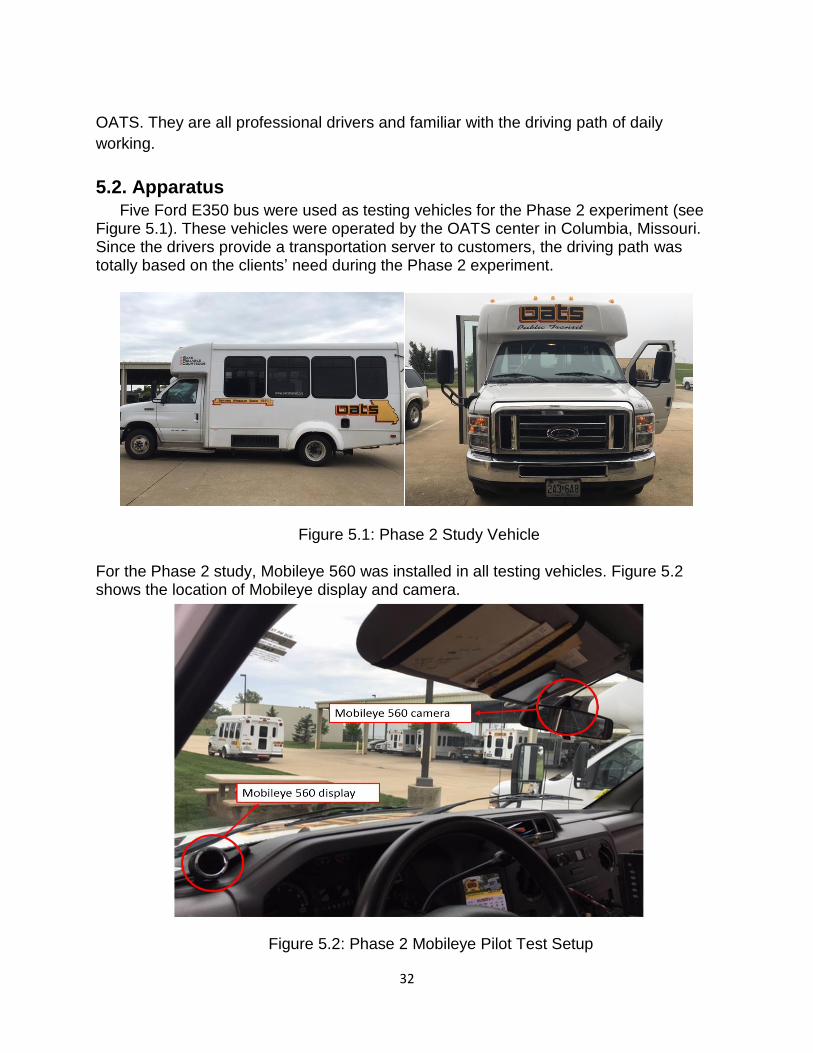
32
OATS. They are all professional drivers and familiar with the driving path of daily
working.
5.2. Apparatus
Five Ford E350 bus were used as testing vehicles for the Phase 2 experiment (see Figure 5.1). These vehicles were operated by the OATS center in Columbia, Missouri. Since the drivers provide a transportation server to customers, the driving path was totally based on the clients’ need during the Phase 2 experiment.
Figure 5.1: Phase 2 Study Vehicle
For the Phase 2 study, Mobileye 560 was installed in all testing vehicles. Figure 5.2 shows the location of Mobileye display and camera.
Figure 5.2: Phase 2 Mobileye Pilot Test Setup
33
5.3. Measure
5.3.1. Warning Report
After completing the stealth mode and active mode, the warning report, which
contained the total number of alarm for each week, was provided as the result of the
pilot program. This report helped us to see the effect of the Mobileye system while
driving. Comparison between the stealth mode warning data and the active mode
warning data showed a measurable outcome, such as normalized alerts/ 100 miles and
a total number of warnings per day.
5.3.2. Questionnaires
The MU research team designed and conducted a user perception and opinion
survey for the Mobileye 560 device. The survey contained 30 questions, including
demographic information, driving experience and perceptive measures scale. We visited
OATS center three times to hand out the questionnaires. The drivers were asked to
answer the questions and provided feedback. All the questions were related to user’s
feeling and experience of Mobileye 560 during the pilot program. In addition, some
questions were designed to analyze user’s acceptance and willingness of driving with
the Mobileye 560 device. The measuring scale was from point 1 to 7. The larger rating
score represented a better user experience.
5.3.3. User Acceptance Model
In the questionnaires, some questions were designed to calculate the user
acceptance level of the Mobileye system. Based on the research done by Son and Park
(2015), the drivers were asked for their feeling about the system in terms of ‘safe,'
‘desirable,' ‘pleasant’, and ‘comfort.' In the user acceptance model, ‘Safe’ represents the
level of feeling safe while using the system. ‘Desirable’ denotes the rate of driver’s
interest to use the system after the test. ‘Pleasant’ reflects the driver’s preference level
of this technology. ‘Comfort’ reflects the level of tranquility about the technology. Among
these four subjective experiences of feeling, ‘safe’ and ‘desirable’ represent positive
responses, while ‘unpleasant’ and ‘annoying’ indicate negative feedback. The
Technology Acceptance Model (TAM) was also used to quantify the computer-related
technology acceptance behaviors (A) of the user. It consists of perceived usefulness (U)
and perceived ease of use (EOU).
𝐴 = 𝑈 + 𝐸𝑂𝑈 (5)
The usefulness (U) is based on ‘safe’ and ‘desirable’ rating scale from the participant’s
response.
𝑈 = (𝑆𝑠𝑎𝑓𝑒 + 𝑆𝑑𝑒𝑠𝑖𝑟𝑎𝑏𝑙𝑒)/2 (6)
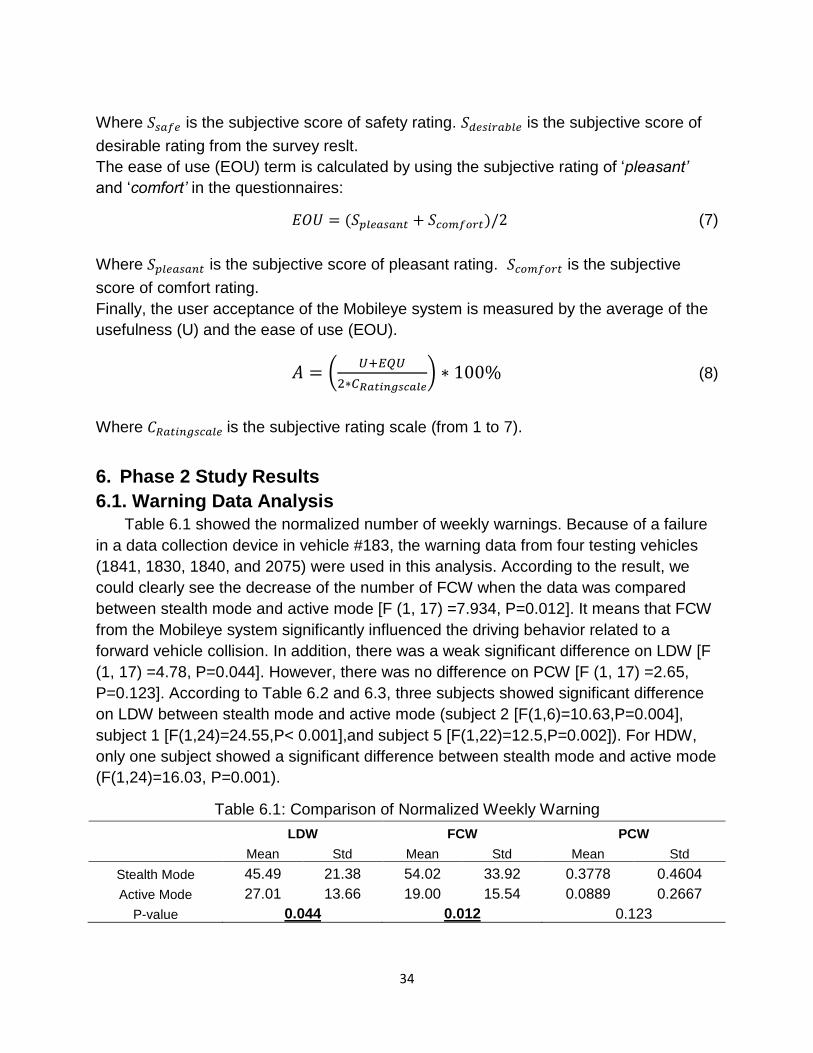
34
Where 𝑆𝑠𝑎𝑓𝑒 is the subjective score of safety rating. 𝑆𝑑𝑒𝑠𝑖𝑟𝑎𝑏𝑙𝑒 is the subjective score of
desirable rating from the survey reslt.
The ease of use (EOU) term is calculated by using the subjective rating of ‘pleasant’
and ‘comfort’ in the questionnaires:
𝐸𝑂𝑈 = (𝑆𝑝𝑙𝑒𝑎𝑠𝑎𝑛𝑡 + 𝑆𝑐𝑜𝑚𝑓𝑜𝑟𝑡)/2 (7)
Where 𝑆𝑝𝑙𝑒𝑎𝑠𝑎𝑛𝑡 is the subjective score of pleasant rating. 𝑆𝑐𝑜𝑚𝑓𝑜𝑟𝑡 is the subjective
score of comfort rating.
Finally, the user acceptance of the Mobileye system is measured by the average of the
usefulness (U) and the ease of use (EOU).
𝐴 = (𝑈+𝐸𝑄𝑈
2∗𝐶𝑅𝑎𝑡𝑖𝑛𝑔𝑠𝑐𝑎𝑙𝑒) ∗ 100% (8)
Where 𝐶𝑅𝑎𝑡𝑖𝑛𝑔𝑠𝑐𝑎𝑙𝑒 is the subjective rating scale (from 1 to 7).
6. Phase 2 Study Results
6.1. Warning Data Analysis
Table 6.1 showed the normalized number of weekly warnings. Because of a failure
in a data collection device in vehicle #183, the warning data from four testing vehicles
(1841, 1830, 1840, and 2075) were used in this analysis. According to the result, we
could clearly see the decrease of the number of FCW when the data was compared
between stealth mode and active mode [F (1, 17) =7.934, P=0.012]. It means that FCW
from the Mobileye system significantly influenced the driving behavior related to a
forward vehicle collision. In addition, there was a weak significant difference on LDW [F
(1, 17) =4.78, P=0.044]. However, there was no difference on PCW [F (1, 17) =2.65,
P=0.123]. According to Table 6.2 and 6.3, three subjects showed significant difference
on LDW between stealth mode and active mode (subject 2 [F(1,6)=10.63,P=0.004],
subject 1 [F(1,24)=24.55,P< 0.001],and subject 5 [F(1,22)=12.5,P=0.002]). For HDW,
only one subject showed a significant difference between stealth mode and active mode
(F(1,24)=16.03, P=0.001).
Table 6.1: Comparison of Normalized Weekly Warning
LDW FCW PCW
Mean Std Mean Std Mean Std
Stealth Mode 45.49 21.38 54.02 33.92 0.3778 0.4604
Active Mode 27.01 13.66 19.00 15.54 0.0889 0.2667
P-value 0.044 0.012 0.123
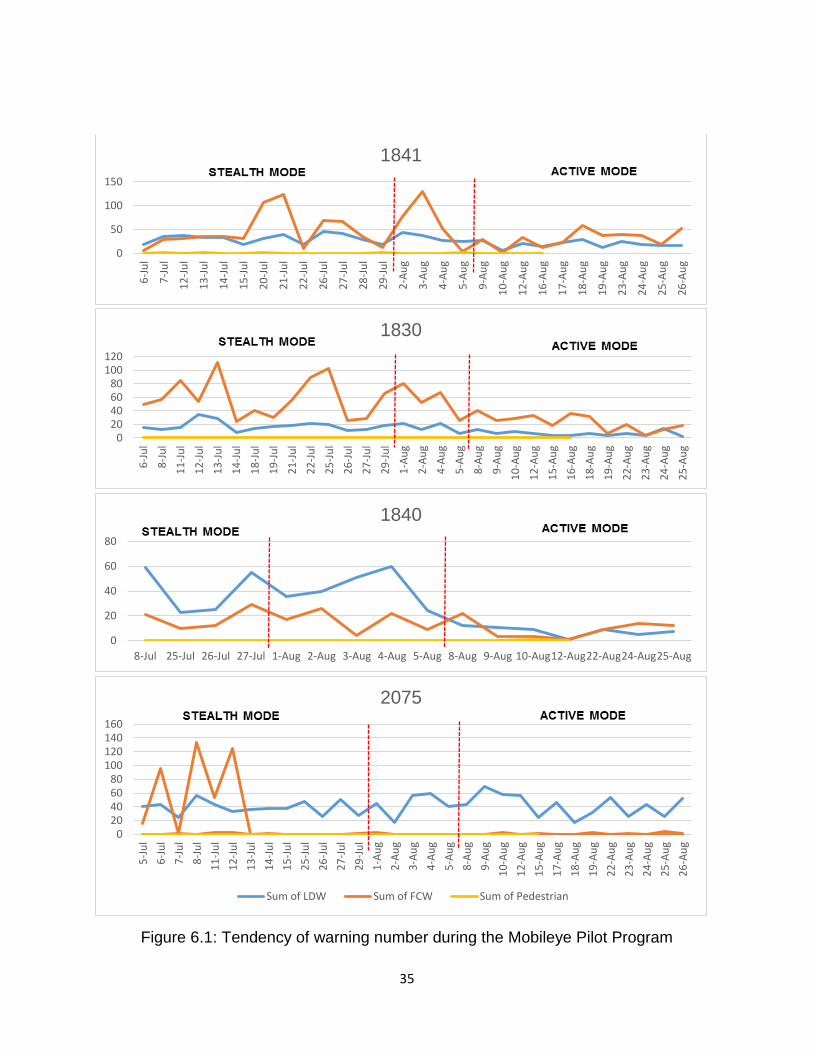
35
Figure 6.1: Tendency of warning number during the Mobileye Pilot Program
0
50
100
150
6-J
ul
7-J
ul
12
-Ju
l
13
-Ju
l
14
-Ju
l
15
-Ju
l
20
-Ju
l
21
-Ju
l
22
-Ju
l
26
-Ju
l
27
-Ju
l
28
-Ju
l
29
-Ju
l
2-A
ug
3-A
ug
4-A
ug
5-A
ug
9-A
ug
10
-Au
g
12
-Au
g
16
-Au
g
17
-Au
g
18
-Au
g
19
-Au
g
23
-Au
g
24
-Au
g
25
-Au
g
26
-Au
g
1841
020406080
100120
6-J
ul
8-J
ul
11
-Ju
l
12
-Ju
l
13
-Ju
l
14
-Ju
l
18
-Ju
l
19
-Ju
l
21
-Ju
l
22
-Ju
l
25
-Ju
l
26
-Ju
l
27
-Ju
l
29
-Ju
l
1-A
ug
2-A
ug
4-A
ug
5-A
ug
8-A
ug
9-A
ug
10
-Au
g
12
-Au
g
15
-Au
g
16
-Au
g
18
-Au
g
19
-Au
g
22
-Au
g
23
-Au
g
24
-Au
g
25
-Au
g
1830
0
20
40
60
80
8-Jul 25-Jul 26-Jul 27-Jul 1-Aug 2-Aug 3-Aug 4-Aug 5-Aug 8-Aug 9-Aug 10-Aug12-Aug22-Aug24-Aug25-Aug
1840
020406080
100120140160
5-J
ul
6-J
ul
7-J
ul
8-J
ul
11
-Ju
l
12
-Ju
l
13
-Ju
l
14
-Ju
l
15
-Ju
l
25
-Ju
l
26
-Ju
l
27
-Ju
l
29
-Ju
l
1-A
ug
2-A
ug
3-A
ug
4-A
ug
5-A
ug
8-A
ug
9-A
ug
10
-Au
g
12
-Au
g
15
-Au
g
17
-Au
g
18
-Au
g
19
-Au
g
22
-Au
g
23
-Au
g
24
-Au
g
25
-Au
g
26
-Au
g
2075
Sum of LDW Sum of FCW Sum of Pedestrian
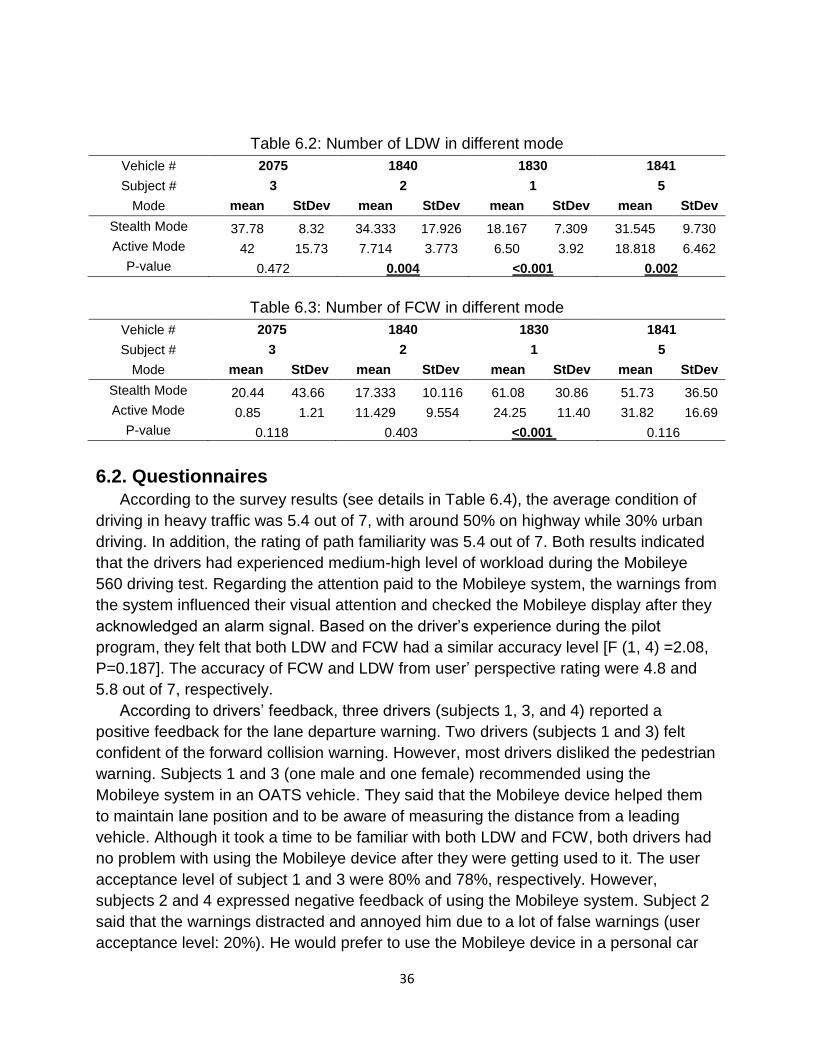
36
Table 6.2: Number of LDW in different mode
Vehicle # 2075 1840 1830 1841
Subject # 3 2 1 5
Mode mean StDev mean StDev mean StDev mean StDev
Stealth Mode 37.78 8.32 34.333 17.926 18.167 7.309 31.545 9.730
Active Mode 42 15.73 7.714 3.773 6.50 3.92 18.818 6.462
P-value 0.472 0.004 <0.001 0.002
Table 6.3: Number of FCW in different mode
Vehicle # 2075 1840 1830 1841
Subject # 3 2 1 5
Mode mean StDev mean StDev mean StDev mean StDev
Stealth Mode 20.44 43.66 17.333 10.116 61.08 30.86 51.73 36.50
Active Mode 0.85 1.21 11.429 9.554 24.25 11.40 31.82 16.69
P-value 0.118 0.403 <0.001 0.116
6.2. Questionnaires
According to the survey results (see details in Table 6.4), the average condition of
driving in heavy traffic was 5.4 out of 7, with around 50% on highway while 30% urban
driving. In addition, the rating of path familiarity was 5.4 out of 7. Both results indicated
that the drivers had experienced medium-high level of workload during the Mobileye
560 driving test. Regarding the attention paid to the Mobileye system, the warnings from
the system influenced their visual attention and checked the Mobileye display after they
acknowledged an alarm signal. Based on the driver’s experience during the pilot
program, they felt that both LDW and FCW had a similar accuracy level [F (1, 4) =2.08,
P=0.187]. The accuracy of FCW and LDW from user’ perspective rating were 4.8 and
5.8 out of 7, respectively.
According to drivers’ feedback, three drivers (subjects 1, 3, and 4) reported a
positive feedback for the lane departure warning. Two drivers (subjects 1 and 3) felt
confident of the forward collision warning. However, most drivers disliked the pedestrian
warning. Subjects 1 and 3 (one male and one female) recommended using the
Mobileye system in an OATS vehicle. They said that the Mobileye device helped them
to maintain lane position and to be aware of measuring the distance from a leading
vehicle. Although it took a time to be familiar with both LDW and FCW, both drivers had
no problem with using the Mobileye device after they were getting used to it. The user
acceptance level of subject 1 and 3 were 80% and 78%, respectively. However,
subjects 2 and 4 expressed negative feedback of using the Mobileye system. Subject 2
said that the warnings distracted and annoyed him due to a lot of false warnings (user
acceptance level: 20%). He would prefer to use the Mobileye device in a personal car
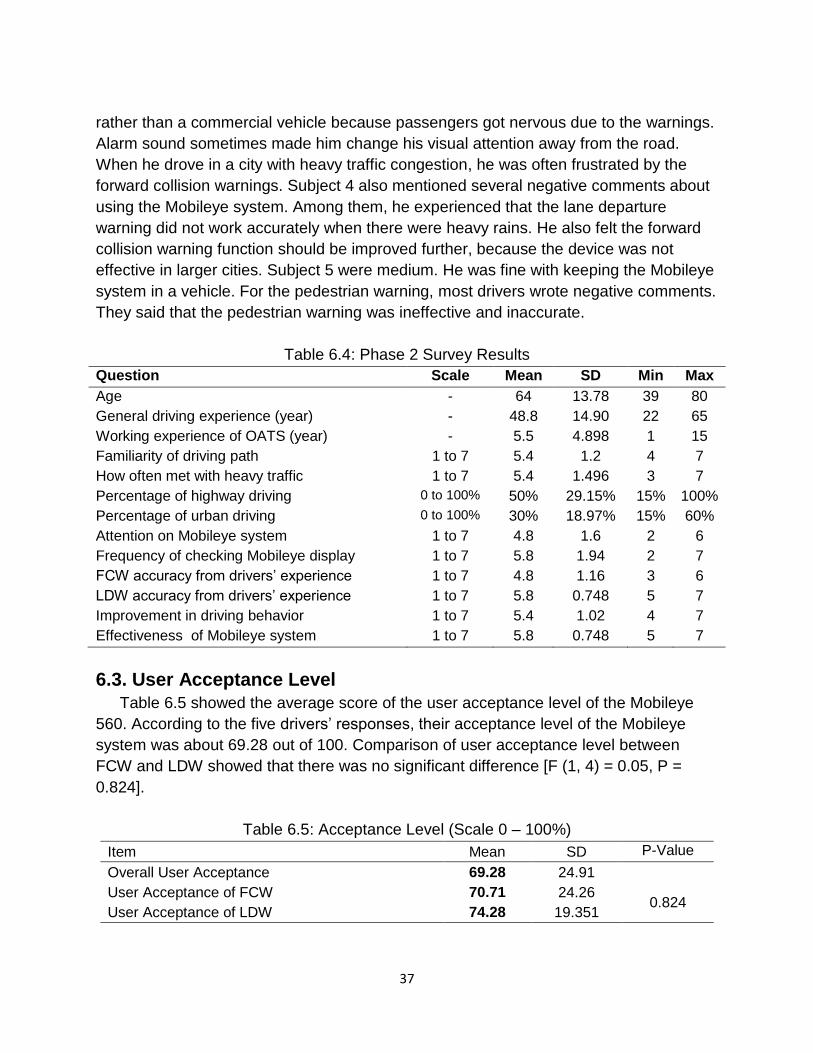
37
rather than a commercial vehicle because passengers got nervous due to the warnings.
Alarm sound sometimes made him change his visual attention away from the road.
When he drove in a city with heavy traffic congestion, he was often frustrated by the
forward collision warnings. Subject 4 also mentioned several negative comments about
using the Mobileye system. Among them, he experienced that the lane departure
warning did not work accurately when there were heavy rains. He also felt the forward
collision warning function should be improved further, because the device was not
effective in larger cities. Subject 5 were medium. He was fine with keeping the Mobileye
system in a vehicle. For the pedestrian warning, most drivers wrote negative comments.
They said that the pedestrian warning was ineffective and inaccurate.
Table 6.4: Phase 2 Survey Results
Question Scale Mean SD Min Max
Age - 64 13.78 39 80
General driving experience (year) - 48.8 14.90 22 65
Working experience of OATS (year) - 5.5 4.898 1 15
Familiarity of driving path 1 to 7 5.4 1.2 4 7
How often met with heavy traffic 1 to 7 5.4 1.496 3 7
Percentage of highway driving 0 to 100% 50% 29.15% 15% 100%
Percentage of urban driving 0 to 100% 30% 18.97% 15% 60%
Attention on Mobileye system 1 to 7 4.8 1.6 2 6
Frequency of checking Mobileye display 1 to 7 5.8 1.94 2 7
FCW accuracy from drivers’ experience 1 to 7 4.8 1.16 3 6
LDW accuracy from drivers’ experience 1 to 7 5.8 0.748 5 7
Improvement in driving behavior 1 to 7 5.4 1.02 4 7
Effectiveness of Mobileye system 1 to 7 5.8 0.748 5 7
6.3. User Acceptance Level
Table 6.5 showed the average score of the user acceptance level of the Mobileye
560. According to the five drivers’ responses, their acceptance level of the Mobileye
system was about 69.28 out of 100. Comparison of user acceptance level between
FCW and LDW showed that there was no significant difference [F (1, 4) = 0.05, P =
0.824].
Table 6.5: Acceptance Level (Scale 0 – 100%)
Item Mean SD P-Value
Overall User Acceptance 69.28 24.91
User Acceptance of FCW 70.71 24.26 0.824
User Acceptance of LDW 74.28 19.351
38
7. Discussion and Conclusion
7.1. Overview
This study investigated the likely effect of collision avoidance technology (CAT)
systems. During Phase 1, the effects of various styles of CAT systems were tested.
Several field trials of CAT systems were conducted in order to understand drivers’
responses regarding the lane departure warning (LDW) and the forward collision
warning (FCW). Twenty students from the University of Missouri – Columbia
participated in this experiment.
According to the results of the Phase 1 study, the Mobileye system was decided as
the best choice for the Phase 2 study. The objective of the Phase 2 study was to
estimate the potential benefits of implementing a CAT system for public transportation.
Five professional drivers from OATS participated in this study and tested the Mobileye
560 device for several weeks.
The results of Phase 1 and 2 studies showed that a CAT system was generally
accepted by drivers and appeared to have positive effects on their driving behavior. The
overall effectiveness of a CAT system was about 75%, and the acceptance was about
69%. However, we found several factors that could influence the effectiveness of a CAT
system. First, the drivers’ reliability was subjected to change over a period of time. After
the participants had repeatedly been exposed to warning signals, their responses to the
warnings were different from their initial reaction. Some participants became more
positive while others were not because they felt it as a nagging critique of their style of
driving. Secondly, the participants adjusted their reliability of a CAT system based on
the level of the false warning rate. During the Phase 1 experiment, after the drivers
experienced a high level of the false warning rate, they trusted the system less and
ignored the warnings more often. After the drivers continuously experienced a high false
warning rate, they considered warnings as a nuisance. Eventually, it significantly
reduced the effectiveness of the CAT systems. Third, it is more efficient to provide the
warnings through multiple cognitive channels instead of using a single cognitive
resource. According to the EMG data, we found that the drivers who used Audiovox
system (auditory alarm only) experienced a high level of psychophysiological stress
compared to others who tested the CAT device with the combination of visual and
sound alarm. Finally, the effectiveness of a CAT system could be significantly
influenced by weather and road conditions. Based on our data, the participants’
responses to LDW were significantly different between rural and highway driving. Also,
one of the OATS drivers reported that he was unpleasant to use a CAT system while
driving in heavy rain conditions.
All our findings indicated that it was extremely important to understand how drivers
set their threshold on whether to accept the warning signal. In addition, a CAT system
must be designed to minimize any potential distractions caused by the warning.

39
7.2. Main points
- The results of Phase 1 and 2 studies detailed in this report predict significant
crash reductions with the introduction of a CAT system.
- Eye tracking analysis showed that the existence of a visual warning and the
location of a visual display are very important to optimize the warning perception
and to minimize the distraction caused by the warnings from CAT systems.
- The device that provided only auditory warnings (e.g., the Audiovox LDWS 100),
is not recommended for a collision avoidance system. EMG data results revealed
that the warnings became a nuisance and distracted drivers.
- NASA-TLX results showed that none of the tested CAT devices increased the
driver’s perceived workload during the Phase 1 experiment.
- A radar sensor with expansive fields of view (the RD-140) provided greater
results for detecting a forward collision, but it also increased the false-positive
responses.
- The best CAT systems marked 72% (the Mobileye 560) and 73% (the RD-140) of
effective warning acceptance and 40% (the Mobileye 560) and 43% (the RD-140)
of false-positive responses.
- According to the sensitivity analysis results, the effectiveness of LDW and FCW
were 76% and 74.5%, respectively.
- The average reaction time of FCW (2.81sec) was slower than the average
reaction time of LDW (1.20 sec). According to the research done by Sivak, Post,
Olson, and Donohue (1981), the recommended reaction time is 1.25 ( ± 0.6)
seconds to properly respond unpredicted events.
- As many as 75% of drivers (3 out of 4) showed significant differences in driving
behavior after they used a CAT device (the Mobileye 560).
- Sixty percent of drivers (3 out of 5) reported a positive feedback for the lane
departure warning. Forty percent of drivers (2 out of 5) felt confident of the
forward collision warning. However, most drivers disliked the pedestrian warning.
- The OATS drivers reported a 69.28% of acceptance level of using the Mobileye
560 device.
7.3. Limitations
While this study successfully quantified the effectiveness of a CAT system, there
are several identified limitations. First, this study only considered a limited age group of
drivers. According to the research done by Son et al. (2015), an advanced driver
assistance system is more effective to older drivers over age 70. Future research
should consider recruiting the entire age group. Second, although we were able to
estimate the benefits of using a CAT system through analysis of survey and
experimental data, it was impossible to predict the reduction rate of vehicle crashes
40
without simulations or closed-course driving experiments. Hence, for future study, we
need to simulate the near crash and crash scenarios in different traffic and weather
conditions to understand the important form factors that increase the effectiveness of a
CAT system. Third, other collision avoidance technologies, such as LIDAR, autonomous
emergency braking, traffic jam assist, super cruise, free space detection, and animal
detection, should be tested. Finally, it is recommended that future research evaluate the
CAT systems for longer duration of time to see if the acceptance and effectiveness of
the systems change over time.
7.4. Conclusion and Recommendations
This study investigated the acceptance and the effectiveness of CAT systems
through on-road field operational tests using eye tracking, EMG, HD-cam 360 degree
video, and survey data. The Phase 1 study involved an open-course driving experiment
in a passenger vehicle, and the Phase 2 study was conducted on OATS drivers in a
public transportation service vehicle. The results have conclusively shown that CAT
systems are effective in improving driving behavior. However, there is still room for
improvement in terms of the effectiveness and the user acceptance level.
In general, a CAT system senses other road users and intervenes if the system
detects possible crash conditions. According to the study, the greatest benefit was
predicted to result from systems that combine auditory and visual alarms, with a user-
friendly UI display unit, and wide angle system. The CAT system should be designed to
minimize the probability of false warnings and to increase the effective warning rate.
Moreover, many drivers are subject to distraction. Hence, the warnings should not
create any distractions to drivers. Visual distraction is one of the key factors that affect
driving behavior (Bakowski, Davis, & Moroney, 2015). Since driver distraction
contributes to approximately 43% of motor-vehicle crashes, the warnings should be
designed to avoid any visual distractions.
It can be concluded that it is essential to evaluate how a driver uses new in-vehicle
technology to avoid unexpected negative impacts and provide appropriate safety
parameters. Encouragement should be given to drivers in installing the CAT systems as
doing this shows satisfactory effectiveness and acceptance level. Finally, we
recommend several points to improve the effectiveness of the CAT system.
- Encourage the creation of performance standards for the device’s reliability
measuring the effectiveness of the CAT system.
- Design the CAT system to maximize the effective warning rate and minimize the
false warning rate.
- For the lane departure warning, it is highly recommended to test another
cognitive stimulus instead of an auditory alarm. When people drove in heavy
traffic, the alarm sound often annoyed and distracted them. According to the
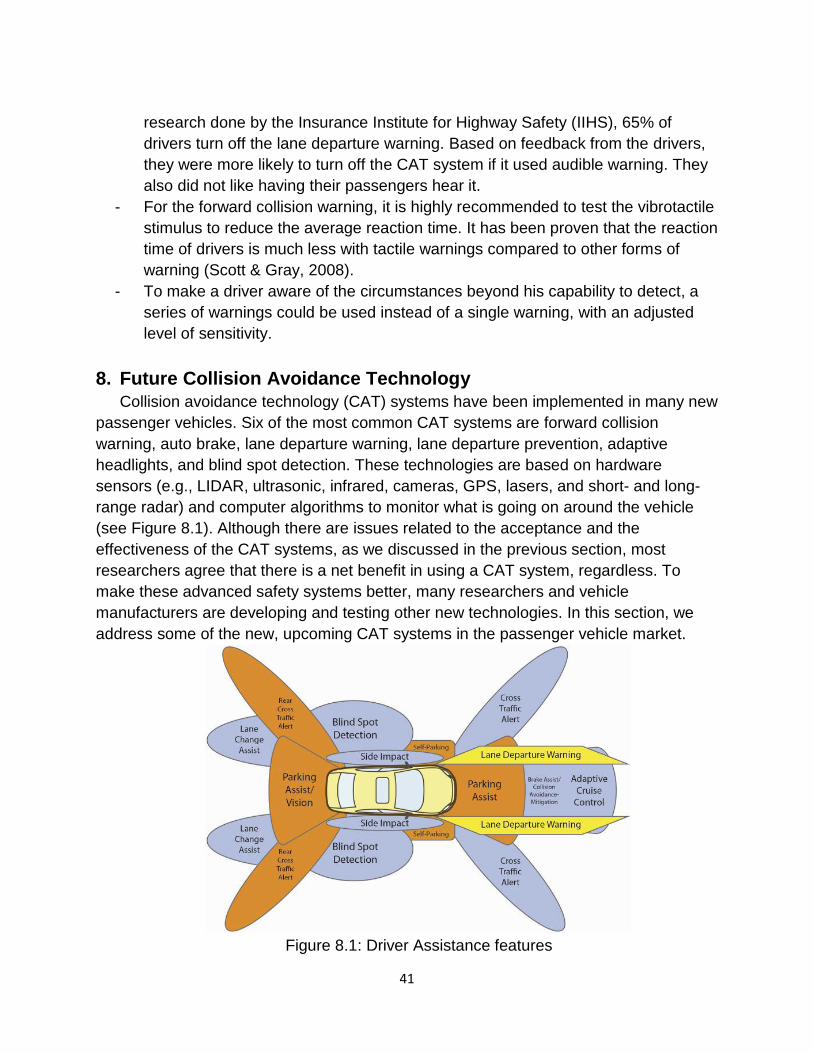
41
research done by the Insurance Institute for Highway Safety (IIHS), 65% of
drivers turn off the lane departure warning. Based on feedback from the drivers,
they were more likely to turn off the CAT system if it used audible warning. They
also did not like having their passengers hear it.
- For the forward collision warning, it is highly recommended to test the vibrotactile
stimulus to reduce the average reaction time. It has been proven that the reaction
time of drivers is much less with tactile warnings compared to other forms of
warning (Scott & Gray, 2008).
- To make a driver aware of the circumstances beyond his capability to detect, a
series of warnings could be used instead of a single warning, with an adjusted
level of sensitivity.
8. Future Collision Avoidance Technology
Collision avoidance technology (CAT) systems have been implemented in many new
passenger vehicles. Six of the most common CAT systems are forward collision
warning, auto brake, lane departure warning, lane departure prevention, adaptive
headlights, and blind spot detection. These technologies are based on hardware
sensors (e.g., LIDAR, ultrasonic, infrared, cameras, GPS, lasers, and short- and long-
range radar) and computer algorithms to monitor what is going on around the vehicle
(see Figure 8.1). Although there are issues related to the acceptance and the
effectiveness of the CAT systems, as we discussed in the previous section, most
researchers agree that there is a net benefit in using a CAT system, regardless. To
make these advanced safety systems better, many researchers and vehicle
manufacturers are developing and testing other new technologies. In this section, we
address some of the new, upcoming CAT systems in the passenger vehicle market.
Figure 8.1: Driver Assistance features
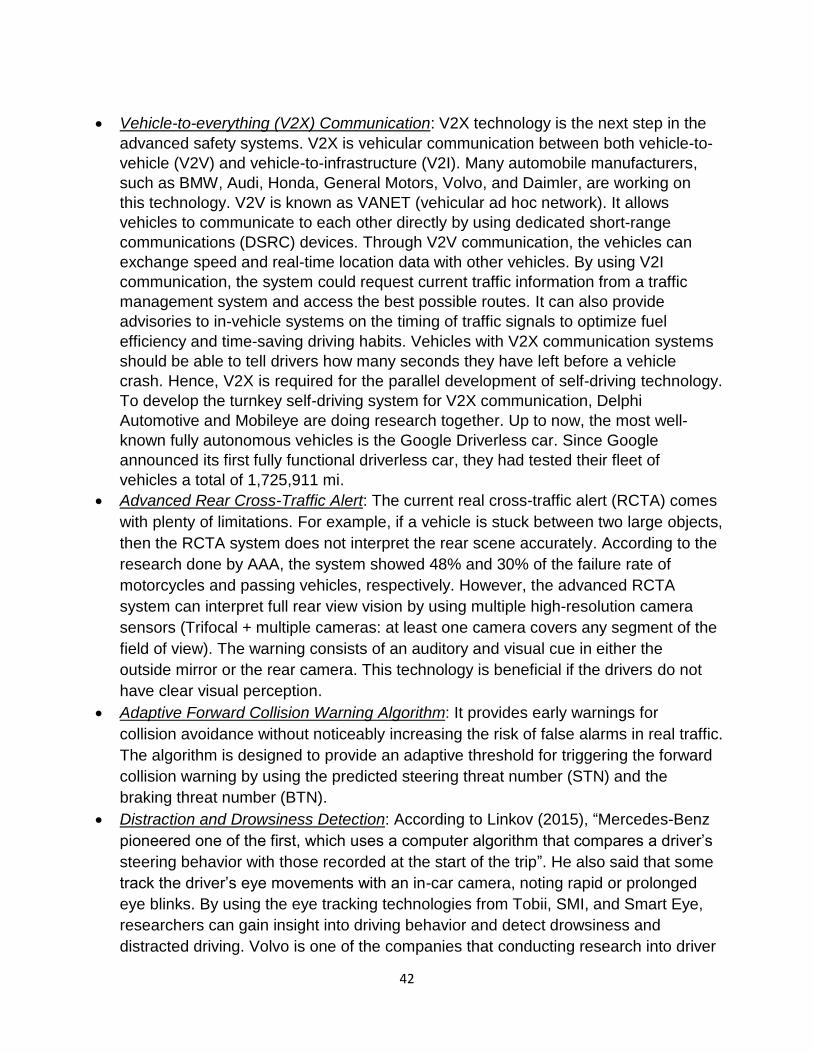
42
Vehicle-to-everything (V2X) Communication: V2X technology is the next step in the
advanced safety systems. V2X is vehicular communication between both vehicle-to-
vehicle (V2V) and vehicle-to-infrastructure (V2I). Many automobile manufacturers,
such as BMW, Audi, Honda, General Motors, Volvo, and Daimler, are working on
this technology. V2V is known as VANET (vehicular ad hoc network). It allows
vehicles to communicate to each other directly by using dedicated short-range
communications (DSRC) devices. Through V2V communication, the vehicles can
exchange speed and real-time location data with other vehicles. By using V2I
communication, the system could request current traffic information from a traffic
management system and access the best possible routes. It can also provide
advisories to in-vehicle systems on the timing of traffic signals to optimize fuel
efficiency and time-saving driving habits. Vehicles with V2X communication systems
should be able to tell drivers how many seconds they have left before a vehicle
crash. Hence, V2X is required for the parallel development of self-driving technology.
To develop the turnkey self-driving system for V2X communication, Delphi
Automotive and Mobileye are doing research together. Up to now, the most well-
known fully autonomous vehicles is the Google Driverless car. Since Google
announced its first fully functional driverless car, they had tested their fleet of
vehicles a total of 1,725,911 mi.
Advanced Rear Cross-Traffic Alert: The current real cross-traffic alert (RCTA) comes
with plenty of limitations. For example, if a vehicle is stuck between two large objects,
then the RCTA system does not interpret the rear scene accurately. According to the
research done by AAA, the system showed 48% and 30% of the failure rate of
motorcycles and passing vehicles, respectively. However, the advanced RCTA
system can interpret full rear view vision by using multiple high-resolution camera
sensors (Trifocal + multiple cameras: at least one camera covers any segment of the
field of view). The warning consists of an auditory and visual cue in either the
outside mirror or the rear camera. This technology is beneficial if the drivers do not
have clear visual perception.
Adaptive Forward Collision Warning Algorithm: It provides early warnings for
collision avoidance without noticeably increasing the risk of false alarms in real traffic.
The algorithm is designed to provide an adaptive threshold for triggering the forward
collision warning by using the predicted steering threat number (STN) and the
braking threat number (BTN).
Distraction and Drowsiness Detection: According to Linkov (2015), “Mercedes-Benz
pioneered one of the first, which uses a computer algorithm that compares a driver’s
steering behavior with those recorded at the start of the trip”. He also said that some
track the driver’s eye movements with an in-car camera, noting rapid or prolonged
eye blinks. By using the eye tracking technologies from Tobii, SMI, and Smart Eye,
researchers can gain insight into driving behavior and detect drowsiness and
distracted driving. Volvo is one of the companies that conducting research into driver
43
sensors to create cars that get to know their drivers. According to the article ("Volvo
Cars Conducts Research into Driver Sensors to Create Safer Cars,"), “through
systems that can recognize and distinguish whether a driver is tired or inattentive,
the eye tracking technology can detect closed eyes or what the driver is looking at.
By placing a sensor on the dashboard to monitor aspects such as in which direction
the driver is looking, how open their eyes are, as well as their head position and
angle, it is possible to develop precise safety systems that detect the driver’s state
and can adjust the car accordingly. This means that the car will ensure that it does
not stray out of the lane or get too close to the car in front when the driver is not
paying attention, as well as being able to wake a driver who is falling asleep”.
Driver Alcohol Detection System: This system prevents alcohol-impaired driving in a
transparent manner. Researchers developed two different technological approaches
(breath-based and touch-based systems) to measuring driver alcohol level. A touch-
based approach detects alcohol in human tissue. For a breath-based approach, it
allows assessment of alcohol concentration in the exhaled breath.
Vibrotactile System: It consists of several vibrating elements or tactors mounted in a
driver’s seat, wheel, or wearable display. The tactile feedback can significantly
reduce the driver’s workload compared to visual or auditory feedback, particularly in
the high traffic condition. Recently, General Motors is testing a new lane departure
warning system that sends vibrations to the driver’s seat when he or she
unintentionally begins to depart from the current lane. They are also testing a
wearable vibrotactile display for automotive route guidance.
Evolution of Sensing: the improvement of sensing technology could also increase
road safety as well. The current mono front-facing camera can detect up to a 50-
degree angle. The engineers from Mobileye Company predict that the angle will be
wider (The year 2018: 75 degree, The year 2019: 100 degree). In addition, the
resolution of camera sensor will go up to 7 megapixels with a low light sensitivity
function in Year 2020.
In conclusion, there are many others developing high-end safety functions to improve
the effectiveness of collision avoidance technologies, such as semi-autonomous
highway driving, called Super Cruise, free space detection path delimiters, animal
detection, and traffic jam assistance. However, we need to understand about these
systems to make sure that all technologies are working as expected, not only on test
track performance but also on open road effects.
44
9. References Abe, G., & Richardson, J. (2006). The influence of alarm timing on driver response to collision
warning systems following system failure. Behaviour & Information Technology, 25(5), 443-452.
Bakowski, D. L., Davis, S. T., & Moroney, W. F. (2015). Reaction Time and Glance Behavior of Visually Distracted Drivers to an Imminent Forward Collision as a Function of Training, Auditory Warning, and Gender. Procedia Manufacturing, 3, 3238-3245.
Bansevicius, D., Westgaard, R. H., & Jensen, C. (1997). Mental Stress of Long Duration: EMG
Activity, Perceived Tension, Fatigue, and Pain Development in Pain‐Free Subjects. Headache: The Journal of Head and Face Pain, 37(8), 499-510.
Brookhuis, K. A., & de Waard, D. (2010). Monitoring drivers’ mental workload in driving simulators using physiological measures. Accident Analysis & Prevention, 42(3), 898-903.
Burge, R. J. (2015). Using fuzzy signal detection theory to assess the impact of text messaging on drivers' hazard perception ability.
Caley, M., & Georgiou, P. (2004). APPLICATION OF SIGNAL DETECTION THEORY TO ALARM AUDIBILITY IN A LOCOMOTIVE CABIN ENVIRONMENT.
Cao, A., Chintamani, K. K., Pandya, A. K., & Ellis, R. D. (2009). NASA TLX: Software for assessing subjective mental workload. Behavior research methods, 41(1), 113-117.
De Waard, D., & Studiecentrum, V. (1996). The measurement of drivers' mental workload: Groningen University, Traffic Research Center Netherlands.
Ellison, A., Greaves, S., & Bliemer, M. (2013). Examining heterogeneity of driver behavior with temporal and spatial factors. Transportation Research Record: Journal of the Transportation Research Board(2386), 158-167.
Green, D., & Swets, J. (1966). Signal detection theory and psychophysics. 1966. New York, 888, 889.
Hancock, P., Williams, G., & Manning, C. (1995). Influence of task demand characteristics on workload and performance. The International Journal of Aviation Psychology, 5(1), 63-86.
Haque, M. M., Ohlhauser, A. D., Washington, S., & Boyle, L. N. (2015). Decisions and actions of distracted drivers at the onset of yellow lights. Accident Analysis & Prevention.
Hart, S. G., & Staveland, L. E. (1988). Development of NASA-TLX (Task Load Index): Results of empirical and theoretical research. Advances in psychology, 52, 139-183.
Hoover, R. L. D., Rao, S. J., Howe, G., & Barickman, F. S. (2014). Heavy-vehicle lane departure warning test development. Retrieved from
Linkov, J. (2015). Collision-Avoidance System Are Changing the Look of Car Safety. https://www.yahoo.com/news/collision-avoidance-systems-changing-look-car-safety-...
Maltz, M., & Shinar, D. (2004). Imperfect in-vehicle collision avoidance warning systems can aid drivers. Human Factors: The Journal of the Human Factors and Ergonomics Society, 46(2), 357-366.
Matsuno, S., Terasaki, T., Aizawa, S., Mizuno, T., Mito, K., & Itakura, N. (2016). Physiological and Psychological Evaluation by Skin Potential Activity Measurement Using Steering Wheel While Driving. Paper presented at the International Conference on Human-Computer Interaction.
McGehee, D. V., Mazzae, E. N., & Baldwin, G. S. (2000). Driver reaction time in crash avoidance research: Validation of a driving simulator study on a test track. Paper presented at the Proceedings of the human factors and ergonomics society annual meeting.
45
Mesken, J., Hagenzieker, M. P., Rothengatter, T., & de Waard, D. (2007). Frequency, determinants, and consequences of different drivers’ emotions: An on-the-road study using self-reports,(observed) behaviour, and physiology. Transportation research part F: traffic psychology and behaviour, 10(6), 458-475.
Nevin, J. A. (1969). SIGNAL DETECTION THEORY AND OPERANT BEHAVIOR: A Review of David M. Green and John A. Swets' Signal Detection Theory and Psychophysics. 1. Journal of the Experimental Analysis of Behavior, 12(3), 475-480.
NHTSA (Producer). (2016, August). 2014 Motor Vehicle Crashes: Overview. Traffic Safety Facts.
Palat, B., & Delhomme, P. (2016). A simulator study of factors influencing drivers’ behavior at traffic lights. Transportation research part F: traffic psychology and behaviour, 37, 107-118.
Scott, J., & Gray, R. (2008). A comparison of tactile, visual, and auditory warnings for rear-end collision prevention in simulated driving. Human Factors: The Journal of the Human Factors and Ergonomics Society, 50(2), 264-275.
Sivak, M., Post, D. V., Olson, P. L., & Donohue, R. J. (1981). Driver responses to high-mounted brake lights in actual traffic. Human Factors: The Journal of the Human Factors and Ergonomics Society, 23(2), 231-235.
Son, J., Park, M., & Park, B. B. (2015). The effect of age, gender and roadway environment on the acceptance and effectiveness of Advanced Driver Assistance Systems. Transportation research part F: traffic psychology and behaviour, 31, 12-24.
Stanton, N. A. (2006). Hierarchical task analysis: Developments, applications, and extensions. Applied ergonomics, 37(1), 55-79.
Volvo Cars Conducts Research into Driver Sensors to Create Safer Cars. (2014). from Volvo Car USA https://www.media.volvocars.com/us/en-us/media/pressreleases/140898/volvo-cars-conducts-research-into-driver-sensors-to-create-safer-cars
Wolf, Y., Algom, D., & Lewin, I. (1988). A signal detection theory analysis of a driving decision task: Spatial gap acceptance. Perceptual and Motor Skills, 66(3), 683-702.
Yan, X., Xue, Q., Ma, L., & Xu, Y. (2014). Driving-simulator-based test on the effectiveness of auditory red-light running vehicle warning system based on time-to-collision sensor. Sensors, 14(2), 3631-3651.
Zhang, J., & Mueller, S. T. (2005). A note on ROC analysis and non-parametric estimate of sensitivity. Psychometrika, 70(1), 203-212.
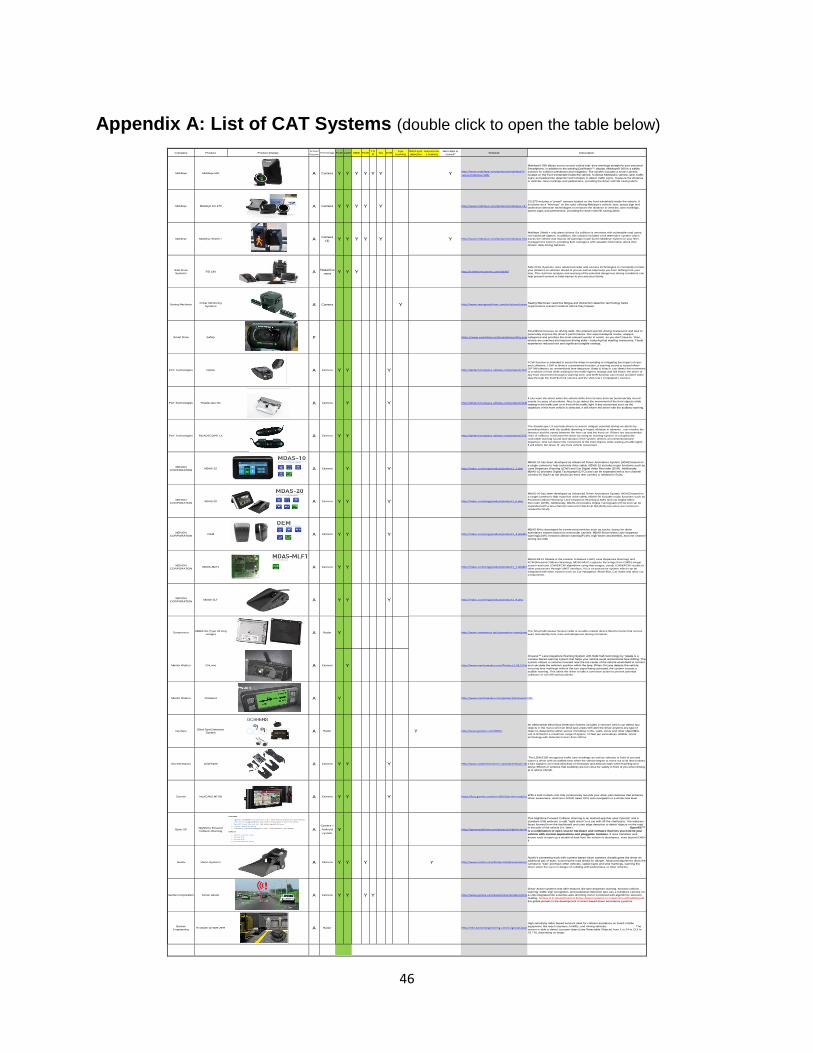
46
Appendix A: List of CAT Systems (double click to open the table below)
Company Product Product DisplayActive/
PassiveTechnology FCW LDW HMW PCW
TS
RSLI DVR
Eye
tracking
Blind spot
detection
Autonomou
s braking
Alert data is
stored?Website Description
Mobileye Mobileye 560 A Camera Y Y Y Y Y Y Yhttp://www.mobileye.com/products/mobileye-5-
series/mobileye-560/
Mobileye® 560 allows you to receive critical real- time warnings straight to your personal
Smartphone, in addition to the existing EyeWatch™ display. Mobileye® 560 is a safety
solution for collision prevention and mitigation. The system includes a smart camera
located on the front windshield inside the vehicle. It utilizes Mobileye’s vehicle, lane, traffic
signs and pedestrian detection technologies to detect traffic signs, measure the distance
to vehicles, lane markings and pedestrians, providing the driver with life saving alerts.
Mobileye Mobileye C2-270 A Camera Y Y Y Y Y http://www.mobileye.com/products/mobileye-c2-series/mobileye-c2-270/
C2-270 includes a “smart” camera located on the front windshield inside the vehicle. It
functions as a “third eye” on the road, utilizing Mobileye’s vehicle, lane, speed sign and
pedestrian detection technologies to measure the distance to vehicles, lane markings,
speed signs and pedestrians, providing the driver with life saving alerts.
Mobileye Mobileye Shield + ACamera
(4) Y Y Y Y Y Y http://www.mobileye.com/products/mobileye-shield-plus/
Mobileye Shield + only alerts drivers if a collision is imminent with vulnerable road users,
not inanimate objects. In addition, this solution includes a full telematics system which
tracks the vehicle and reports all warnings made by the Mobileye System to your fleet
management system, providing fleet managers with valuable information about their
drivers’ daily driving behavior.
Safe Drive
SystemsRD 140 A
Radar/Ca
mera Y Y Y http://safedrivesystems.com/rd140/
Safe Drive Systems uses advanced radar and camera technologies to constantly monitor
your distance to vehicles ahead of you as well as help keep you from drifting from your
lane. The real-time analysis and warning of the potential dangerous driving conditions can
help prevent serious or fatal injuries to you and your family
Seeing MachinesDriver Monitoring
Systems A Camera Y http://www.seeingmachines.com/solutions/automotive/Seeing Machines’ real-time fatigue and distraction detection technology helps
organizations prevent incidents before they happen.
Smart Drive Safety P https://www.smartdrive.net/smartdrivesafety.aspx
SmartDrive focuses on driving skills. We pinpoint specific driving maneuvers and how to
personally improve the driver’s performance. Our expert analysts review, analyze,
categorize and prioritize the most relevant events to coach, so you don’t have to. Then,
drivers are coached and improve driving skills—reducing fuel wasting maneuvers. Fleets
experience reduced risk and significant tangible savings.
PLK Technologies Optian A Camera Y Y Y http://plktech.trustpass.alibaba.com/product/167564497-10678079/OPTIAN.html
FCW function is intended to assist the driver in avoiding or mitigating the impact of rear-
end collisions. LDW is driver's convenience function; a warning sound is issued when
OPTIAN detects an unintentional lane departure. Beep & Watch can detect the movement
of a vehicle in front while waiting for the traffic light to change and will inform the driver of
any front movement through a warning tone, and DVR function can record accident video
data through the Full-HD front camera and the VGA rear ( if equipped ) camera.
PLK Technologies Roadscope XG A Camera Y Y http://plktech.trustpass.alibaba.com/product/114856900-10967679/Roadscope_XG.html
It can warn the driver when the vehicle drifts from its lane and can automatically record
events in cases of accidents. Also it can detect the movement of the front objects while
waiting in the traffic jam or in front of the traffic light. If any movement such as the
departure of the front vehicle is detected, it will inform the driver with the auditory warning.
PLK Technologies ROADSCOPE LX A Camera Y Y http://plktech.trustpass.alibaba.com/product/123706906-10967679/ROADSCOPE_LX.html
The Roadscope LX can help drivers to avoid / mitigate potential driving accidents by
providing drivers with the audible alarming or haptic vibration in advance . can monitor the
distance and the speed between the host car and the front car. If there are any potential
risks of collision, it will warn the driver by using its warning system. It can generate
noticeable warning sound and vibration if the system detects an unintentional lane
departure. And can detect the movement of the front objects while waiting at traffic lights .
It will inform the driver of any front vehicle movement .
MOVON
CORPORATIONMDAS-10 A Camera Y Y http://mdas.co.kr/eng/product/product1_1.php
MDAS-10 has been developed as Advanced Driver Assistance System (ADAS) based on
a single camera to help motorists drive safely. MDAS-10 includes major functions such as
Lane Departure Warning (LDW) and Car Digital Video Recorder (DVR). Additionally,
MDAS-10 provides Digital Tachograph (DTG) and can be expanded with a two-channel
camera for Back-Up Aid (BUA) (an extra rear camera is needed for BUA).
MOVON
CORPORATIONMDAS-20 A Camera Y Y Y http://mdas.co.kr/eng/product/product1_6.php
MDAS-20 has been developed as Advanced Driver Assistance System (ADAS) based on
a single camera to help motorists drive safely. MDAS-20 includes major functions such as
Forward Collision Warning, Lane Departure Warning (LDW) and Car Digital Video
Recorder (DVR). Additionally, MDAS-20 provides Digital Tachograph (DTG) and can be
expanded with a two-channel camera for Back-Up Aid (BUA) (an extra rear camera is
needed for BUA).
MOVON
CORPORATIONOEM A Camera Y Y Y http://mdas.co.kr/eng/product/product1_4.php#link
MDAS-B4 is developed for commercial vehicles such as trucks, buses for driver
assistance system based on monocular camera. MDAS-B4 provides Lane departure
warning(LDW), forward collision warning(FCW), high-beam assist(HBA), and one-channel
driving recorder
MOVON
CORPORATIONMDAS-MLF1 A Camera Y Y http://mdas.co.kr/eng/product/product1_7.php#link
MDAS-MLF1 Module is the solution to feature LDW( Lane Departure Warning) and
FCW(Forward Collision Warning). MDAS-MLF1 captures the image from CMOS image
sensor and runs LDW&FCW algorithms using that images, sends LDW&FCW results to
other processors through UART interface. It is a co-processor system which can be
integrated with other system such as Car Navigation, Black-Box, Car Audio and other car
components.
MOVON
CORPORATIONMDAS-3LF A Y Y Y http://mdas.co.kr/eng/product/product1_9.php
SmartmicroUMRR-0A (Type 29 long
ranage) A Radar Y http://www.smartmicro.de/automotive-radar/products/The Smart Microwave Sensor radar is an after-market device fitted to trucks that record,
warn and identify near miss and dangerous driving scenarios.
Meritor Wabco OnLane A Camera Y http://www.meritorwabco.com/Product,1,36,2,OnLane™-LDW.aspx
OnLane™ Lane Departure Warning System with SafeTraK technology by Takata is a
camera-based warning system that helps your vehicle avoid unintentional lane drifting. The
system utilizes a camera mounted near the top center of the vehicle windshield to monitor
and calculate the vehicle’s position within the lane. When OnLane detects the vehicle
crossing lane markings without the turn signal being activated, the system sounds a
audible warning. This alerts the driver to take a corrective action to prevent potential
collisions or run-off-road accidents.
Meritor Wabco OnGaurd A Y http://www.meritorwabco.com/product/OnGuard-CMS
GoshersBlind Spot Detection
System A Radar Y http://www.goshers.com/BSDS
An Aftermarket Blind Spot Detection System includes 2 sensors which can detect any
objects in the most common blind spot areas.Will alert the driver anytime any type of
object is detected by either sensor (including curbs, walls, posts and other objects) This
unit is limited to a maximum range of approx. 10 feet per sensor. Uses reliable, Sonar
technology with detection in less than 120ms.
Vox electronics LDWS100 A Camera Y Y Y http://www.voxxtechservices.com/advent/lane-departure/
The LDWS100 recognizes traffic lane markings as well as vehicles in front of you and
warns a driver with an audible tone when the vehicle begins to move out of its lane (unless
a turn signal is on in that direction) on freeways and arterial roads when traveling at or
above 35mph or vehicles that suddenly are too close for safety in front of you when driving
at or above 15mph.
Garmin NuviCAM LMTHD A Camera Y Y Y https://buy.garmin.com/en-US/US/on-the-road/automotive/2015-line/nuvicam-lmthd/prod168820.html With a built-in dash cam that continuously records your drive, plus features that enhance
driver awareness, nüviCam LMTHD takes GPS auto navigation to a whole new level.
Open XCNighttime Forward
Collision Warning ACamera +
Android
systemY http://openxcplatform.com/projects/nightvision.html
This Nighttime Forward Collision Warning is an Android app that uses OpenXC and a
standard USB webcam to add "night vision" to a car with off-the-shelf parts. The webcam
faces forward from the dashboard and uses edge detection to detect objects on the road
in the path of the vehicle (i.e. deer). OpenXC™
is a combination of open source hardware and software that lets you extend your
vehicle with custom applications and pluggable modules. It uses standard, well-
known tools to open up a wealth of data from the vehicle to developers, even beyond OBD-
II.
Autoliv Vision Systems A Camera Y Y Y Y http://www.autoliv.com/ProductsAndInnovations/ActiveSafetySystems/Pages/VisionSystems.aspx
Autoliv’s pioneering work with camera-based vision systems virtually gives the driver an
additional pair of eyes, scanning the road ahead for danger. Advanced algorithms allow the
camera to “see” and track other vehicles, speed signs and lane markings, warning the
driver when the car is in danger of colliding with pedestrians or other vehicles.
Gentex Corporation Driver Assist A Camera Y Y Y Y http://www.gentex.com/automotive/products/forward-driving-assist
Driver Assist systems that offer features like lane departure warning, forward collision
warning, traffic sign recognition, and pedestrian detection also use a miniature camera-on-
a-chip integrated into a Gentex auto-dimming mirror combined with algorithmic decision-
making. Gentex is in development of Driver Assist systems in conjunction with Mobileye® ,
the global pioneer in the development of vision-based driver-assistance systems.
Banner
EngineeringR-GAGE QT50R-AFH A Radar http://info.bannerengineering.com/cs/groups/public/documents/literature/162359.pdf
High sensitivity radar-based sensors ideal for collision avoidance on board mobile
equipment, like reach stackers, forklifts, and mining vehicles. The
sensor is able to detect a proper object (see Detectable Objects) from 1 to 24 m (3.3 to
78.7 ft), depending on target

47
Appendix B: Arm Posture during the Phase 1 experiment
To reduce noise EMG signals and collect valid data, the participants must hold the
wheel with specified postures:
1) Keep two hands on the steering wheel and maintain a same height during the
experiment. The recommended positions are 3 o’clock (right hand) and 9 o’clock
(left hand) or 2 o’clock (left hand) and 0 o’clock (right hand)
2) Do not use palm for turning the wheel
3) Make one hand over 90 degree when you turn left or right
(Question)
Which posture is the most appropriate posture during the test? (Answer: 7)
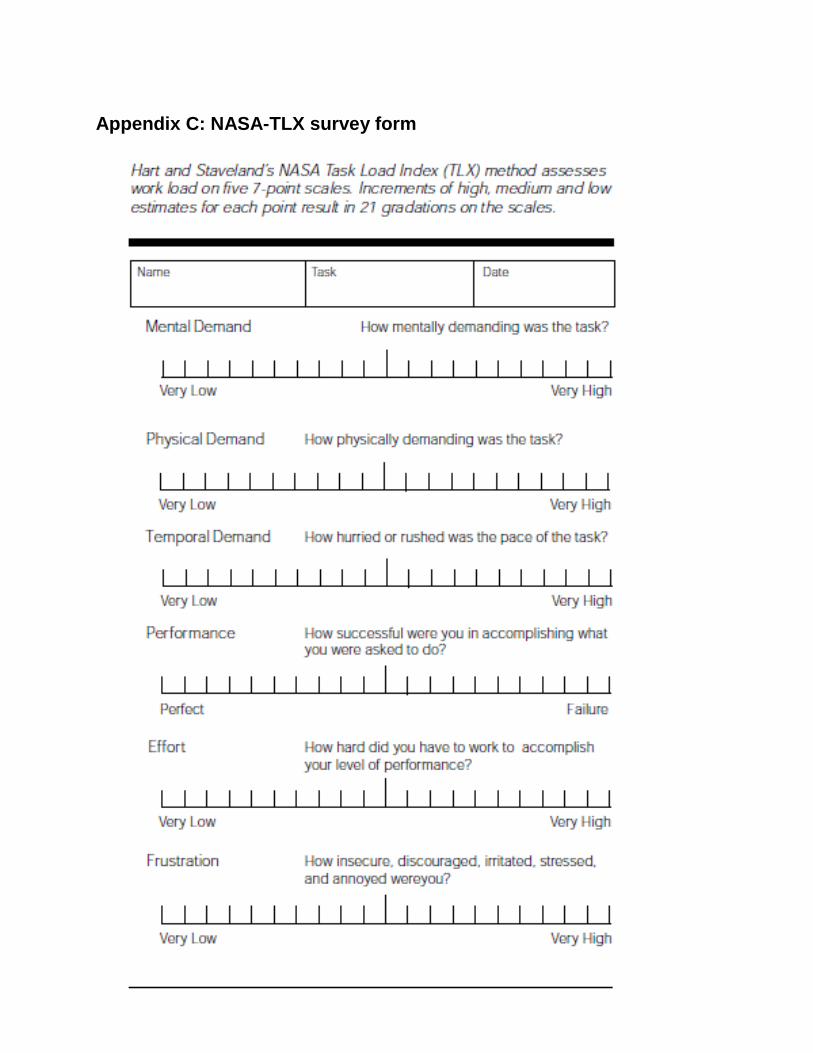
48
Appendix C: NASA-TLX survey form

49
Appendix D: Phase 2 Survey Questions
Please answer the following questions regarding your background experience. This information will not be used to evaluate you personally. We are asking for this information so we are in a better position to understand how the findings may relate to operator experience or other demographic characteristics.
1. Age: ___________
2. Gender: Male Female
3. Driving experience (years): ___________
4. How long have you been work as this driving position (years)? __________________
5. What is the starting date of using this collision avoidance system?
(MM) (DD) (YEAR)
6. Are you familiar with the work path when you use the collision avoidance system?
Very unfamiliar 1 2 3 4 5 6 7 Very familiar
7. How often did you experience heavy traffic with collision avoidance system?
1 2 3 4 5 6 7
Never Sometimes Always
8. How often did you drive on highway?
1 2 3 4 5 6 7
Never Sometimes Always
9. How often did you drive on urban road?
1 2 3 4 5 6 7
Never Sometimes Always
10. How do you think the collision avoidance system has helped you reform your driving
habits?

50
a. Yes, very helpful
b. Helps a bit
c. No help at all (Please move to Q#12)
10.1 Do you feel that the system helps you improve your signal habits while
changing lanes, and driving habits in maintaining the lanes?
a. Yes, very helpful
b. Helps a bit
c. No help at all
d. Lane departure warnings are very troublesome, and I have no need for
them.
10.2 Do you feel that the system helps you improve your habits in keeping a safe
distance from the vehicle in front of you when driving?
a. Yes, very helpful
b. Helps a bit
c. No help at all
d. Warnings are very troublesome, and I have no need for them.
11. How often do you pay attention to the collision avoidance system?
1 2 3 4 5 6 7
Never Sometimes Always
12. How often did you check the collision warning display when you heard a warning
sound?
1 2 3 4 5 6 7
Never Sometimes Always
13. Do you monitor the display of the system (seconds / distance) to maintain a safe
distance?
a. I often stare at the screen, using the data to maintain a safe distance, and
try to avoid warnings.
b. I rarely look at the monitor, using mainly the acoustic signal to keep a safe
distance.
c. I do not stare at the screen and can keep a safe distance by intuition, but it
is useful to have the system just in case.
d. I do not need the monitor and I have no need for alerts.
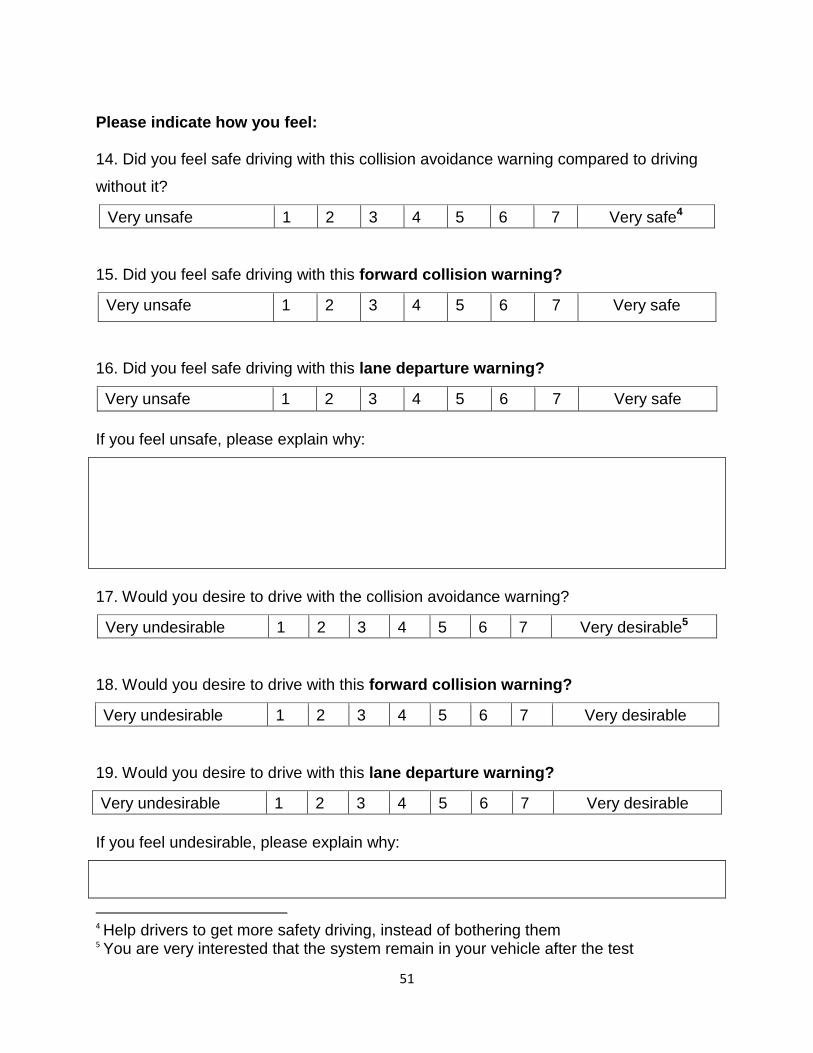
51
Please indicate how you feel:
14. Did you feel safe driving with this collision avoidance warning compared to driving
without it?
Very unsafe 1 2 3 4 5 6 7 Very safe4
15. Did you feel safe driving with this forward collision warning?
Very unsafe 1 2 3 4 5 6 7 Very safe
16. Did you feel safe driving with this lane departure warning?
Very unsafe 1 2 3 4 5 6 7 Very safe
If you feel unsafe, please explain why:
17. Would you desire to drive with the collision avoidance warning?
Very undesirable 1 2 3 4 5 6 7 Very desirable5
18. Would you desire to drive with this forward collision warning?
Very undesirable 1 2 3 4 5 6 7 Very desirable
19. Would you desire to drive with this lane departure warning?
Very undesirable 1 2 3 4 5 6 7 Very desirable
If you feel undesirable, please explain why:
4 Help drivers to get more safety driving, instead of bothering them
5 You are very interested that the system remain in your vehicle after the test
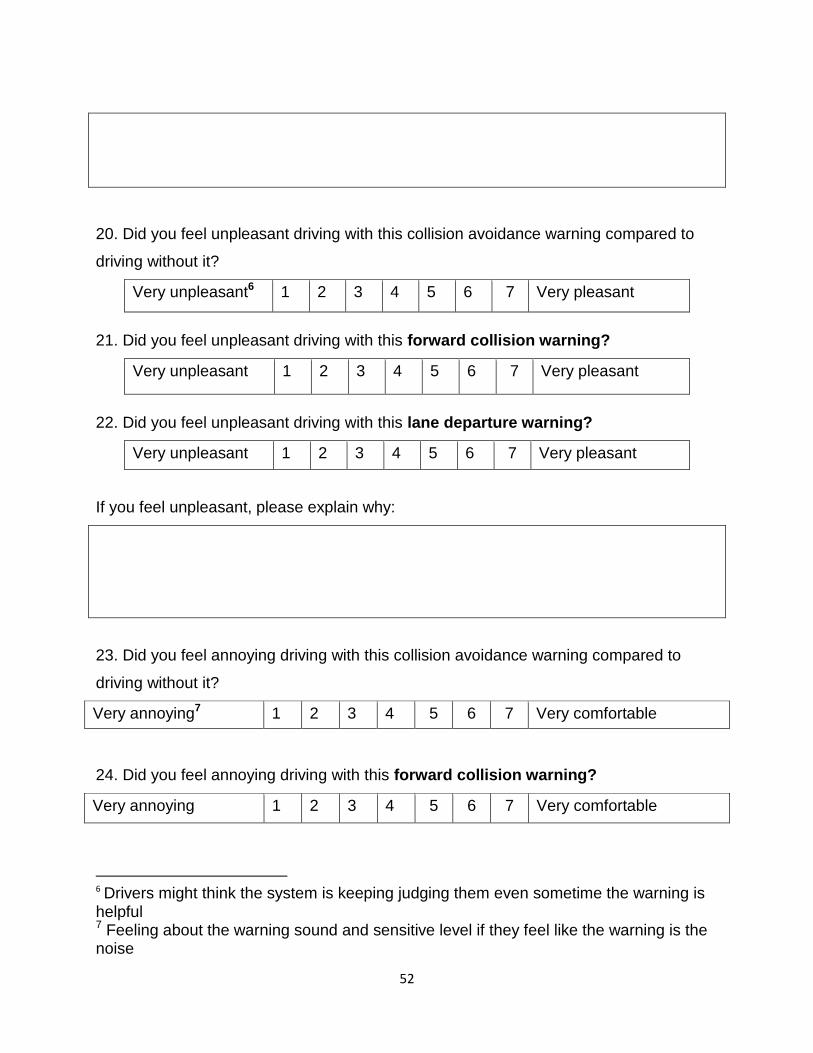
52
20. Did you feel unpleasant driving with this collision avoidance warning compared to
driving without it?
Very unpleasant6 1 2 3 4 5 6 7 Very pleasant
21. Did you feel unpleasant driving with this forward collision warning?
Very unpleasant 1 2 3 4 5 6 7 Very pleasant
22. Did you feel unpleasant driving with this lane departure warning?
Very unpleasant 1 2 3 4 5 6 7 Very pleasant
If you feel unpleasant, please explain why:
23. Did you feel annoying driving with this collision avoidance warning compared to
driving without it?
Very annoying7 1 2 3 4 5 6 7 Very comfortable
24. Did you feel annoying driving with this forward collision warning?
Very annoying 1 2 3 4 5 6 7 Very comfortable
6 Drivers might think the system is keeping judging them even sometime the warning is helpful 7 Feeling about the warning sound and sensitive level if they feel like the warning is the noise
53
25. Did you feel annoying driving with this lane departure warning?
Very annoying 1 2 3 4 5 6 7 Very comfortable
If you feel annoying, please explain why:
26. Which type of warning you think influenced you a lot?
a. Visible warning on display
b. Sound warning
c. Equally influenced
d. Neither influenced
27. Do you think the collision avoidance system provides the accurate8 forward
collision warning?
1 2 3 4 5 6 7
Never Sometimes Always
28. Do you think the collision avoidance system provides the accurate lane departure
warning?
1 2 3 4 5 6 7
Never Sometimes Always
29. Did you make any changes of driving after you saw or heard a warning from the
system?
1 2 3 4 5 6 7
Never Sometimes Always
8 Accurate means if the system provides correct warning or not. Sometime, the system might give the waring though there is no dangerous situation and wrong behavior of driver
54
30. Please choose which condition you think you were in when there was a warning:
a. Ignore the warning and continuously driving in the same way as before.
b. Take a glance of the warning system but without driving behavior changed
c. Change the driving behavior
30.1. If you choose option a, how often did you ignore the warning?
1 2 3 4 5 6 7
Never Sometimes Always
30.2. If you choose option c, how often do you change driving behavior because
warning reminds you something you have not noticed?
1 2 3 4 5 6 7
Never Sometimes Always