Effective utilization of a sponge iron industry by-product for phosphate removal from aqueous...
11
Effective utilization of a sponge iron industry by-product for phosphate removal from aqueous solution: A statistical and kinetic modelling approach Prangya Ranjan Rout, Puspendu Bhunia, Rajesh Roshan Dash * Department of Civil Engineering, School of Infrastructure, Indian Institute of Technology, Bhubaneswar 751 013, Odisha, India 1. Introduction Dolochar is a by-product of sponge iron industry. Sponge iron is produced from the ingredients like iron ore, dolomite and coal with the application of direct reduction of iron (DRI) methodology. The waste material generated during the DRI process, consisting of devolatilized dolomite and char (the solid remnant of coal after the release of coal gas and coal tar during the initial stage of combustion) is termed as dolochar. A typical sponge iron industry (using DRI methodology) with 100 t per day capacity produces 25 t per day dolochar, thereby generating 9000 t waste material per annum [1,2]. A negligible portion of the generated dolochar is used as domestic fuel, fuel in boilers and brick making industries, whereas the major portion is either dumped in the dump yards or is used in the land filling without considering their effect in aquatic and edaphic environments. Therefore, the utility of such large amount of dolochar generated still appears to be an unanswered predicament, and hence, threat the environment with serious disposal problems. In order to find some utility of dolochar, the adsorption potential of the same was explored by Panda et al. [1] to remove heavy metals like Cd(II) and Cr(VI). The most prolific adsorbents are usually found among various industrial waste materials [3]. The innate porosity and the presence of iron, aluminium, calcium and magnesium compounds in dolochar add to the possible application of the waste for phosphate adsorption. There are well documented literatures available suggesting that, phosphate ions react with iron and aluminium oxides by ligand exchange forming inner-sphere complexes whereas the presence of magnesium and calcium ion facilitates phosphate removal via precipitation [4–6]. Owing to the above facts, examination of phosphate adsorption potential of dolochar has been attempted in this study. Phosphate is an indispensable macronutrient for the growth, development and normal functioning of biological organisms in most of the ecosystems [7]. Conversely, with rapid industrializa- tion and urbanization, the excess discharge of phosphates to Journal of the Taiwan Institute of Chemical Engineers xxx (2014) xxx–xxx * Corresponding author. Tel.:+91 674 2306358; fax: +91 674 2301983. E-mail addresses: [email protected], [email protected] (R.R. Dash). A R T I C L E I N F O Article history: Received 7 July 2014 Received in revised form 28 August 2014 Accepted 5 September 2014 Available online xxx Keywords: Dolochar RSM ANOVA Phosphate removal Adsorption kinetics Adsorption isotherm A B S T R A C T Dolochar, a solid waste generated from sponge iron industry during the process of direct reduction of iron by rotary kiln, is explored as an adsorbent for phosphate removal in this study. The depiction of the adsorption process was done by X-ray diffraction (XRD), Fourier transferred infra-red spectroscopy (FTIR), and Energy dispersive spectroscopy (EDS) analysis. The appearance of phosphorous peak in EDS spectra of spent dolochar confirmed phosphate adsorption. Application of response surface methodology (RSM) and analysis of variance (ANOVA) for modelling and optimization of phosphate removal in batch study and breakthrough time in column study, suggested quadratic models for both the responses. Experimental validation of the optimization process resulted in 98.13% phosphate removal and 24.67 h breakthrough time. Pseudo second order kinetic and Langmuir isotherm illustrated best fit to the experimental data with R 2 = 0.98 and R 2 = 0.99, respectively. The values of separation factor (1 > R L > 0), Freundlich exponent (n > 1) and thermodynamic parameters (DG8, 3442.6 kJ/mol and DH8, 6627 kJ/ mol) specified favourable spontaneous and endothermic adsorption process. The adsorbent displayed 80% of the original adsorption capacity in the 3rd cycle of reuse. The results of this study support the utility of dolochar as a low cost and highly efficient adsorbent for phosphate removal from aqueous solution. ß 2014 Taiwan Institute of Chemical Engineers. Published by Elsevier B.V. All rights reserved. G Model JTICE-1023; No. of Pages 11 Please cite this article in press as: Rout PR, et al. Effective utilization of a sponge iron industry by-product for phosphate removal from aqueous solution: A statistical and kinetic modelling approach. J Taiwan Inst Chem Eng (2014), http://dx.doi.org/10.1016/ j.jtice.2014.09.006 Contents lists available at ScienceDirect Journal of the Taiwan Institute of Chemical Engineers jou r nal h o mep age: w ww.els evier .co m/lo c ate/jtic e http://dx.doi.org/10.1016/j.jtice.2014.09.006 1876-1070/ß 2014 Taiwan Institute of Chemical Engineers. Published by Elsevier B.V. All rights reserved.
-
Upload
rajesh-roshan -
Category
Documents
-
view
212 -
download
0
Transcript of Effective utilization of a sponge iron industry by-product for phosphate removal from aqueous...

Journal of the Taiwan Institute of Chemical Engineers xxx (2014) xxx–xxx
G Model
JTICE-1023; No. of Pages 11
Effective utilization of a sponge iron industry by-product forphosphate removal from aqueous solution: A statistical and kineticmodelling approach
Prangya Ranjan Rout, Puspendu Bhunia, Rajesh Roshan Dash *
Department of Civil Engineering, School of Infrastructure, Indian Institute of Technology, Bhubaneswar 751 013, Odisha, India
A R T I C L E I N F O
Article history:
Received 7 July 2014
Received in revised form 28 August 2014
Accepted 5 September 2014
Available online xxx
Keywords:
Dolochar
RSM
ANOVA
Phosphate removal
Adsorption kinetics
Adsorption isotherm
A B S T R A C T
Dolochar, a solid waste generated from sponge iron industry during the process of direct reduction of
iron by rotary kiln, is explored as an adsorbent for phosphate removal in this study. The depiction of the
adsorption process was done by X-ray diffraction (XRD), Fourier transferred infra-red spectroscopy
(FTIR), and Energy dispersive spectroscopy (EDS) analysis. The appearance of phosphorous peak in EDS
spectra of spent dolochar confirmed phosphate adsorption. Application of response surface methodology
(RSM) and analysis of variance (ANOVA) for modelling and optimization of phosphate removal in batch
study and breakthrough time in column study, suggested quadratic models for both the responses.
Experimental validation of the optimization process resulted in 98.13% phosphate removal and 24.67 h
breakthrough time. Pseudo second order kinetic and Langmuir isotherm illustrated best fit to the
experimental data with R2 = 0.98 and R2 = 0.99, respectively. The values of separation factor (1 > RL > 0),
Freundlich exponent (n > 1) and thermodynamic parameters (DG8, �3442.6 kJ/mol and DH8, 6627 kJ/
mol) specified favourable spontaneous and endothermic adsorption process. The adsorbent displayed
80% of the original adsorption capacity in the 3rd cycle of reuse. The results of this study support the
utility of dolochar as a low cost and highly efficient adsorbent for phosphate removal from aqueous
solution.
� 2014 Taiwan Institute of Chemical Engineers. Published by Elsevier B.V. All rights reserved.
Contents lists available at ScienceDirect
Journal of the Taiwan Institute of Chemical Engineers
jou r nal h o mep age: w ww.els evier . co m/lo c ate / j t i c e
1. Introduction
Dolochar is a by-product of sponge iron industry. Sponge iron isproduced from the ingredients like iron ore, dolomite and coal withthe application of direct reduction of iron (DRI) methodology. Thewaste material generated during the DRI process, consisting ofdevolatilized dolomite and char (the solid remnant of coal after therelease of coal gas and coal tar during the initial stage ofcombustion) is termed as dolochar. A typical sponge iron industry(using DRI methodology) with 100 t per day capacity produces 25 tper day dolochar, thereby generating 9000 t waste material perannum [1,2]. A negligible portion of the generated dolochar is usedas domestic fuel, fuel in boilers and brick making industries,whereas the major portion is either dumped in the dump yards oris used in the land filling without considering their effect in aquaticand edaphic environments. Therefore, the utility of such large
* Corresponding author. Tel.:+91 674 2306358; fax: +91 674 2301983.
E-mail addresses: [email protected], [email protected] (R.R. Dash).
Please cite this article in press as: Rout PR, et al. Effective utilization oaqueous solution: A statistical and kinetic modelling approach.j.jtice.2014.09.006
http://dx.doi.org/10.1016/j.jtice.2014.09.006
1876-1070/� 2014 Taiwan Institute of Chemical Engineers. Published by Elsevier B.V.
amount of dolochar generated still appears to be an unansweredpredicament, and hence, threat the environment with seriousdisposal problems. In order to find some utility of dolochar, theadsorption potential of the same was explored by Panda et al. [1] toremove heavy metals like Cd(II) and Cr(VI). The most prolificadsorbents are usually found among various industrial wastematerials [3]. The innate porosity and the presence of iron,aluminium, calcium and magnesium compounds in dolochar addto the possible application of the waste for phosphate adsorption.There are well documented literatures available suggesting that,phosphate ions react with iron and aluminium oxides by ligandexchange forming inner-sphere complexes whereas the presenceof magnesium and calcium ion facilitates phosphate removal via
precipitation [4–6]. Owing to the above facts, examination ofphosphate adsorption potential of dolochar has been attempted inthis study.
Phosphate is an indispensable macronutrient for the growth,development and normal functioning of biological organisms inmost of the ecosystems [7]. Conversely, with rapid industrializa-tion and urbanization, the excess discharge of phosphates to
f a sponge iron industry by-product for phosphate removal from J Taiwan Inst Chem Eng (2014), http://dx.doi.org/10.1016/
All rights reserved.

Table 1Properties and compositions of dolochar.
Properties and compositions Dolochar
Particle size (mm) <0.6
pHzpc 11.22
BET Surface area (m2/g) 104.31
SiO2 (%) 53.67 � 3.23
Al2O3 (%) 18.39 � 1.38
Fe2O3 (%) 16.72 � 1.67
MgO (%) 5.09 � 0.96
CaO (%) 4.23 � 0.58
G Model
JTICE-1023; No. of Pages 11
P.R. Rout et al. / Journal of the Taiwan Institute of Chemical Engineers xxx (2014) xxx–xxx2
aquatic environments is taking place through various anthropo-genic activities such as the use of fertilizers, pigments, detergentsand electronic industry discharge, domestic wastewater discharge,mineral processing, rural and urban sewage disposal etc. [8]. Apartfrom eutrophication, the increasing loads of phosphates in waterbodies stimulate the activity of a damaging microbe known asPfisteria and speed up the production of microsystin, a toxin thatpoisons aquatic animals and can cause hepatocellular carcinoma inhumans [9] and [10]. As per USEPA report [11], dissolvedphosphate concentration of 0.02 mg/L is considered to havepotential eutrophic effects in aquatic bodies. To meet the stringentlimit of phosphorous concentration in natural water bodies, thedischarge standard of wastewater is on an average set at 1–2 mg/Lof phosphate [12]. In recent past, a great deal of advancedtreatment methods such as physical processes, chemical precipi-tation, biological treatment and adsorption based processesetc. have been practised for phosphate abatement, since phosphateis usually difficult to remove by conventional wastewatertreatment plants [13], [14,15]. Among the easily reached process-es, adsorption comes into sight to be more efficient and economicalwith advantageous features like, low operational cost, lessproduction of sludge and fewer disposal problems etc. In addition,the phosphate loaded adsorbents can be also used in agriculturalsector as fertilizer and soil conditioner [16]. Till date, theapplication of various adept solid materials as adsorbents,involving synthetic materials [8–18], natural materials [9,13,19–21], agricultural by-products [22,23] and industrial by-products[7,24–26], in phosphate removal from aqueous solutions havebeen extensively looked over.
Prediction of the effects of multiple parameters and theirinteraction is difficult through conventional experimental meth-odologies which are based on one-variable-at-a-time (OVAT). Alsoby considering more experimental parameters for a particularprocess, more number of experiments will have to be performed,which is cumbersome and time consuming [27]. Response surfacemethodology (RSM) has been attested to be a handy tool forfulfilling the purpose of studying the effects of multiple parameterssimultaneously, while performing a reduced number of experi-ments [28]. RSM has been applied to optimize and modelphosphate adsorption onto hydrated ferric oxide-based nanocom-posite, powder alum sludge, NF90 membrane etc. [18,27,29];however, no such report is found on the application of RSM tooptimize phosphate removal from aqueous solution usingdolochar as an adsorbent. Therefore, the multi fold objective ofthis study includes (i) investigation of the phosphate removalability of dolochar, from aqueous solution, both in batch andcolumn mode of operation, (ii) characterization of adsorbent andadsorption process with the help of XRD, FTIR and EDS, (iii)application of RSM to optimize experimental parameters and todevelop statistical models of adsorption both in batch and columnmode, (iv) determination of adsorption mechanism, kinetics,thermodynamics, isotherms, adsorption–desorption cycle etc. Inshort, an economic, easy and eco-friendly phosphate removalmethod has been attempted, especially, emphasizing on bulkutilization of dolochar, thereby making light of disposal issues.
2. Materials and methods
2.1. Adsorbent
Dolochar samples were collected from three sponge ironindustries located in Sambalpur and Anugul district of Odisha,India. The collected samples were grounded, sieved and washedseveral times with distilled water to remove surface adheredparticles, soluble materials and then dried in hot-air oven at 100 8Cfor overnight. Dolochar sample of particle size less than 0.6 mm
Please cite this article in press as: Rout PR, et al. Effective utilization oaqueous solution: A statistical and kinetic modelling approach.j.jtice.2014.09.006
were used in the adsorption study. The properties and averagechemical composition of the material are given in Table 1. Thechemical compositions of the dolochar samples were analyzed bywet chemical and atomic absorption spectrophotometer (AAS)techniques.
2.2. Adsorbate
Chemicals of analytical grade used in the present experimentalstudies, were procured from Himedia Laboratories Pvt. Ltd.Mumbai, India. Phosphate stock solutions of 1000 mg/L wereprepared synthetically by dissolving calculated amount of anhy-drous potassium dihydrogen phosphate (KH2PO4) in distilledwater. The stock solution was further diluted to get the desiredconcentrations of experimental working solution. This syntheticphosphate solution was used for optimizing different adsorptionparameters in both batch and column studies. The pH of thephosphate solution was adjusted to desired value by addition of0.1 M HCl and NaOH.
2.3. Analytical methods, related instruments and software
Phosphate concentration in aqueous solutions was determinedby the vanado molybdo phosphoric acid method [30]. 1 mL ofvanadate-molybdate reagent, 0.5 mL of distilled water and 3.5 mLof filtered sample were mixed and the solution was analyzed after10 min with a UV/VIS spectrophotometer (Perkin Elmer Lambd-25) at the detection wavelength of 470 nm. The XRD analysis wascarried out in the 2u range of 15–708 in a Bruker D8 DISCOVERdiffractometer at room temperature, with Cu Ka radiationoperated at 40 kV voltage, 40 mAmp current, scan speed of 38/min and step size of 1 s. The FTIR spectra of KBr disks containingadsorbent sample (2 mg sample in 200 mg KBr) were recorded onBruker ALPHA-FTIR Spectrophotometer by setting the scanningrange of 500–4000 cm�1, resolution of 4 cm�1 and a scanning rateof 64. Elemental distribution of dolochar before and afteradsorption was monitored using field emission scanning electronmicroscope (FESEM, ZEISS SUPRA 55), equipped with EDS at anaccelerating voltage of 15 kV by sprinkling adsorbents onto thecarbon tape mounted on the SEM stub. To determine pHzpc, 1 g ofdolochar was added to a series of Elnermayer flasks containing100 mL of 0.01 M NaCl solution of variably adjusted pH (2.5–12),agitated for 48 h and then final pH was measured. The pHzpc wasobtained as the point of intersection (pH = 0) of the resulting curveas obtained by plotting change in pH (DpH) against the initial pH(pHi). The specific surface area of dolochar was determined by theBET nitrogen gas adsorption–desorption method using a specificsurface area analyzer, QUADRASORB SI, USA.
Design Expert version 7.0.3, Stat Ease, USA was used for theapplication of RSM to fit and analyze experimental data to variousmodels. Statistical validation of the models was done by analysis ofvariance (ANOVA). XRD data were analyzed by DIFRAC.SUITE XRDsoftware, FTIR data by e-FTIR software, and BET analysis by QuadraWin software.
f a sponge iron industry by-product for phosphate removal from J Taiwan Inst Chem Eng (2014), http://dx.doi.org/10.1016/
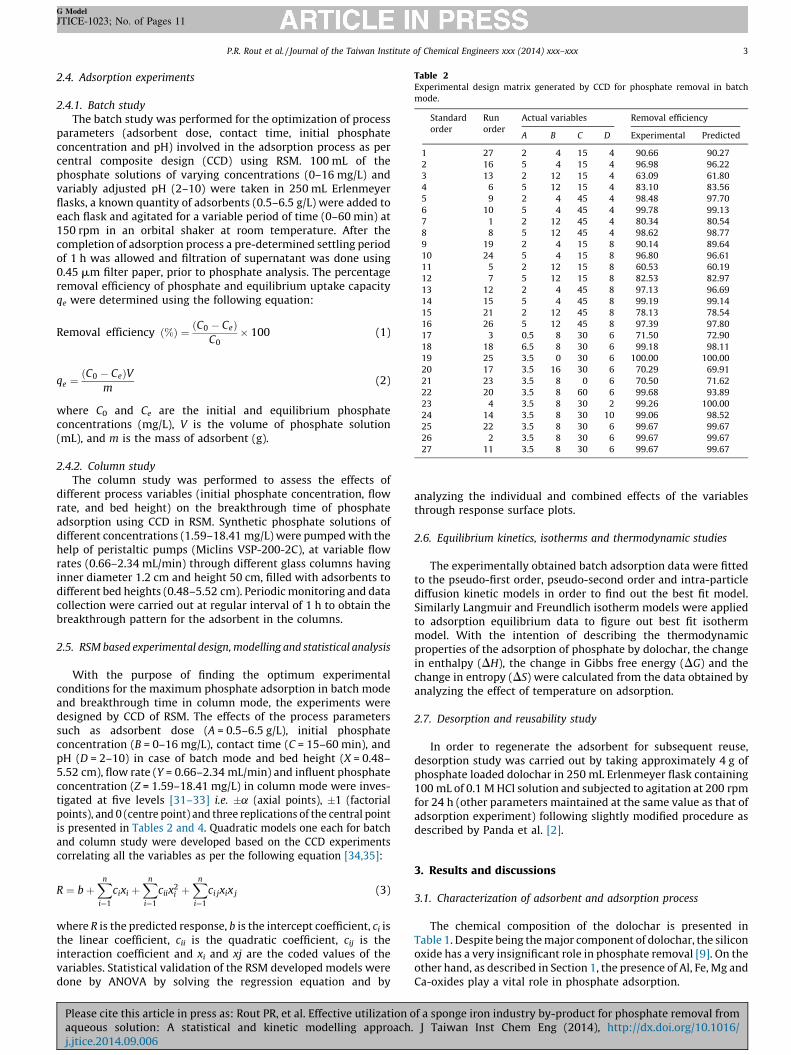
Table 2Experimental design matrix generated by CCD for phosphate removal in batch
mode.
Standard
order
Run
order
Actual variables Removal efficiency
A B C D Experimental Predicted
1 27 2 4 15 4 90.66 90.27
2 16 5 4 15 4 96.98 96.22
3 13 2 12 15 4 63.09 61.80
4 6 5 12 15 4 83.10 83.56
5 9 2 4 45 4 98.48 97.70
6 10 5 4 45 4 99.78 99.13
7 1 2 12 45 4 80.34 80.54
8 8 5 12 45 4 98.62 98.77
9 19 2 4 15 8 90.14 89.64
10 24 5 4 15 8 96.80 96.61
11 5 2 12 15 8 60.53 60.19
12 7 5 12 15 8 82.53 82.97
13 12 2 4 45 8 97.13 96.69
14 15 5 4 45 8 99.19 99.14
15 21 2 12 45 8 78.13 78.54
16 26 5 12 45 8 97.39 97.80
17 3 0.5 8 30 6 71.50 72.90
18 18 6.5 8 30 6 99.18 98.11
19 25 3.5 0 30 6 100.00 100.00
20 17 3.5 16 30 6 70.29 69.91
21 23 3.5 8 0 6 70.50 71.62
22 20 3.5 8 60 6 99.68 93.89
23 4 3.5 8 30 2 99.26 100.00
24 14 3.5 8 30 10 99.06 98.52
25 22 3.5 8 30 6 99.67 99.67
26 2 3.5 8 30 6 99.67 99.67
27 11 3.5 8 30 6 99.67 99.67
G Model
JTICE-1023; No. of Pages 11
P.R. Rout et al. / Journal of the Taiwan Institute of Chemical Engineers xxx (2014) xxx–xxx 3
2.4. Adsorption experiments
2.4.1. Batch study
The batch study was performed for the optimization of processparameters (adsorbent dose, contact time, initial phosphateconcentration and pH) involved in the adsorption process as percentral composite design (CCD) using RSM. 100 mL of thephosphate solutions of varying concentrations (0–16 mg/L) andvariably adjusted pH (2–10) were taken in 250 mL Erlenmeyerflasks, a known quantity of adsorbents (0.5–6.5 g/L) were added toeach flask and agitated for a variable period of time (0–60 min) at150 rpm in an orbital shaker at room temperature. After thecompletion of adsorption process a pre-determined settling periodof 1 h was allowed and filtration of supernatant was done using0.45 mm filter paper, prior to phosphate analysis. The percentageremoval efficiency of phosphate and equilibrium uptake capacityqe were determined using the following equation:
Removal efficiency ð%Þ ¼ C0 � Ceð ÞC0
� 100 (1)
qe ¼C0 � Ceð ÞV
m(2)
where C0 and Ce are the initial and equilibrium phosphateconcentrations (mg/L), V is the volume of phosphate solution(mL), and m is the mass of adsorbent (g).
2.4.2. Column study
The column study was performed to assess the effects ofdifferent process variables (initial phosphate concentration, flowrate, and bed height) on the breakthrough time of phosphateadsorption using CCD in RSM. Synthetic phosphate solutions ofdifferent concentrations (1.59–18.41 mg/L) were pumped with thehelp of peristaltic pumps (Miclins VSP-200-2C), at variable flowrates (0.66–2.34 mL/min) through different glass columns havinginner diameter 1.2 cm and height 50 cm, filled with adsorbents todifferent bed heights (0.48–5.52 cm). Periodic monitoring and datacollection were carried out at regular interval of 1 h to obtain thebreakthrough pattern for the adsorbent in the columns.
2.5. RSM based experimental design, modelling and statistical analysis
With the purpose of finding the optimum experimentalconditions for the maximum phosphate adsorption in batch modeand breakthrough time in column mode, the experiments weredesigned by CCD of RSM. The effects of the process parameterssuch as adsorbent dose (A = 0.5–6.5 g/L), initial phosphateconcentration (B = 0–16 mg/L), contact time (C = 15–60 min), andpH (D = 2–10) in case of batch mode and bed height (X = 0.48–5.52 cm), flow rate (Y = 0.66–2.34 mL/min) and influent phosphateconcentration (Z = 1.59–18.41 mg/L) in column mode were inves-tigated at five levels [31–33] i.e. �a (axial points), �1 (factorialpoints), and 0 (centre point) and three replications of the central pointis presented in Tables 2 and 4. Quadratic models one each for batchand column study were developed based on the CCD experimentscorrelating all the variables as per the following equation [34,35]:
R ¼ b þXn
i¼1
cixi þXn
i¼1
ciix2i þ
Xn
i¼1
ci jxix j (3)
where R is the predicted response, b is the intercept coefficient, ci isthe linear coefficient, cii is the quadratic coefficient, cij is theinteraction coefficient and xi and xj are the coded values of thevariables. Statistical validation of the RSM developed models weredone by ANOVA by solving the regression equation and by
Please cite this article in press as: Rout PR, et al. Effective utilization oaqueous solution: A statistical and kinetic modelling approach.j.jtice.2014.09.006
analyzing the individual and combined effects of the variablesthrough response surface plots.
2.6. Equilibrium kinetics, isotherms and thermodynamic studies
The experimentally obtained batch adsorption data were fittedto the pseudo-first order, pseudo-second order and intra-particlediffusion kinetic models in order to find out the best fit model.Similarly Langmuir and Freundlich isotherm models were appliedto adsorption equilibrium data to figure out best fit isothermmodel. With the intention of describing the thermodynamicproperties of the adsorption of phosphate by dolochar, the changein enthalpy (DH), the change in Gibbs free energy (DG) and thechange in entropy (DS) were calculated from the data obtained byanalyzing the effect of temperature on adsorption.
2.7. Desorption and reusability study
In order to regenerate the adsorbent for subsequent reuse,desorption study was carried out by taking approximately 4 g ofphosphate loaded dolochar in 250 mL Erlenmeyer flask containing100 mL of 0.1 M HCl solution and subjected to agitation at 200 rpmfor 24 h (other parameters maintained at the same value as that ofadsorption experiment) following slightly modified procedure asdescribed by Panda et al. [2].
3. Results and discussions
3.1. Characterization of adsorbent and adsorption process
The chemical composition of the dolochar is presented inTable 1. Despite being the major component of dolochar, the siliconoxide has a very insignificant role in phosphate removal [9]. On theother hand, as described in Section 1, the presence of Al, Fe, Mg andCa-oxides play a vital role in phosphate adsorption.
f a sponge iron industry by-product for phosphate removal from J Taiwan Inst Chem Eng (2014), http://dx.doi.org/10.1016/
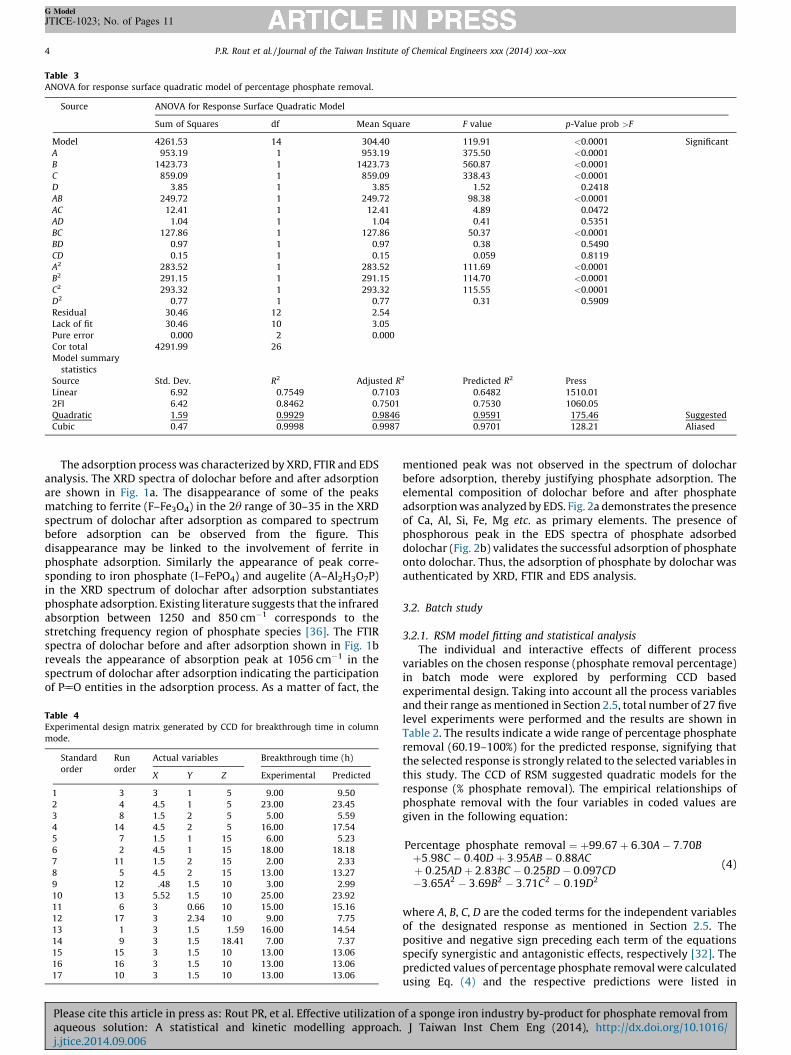
Table 3ANOVA for response surface quadratic model of percentage phosphate removal.
Source ANOVA for Response Surface Quadratic Model
Sum of Squares df Mean Square F value p-Value prob >F
Model 4261.53 14 304.40 119.91 <0.0001 Significant
A 953.19 1 953.19 375.50 <0.0001
B 1423.73 1 1423.73 560.87 <0.0001
C 859.09 1 859.09 338.43 <0.0001
D 3.85 1 3.85 1.52 0.2418
AB 249.72 1 249.72 98.38 <0.0001
AC 12.41 1 12.41 4.89 0.0472
AD 1.04 1 1.04 0.41 0.5351
BC 127.86 1 127.86 50.37 <0.0001
BD 0.97 1 0.97 0.38 0.5490
CD 0.15 1 0.15 0.059 0.8119
A2 283.52 1 283.52 111.69 <0.0001
B2 291.15 1 291.15 114.70 <0.0001
C2 293.32 1 293.32 115.55 <0.0001
D2 0.77 1 0.77 0.31 0.5909
Residual 30.46 12 2.54
Lack of fit 30.46 10 3.05
Pure error 0.000 2 0.000
Cor total 4291.99 26
Model summary
statistics
Source Std. Dev. R2 Adjusted R2 Predicted R2 Press
Linear 6.92 0.7549 0.7103 0.6482 1510.01
2FI 6.42 0.8462 0.7501 0.7530 1060.05
Quadratic 1.59 0.9929 0.9846 0.9591 175.46 Suggested
Cubic 0.47 0.9998 0.9987 0.9701 128.21 Aliased
G Model
JTICE-1023; No. of Pages 11
P.R. Rout et al. / Journal of the Taiwan Institute of Chemical Engineers xxx (2014) xxx–xxx4
The adsorption process was characterized by XRD, FTIR and EDSanalysis. The XRD spectra of dolochar before and after adsorptionare shown in Fig. 1a. The disappearance of some of the peaksmatching to ferrite (F–Fe3O4) in the 2u range of 30–35 in the XRDspectrum of dolochar after adsorption as compared to spectrumbefore adsorption can be observed from the figure. Thisdisappearance may be linked to the involvement of ferrite inphosphate adsorption. Similarly the appearance of peak corre-sponding to iron phosphate (I–FePO4) and augelite (A–Al2H3O7P)in the XRD spectrum of dolochar after adsorption substantiatesphosphate adsorption. Existing literature suggests that the infraredabsorption between 1250 and 850 cm�1 corresponds to thestretching frequency region of phosphate species [36]. The FTIRspectra of dolochar before and after adsorption shown in Fig. 1breveals the appearance of absorption peak at 1056 cm�1 in thespectrum of dolochar after adsorption indicating the participationof P55O entities in the adsorption process. As a matter of fact, the
Table 4Experimental design matrix generated by CCD for breakthrough time in column
mode.
Standard
order
Run
order
Actual variables Breakthrough time (h)
X Y Z Experimental Predicted
1 3 3 1 5 9.00 9.50
2 4 4.5 1 5 23.00 23.45
3 8 1.5 2 5 5.00 5.59
4 14 4.5 2 5 16.00 17.54
5 7 1.5 1 15 6.00 5.23
6 2 4.5 1 15 18.00 18.18
7 11 1.5 2 15 2.00 2.33
8 5 4.5 2 15 13.00 13.27
9 12 .48 1.5 10 3.00 2.99
10 13 5.52 1.5 10 25.00 23.92
11 6 3 0.66 10 15.00 15.16
12 17 3 2.34 10 9.00 7.75
13 1 3 1.5 1.59 16.00 14.54
14 9 3 1.5 18.41 7.00 7.37
15 15 3 1.5 10 13.00 13.06
16 16 3 1.5 10 13.00 13.06
17 10 3 1.5 10 13.00 13.06
Please cite this article in press as: Rout PR, et al. Effective utilization oaqueous solution: A statistical and kinetic modelling approach.j.jtice.2014.09.006
mentioned peak was not observed in the spectrum of dolocharbefore adsorption, thereby justifying phosphate adsorption. Theelemental composition of dolochar before and after phosphateadsorption was analyzed by EDS. Fig. 2a demonstrates the presenceof Ca, Al, Si, Fe, Mg etc. as primary elements. The presence ofphosphorous peak in the EDS spectra of phosphate adsorbeddolochar (Fig. 2b) validates the successful adsorption of phosphateonto dolochar. Thus, the adsorption of phosphate by dolochar wasauthenticated by XRD, FTIR and EDS analysis.
3.2. Batch study
3.2.1. RSM model fitting and statistical analysis
The individual and interactive effects of different processvariables on the chosen response (phosphate removal percentage)in batch mode were explored by performing CCD basedexperimental design. Taking into account all the process variablesand their range as mentioned in Section 2.5, total number of 27 fivelevel experiments were performed and the results are shown inTable 2. The results indicate a wide range of percentage phosphateremoval (60.19–100%) for the predicted response, signifying thatthe selected response is strongly related to the selected variables inthis study. The CCD of RSM suggested quadratic models for theresponse (% phosphate removal). The empirical relationships ofphosphate removal with the four variables in coded values aregiven in the following equation:
Percentage phosphate removal ¼ þ99:67 þ 6:30A � 7:70Bþ5:98C � 0:40D þ 3:95AB � 0:88ACþ 0:25AD þ 2:83BC � 0:25BD � 0:097CD�3:65A2 � 3:69B2 � 3:71C2 � 0:19D2
(4)
where A, B, C, D are the coded terms for the independent variablesof the designated response as mentioned in Section 2.5. Thepositive and negative sign preceding each term of the equationsspecify synergistic and antagonistic effects, respectively [32]. Thepredicted values of percentage phosphate removal were calculatedusing Eq. (4) and the respective predictions were listed in
f a sponge iron industry by-product for phosphate removal from J Taiwan Inst Chem Eng (2014), http://dx.doi.org/10.1016/
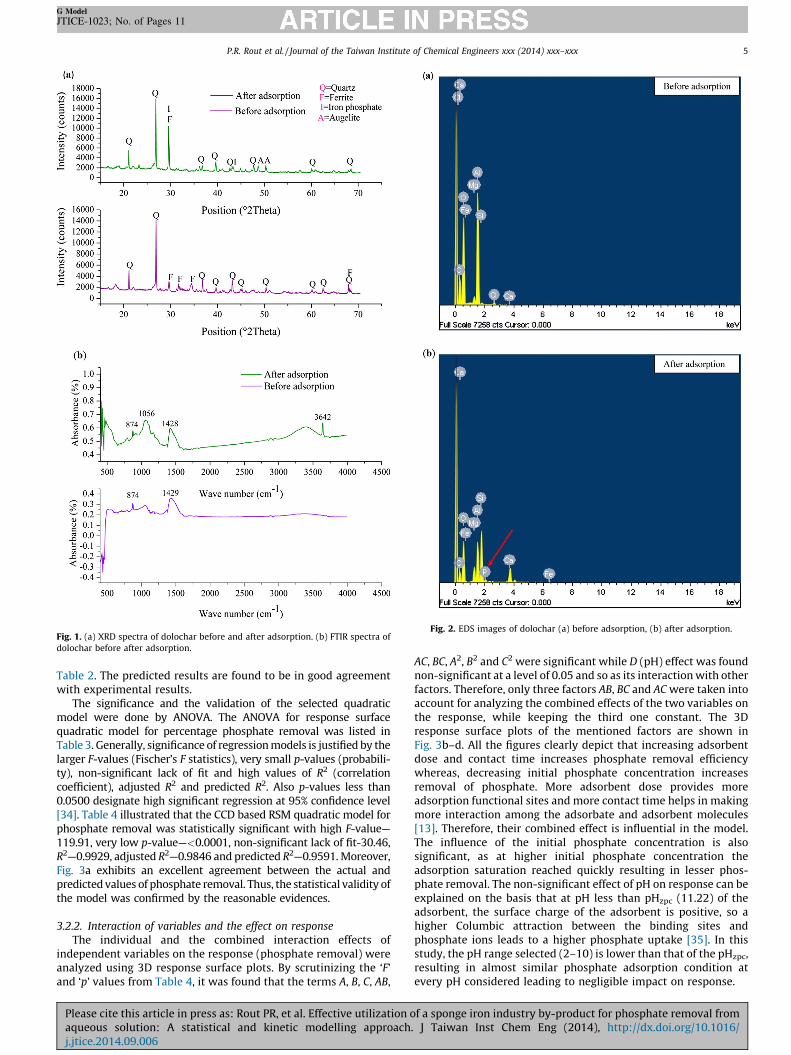
Fig. 1. (a) XRD spectra of dolochar before and after adsorption. (b) FTIR spectra of
dolochar before after adsorption.
Fig. 2. EDS images of dolochar (a) before adsorption, (b) after adsorption.
G Model
JTICE-1023; No. of Pages 11
P.R. Rout et al. / Journal of the Taiwan Institute of Chemical Engineers xxx (2014) xxx–xxx 5
Table 2. The predicted results are found to be in good agreementwith experimental results.
The significance and the validation of the selected quadraticmodel were done by ANOVA. The ANOVA for response surfacequadratic model for percentage phosphate removal was listed inTable 3. Generally, significance of regression models is justified by thelarger F-values (Fischer’s F statistics), very small p-values (probabili-ty), non-significant lack of fit and high values of R2 (correlationcoefficient), adjusted R2 and predicted R2. Also p-values less than0.0500 designate high significant regression at 95% confidence level[34]. Table 4 illustrated that the CCD based RSM quadratic model forphosphate removal was statistically significant with high F-value—119.91, very low p-value—<0.0001, non-significant lack of fit-30.46,R2—0.9929, adjusted R2—0.9846 and predicted R2—0.9591. Moreover,Fig. 3a exhibits an excellent agreement between the actual andpredicted values of phosphate removal. Thus, the statistical validity ofthe model was confirmed by the reasonable evidences.
3.2.2. Interaction of variables and the effect on response
The individual and the combined interaction effects ofindependent variables on the response (phosphate removal) wereanalyzed using 3D response surface plots. By scrutinizing the ‘F’and ‘p’ values from Table 4, it was found that the terms A, B, C, AB,
Please cite this article in press as: Rout PR, et al. Effective utilization oaqueous solution: A statistical and kinetic modelling approach.j.jtice.2014.09.006
AC, BC, A2, B2 and C2 were significant while D (pH) effect was foundnon-significant at a level of 0.05 and so as its interaction with otherfactors. Therefore, only three factors AB, BC and AC were taken intoaccount for analyzing the combined effects of the two variables onthe response, while keeping the third one constant. The 3Dresponse surface plots of the mentioned factors are shown inFig. 3b–d. All the figures clearly depict that increasing adsorbentdose and contact time increases phosphate removal efficiencywhereas, decreasing initial phosphate concentration increasesremoval of phosphate. More adsorbent dose provides moreadsorption functional sites and more contact time helps in makingmore interaction among the adsorbate and adsorbent molecules[13]. Therefore, their combined effect is influential in the model.The influence of the initial phosphate concentration is alsosignificant, as at higher initial phosphate concentration theadsorption saturation reached quickly resulting in lesser phos-phate removal. The non-significant effect of pH on response can beexplained on the basis that at pH less than pHzpc (11.22) of theadsorbent, the surface charge of the adsorbent is positive, so ahigher Columbic attraction between the binding sites andphosphate ions leads to a higher phosphate uptake [35]. In thisstudy, the pH range selected (2–10) is lower than that of the pHzpc,resulting in almost similar phosphate adsorption condition atevery pH considered leading to negligible impact on response.
f a sponge iron industry by-product for phosphate removal from J Taiwan Inst Chem Eng (2014), http://dx.doi.org/10.1016/
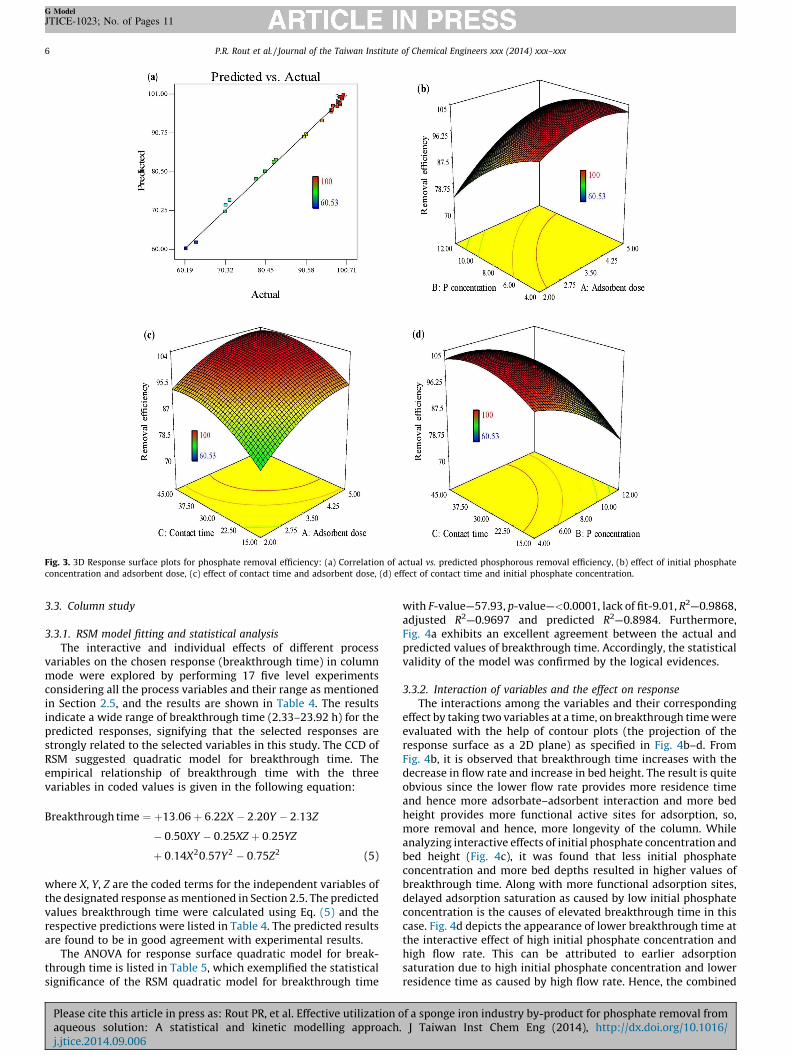
Fig. 3. 3D Response surface plots for phosphate removal efficiency: (a) Correlation of actual vs. predicted phosphorous removal efficiency, (b) effect of initial phosphate
concentration and adsorbent dose, (c) effect of contact time and adsorbent dose, (d) effect of contact time and initial phosphate concentration.
G Model
JTICE-1023; No. of Pages 11
P.R. Rout et al. / Journal of the Taiwan Institute of Chemical Engineers xxx (2014) xxx–xxx6
3.3. Column study
3.3.1. RSM model fitting and statistical analysis
The interactive and individual effects of different processvariables on the chosen response (breakthrough time) in columnmode were explored by performing 17 five level experimentsconsidering all the process variables and their range as mentionedin Section 2.5, and the results are shown in Table 4. The resultsindicate a wide range of breakthrough time (2.33–23.92 h) for thepredicted responses, signifying that the selected responses arestrongly related to the selected variables in this study. The CCD ofRSM suggested quadratic model for breakthrough time. Theempirical relationship of breakthrough time with the threevariables in coded values is given in the following equation:
Breakthrough time ¼ þ13:06 þ 6:22X � 2:20Y � 2:13Z
� 0:50XY � 0:25XZ þ 0:25YZ
þ 0:14X20:57Y2 � 0:75Z2 (5)
where X, Y, Z are the coded terms for the independent variables ofthe designated response as mentioned in Section 2.5. The predictedvalues breakthrough time were calculated using Eq. (5) and therespective predictions were listed in Table 4. The predicted resultsare found to be in good agreement with experimental results.
The ANOVA for response surface quadratic model for break-through time is listed in Table 5, which exemplified the statisticalsignificance of the RSM quadratic model for breakthrough time
Please cite this article in press as: Rout PR, et al. Effective utilization oaqueous solution: A statistical and kinetic modelling approach.j.jtice.2014.09.006
with F-value—57.93, p-value—<0.0001, lack of fit-9.01, R2—0.9868,adjusted R2—0.9697 and predicted R2—0.8984. Furthermore,Fig. 4a exhibits an excellent agreement between the actual andpredicted values of breakthrough time. Accordingly, the statisticalvalidity of the model was confirmed by the logical evidences.
3.3.2. Interaction of variables and the effect on response
The interactions among the variables and their correspondingeffect by taking two variables at a time, on breakthrough time wereevaluated with the help of contour plots (the projection of theresponse surface as a 2D plane) as specified in Fig. 4b–d. FromFig. 4b, it is observed that breakthrough time increases with thedecrease in flow rate and increase in bed height. The result is quiteobvious since the lower flow rate provides more residence timeand hence more adsorbate–adsorbent interaction and more bedheight provides more functional active sites for adsorption, so,more removal and hence, more longevity of the column. Whileanalyzing interactive effects of initial phosphate concentration andbed height (Fig. 4c), it was found that less initial phosphateconcentration and more bed depths resulted in higher values ofbreakthrough time. Along with more functional adsorption sites,delayed adsorption saturation as caused by low initial phosphateconcentration is the causes of elevated breakthrough time in thiscase. Fig. 4d depicts the appearance of lower breakthrough time atthe interactive effect of high initial phosphate concentration andhigh flow rate. This can be attributed to earlier adsorptionsaturation due to high initial phosphate concentration and lowerresidence time as caused by high flow rate. Hence, the combined
f a sponge iron industry by-product for phosphate removal from J Taiwan Inst Chem Eng (2014), http://dx.doi.org/10.1016/

Table 5ANOVA for response surface quadratic model of breakthrough time.
Source ANOVA for response surface quadratic model
Sum of squares df Mean square F value p-Value prob >F
Model 670.76 9 74.53 57.93 <0.0001 Significant
X 529.03 1 529.03 411.24 <0.0001
Y 66.30 1 66.30 51.54 0.0002
Z 62.16 1 62.16 48.32 0.0002
XY 2.00 1 2.00 1.55 0.2525
XZ 0.50 1 0.50 0.39 0.5528
YZ 0.50 1 0.50 0.39 0.5528
X2 0.22 1 0.22 0.17 0.6945
Y2 3.65 1 3.65 2.84 0.1361
Z2 6.27 1 6.27 4.87 0.0631
Residual 9.01 7 1.29
Lack of fit 9.01 5 1.80
Pure error 0.000 2 0.000
Cor total 679.76 16
Model summary statistics
Source Std. Dev. R2 Adjusted R2 Predicted R2 Press
Linear 1.31 0.9672 0.9597 0.9408 40.21
2FI 1.39 0.9716 0.9546 0.8943 71.83
Quadratic 1.13 0.9868 0.9697 0.8984 69.07 Suggested
Cubic 1.00 0.9956 0.9765 0.0262 661.97 Aliased
Fig. 4. Contour response surface plots for breakthrough time: (a) Correlation of actual vs. predicted breakthrough time (b) effect of bed height and flow rate (c) effect bed
height and influent phosphate concentration (d) effect flow rate and influent phosphate concentration.
G Model
JTICE-1023; No. of Pages 11
Please cite this article in press as: Rout PR, et al. Effective utilization of a sponge iron industry by-product for phosphate removal fromaqueous solution: A statistical and kinetic modelling approach. J Taiwan Inst Chem Eng (2014), http://dx.doi.org/10.1016/j.jtice.2014.09.006
P.R. Rout et al. / Journal of the Taiwan Institute of Chemical Engineers xxx (2014) xxx–xxx 7

G Model
JTICE-1023; No. of Pages 11
P.R. Rout et al. / Journal of the Taiwan Institute of Chemical Engineers xxx (2014) xxx–xxx8
effect of both the variables exhibited detrimental effect on theresponse. Similar type of behaviour was observed by Roy et al.(2014) [35].
3.4. Process optimization and experimental validation of batch and
column study
The optimization of the process variables for gaining maximumphosphate removal and maximum breakthrough time is highlyessential. Optimization was done by applying a multiple responsemethod, called desirability function (D). In numerical optimization,the process basically finds a point that maximizes the desirabilityfunction [31]. In point optimization of phosphate removal,maximum removal efficiency, maximum adsorbent dose, maxi-mum initial phosphate concentration, contact time in the range (0–60 min) and pH in the range (2–10) were selected as the mostdesirable targeted criteria for the optimum response. Out of30 alternative solutions, the maximum desirability was found to bea removal efficiency of 98.78% at an adsorbent dose of 5 g/L, initialphosphate concentration of 12 mg/L, contact time of 42.16 min, pH4 and with a desirability level of 0.99.
Correspondingly maximum breakthrough time, maximum bedheight, flow rate in the range (0.66–2.34 mL/min) and influentphosphate concentration in the range (1.59–18.41 mg/L) were setas the targeted criteria for the maximum breakthrough time in thenumerical optimization approach. Out of multiple optimizationalternative generated by RSM, the maximum desirability wasfound to be 23.447 h breakthrough time at a bed height of 4.5 cm,flow rate of 1 mL/min and initial phosphate concentration of 5 mg/L, with a desirability level of 0.966.
To check the adequacy of the suggested optimum set ofparameters, confirmatory experiments were carried out inreplicates both for phosphate removal in batch mode operationand breakthrough time in column mode of operation keeping allthe optimized parameters constant. The resultant removalefficiency (98.13%) and breakthrough time (24.67 h) were closeto those predicted by the model, with the percentage errors of0.65% and 1.23% respectively. The good agreement between thepredicted and experimental results validated the results ofresponse surface optimization and its usefulness in predictingthe responses at optimal operating conditions.
3.5. Possible mechanism of phosphate removal
Concerning mechanism, phosphate removal occurs either via
precipitation or via ligand exchange forming inner-sphere com-plexes. Metal cations and hydroxyl anions (OH�) are generated byhydrolysis of metal oxides as per the following equations [9].
MaObþ bH2O ! aMð2b=aÞþ þ 2bOH� (6)
Table 6Parameters of kinetics and thermodynamics studies.
Pseudo first order model qe (mg/g) k
9.89 0
Pseudo-second order model qe (mg/g) k
10.008 0
Intra-particle diffusion model C k
9.53 0
Langmuir model qm (mg/g) K
398.589 0
Freundlich model Kf (mg/g) n
3.054 3
Temperature (K) DThermodynamic parameters 288 �
298 �308 �318 �
Please cite this article in press as: Rout PR, et al. Effective utilization oaqueous solution: A statistical and kinetic modelling approach.j.jtice.2014.09.006
Mð2b=aÞþ. . . H2PO4� (7)
The cationic species takes part in phosphate uptaking throughelectrostatic interaction, whereas the anionic species is used ininner-sphere ligand exchange mechanism [9]. Similarly, phosphatemetal precipitation occurs as per the equation given below:
3 Maþ þ aPO43� ¼ M3ðPO4Þa (8)
Even in a condition where the pH of the solution is less than thatof the pHzpc of dolochar (11.22), protonation of surface metalhydroxides of the dolochar takes place, thereby attractingnegatively charged phosphate species from the solution phase.The equations could be presented as:
M�OH þ Hþ ! M�OH2þ (9)
M�OH2þ þ H2PO4
� ! M�H2PO4þ H2O (10)
where, M is the metal constituent such as Fe, Al, Ca, Mg, etc. presentin dolochar.
3.6. Equilibrium kinetics, isotherms and thermodynamic studies
To observe the controlling mechanism of adsorption process ofphosphate onto dolochar, the experimental data were fitted topseudo-first order, pseudo-second order and intra-particle diffu-sion kinetic models as per Eqs. (11)–(13), respectively.
qt ¼ qeð1 � expð�k1tÞÞ (11)
qt ¼k2q2
e t
1 þ k2qetð Þ (12)
qt ¼ ki
ffiffitpþ cqt ¼ kit
1=2 (13)
where, qt (mg/g) is the phosphate uptake amount at time t (min), qe
(mg/g) is the phosphate uptake amount at equilibrium, k1 is thefirst order reaction rate constant (min�1) and k2 represents thesecond order reaction rate constant (g/mg/min), ki is the intra-particle diffusion rate constant (mg/g/min1/2), and C is the constantindicating the thickness of the boundary layer. The kineticparameters along with R2 values for all the kinetic models werecalculated by non-linear curve fitting method using Microsoftexcel solver and are given in Table 6. From Fig. 5a it can be observedthat R2 value (0.98) for the pseudo-second order model was muchhigher than that of the pseudo-first order model (R2 = 0.88) andintra-particle diffusion model (R2 = 0.84). Therefore, it can bestated that the adsorption kinetics of phosphate by dolocharfollows the pseudo-second order kinetics, explaining the
1 (min�1) R2
.665 0.883
2 (g/mg/min) R2
.414 0.982
i (mg/g/min1/2) R2
.067 0.845
L (L/mg) R2
.002 0.999
R2
.301 0.914
G8 (kJ/mol) DH8 (kJ/mol) DS8 (J/mol/K)
1727.61 6627 23.64
3242.61
5203.61
7695.21
f a sponge iron industry by-product for phosphate removal from J Taiwan Inst Chem Eng (2014), http://dx.doi.org/10.1016/

Fig. 5. (a) Adsorption kinetic models (conditions: agitation 150 rpm, adsorbent 5 g/L, adsorbate 15 mg/L, pH 4 and room temperature) (b) Adsorption isotherms (Conditions:
agitation 150 rpm, adsorbent 5 g/L, adsorbate 1–50 mg/L, pH 4 and room temperature), (c) Van’t Hoff plot for thermodynamic parameter determination of the adsorption
process (Conditions: agitation 150 rpm, adsorbent 5 g/L, adsorbate 15 mg/L, pH 4 and temperature 15–45 8C).
G Model
JTICE-1023; No. of Pages 11
P.R. Rout et al. / Journal of the Taiwan Institute of Chemical Engineers xxx (2014) xxx–xxx 9
proportionality relationship of the rate of adsorption with thesquare of the number of unoccupied sites on the adsorbentsurface and the concentration of the adsorbate in the solution[9,13]. The straight line nature of the intra-particle diffusionplots (Fig. 5a) may explain that intra-particle diffusion is therate limiting step [31].
The adsorption equilibrium data were fitted to the Langmuirand Freundlich isotherm models in order to deduce theequilibrium relationship between the amount of adsorbate insolution Ce (mg/L) and the amount of adsorbate adsorbed qe (mg/g) at constant temperature. The nonlinear forms of the isothermsare as follows:
qe ¼qmKLCeð Þ
1 þ KLCeð Þ (14)
qe ¼ K f ðCeÞ1=n (15)
where KL is adsorption constant (L/g), that measures the affinity ofthe adsorbent for the solute and qm is the maximum adsorptioncapacity (mg/g), kf (mg/g) is the Freundlich constant whichrepresents the adsorption capacity and ‘n’ is the Freundlich
Please cite this article in press as: Rout PR, et al. Effective utilization oaqueous solution: A statistical and kinetic modelling approach.j.jtice.2014.09.006
exponent that represents the adsorption intensity. The isothermmodel parameters and R2 values were calculated by non-linearcurve fitting method using Microsoft excel solver and are given inTable 6. From Fig. 5b, it is observed that the Langmuir isothermshowed good fit (R2 = 0.99) to the experimental equilibriumadsorption data than that of Freundlich isotherm (R2 = 0.91).Thereby, confirming monolayer sorption on surfaces containingfinite numbers of identical active sites [37]. It is also noticed fromTable 6 that the equilibrium constant KL is 0.002 L/mg, the valueof Kf is 3.054 mg/g and the value of ‘n’ at equilibrium is 3.301. Thevalue of separation factor RL (1/1 + KLC0, where C0 is initialphosphate concentration in mg/L) lies in between 0 and 1 for eachvalue of C0 (1–50 mg/L) considered for isotherm and also thevalue of ‘n’ is found to be greater than 1. Both of the abovementioned conditions indicate the favorable adsorption ofphosphate by dolochar [35,37]. The Langmuir maximum adsorp-tion capacity qm, for phosphate adsorption by dolochar is found tobe 398.589 mg/g. Similarly, Table 7 summarizes the Langmuirmaximum adsorption capacities for phosphate adsorption ofseveral other contemporary adsorbents reported in the literature.The table shows that the adsorption capacity of dolochar is wellahead of the adsorbent capacities of many other adsorbentsreported by earlier researchers.
f a sponge iron industry by-product for phosphate removal from J Taiwan Inst Chem Eng (2014), http://dx.doi.org/10.1016/
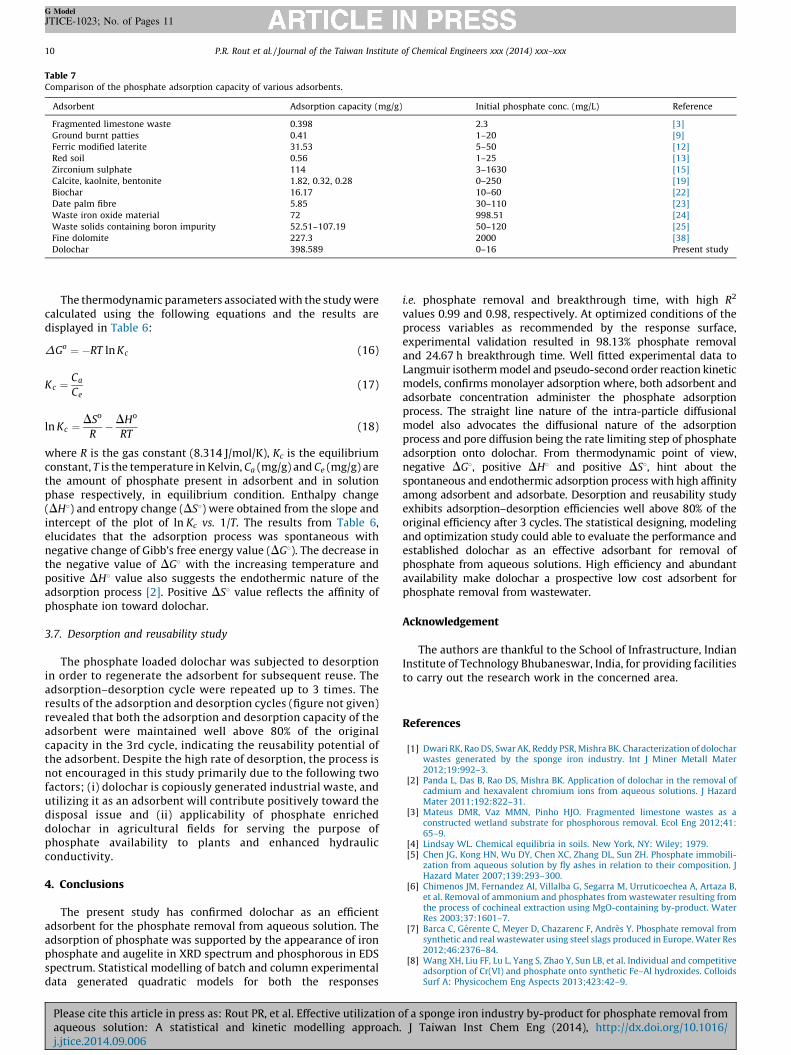
Table 7Comparison of the phosphate adsorption capacity of various adsorbents.
Adsorbent Adsorption capacity (mg/g) Initial phosphate conc. (mg/L) Reference
Fragmented limestone waste 0.398 2.3 [3]
Ground burnt patties 0.41 1–20 [9]
Ferric modified laterite 31.53 5–50 [12]
Red soil 0.56 1–25 [13]
Zirconium sulphate 114 3–1630 [15]
Calcite, kaolnite, bentonite 1.82, 0.32, 0.28 0–250 [19]
Biochar 16.17 10–60 [22]
Date palm fibre 5.85 30–110 [23]
Waste iron oxide material 72 998.51 [24]
Waste solids containing boron impurity 52.51–107.19 50–120 [25]
Fine dolomite 227.3 2000 [38]
Dolochar 398.589 0–16 Present study
G Model
JTICE-1023; No. of Pages 11
P.R. Rout et al. / Journal of the Taiwan Institute of Chemical Engineers xxx (2014) xxx–xxx10
The thermodynamic parameters associated with the study werecalculated using the following equations and the results aredisplayed in Table 6:
DGo ¼ �RT ln Kc (16)
Kc ¼Ca
Ce(17)
ln Kc ¼DSo
R�DHo
RT(18)
where R is the gas constant (8.314 J/mol/K), Kc is the equilibriumconstant, T is the temperature in Kelvin, Ca (mg/g) and Ce (mg/g) arethe amount of phosphate present in adsorbent and in solutionphase respectively, in equilibrium condition. Enthalpy change(DH8) and entropy change (DS8) were obtained from the slope andintercept of the plot of ln Kc vs. 1/T. The results from Table 6,elucidates that the adsorption process was spontaneous withnegative change of Gibb’s free energy value (DG8). The decrease inthe negative value of DG8 with the increasing temperature andpositive DH8 value also suggests the endothermic nature of theadsorption process [2]. Positive DS8 value reflects the affinity ofphosphate ion toward dolochar.
3.7. Desorption and reusability study
The phosphate loaded dolochar was subjected to desorptionin order to regenerate the adsorbent for subsequent reuse. Theadsorption–desorption cycle were repeated up to 3 times. Theresults of the adsorption and desorption cycles (figure not given)revealed that both the adsorption and desorption capacity of theadsorbent were maintained well above 80% of the originalcapacity in the 3rd cycle, indicating the reusability potential ofthe adsorbent. Despite the high rate of desorption, the process isnot encouraged in this study primarily due to the following twofactors; (i) dolochar is copiously generated industrial waste, andutilizing it as an adsorbent will contribute positively toward thedisposal issue and (ii) applicability of phosphate enricheddolochar in agricultural fields for serving the purpose ofphosphate availability to plants and enhanced hydraulicconductivity.
4. Conclusions
The present study has confirmed dolochar as an efficientadsorbent for the phosphate removal from aqueous solution. Theadsorption of phosphate was supported by the appearance of ironphosphate and augelite in XRD spectrum and phosphorous in EDSspectrum. Statistical modelling of batch and column experimentaldata generated quadratic models for both the responses
Please cite this article in press as: Rout PR, et al. Effective utilization oaqueous solution: A statistical and kinetic modelling approach.j.jtice.2014.09.006
i.e. phosphate removal and breakthrough time, with high R2
values 0.99 and 0.98, respectively. At optimized conditions of theprocess variables as recommended by the response surface,experimental validation resulted in 98.13% phosphate removaland 24.67 h breakthrough time. Well fitted experimental data toLangmuir isotherm model and pseudo-second order reaction kineticmodels, confirms monolayer adsorption where, both adsorbent andadsorbate concentration administer the phosphate adsorptionprocess. The straight line nature of the intra-particle diffusionalmodel also advocates the diffusional nature of the adsorptionprocess and pore diffusion being the rate limiting step of phosphateadsorption onto dolochar. From thermodynamic point of view,negative DG8, positive DH8 and positive DS8, hint about thespontaneous and endothermic adsorption process with high affinityamong adsorbent and adsorbate. Desorption and reusability studyexhibits adsorption–desorption efficiencies well above 80% of theoriginal efficiency after 3 cycles. The statistical designing, modelingand optimization study could able to evaluate the performance andestablished dolochar as an effective adsorbant for removal ofphosphate from aqueous solutions. High efficiency and abundantavailability make dolochar a prospective low cost adsorbent forphosphate removal from wastewater.
Acknowledgement
The authors are thankful to the School of Infrastructure, IndianInstitute of Technology Bhubaneswar, India, for providing facilitiesto carry out the research work in the concerned area.
References
[1] Dwari RK, Rao DS, Swar AK, Reddy PSR, Mishra BK. Characterization of dolocharwastes generated by the sponge iron industry. Int J Miner Metall Mater2012;19:992–3.
[2] Panda L, Das B, Rao DS, Mishra BK. Application of dolochar in the removal ofcadmium and hexavalent chromium ions from aqueous solutions. J HazardMater 2011;192:822–31.
[3] Mateus DMR, Vaz MMN, Pinho HJO. Fragmented limestone wastes as aconstructed wetland substrate for phosphorous removal. Ecol Eng 2012;41:65–9.
[4] Lindsay WL. Chemical equilibria in soils. New York, NY: Wiley; 1979.[5] Chen JG, Kong HN, Wu DY, Chen XC, Zhang DL, Sun ZH. Phosphate immobili-
zation from aqueous solution by fly ashes in relation to their composition. JHazard Mater 2007;139:293–300.
[6] Chimenos JM, Fernandez AI, Villalba G, Segarra M, Urruticoechea A, Artaza B,et al. Removal of ammonium and phosphates from wastewater resulting fromthe process of cochineal extraction using MgO-containing by-product. WaterRes 2003;37:1601–7.
[7] Barca C, Gerente C, Meyer D, Chazarenc F, Andres Y. Phosphate removal fromsynthetic and real wastewater using steel slags produced in Europe. Water Res2012;46:2376–84.
[8] Wang XH, Liu FF, Lu L, Yang S, Zhao Y, Sun LB, et al. Individual and competitiveadsorption of Cr(VI) and phosphate onto synthetic Fe–Al hydroxides. ColloidsSurf A: Physicochem Eng Aspects 2013;423:42–9.
f a sponge iron industry by-product for phosphate removal from J Taiwan Inst Chem Eng (2014), http://dx.doi.org/10.1016/

G Model
JTICE-1023; No. of Pages 11
P.R. Rout et al. / Journal of the Taiwan Institute of Chemical Engineers xxx (2014) xxx–xxx 11
[9] Rout PR, Bhunia P, Dash RR. Modelling isotherms, kinetics and understandingthe mechanism of phosphate adsorption onto a solid waste: ground burntpatties. J Environ Chem Eng 2014;2:1331–42.
[10] Yuan M, Carmichael WW, Hilborn ED. Microcystin analysis in human sera and469 liver from human fatalities in Caruaru, Brazil 1996. Toxicon 2006;48:627–40.
[11] USEPA. Ecological restoration: a tool to manage stream quality. In: Report EPA841-F-95-007. Washington: US EPA; 1995.
[12] Huang WY, Zhu RH, He F, Li D, Zhu Y, Zhang YM. Enhanced phosphate removalfrom aqueous solution by ferric-modified laterites: equilibrium, kinetics andthermodynamic studies. Chem Eng J 2013;228:679–87.
[13] Rout PR, Bhunia P, Dash RR. A mechanistic approach to evaluate the effective-ness of red soil as a natural adsorbent for phosphate removal from wastewater.Desalin Water Treat 2014. doi: 10.1080/19443994.2014.881752.
[14] Chen W, Li L, Zhang W, Xu F, Niu M, Wang J, et al. Microwave-assisted driedvolcanic tephra/calcium alginate composite for phosphate removal frommicro-polluted wastewater. Clean-Soil Air Water 2014;42:561–70.
[15] Pitakteeratham N, Hafuka A, Satoh H, Watanabe Y. High efficiency removal ofphosphate from water by zirconium sulfate-surfactant micelle mesostructureimmobilized on polymer matrix. Water Res 2013;47:3583–90.
[16] Hylander LD, Kietlinska A, Renman G, Siman G. Phosphorus retention in filtermaterials for wastewater treatment and its subsequent suitability for plantproduction. Bioresour Technol 2006;97:914–21.
[17] Ren Z, Shao L, Zhang G. Adsorption of phosphate from aqueous solution using aniron–zirconium binary oxide sorbent. Water Air Soil Pollut 2012;223:4221–31.
[18] Zhang Y, Pan B. Modeling batch and column phosphate removal by hydratedferric oxide-based nanocomposite using response surface methodology andartificial neural network. Chem Eng J 2014;249:111–20.
[19] Moharami S, Jalali M. Removal of phosphorus from aqueous solution byIranian natural adsorbents. Chem Eng J 2013;223:328–39.
[20] Ioannou Z, Dimirkou A, Ioannou A. Phosphate adsorption from aqueoussolutions onto goethite, bentonite, and bentonite–goethite system. WaterAir Soil Pollut 2013;224:1374–82.
[21] Hamdi N, Srasra E. Removal of phosphate ions from aqueous solution usingTunisian clays minerals and synthetic zeolite. J Environ Sci 2012;24:617–23.
[22] Peng F, He PW, Luo Y, Lu X, Liang Y, Fu J. Adsorption of phosphate by biomasschar deriving from fast pyrolysis of biomass waste. Clean-Soil Air Water2012;40:493–8.
[23] Riahi K, Chaabane S, Thayer BB. A kinetic modeling study of phosphateadsorption onto Phoenix dactylifera L. date palm fibers in batch mode. J SaudiChem Soc 2013. http://dx.doi.org/10.1016/j.jscs.2013.11.007.
[24] Chen TC, Shih YJ, Chang CC, Huang YH. Novel adsorbent of removal phosphatefrom TFT LCD wastewater. J Taiwan Inst Chem Eng 2013;44:61–6.
Please cite this article in press as: Rout PR, et al. Effective utilization oaqueous solution: A statistical and kinetic modelling approach.j.jtice.2014.09.006
[25] Olgun A, Atar N, Wang S. Batch and column studies of phosphate and nitrateadsorption on waste solids containing boron impurity. Chem Eng J2013;222:108–19.
[26] Wendling LA, Douglas GB, Coleman S, Yuan Z. Nutrient and dissolved organiccarbon removal from natural waters using industrial by-products. Sci TotalEnviron 2013;442:63–72.
[27] Fu JF, Zhao YQ, Razali M, Bruen M. Response surface optimization of phospho-rus species adsorption onto powdered alum sludge. J Environ Sci Health A:Toxic/Hazard Subst Environ Eng 2008;43:1100–7.
[28] Box GEP, Draper NR. Empirical model-building and response surfaces. NewYork, NY: Wiley; 1987.
[29] Lee WPC, Maha SK, Leo CP, Wua TY, Chai SP. Phosphorus removal by NF90membrane: optimisation using central composite design. J Taiwan Inst ChemEng 2014. doi: http://dx.doi.org/10.1016/j.jtice.2014.02.011.
[30] APHA, AWWA, WPCF. Standard methods for the examination of water andwastewater. 20th ed. Washington: American Public Health Association; 1999.
[31] Mourabet M, Rhilassi AE, Boujaady HE, Ziatni MB, Taitai A. Use of responsesurface methodology for optimization of fluoride adsorption in an aqueoussolution by Brushite. Arabian J Chem 2014. doi: http://dx.doi.org/10.1016/j.arabjc.2013.12.028.
[32] Rao KS, Anand S, Rout K, Venkateswarlu P. Response surface optimization forremoval of cadmium from aqueous solution by waste agricultural biosorbentPsidium guvajava L. leaf powder. Clean-Soil Air Water 2012;40:80–6.
[33] Mangwandi C, Albadarin A, Allen S, Walker G. Nutrient recovery from waste-water: optimisation of an adsorption process. Chem Eng Trans 2011;24:1177–82.
[34] Chaudhary N, Balomajumder C. Optimization study of adsorption parametersfor removal of phenol on aluminum impregnated fly ash using responsesurface methodology. J Taiwan Inst Chem Eng 2013. doi: http://dx.doi.org/10.1016/j.jtice.2013.08.016.
[35] Roy P, Mondal NK, Dash K. Modelling of the adsorptive removal of arsenic: astatistical approach. J Environ Chem Eng 2013;2:585–97.
[36] Zheng TT, Sun ZX, Yang XF, Holmgren A. Sorption of phosphate onto meso-porous g-alumina studied with in-situ ATR–FTIR spectroscopy. ChemistryCent J 2012;6:26–36.
[37] Cao J, Wu Y, Jin Y, Yilihan P, Huang W. Response surface methodologyapproach for optimization of the removal of chromium(VI) by NH2-MCM-41. J Taiwan Inst Chem Eng 2013. doi: http://dx.doi.org/10.1016/j.jtice.2013.09.011.
[38] Chirangano M, Ahmad BA, Yoann G, Gavin MW. Removal of ortho-phosphatefrom aqueous solution by adsorption onto dolomite. J Environ Chem Eng 2014.doi: 10.1016/j.jece.2014.04.010.
f a sponge iron industry by-product for phosphate removal from J Taiwan Inst Chem Eng (2014), http://dx.doi.org/10.1016/