Effective parameters for two-phase flow in a porous medium ...celia/cv4papers/Ataie-Ashtiani et...
23
Ž . Journal of Contaminant Hydrology 49 2001 87–109 www.elsevier.comrlocaterjconhyd Effective parameters for two-phase flow in a porous medium with periodic heterogeneities B. Ataie-Ashtiani a , S.M. Hassanizadeh b, ) , M. Oostrom c , M.A. Celia d , M.D. White c a Department of CiÕil Engineering, Sharif UniÕersity of Technology, Iran b Hydrology and Ecology Section, Faculty of CiÕil Engineering and Geosciences, and Centre for Technical Geoscience, Delft UniÕersity of Technology, PO Box 5048, 2600 Delft, GA, Netherlands c EnÕironmental Technology DiÕision, Pacific Northwest National Laboratory, USA d Department of CiÕil Engineering, Princeton UniÕersity, Princeton, USA Received 20 April 2000; received in revised form 7 November 2000; accepted 8 November 2000 Abstract Computational simulations of two-phase flow in porous media are used to investigate the feasibility of replacing a porous medium containing heterogeneities with an equivalent homoge- neous medium. Simulations are performed for the case of infiltration of a dense nonaqueous phase Ž . liquid DNAPL in a water-saturated, heterogeneous porous medium. For two specific porous media, with periodic and rather simple heterogeneity patterns, the existence of a representative Ž . elementary volume REV is studied. Upscaled intrinsic permeabilities and upscaled nonlinear constitutive relationships for two-phase flow systems are numerically calculated and the effects of heterogeneities are evaluated. Upscaled capillary pressure–saturation curves for drainage are found to be distinctly different from the lower-scale curves for individual regions of heterogeneity. Irreducible water saturation for the homogenized medium is found to be much larger than the corresponding lower-scale values. Numerical simulations for both heterogeneous and homoge- neous representations of the considered porous media are carried out. Although the homogenized model simulates the spreading behavior of DNAPL reasonably well, it still fails to match completely the results form the heterogeneous simulations. This seems to be due, in part, to the nonlinearities inherent to multiphase flow systems. Although we have focussed on a periodic heterogeneous medium in this study, our methodology is applicable to other forms of heteroge- ) Corresponding author. Tel.: q 31-15-278-7346; fax: q 31-15-278-5915. Ž . E-mail address: [email protected] S.M. Hassanizadeh . 0169-7722r01r$ - see front matter q 2001 Elsevier Science B.V. All rights reserved. Ž . PII: S0169-7722 00 00190-X
-
Upload
truongdang -
Category
Documents
-
view
220 -
download
3
Transcript of Effective parameters for two-phase flow in a porous medium ...celia/cv4papers/Ataie-Ashtiani et...

Ž .Journal of Contaminant Hydrology 49 2001 87–109www.elsevier.comrlocaterjconhyd
Effective parameters for two-phase flow in a porousmedium with periodic heterogeneities
B. Ataie-Ashtiani a, S.M. Hassanizadeh b,), M. Oostrom c,M.A. Celia d, M.D. White c
a Department of CiÕil Engineering, Sharif UniÕersity of Technology, Iranb Hydrology and Ecology Section, Faculty of CiÕil Engineering and Geosciences, and Centre for Technical
Geoscience, Delft UniÕersity of Technology, PO Box 5048, 2600 Delft, GA, Netherlandsc EnÕironmental Technology DiÕision, Pacific Northwest National Laboratory, USA
d Department of CiÕil Engineering, Princeton UniÕersity, Princeton, USA
Received 20 April 2000; received in revised form 7 November 2000; accepted 8 November 2000
Abstract
Computational simulations of two-phase flow in porous media are used to investigate thefeasibility of replacing a porous medium containing heterogeneities with an equivalent homoge-neous medium. Simulations are performed for the case of infiltration of a dense nonaqueous phase
Ž .liquid DNAPL in a water-saturated, heterogeneous porous medium. For two specific porousmedia, with periodic and rather simple heterogeneity patterns, the existence of a representative
Ž .elementary volume REV is studied. Upscaled intrinsic permeabilities and upscaled nonlinearconstitutive relationships for two-phase flow systems are numerically calculated and the effects ofheterogeneities are evaluated. Upscaled capillary pressure–saturation curves for drainage arefound to be distinctly different from the lower-scale curves for individual regions of heterogeneity.Irreducible water saturation for the homogenized medium is found to be much larger than thecorresponding lower-scale values. Numerical simulations for both heterogeneous and homoge-neous representations of the considered porous media are carried out. Although the homogenizedmodel simulates the spreading behavior of DNAPL reasonably well, it still fails to matchcompletely the results form the heterogeneous simulations. This seems to be due, in part, to thenonlinearities inherent to multiphase flow systems. Although we have focussed on a periodicheterogeneous medium in this study, our methodology is applicable to other forms of heteroge-
) Corresponding author. Tel.: q31-15-278-7346; fax: q31-15-278-5915.Ž .E-mail address: [email protected] S.M. Hassanizadeh .
0169-7722r01r$ - see front matter q2001 Elsevier Science B.V. All rights reserved.Ž .PII: S0169-7722 00 00190-X

( )B. Ataie-Ashtiani et al.rJournal of Contaminant Hydrology 49 2001 87–10988
neous media. In particular, the procedure for identification of a REV, and associated upscaledconstitutive relations, can be used for randomly heterogeneous or layered media as well. q 2001Elsevier Science B.V. All rights reserved.
Keywords: Effective parameters; Two-phase flow; Heterogeneous porous media; Upscaling; Capillary pres-sure–saturation curve
1. Introduction
Ž .The study of nonaqueous phase liquid NAPL transport in groundwater requires acorrect description of multiphase flow in porous media. Such a description involves anumber of material-dependent parameters, including relationships between capillary
Ž c r .pressure, saturation, and relative permeability P –S–k relationships. These relation-ships are highly nonlinear and their determination is often a difficult task. This task ismade even more difficult when the material under study is heterogeneous. One of themajor difficulties in defining multiphase flow properties is the presence of small-scaleheterogeneities, where different geologic materials may occur over a length scale ofcentimetres to tens of centimetres. Such length scales correspond to the size of commonmeasuring devices, such as laboratory pressure cells, and to the typical size of corestaken at field sites. Therefore, identification of material properties at this scale is inprinciple possible. The measured properties, including the nonlinear functional relation-ships, can vary widely over this length scale. Such variability can significantly affectoverall flow properties of the system, including such factors as the spreading behavior ofnon-aqueous liquids. These heterogeneities can also produce localized pools of NAPL.
While the detailed structure of the porous medium governs the overall behavior of thesystem, for most practical purposes the detailed fluid distribution in such a medium isnot of interest. Rather, we are commonly interested in more global measures andassessments of the NAPL movement. Also, even if we choose to resolve the system atthe small scale, it is currently computationally infeasible to discretize a compositionalmultiphase model at such small scales. Furthermore, even if a detailed numerical modelis constructed and run, it is virtually impossible to obtain data for all of theseheterogeneities for a large domain. Thus, we are motivated to derive effective propertiesthat incorporate the influences of small-scale heterogeneities and can be employed in anequivalent homogenous model of the porous medium applied at length scales larger thanthe individual heterogeneities.
Considerable work has been directed at the problem of upscaling permeabilities forsingle-phase flow. These works have been reviewed recently in papers by Wen and
Ž . Ž .Gomez-Hernandez 1996 and Renard and de Marsily 1997 . The techniques forupscaling saturated permeability range from the simple averaging of heterogeneousvalues within an averaging block to sophisticated inversions, after the solution of theflow equation at the measurement scale within an area surrounding the block. Alltechniques have their own advantages and limitations. It is now understood that upscaledpermeabilities depend on the geometry and properties of the fine-scale permeabilities,the boundary conditions imposed on the region to be upscaled, and the discretisation

( )B. Ataie-Ashtiani et al.rJournal of Contaminant Hydrology 49 2001 87–109 89
pattern used in the numerical flow model. Approximations based on assumptions such asstructured heterogeneity and periodic boundary conditions lead to more general upscal-
Ž .ing relations Miller et al., 1998 .Upscaling of constitutive relations for multiphase flow is significantly different from
that for single-phase flow due to inherent nonlinearities. Upscaling of the intrinsicpermeability in a multiphase flow system, without upscaling of P c–S–k r relations, has
Ž .been done. For example, Durlofsky et al. 1997 have applied a flexible grid method toupscale the permeability in a multiphase flow system while a single P c–S–k r relationwas assumed for the whole medium. There is a significant literature on the upscaling
Ž .issues in petroleum engineering. Fayers and Hewett 1992 give a general review of thetrends of scaling problems in petroleum reservoir simulation. A more recent review is
Ž .given by Christie 1996 , and a critical review of pseudofunctions for upscaling relativeŽ .permeabilities is presented by Barker and Thibeau 1997 . Formally exact methods for
upscaling two-phase flow problems are not available. Two main approaches can beŽidentified: upscaling through use of representative elements of volume Haldorsen,
. Ž .1986 and complete renormalization King, 1989; King et al., 1993 . In fact, theupscaling through representative elements of volume approach is really a form ofrenormalization in which the reservoir description is viewed as composed of a numberof regions which are classified into types. In the renormalization method, the focus is onusing a fast approximate method to determine average properties for much smaller unitsof volume than those of the representative elements of volume concept. But, in this case,the averaging is performed consistently for every renormalization element in the
Ž .reservoir Fayers and Hewett, 1992 .Ž .Amazine et al. 1991 have developed a homogenisation approach and applied it to
the case of two-phase transient flow in periodically heterogeneous media. They havec r Ž .assumed constant-shape P –S–k relationships for the domain. Desbarats 1995 inves-
tigated the upscaling of capillary pressure–saturation relationships under static condi-tions of capillary gravity equilibrium. The averaging regions are horizontal layers,parallel to the phreatic surface, as in one-dimensional models of infiltration. They didnot consider any upscaling of relative permeability–saturation curves. Honarpour et al.Ž .1995 examined upscaling of both capillary pressure and relative permeability curves,and observed that small-scale layering and laminations present in sandstone coresproduced significant capillary effects that affected the oil recovery behavior. In these
Žand many similar studies see the review articles referenced above for additional.examples , the main conclusion is that upscaling two-phase flow properties remains a
difficult task for which additional research is needed. Overall, the study of the literaturereveals that general approaches for upscaling of P c–S–k r relations still need to bedeveloped.
In the present work, the feasibility of replacing a medium containing heterogeneitieswith an equivalent homogeneous medium is studied. The main question is whether themean spreading behaviour of NAPL in a heterogeneous medium can be reproduced withthe aid of the equivalent homogeneous medium. In order to focus on specific aspects ofthe problem, we have considered rather simple heterogeneity patterns here. In particular,we have constructed two periodic heterogeneous porous media, for which the averagesaturated permeability and P c–S–k r relations are computed. The scale at which

( )B. Ataie-Ashtiani et al.rJournal of Contaminant Hydrology 49 2001 87–10990
effective parameters may be defined is determined based on the concept of a representa-Ž .tive elementary volume REV . The REV defines the ’larger scale’ and is used to
compute upscaled constitutive relationships, based on high-resolution simulations thatincorporate the small-scale heterogeneities.
Numerical simulations are carried out for both heterogeneous and homogeneousrepresentations of the considered porous medium. The simulations are conducted with
Žthe water–oil mode of the multi-fluid flow simulator STOMP White and Oostrom,.1997 . Processes modeled in STOMP and its numerical features are described in Section
2. In Section 3, STOMP is used to simulate a laboratory experiment on DNAPLinfiltration. The results are compared to two other model simulations of this experiment.This exercise serves as verification of STOMP’s ability to simulate heterogeneoussystems, and also provides insights into proper boundary condition specification forcertain two-phase flow problems. In Section 4, two periodic heterogeneous porousmedia are defined and their characteristics are specified. In Section 5, the infiltrationevent of a DNAPL in these two systems is simulated taking into account the details ofheterogeneity. In Section 5, the procedure for upscaling properties of a heterogeneousmedium is described and the equivalent homogeneous medium is defined. In Section 6,results of simulations of the DNAPL infiltration event, using the homogeneous descrip-tion of the system, are presented and compared with the detailed simulation results.Finally, conclusions are presented in Section 7.
Although we focus on a periodic heterogeneous medium in this study, our methodol-ogy is applicable to other forms of heterogeneous media. In particular, the procedure forthe identification of a REV can be used for randomly heterogeneous or layered media aswell.
2. Numerical model
Ž .The numerical simulator Subsurface Transport Over Multiple Phases STOMPŽ .White and Oostrom, 1997 is used herein to simulate two-phase flow in porous media.STOMP is a package consisting of 11 modes for simulation of non-isothermal multi-phase flow and multi-component transport in a heterogeneous medium in three dimen-sions. This fully implicit, integrated finite difference code has been used to simulate a
Žvariety of multi-fluid systems e.g. Oostrom and Lenhard, 1998; Schroth et al., 1998;.Oostrom et al., 1997 . The simulations discussed in this paper were conducted with a
non-hysteretic two-phase version of the water–oil mode of STOMP. In this mode, theŽ . Ž .following mass balance equations for the water superscript w and oil superscript o
phases are solved:
Enr S sy=q for gsw,o. 1Ž .Ž .g g g
Et
In addition, the multiphase version of Darcy’s equation is used:
r k kg rgq sy = P qr gz forgsw,o. 2Ž .Ž .g g g g
mg

( )B. Ataie-Ashtiani et al.rJournal of Contaminant Hydrology 49 2001 87–109 91
Ž y3 .In these equations, n is porosity, r is the density ML , S is the saturation, q is theŽ y2 y1. Ž .fluid flux ML T , k is the relative permeability – , k is the intrinsic permeabilityr
Ž 2 . Ž y1 y1. Ž y1 y2 .tensor L , m is the viscosity ML T , P is the pressure ML T , g is theŽ y2 .gravitational acceleration LT , z is the unit vector assumed positive in the verticalg
Ž . Ž .direction, subscript g corresponds to the aqueous w or nonaqueous o phase.Ž . Ž .In addition to the well-known Van Genuchten 1980 or Brooks and Corey 1964
capillary pressure–saturation relations, this version of the simulator also allows fortabular input of fluid saturations and pressures to define the constitutive relationshipbetween capillary pressure and saturation. Relative permeability–saturation relations are
Ž .interpolated from tabular input or computed based on either the Burdine 1953 orŽ .Mualem 1976 pore-size distribution model. To accommodate the type of upscaling
Žstudies performed herein, the code has been modified to allow for directionally x, y,.and z dependent relative permeability–saturation relations, in addition to the traditional
scalar version of these relationships.
3. Model verification
In this section, we demonstrate the applicability of the STOMP model to heteroge-neous media and test its ability to simulate a multi-fluid laboratory experiment. The
Ž .simulated experiment is described fully by Kueper et al. 1989 . In this experiment,Ž .tetrachloroethylene PCE infiltrates into a sand pack composed of layers of four
different kinds of sand. The configuration of the assembled sand lenses is shown in Fig.1. Table 1 gives sand properties including permeability and Brooks–Corey parametersŽ .Brooks and Corey, 1964 of the PCE-water drainage capillary pressure curve. These are
Ž .best-fit parameter values that were obtained by Kueper et al. 1989 by matching theBrooks–Corey model to experimental data.
ŽFig. 1. Configuration and boundary conditions for simulation of PCE infiltration in a flow tank after Kueper.et al., 1989 .

( )B. Ataie-Ashtiani et al.rJournal of Contaminant Hydrology 49 2001 87–10992
Table 1Ž .Properties of sands used by Kueper et al. 1989
Units Sand 1 Sand 2 Sand 3 Sand 42 y10 y10 y11 y12w xPermeability k m 5.04=10 2.05=10 5.62=10 8.19=10
w xPorosity n – 0.4 0.39 0.39 0.41w xEntry pressure p m 0.0377 0.0377 0.0377 0.1350dw xPore size distribution index l – 3.86 3.51 2.49 3.30w xResidual saturation S – 0.078 0.069 0.098 0.189wr
At the beginning of the experiment, dyed PCE was released into the initiallywater-saturated sand. The source area at the center of the top of the sand pack wassubjected to a constant head of 4 cm of PCE, which is equal to a fluid pressure of 640Pa. The PCE has a density of 1630 kg my3and a viscosity of 0.90=10y3 Pa s. ThePCE propagation in time was visually recorded; no measurement of saturation within the
Ž .medium was made. The experiment was simulated by Kueper and Frind 1991 using afinite element model. An acceptable match was found between experimental andsimulated results when a constant PCE saturation of 0.38 was assumed at the PCE
Ž .source. Helmig 1997 also simulated this experiment with a PCE saturation of 0.40imposed at the source points.
In our simulations, we looked specifically into the influence of boundary conditionsat the source on the resulting solutions. Two different sets of boundary conditions wereemployed there. The first set is similar to the boundary conditions used by Kueper and
Ž . Ž .Fig. 2. a Observed distributions of PCE after 34, 126, 184, 220, 313 s; b simulated distribution of TCE afterŽ .30, 130, 180, 220, 310 s with Dirichlet B.C. for DNAPL and zero-flux B.C. for water at source nodes; c
simulated distribution of PCE after 30, 130, 180, 220, 310 s with Dirichlet B.C. for both PCE and for water atsource nodes.

( )B. Ataie-Ashtiani et al.rJournal of Contaminant Hydrology 49 2001 87–109 93
Ž . Ž .Frind 1991 and Helmig 1997 , resulting in a constant saturation condition at thesource boundary. This was achieved by imposing Dirichlet boundary conditions: a
Ž .constant PCE pressure of 640 Pa equal to 4 cm of NAPL for non-wetting phase and aconstant pressure of 213 Pa for water. This amounts to a capillary pressure, P , of 427c
Pa corresponding to a PCE saturation of 39%. In the second set, the same boundaryŽ .condition for PCE was employed a constant pressure of 640 Pa but a zero-flux
boundary condition was used for water. Boundary conditions for the remainder ofdomain boundaries are shown in Fig. 1. The domain was discretized using a constantnodal spacing of 1.25 cm in both horizontal and vertical directions. A time step of 10 swas used throughout the simulation.
Fig. 2 illustrates the distribution of fluids in the sand pack at various times based onexperimental and numerical results. As is evident, the agreement between experimentaland numerical values is reasonable. Comparison of the last two figures in Fig. 2a,b, and
Ž .c shows that the second boundary condition set with zero flux for water yields asomewhat better match with experimental results. Further evidence of the superiority of
Ž . Ž .Fig. 3. a Aqueous and PCE saturation in the node below the source. b Aqueous and PCE fluxes at sourcepoints.

( )B. Ataie-Ashtiani et al.rJournal of Contaminant Hydrology 49 2001 87–10994
the zero-flux boundary condition is illustrated in Fig. 3, where the PCE saturation at oneof the nodes below the source and the aqueous and DNAPL fluxes at source points areplotted. The plots show that application of the Dirichlet boundary condition in thenumerical simulation leads to a flux of water into the medium through the PCE sourcearea. This is not a correct result as in the experiment only PCE infiltrated into themedium. Therefore, the second set of boundary conditions is physically more realisticand appears to give somewhat better results. Overall, this exercise gives us confidence inthe applicability of STOMP simulator to heterogeneous porous media of the kind that isinvestigated in the rest of this manuscript, while demonstrating the potential importanceof boundary condition specification in DNAPL infiltration problems.
4. Definition of test cases
In this section, we define two heterogeneous porous media to be used in ourupscaling procedure. We are not considering the case of large-scale heterogeneities,which should be modeled explicitly in any flow simulation. Our focus is on hetero-geneities with a small correlation length, which are amenable to upscaling and homoge-
Žnization. In this work, we consider two periodic media: a straight pattern porous. Ž .medium P-1 and a staggered pattern porous medium P-2 . The two media are
illustrated in Fig. 4. These particular patterns of heterogeneity are chosen for theirsimplicity. Our main goal is not to investigate the influence of various types ofheterogeneity but to test our upscaling procedure. Therefore, we prefer to avoidintroducing complications due to intricate heterogeneity patterns. Moreover, very similar
Žpatterns have been considered in other upscaling studies see e.g. Amazine et al., 1991;.Durlofsky, 1991; Bourgeat and Hidani, 1995 and by authors who apply mathematical
Ž .homogenization techniques see e.g. Beliaev and Kozlov, 1993; Panfilov, 1998 . Thus,our numerical results may be used for comparison purposes in evaluating the results ofhomogenization theories.
The hypothetical porous media P-1 and P-2 have dimensions and properties compara-ble to the sand tank used in the Kueper et al. experiment. The white background in Fig.4 is coarse-grained sand while the black areas designate fine-grained sand. The
Ž .properties of the coarse-grained sand are the same as Sand 1 in Kueper et al. 1989 ,whereas the properties of the fine-grained sand are a combination of Sands 3 and 4.Pertinent sand properties, including permeability and Brooks–Corey parameters of thePCE-water main-drainage capillary pressure curve, are listed in Table 2. Fluid propertiesof PCE are the same as those given in the pervious section.
Ž .The computational domain Fig. 4 was discretized using a constant nodal spacing of1.25 cm in both horizontal and vertical directions. A time step of 10 s was usedthroughout the simulation. The maximum number of Newton iterations was 32, with aconvergence factor of 10y6. Upwind interfacial averaging was used for PCE and waterrelative permeabilities. Harmonic averages were used for all other flux components.
In the simulations, PCE is released into initially water-saturated sand. The PCEŽ .source area is 10 cm long and is at the center of the top boundary see Fig. 4 . A
constant PCE-flux of 3.15=10y4 mrs is uniformly assigned to the source area. Our

( )B. Ataie-Ashtiani et al.rJournal of Contaminant Hydrology 49 2001 87–109 95
Ž . Ž .Fig. 4. Two periodic patterns of heterogeneity: a P-1 and b P-2. The white background is coarse-grainedsand while the black areas designate fine-grained sand.
choice of boundary condition guarantees that the amount of DNAPL infiltrating themedium will be the same for all cases. Thus, differences in the distribution of DNAPL,calculated for different cases, will be due only to choices in soil properties and not dueto the source boundary conditions. In this section, results of numerical simulations basedon actual characteristics of the medium are presented and discussed.
Table 2Properties of sands used in upscaling simulations
Property Units Coarse-grained sand Fine-grained sand2 y10 y11w xPermeability k m 5.0=10 5.0=10
w xPorosity n – 0.4 0.4w xEntry pressure p m 0.0377 0.1350dw xPore size distribution index l – 3.86 2.49w xResidual saturation S – 0.078 0.098wr

( )B. Ataie-Ashtiani et al.rJournal of Contaminant Hydrology 49 2001 87–10996
Ž . Ž . Ž . ŽFig. 5. Simulated PCE saturations after 500 s for a pattern P-1 upper graph , and b pattern P-2 lower.graph . The assigned porous medium properties for the coarse- and fine-grained sand are listed in Table 2.
Ž . Ž . Ž . ŽFig. 6. Simulated PCE saturations after 500 s for a patterns P-1 upper graph and b pattern P-2 lower.graph when coarse-grained sand multiphase parameters were assigned to the fine-grained sand. Both sands
maintained their actual permeability values.

( )B. Ataie-Ashtiani et al.rJournal of Contaminant Hydrology 49 2001 87–109 97
Fig. 5 shows the distribution of the PCE plume for the two porous media configura-tions, P-1 and P-2, after 500 s of infiltration. As seen in this figure, the PCE saturationdistribution is quite different for the two cases, due to the difference in heterogeneitypatterns. The horizontal spreading of PCE is larger in the P-2 medium than in the P-1medium. This is because in the staggered pattern, fine sand blocks cause pooling of PCEand force it to move horizontally. Differences in both the saturated permeabilities andthe two-phase flow parameters contribute to the differences in flow patterns. This latterobservation is based on the next series of simulations, where we have assumed thatfine-grained sand has the same P c–S–k r relations as the coarse-grained sand whilemaintaining its own intrinsic permeability value. Fig. 6 illustrates the PCE saturationdistribution for this case in patterns P-1 and P-2 at 500 s. Obviously, differencesbetween Figs. 5 and 6 are due to the influence of heterogeneity in the P c–S–k r
relations. Comparison of the two figures shows that when heterogeneities in constitutiverelationships are ignored, less spreading of PCE is observed. The effect is mostsignificant in the fine sand. It is seen from Fig. 5 that in these simulations, PCEsaturation remains zero in the fine media when P c–S–k r effects are included. This isbecause the capillary pressure at the fine sand surface remains below the entry pressureof PCE for this material. Ignoring the P c–S–k r effects of fine sand, however, results inPCE entering the fine sand as seen in Fig. 6.
5. Upscaling of two-phase flow parameters
For the calculation of upscaled permeabilities and constitutive relationships, we needto identify representative domains for patterns P-1 and P-2. This was achieved by
Ž .applying the concept of a representative elementary volume REV . Results of simula-Ž .tions with actual properties Fig. 5 were used to determine whether a REV could be
defined. The procedure is as follows. Consider the saturation distribution of medium P-2Ž .at 500 s Fig. 5b . At every nodal point, the PCE saturation is averaged over an
averaging volume, centered at that point, and the result is assigned to that nodal point.Contours of averaged DNAPL saturation obtained with seven different averaging sizesare plotted in Fig. 7a–i. The smallest averaging block has a size of 3=3 grid elementsand the largest is 17=17. The black border indicates the area where no averagesaturation can be defined; the width of the black border is equal to half the averagingdomain length. Obviously, simulations with the homogenized media will lack the localdetails obtained with the heterogeneous simulations. This is evident in Fig. 7 where localeffects become less and less distinguishable as the averaging domain size is increased.
Ž .For example, for the averaging domain of 9=9 elements center figure and larger,local pools are not easily recognizable, although they have not fully vanished.
Fig. 8 shows the plot of averaged PCE saturation as a function of the averaging area,Ž .at three different points: within the coarse sand solid squares , within the fine sand
Ž . Ž .open squares , and at their boundary solid triangles . The graphs resemble the typicalŽ .graphs given for the definition of a REV see e.g. Bear, 1972 . Here, however, the
fluctuations in average saturation do not die off completely even for an averaging size aslarge as half the domain size. This is, we believe, due to the fact that the length scale of

( )B. Ataie-Ashtiani et al.rJournal of Contaminant Hydrology 49 2001 87–10998
Fig. 7. Contours of average PCE saturations at ts500 s obtained with averaging domain sizes of 1=1, 3=3,5=5, 7=7, 9=9, 11=11, 13=13, 15=15 and 17=17 elements, from left to right and from top to bottom,respectively. Note that the black border indicates the area where no average saturation can be defined. Thewidth of this border is equal to half the averaging block size.
heterogeneities is not small compared to the source size, which is the length scale of thespreading process. Thus, strictly speaking, one cannot identify a proper REV here.However, the amplitude of these fluctuations reduces to a negligible amount in the earlypart of the graph. Therefore, based on results of Fig. 8, a block of 10=10 cm isconsidered to be an appropriate REV and is employed for homogenization of constitu-tive properties of the medium in this work. Corresponding representative blocks for
Fig. 8. Variation in PCE saturations after 500 s in domain P-2 vs. averaging block area.

( )B. Ataie-Ashtiani et al.rJournal of Contaminant Hydrology 49 2001 87–109 99
patterns P-1 and P-2 are shown in Fig. 9. Note that their size equals the size ofperiodicity of the two patterns, which we might expect given the structural regularity ofthe heterogeneity.
Next, average permeabilities and constitutive relationships for our representativeblocks were calculated numerically. The procedure is as follows. A unidirectional flowof both water and PCE is established across a block. This is achieved by applying, at theblock faces perpendicular to the flow direction, a constant pressure P nw for PCE and aconstant pressure P w for the aqueous phase. The difference P csP nw yP w is chosento be the same at both ends, which means that the same capillary pressure exists at theboundaries. The pressure differences across the block, DP w and DP nw, are kept at avalue of 100 Pa for both fluids in all simulations. This corresponds to a pressure gradient
Ž .comparable to that observed in the main medium Fig. 5 . Meanwhile, no-flow boundaryconditions are imposed on the block faces parallel to the flow. Simulations for a givenP c are carried out until apparent equilibrium is reached. Average saturation anddirectional k r-values are then calculated for the block. After equilibrium conditions have
c Ž w nwbeen reached, P is increased incrementally up to 10,000 Pa holding DP sDP s. c100 Pa and the procedure is repeated for every new P . Fig. 10 shows the imposed
water, DNAPL, and capillary pressures on the top of REV blocks. In this fashion,constitutive relationships are obtained for each block in two different directions.
Ž . Ž . Ž . Ž . Ž .Fig. 9. Considered elementary blocks REV for patterns a P-1 upper figure and b P-2 lower figure .
( )B. Ataie-Ashtiani et al.rJournal of Contaminant Hydrology 49 2001 87–109100
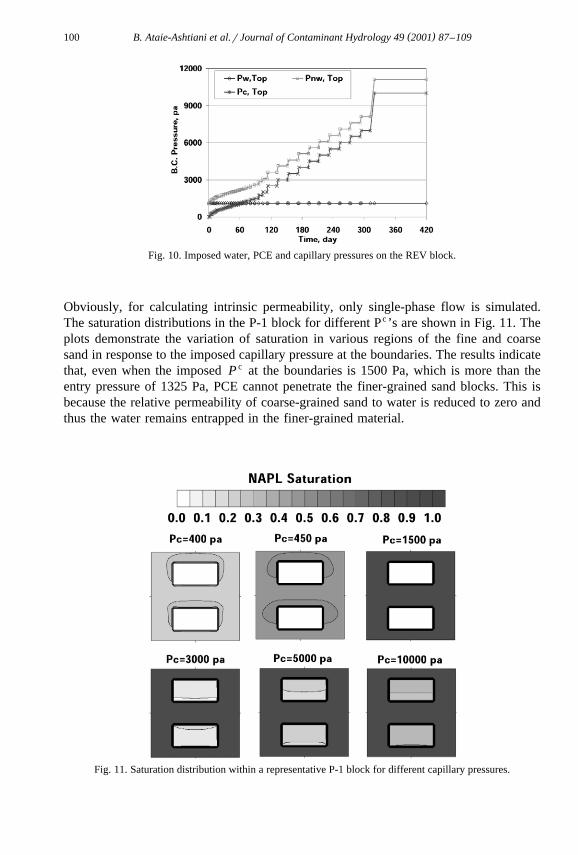
Fig. 10. Imposed water, PCE and capillary pressures on the REV block.
Obviously, for calculating intrinsic permeability, only single-phase flow is simulated.The saturation distributions in the P-1 block for different Pc ’s are shown in Fig. 11. Theplots demonstrate the variation of saturation in various regions of the fine and coarsesand in response to the imposed capillary pressure at the boundaries. The results indicatethat, even when the imposed P c at the boundaries is 1500 Pa, which is more than theentry pressure of 1325 Pa, PCE cannot penetrate the finer-grained sand blocks. This isbecause the relative permeability of coarse-grained sand to water is reduced to zero andthus the water remains entrapped in the finer-grained material.
Fig. 11. Saturation distribution within a representative P-1 block for different capillary pressures.

( )B. Ataie-Ashtiani et al.rJournal of Contaminant Hydrology 49 2001 87–109 101
c r Ž .Fig. 12 gives P –S–k curves for the two sands fine and coarse and the homoge-nized curves for the two blocks. As seen, the upscaled constitutive relationships aredistinctly different from the corresponding curves for fine and coarse sands. It is evidentthat a simple arithmetic averaging of properties of the two sands cannot represent thehomogenized situation. The residual saturation is significantly larger for the equivalent
Fig. 12. P c – S – k r relations for the elementary blocks.

( )B. Ataie-Ashtiani et al.rJournal of Contaminant Hydrology 49 2001 87–109102
medium. From Fig. 12a, one may conclude that the upscaled P c–S curves are almost thesame for both patterns. For the most part there is little directional dependence. There is adiscrepancy for the P c–S curves of pattern P-2 in the horizontal direction. This is anumerical artifact that is caused by the interplay of the fine material with Dirichletboundary conditions. When flow is in the horizontal direction, the fine sand in patternP-2 will be in contact with the inflow boundary. As a result, it will be fully saturatedwith PCE as soon as the boundary P c exceeds entry pressure of fine sand. But when1-D flow is established in the vertical direction, the coarse sand may reach its residual
Ž .water saturation and thus no permeability to water and cause the entrapment of waterinside the fine material. These results are consistent with those of Ferrand and CeliaŽ . c1992 , who used a pore-scale network model to analyze P –S curves for similarpatterns of heterogeneity.
The upscaled relative permeability curves are significantly different from those offine and coarse sands. More significantly, they are directional dependent. This is incontrast with the common assumption that relative permeability is a scalar property. Thisdependency is not because of boundary condition effects; it is observed even before PCEenters the fine sand. This appears to be a general characteristic of heterogeneous media.
Ž .It is consistent with the stochastic results of Yeh et al. 1985 , who showed that theŽ .anisotropy ratio horizontalrvertical of effective conductivity is a function of mean
capillary pressure or mean moisture content. A similar result was obtained by, amongŽ .others, Braun et al. 1998 for a stratified porous medium.
6. Simulations with effective two-phase flow parameters
In this section, results of simulations with homogenized two-phase flow parametersare presented and discussed. Obviously, such results do not show the kind of detail inthe saturation distribution that was shown in Fig. 5. Thus, they should not be compareddirectly with results of the detailed simulations, but instead with the averages of thesaturation distribution such as those presented in Fig. 7.
In replacing the heterogeneous medium with an equivalent homogeneous medium,one has a number of choices. One choice is to ignore the presence of fine sand blocksand assume that the medium is homogeneous with properties similar to that of thecoarse-grained sand. Another choice would be to include the effect of saturatedpermeability of the fine-grained sand but ignore its two-phase flow characteristic. Athird alternative is to include both permeability and two-phase flow effects. All threealternatives are simulated here. The averaged saturation distribution and results ofvarious simulations are presented in Figs. 13 and 14, for patterns P-1 and P-2,respectively. In each figure, results of five different simulations, as described below, aregiven.
v Graphs R1 show the average of saturation distributions depicted in Fig. 5, where allŽ .heterogeneity details are included see Section 5 . The saturation distributions shown in
Ž .Fig. 5 are averaged over representative blocks of size 10=10 cm as depicted in Fig. 8 ,following the procedure described in Section 5. Note that the black border indicates thearea where no average saturation can be defined. The width of this border is equal tohalf the averaging block size.

( )B. Ataie-Ashtiani et al.rJournal of Contaminant Hydrology 49 2001 87–109 103
Fig. 13. PCE saturations after 310 s for pattern P-1. Results are shown for R1, R2, H1, H2 and H3 cases.
v Graphs R2 show the average of saturation distributions depicted in Fig. 6, whereheterogeneity in intrinsic permeability is included but two-phase flow properties of
Ž .coarse-grained sand are used for both sands see Section 5 . Here too, the saturation

( )B. Ataie-Ashtiani et al.rJournal of Contaminant Hydrology 49 2001 87–109104
Fig. 14. PCE saturations after 310 s for pattern P-2. Results are obtained for cases R1, R2, H1, H2 and H3.
distributions shown in Fig. 6 are averaged over representative blocks of Fig. 8, followingthe procedure described in Section 5.

( )B. Ataie-Ashtiani et al.rJournal of Contaminant Hydrology 49 2001 87–109 105
v Graphs H1 show results of AhomogenizedB simulations where permeability andconstitutive relationships of coarse-grained sand are used for both sands. In other words,the presence of fine-grained sand blocks is completely neglected.
v Graphs H2 show results of AhomogenizedB simulations with numerically calculatedaverage permeability for the medium and with two-phase flow parameters of coarse-grained sand used for both sands.
v Graphs H3 show results of homogenized simulations with numerically calculatedaverage permeability and with upscaled two-phase flow parameters obtained in Section6. As explained earlier, there is little directional dependency for upscaled P c–S curves,thus the results of vertical cases have been employed here. However, the directionaldependency of k r–S curves have been considered in these simulations.
Fig. 15. PCE saturations after 310 s for pattern P-2 at the horizontal and vertical centerlines for cases R1, H1,H2 and H3.

( )B. Ataie-Ashtiani et al.rJournal of Contaminant Hydrology 49 2001 87–109106
Graphs R1 are viewed as representing the actual average behavior of our system andother graphs are compared to them. First, consider graphs R1 and R2. Although theforms of saturation contours are similar, the maximum saturation in R2 is much higher.This is the same result that was observed in Figs. 5 and 6 and was discussed in Section5. A comparison of graphs H1 and R1 shows that if the presence of heterogeneities isignored, completely wrong results will be obtained. Neither the form of the saturationcontours nor the maximum saturation in H1 is anywhere close to those in R1. A similarconclusion is drawn from comparing graphs R1 and H2: it is evident that accounting forheterogeneity of saturated permeability is not enough. Finally, comparing all graphs, onemay conclude that graph H3, where heterogeneities in both permeability and two-phaseflow parameters are included, does a better job in mimicking the ArealB saturation
Ž .distribution in R1, especially for pattern P-1 Fig. 11 . Although the ArealB saturationdistribution cannot be reproduced exactly in any of the cases, the larger saturation
Ž .contours 25% and 30% agree reasonably well in H3 and R1. Fig. 15 shows the PCEsaturation at the horizontal and vertical centerlines of the medium with pattern P-II. Thisfigure also confirms that the H3 case gives better results and can capture the spreadingof PCE better than other cases. The main discrepancy for R1 and H3 is near the lowerboundary. In H3, the PCE front reaches the bottom faster than that in case R1. Thepooling is an artifact due to the front reaching the bottom boundary. Obviously, thechoice of comparison criteria is dependent on the problem of interest. One may use othercriteria such as the immobile saturation, the total flux of DNAPL passing a givensurface, the extent of the plume, or the total DNAPL in place. All in all, the agreementbetween results from the homogenized model and heterogeneous model may not beconsidered as completely satisfactory. The lateral spreading of PCE is underestimated bythe homogenized model while the vertical extent is overestimated.
7. Summary and conclusions
Heterogeneities in soil properties have a significant influence on the spreadingbehavior of nonaqueous liquids in soil and groundwater. Also, the presence of small-scalelenses of fine-grained sand andror clay may produce localized pools of NAPL after thespreading has stopped. However, for most practical purposes the detailed fluid distribu-tion is not of interest. One is commonly interested in more global measures andassessments of the NAPL movement. In particular, for numerical simulations, it is oftenappropriate to replace the heterogeneous medium with an equivalent homogeneousmedium. For this purpose, one has to define effective properties that incorporate theeffects of small-scale heterogeneities. In this work, we have demonstrated the feasibilityof replacing a medium containing heterogeneities with an equivalent homogeneousmedium for the case of two-phase flow. Numerical simulations were carried out with the
Ž .water–oil mode of multi-fluid flow simulator STOMP White and Oostrom, 1997 . Theability of STOMP to simulate heterogeneous media was verified through simulation of a
Ž .laboratory experiment on DNAPL infiltration, described by Kueper et al. 1989 . Thissimulation pointed out how different boundary condition specifications can influenceDNAPL infiltration results.

( )B. Ataie-Ashtiani et al.rJournal of Contaminant Hydrology 49 2001 87–109 107
For two periodic heterogeneous porous media, the upscaled saturated permeabilityŽ c r .and upscaled capillary pressure–saturation–relative permeability P –S–k relation-
ships were computed. The scale at which effective parameters may be defined wasŽ .determined based on the concept of representative elementary volume REV . Upscaled
capillary pressure–saturation curves were found to be distinctly different from thecurves for individual regions of heterogeneity. In particular, the irreducible watersaturation for the homogenized medium was found to be much larger than the corre-sponding lower-scale values. The k r–S relation was found to be directional dependentand quite sensitive to the pattern of heterogeneity. This finding contradicts the commonassumption that the relative permeability is a scalar value and independent of direction.
Ž .This result is consistent with the stochastic results of Yeh et al. 1985 , as they showedŽ .that the anisotropy ratio horizontalrvertical of effective conductivity is a function of
mean capillary pressure or mean moisture content. A similar result was obtained byŽ .Braun et al. 1998 for a stratified porous medium. To simulate the homogenized case,
the numerical model STOMP was modified to handle directional-dependence of k r–Srelation.
Numerical simulations were carried out for both heterogeneous and homogenizedrepresentations of the considered porous media. A homogenization of the intrinsicpermeability, without taking into account the multiphase flow properties of the finesand, did not provide acceptable results. In particular, the spreading pattern of PCE isnot simulated well. The closest results to the detailed heterogeneous model were
Žobtained with the fully homogenized model with both intrinsic and multiphase flow.properties upscaled . Nevertheless, the results are not completely satisfactory. In particu-
lar, the lateral spreading of PCE is underestimated and the vertical extent is overesti-mated. It is obvious that the upscaling of multiphase flow properties is not trivial. Thenonlinearities inherent to multiphase flow are the main source of difficulty. Another veryimportant issue is that in our simulations, we have assumed that the governing equationsat lower and upper scales are exactly the same. This may be another source ofdisagreement between homogenized and heterogeneous simulation results. Thus, inaddition to searching for more elaborate procedures for upscaling of the medium andflow properties, one should investigate the possible need for modification of the
Ž .governing equations at the larger scale. For example, Panfilov 1998 has shown,through mathematical homogenization, that for a medium similar to P-2, the upscaledP c–S relationship has to be replaced with a dynamic relationship. Similar modificationsmay be needed for other terms in the governing equations.
Although we have focussed on a periodic heterogeneous medium in this study, ourmethodology is applicable to other forms of heterogeneous media. In particular, theprocedure for the identification of a REV can be used for randomly heterogeneous orlayered media as well.
Acknowledgements
A 1-year Visiting Research Fellowship provided by the Delft University of Technol-ogy to B. Ataie-Ashtiani is greatly appreciated. Also, this work has been supported in

( )B. Ataie-Ashtiani et al.rJournal of Contaminant Hydrology 49 2001 87–109108
part by the NATO Scientific Affairs and Environmental Division under grantCRG950230, the U.S. National Science Foundation under grant EAR-9805376, the U.S.
Ž .Department of Energy DOE under grant DE-FG07-96ER14703, and the Delft Univer-sity of Technology through a Visiting Faculty appointment provided to M.A. Celia.Pacific Northwest National Laboratory is operated for DOE by Battelle MemorialInstitute.
References
Amazine, B., Bourgeat, A., Kobbe, J., 1991. Numerical simulation and homogenisation of two-phase flow inheterogeneous porous media. Trans. Porous Media 6, 519–547.
Barker, J.W., Thibeau, S., 1997. A critical review of the use of pseudorelative permeabilities for upscaling.SPE Reservoir Eng. 12, 138–143.
Bear, J., 1972. Dynamics of Fluids in Porous Media. American Elsevier, New York, NY, 764 pp.Beliaev, A.Yu., Kozlov, S.M., 1993. Hierarchical structures and estimates for homogenized coefficients. Russ.
J. Math. Phys. 1, 5–18.Bourgeat, A., Hidani, A., 1995. Effective model of two-phase flow in a porous medium made of different rock
types. Appl. Anal. 58, 1–29.Braun, C., Hassanizadeh, S.M., Helmig, R., 1998. Two-phase flow in stratified porous media: effective
parameters and constitutive relationships. Proceedings of the International Conference ComputationalMethods in Water Resources, Crete, Greece, 15–19 June, 1998. pp. 43–50.
Brooks, R.H., Corey, A.T., 1964. Hydraulic properties of porous media. Hydrol. Pap. 3, Civ. Eng. Dep., Colo.State Univ., Fort Collins.
Burdine, N.T., 1953. Relative permeability calculations from pore-size distribution data. Pet. Trans. 198,71–77.
Christie, M.A., 1996. Upscaling for reservoir simulation. J. Pet. Technol. 48, 1004–1010.Desbarats, A.J., 1995. Upscaling capillary pressure–saturation curves in heterogeneous porous media. Water
Resour. Res. 31, 281–288.Durlofsky, L.J., 1991. Numerical calculation of equivalent grid block permeability tensors for heterogeneous
porous media. Water Resour. Res. 27, 699–708.Durlofsky, L.J., Jones, R.C., Milliken, W.J., 1997. A nonuniform coarsening approach for the scale-up
displacement processes in heterogeneous porous media. Adv. Water Resour. 20, 335–347.Fayers, F.J., Hewett, T.A., 1992. A review of current trends in petroleum reservoir description and assessment
of the impacts on oil recovery. Adv. Water Resour. 15, 341–365.Ferrand, L.A., Celia, M.A., 1992. The effect of heterogeneity on the drainage capillary pressure–saturation
relation. Water Resour. Res. 28, 859–870.Haldorsen, H.H., 1986. Simulator parameter assignment and the problem of scale in reservoir engineeirng. In:
Ž .Lake, L.W., Carroll, H.B. Jr. Eds. , Reservoir Characterization. Academic Press, Orlando, FL, pp.293–340.
Helmig, R., 1997. Multiphase Flow and Transport Processes in the Subsurface. Springer-Verlag, Berlin.Honarpour, M.M., Cullick, A.S., Saad, N., Humphreys, N.V., 1995. Effect of rock heterogeneity on relative
permeability: implications for scaleup. J. Pet. Technol. 47, 980–986.King, P.R., 1989. The use of renormalization for calculating effective permeability. Transp. Porous Media 4,
37.King, P.R., Muggeridge, A.H., Price, W.G., 1993. Renormalization calculations of immiscible flow. Transp.
Porous Media 12, 237.Kueper, B.H., Frind, E.O., 1991. Two-phase flow in heterogeneous porous media: 1. Model development.
Water Resour. Res. 27, 1049–1057.Kueper, B.H., Abbot, W., 1989. Experimental observations of multiphase flow in heterogeneous porous media.
J. Contam. Hydrol. 5, 83–95.

( )B. Ataie-Ashtiani et al.rJournal of Contaminant Hydrology 49 2001 87–109 109
Miller, C.T., Christakos, G., Imhoff, P.T., McBride, J.F., Pedit, J.A., 1998. Multiphase flow and transportmodeling in heterogeneous porous media: challenges and approaches. Adv. Water Resour. 21, 77–120.
Mualem, Y., 1976. A new model for predicting the hydraulic conductivity of unsaturated porous media. WaterResour. Res. 12, 513–522.
Oostrom, M., Lenhard, R.J., 1998. Comparison of relative permeability–saturation–pressure parametricmodels for infiltration and redistribution of a light nonaqueous phase liquid in sandy porous media. Adv.Water Resour. 21, 145–157.
Oostrom, M., Hofstee, C., Dane, J.H., 1997. Light nonaqueous-phase liquid movement in a variably saturatedsand. Soil Sci. Soc. Am. J. 61, 1547–1554.
Panfilov, M., 1998. Up-scaling two-phase flow in double porosity media: non-uniform homogenization. In:Ž .Crolet, J.M., Hatri, M.E. Eds. , Recent Advances in Problems of Flow and Transport in Porous Media.
Kluwer Academic Publishing, Dordrecht, The Netherlands, pp. 195–215.Renard, Ph., de Marsily, G., 1997. Calculating equivalent permeability: a review. Adv. Water Resour. 20,
253–278.Schroth, M.H., Istok, J.D., Selker, J.S., Oostrom, M., White, M.D., 1998. Multifluid flow in bedded porous
media: laboratory experiments and numerical simulations. Adv. Water Resour. 22, 169–183.van Genuchten, M.Th., 1980. A closed-form equation for predicting the hydraulic conductivity of unsaturated
soils. Soil Sci. Soc. Am. J. 44, 892–898.Wen, X., Gomez-Hernanadez, J.J., 1996. Upscaling hydraulic conductivities in heterogeneous media: an
overview. J. Hydrol. 183, ix–xxxii.White, M.D., Oostrom, M., 1997. STOMP, Subsurface Transport Over Multiple Phases. User’s Guide. Pacific
Northwest National Laboratory Report PNNL-11218.Yeh, T.-C., Gelhar, L.W., Gutjahr, A.L., 1985. Stochastic analysis of unsaturated flow in heterogeneous soils:
3. Observations and applications. Water Resour. Res. 21, 465–471.