
Effect of Various Parameters on Emission Factors of Gas …€¦ · · 2018-05-06Effect of...
8
59 Iranian Journal of Chemical Engineering Vol. 11, No. 3 (Summer 2014), IAChE Effect of Various Parameters on Emission Factors of Gas Flares D. Kahforoushan 1*, J. Bezaatpour 2 , E. Fatehifar 3 1- Environmental Engineering Research Center (EERC), Faculty of Chemical Engineering, Sahand University of Technology, Tabriz 2- Environmental Engineering Research Center (EERC), Faculty of Chemical Engineering 3- Sahand University of Technology, Tabriz, Iran Abstract The purpose of this study is development of some parametric emission factors for gas flares using pilot-scale flare and investigation of the effect and interaction of important parameters on the emission factors. The considered parameters were flame Reynolds number, superheat steam-air flow rate and wind speed. Every variable was considered in four levels and the experiments were carried out two times. The results of 128 experiments showed that the average emission factors of CO 2 , CO and NO x pollutants are 127.183, 0.731 and 0.074 lb/MMBtu (pound per Million British thermal unit), respectively. In addition, variance analysis of variables showed that the CO 2 and CO emission factors are significantly influenced by wind flow and NO x emission factor is influenced by superheat steam-air flow rate. Keywords: Gas Flares, Emission Factors, CO 2 , CO, NO x 1. Introduction ∗ Flaring is a high-temperature oxidation process used to burn combustible components, mostly hydrocarbons, of waste gases from industrial operations. Natural gas, propane, ethylene, propylene, butadiene and butane constitute over 95 percent of the waste gases flared [1]. Emission of gases from flares into the air significantly affects the environment ecologically and economically. Since in gas flares the flame is on top of the flare and also because of their high altitude conventional emission ∗ Corresponding author: [email protected] measurement techniques are not applicable for direct determination of outlet contaminants. Therefore, emission factor method is used to estimate the amount of pollutants emitted from gas flares [2]. Emission factors are representative values that attempt to relate the quantity of a pollutant released to the ambient air with an activity associated with the release of that pollutant [3]. Unfortunately, there is a relatively high uncertainty in implementation of emission factors reported in literature for flares [4-9]. Therefore, it is necessary to revise the emission factor gas flares, especially taking combustion influencing
Transcript of Effect of Various Parameters on Emission Factors of Gas …€¦ · · 2018-05-06Effect of...
59
Iranian Journal of Chemical Engineering Vol. 11, No. 3 (Summer 2014), IAChE
Effect of Various Parameters on Emission
Factors of Gas Flares
D. Kahforoushan1*, J. Bezaatpour2, E. Fatehifar3
1- Environmental Engineering Research Center (EERC), Faculty of Chemical Engineering, Sahand University of Technology, Tabriz
2- Environmental Engineering Research Center (EERC), Faculty of Chemical Engineering
3- Sahand University of Technology, Tabriz, Iran
Abstract The purpose of this study is development of some parametric emission factors for gas flares using pilot-scale flare and investigation of the effect and interaction of important parameters on the emission factors. The considered parameters were flame Reynolds number, superheat steam-air flow rate and wind speed. Every variable was considered in four levels and the experiments were carried out two times. The results of 128 experiments showed that the average emission factors of CO2, CO and NOx pollutants are 127.183, 0.731 and 0.074 lb/MMBtu (pound per Million British thermal unit), respectively. In addition, variance analysis of variables showed that the CO2 and CO emission factors are significantly influenced by wind flow and NOx emission factor is influenced by superheat steam-air flow rate. Keywords: Gas Flares, Emission Factors, CO2, CO, NOx
1. Introduction∗ Flaring is a high-temperature oxidation process used to burn combustible components, mostly hydrocarbons, of waste gases from industrial operations. Natural gas, propane, ethylene, propylene, butadiene and butane constitute over 95 percent of the waste gases flared [1]. Emission of gases from flares into the air significantly affects the environment ecologically and economically. Since in gas flares the flame is on top of the flare and also because of their high altitude conventional emission
∗ Corresponding author: [email protected]
measurement techniques are not applicable for direct determination of outlet contaminants. Therefore, emission factor method is used to estimate the amount of pollutants emitted from gas flares [2]. Emission factors are representative values that attempt to relate the quantity of a pollutant released to the ambient air with an activity associated with the release of that pollutant [3]. Unfortunately, there is a relatively high uncertainty in implementation of emission factors reported in literature for flares [4-9]. Therefore, it is necessary to revise the emission factor gas flares, especially taking combustion influencing
60
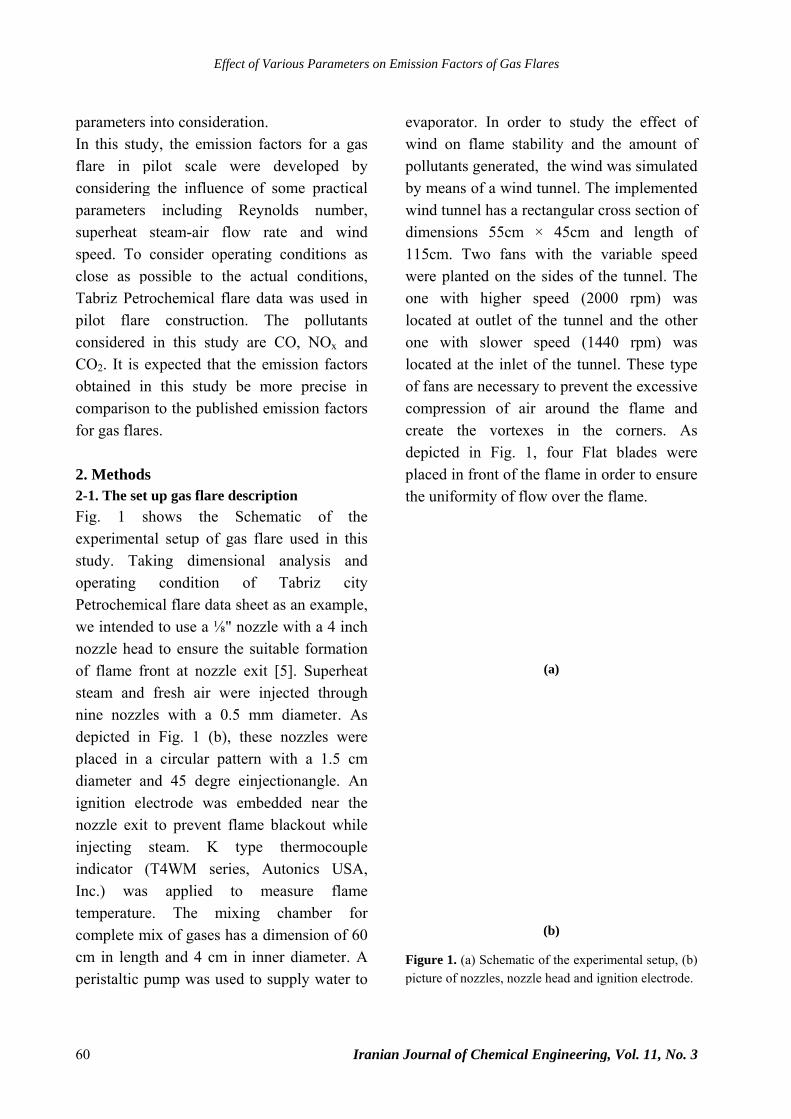
parametersIn this stuflare in pconsideringparameterssuperheat speed. To close as pTabriz Petpilot flarconsideredCO2. It is obtained icomparisonfor gas flar 2. Method2-1. The setFig. 1 sexperimentstudy. Taoperating Petrochemwe intendenozzle heaof flame fsteam andnine nozzldepicted inplaced in diameter aignition elnozzle exiinjecting indicator Inc.) wastemperaturcomplete mcm in lengperistaltic
E
s into considudy, the empilot scaleg the influs includin
steam-air consider o
possible to trochemicale construc
d in this stexpected th
in this studn to the pubres.
ds t up gas flarshows thetal setup of
aking dimecondition
mical flare daed to use a ⅛ad to ensurefront at nozd fresh air les with a n Fig. 1 (ba circular
and 45 deglectrode wt to prevensteam. K(T4WM ss applied re. The mix of gasegth and 4 cpump was
Effect of Vario
deration. mission factoe were deence of somg Reynoldflow rate
operating cthe actual
flare data ction. Thetudy are COhat the emidy be moreblished emi
re descriptioe Schematf gas flare ensional an of Tata sheet as⅛" nozzle we the suitabzzle exit [5
were injec0.5 mm d
b), these npattern wit
gre einjectias embedd
nt flame blaK type thseries, Aut
to meamixing chs has a dim
cm in inner used to sup
ous Paramete
I
ors for a gaeveloped bme practicads numbe
e and winconditions al conditionwas used i
e pollutantO, NOx anssion factore precise iission factor
on tic of thused in thi
analysis anTabriz cit an examplewith a 4 incble formatio5]. Superheacted througdiameter. Anozzles werth a 1.5 cmonangle. A
ded near thackout whilhermocouplonics USA
asure flamhamber fo
mension of 6diameter. A
pply water t
ers on Emissio
Iranian Jour
as by al
er, nd as s, in ts
nd rs in rs
he is
nd ty e,
ch on at
gh As re m
An he le le A, me or 60 A to
evapwinpollby mwindim115werone locaone locaof facomcreadepiplacthe u
Figupictu
on Factors of
rnal of Chem
porator. In nd on flamelutants genemeans of a w
nd tunnel hamensions 55
cm. Two fre planted o
with higated at outl
with slowated at the ifans are necempression oate the voicted in Ficed in front uniformity
ure 1. (a) Scheure of nozzles
Gas Flares
mical Engine
order to se stability aerated, the wwind tunnes a rectangu5cm × 45cfans with
on the sidesher speed et of the tuwer speed inlet of the essary to prof air arouortexes in ig. 1, fourof the flamof flow ove
(a)
(b)
ematic of the , nozzle head
eering, Vol.
study the eand the amwind was sil. The implular cross secm and lethe variabl
s of the tun(2000 rpm
unnel and t(1440 rp
tunnel. Threvent the eund the fla
the cornr Flat blad
me in order ter the flame
experimental and ignition e
11, No. 3
effect of mount of imulated emented ection of ength of le speed nel. The m) was he other m) was
hese type xcessive
ame and ners. As des were to ensure .
setup, (b) electrode.
Kahforoushan, Bezaatpour, Fatehifar
Iranian Journal of Chemical Engineering, Vol. 11, No. 3 61
A mixture of Methane, ethane, propane, butane, ethylene, propylene and nitrogen was used as a fuel gas. This combination was chosen based on analysis of supplied gases to Tabriz petrochemical flare as an average of flare gas composition in three-month period. Chemical analysis of flared gas is presented in Table 1. An IR-Analyzer device (Vario plus Industrial, MRU instruments, Inc.) was used to measure pollutants concentrations. Simulated wind velocity was measured and recorded by a digital anemometer. 2-2. Experimental design method In this study, we used experiment design prior to proceeding with experiments in order to investigate the effect of each parameter on the amount of pollutant emission. Design Expert software version 7.0.0 (Stat-Ease, Inc.) was used for the design and analysis of experiments. By considering general full factorial design, it is concluded that 2×43 tests are required. These experiments were carried out on a complete random order without blocking. Each experiment was replicated once more in order to verify the precision of the results and
to calculate error sum of squares (SS error). To study the effect of input variables on CO2, NOx and CO concentration, statistical F-Test and P-value procedure were employed. As a result, parameter with P-value less than 0.05 had a significant influence on the out put results. The closer the P-value to zero, the more effective the related parameter is. If there are two input variables with the same P-value, the one with larger F-value has more effect on the response [10]. The effective parameters in the present study are Reynolds number, wind speed and superheat steam-air (at 140oC) flow rate [2]. Reynolds number is used herein because of analysis of turbulency in flame zone. In high flame speed, according to high Reynolds number, the mixing rate of fuel gas and air is better. Thus, combustion efficiency increases because of turbulency. Similarly, the steam injection to flame, in addition to increasing mixing rate, can effectively reduce the flame temperature, which leads to NOx reduction. Four levels were specified for each input parameter in DX7 software. The considered parameters and their levels are shown in Table 2.
Table 1. The analysis of fuel gas used in experiments.
Molecular weight (g/mol)
Mass fraction Mole fraction
(%) Molecular Formula
Gases
16.043 0.1011 20 CH4 Methane
30.069 0.0473 5 C2H
6 Ethane
44.096 0.0694 5 C3H
8 Propane
58.123 0.2745 15 C4H
10 Butane
28.054 0.1325 15 C2H
4 Ethylene
42.080 0.0662 5 C3H
6 Propylene
28.013 0.3087 35 N2 Nitrogen
Effect of Various Parameters on Emission Factors of Gas Flares
62 Iranian Journal of Chemical Engineering, Vol. 11, No. 3
Table 2. The level and ranges of considered factors in experiments
Level 4 Level 3 Level 2 Level 1 Parameters
5000 4000 3000 2000 Reynolds number
0.9 0.6 0.3 0.0 Wind speed (m/s)
2200 1800 1400 1000 Superheat steam-air (cc/min)
EPA method 19 was used to calculate emission factors of pollutants based on lb/MMBtu unit (pound per million British thermal unit) according to Equation 2 [11]:
CorrectionCorrectionppb OxygenT
)V(MwFC
EF ×××
××= 910
(1)
Where EF is Emission factor in lb/MMBtu of pollutant. Cppb is pollutant concentration in ppb (part per billion based on dry volume). Mw is molecular weight of the CO2 (lb/lb-mole). V is volume occupied by 1 mole of ideal gas at standard temperature and pressure (385.5 ft3/lb-mole @ 68 °F and 1 atm) and F is the factor defined as the ratio of gas volume of the products of combustion to the heat content of the fuel. F includes all components of combustion excluding water. In this study, F was provided from EPA reference method 19 as an average for natural gas (8710 dscf/MMBtu- dry standard cubic feet per million Btu) determined at standard conditions (20oC and 1 atm). To correct F Factor according to temperature (to 68oF) and oxygen correction (to 0% O2) the following equations were used.
)460(528
RTRT Correction οο
ο
+=
(2)
)%9.209.20(
2OOxygen Correction −
= (3)
Where T oR Rankine degree is reference temperature of F factor and %O2 is percent of oxygen in exhaust by volume. The error of averaged emission factor was calculated using the following formula:
√ (4)
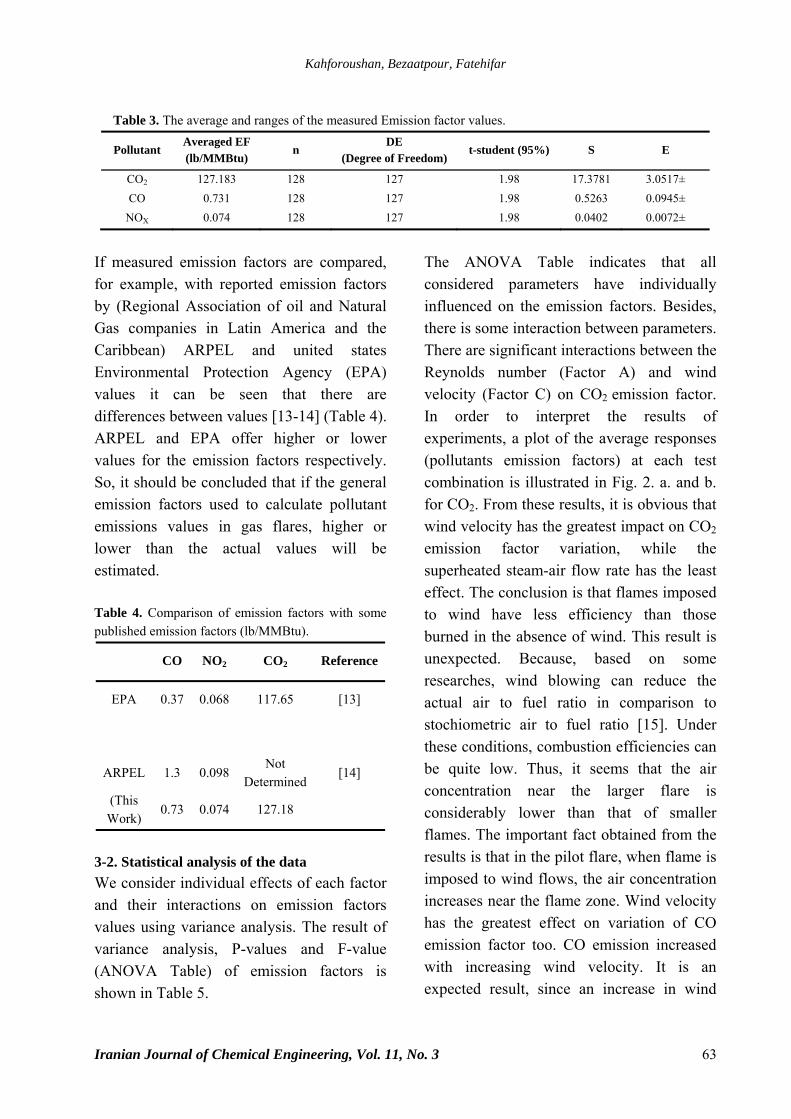
In equation 4, E is the error, n number of data, S standard deviation and t is t-value assuming 95% confidence level [12]. 3. Results and discussion 3-1. Averaged Emission factors As seen in Table 3 the average value of CO2, CO and NOx emission factors are obtained 127.183, 0.731 and 0.074 lb/MMBtu respectively. These values were calculated by averaging the results of 128 experiments. Flame Reynolds numbers were in the range of 1000-5000, superheated air-steam volume flow rates were in range of 1000-2200 cc/min with air to steam volume ratio of 1 to 4 (based on 140°C of temperature). Wind velocity varied from zero to 0.9 m/s and the flame temperature was measured in the range of 400-700°C.
Kahforoushan, Bezaatpour, Fatehifar
Iranian Journal of Chemical Engineering, Vol. 11, No. 3 63
Table 3. The average and ranges of the measured Emission factor values.
Pollutant Averaged EF (lb/MMBtu)
n DE
(Degree of Freedom) t-student (95%) S E
CO2 127.183 128 127 1.98 17.3781 3.0517± CO 0.731 128 127 1.98 0.5263 0.0945±
NOX 0.074 128 127 1.98 0.0402 0.0072±
If measured emission factors are compared, for example, with reported emission factors by (Regional Association of oil and Natural Gas companies in Latin America and the Caribbean) ARPEL and united states Environmental Protection Agency (EPA) values it can be seen that there are differences between values [13-14] (Table 4). ARPEL and EPA offer higher or lower values for the emission factors respectively. So, it should be concluded that if the general emission factors used to calculate pollutant emissions values in gas flares, higher or lower than the actual values will be estimated. Table 4. Comparison of emission factors with some published emission factors (lb/MMBtu).
Reference CO2 NO2 CO
[13] 117.65 0.068 0.37 EPA
[14] Not
Determined 0.098 1.3 ARPEL
127.18 0.074 0.73 (This
Work)
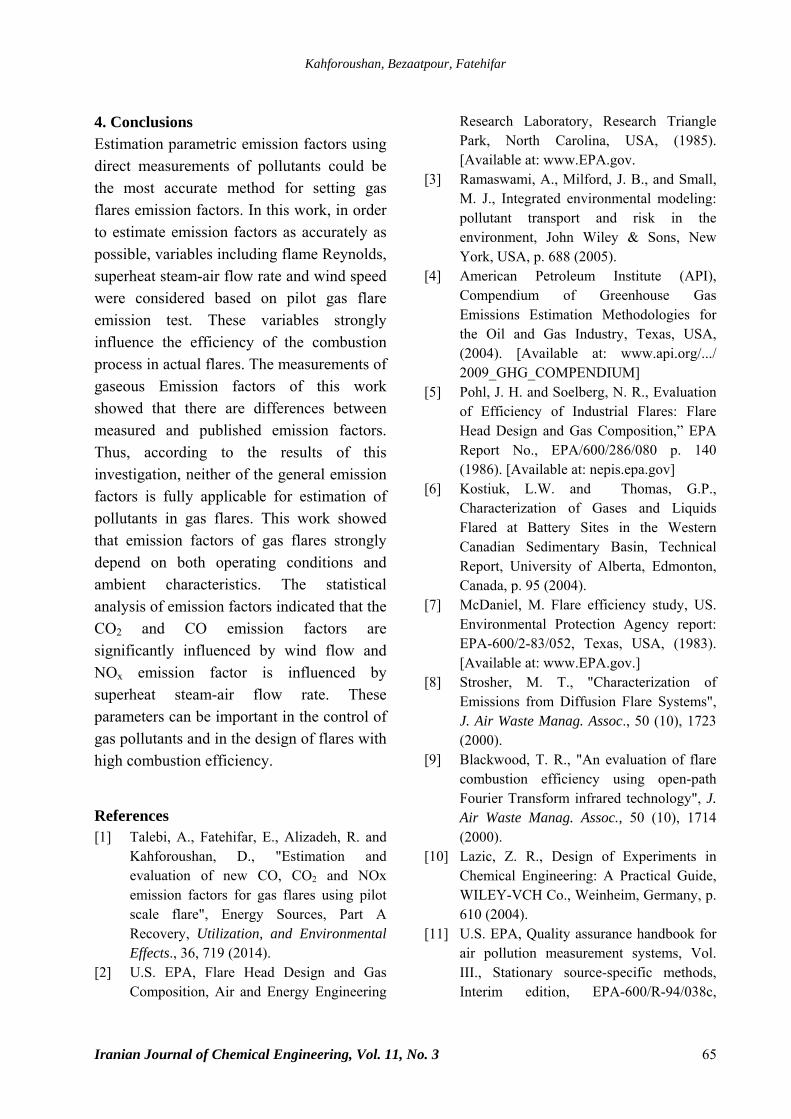
3-2. Statistical analysis of the data We consider individual effects of each factor and their interactions on emission factors values using variance analysis. The result of variance analysis, P-values and F-value (ANOVA Table) of emission factors is shown in Table 5.
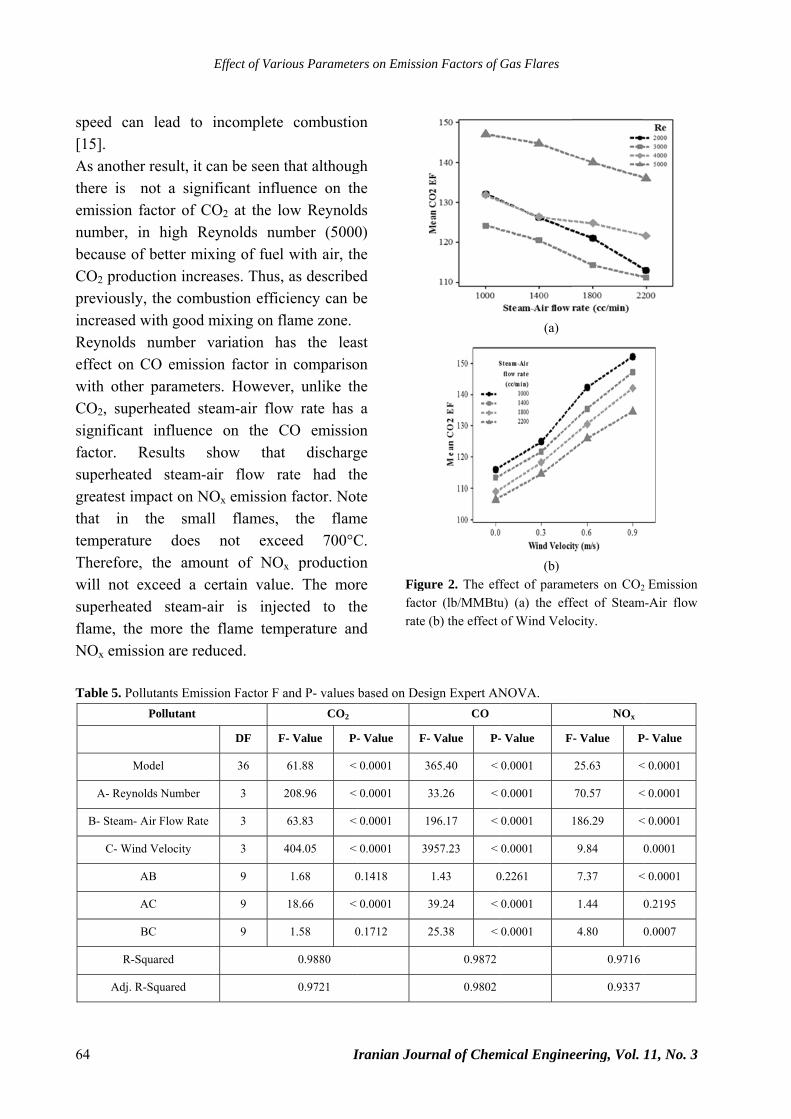
The ANOVA Table indicates that all considered parameters have individually influenced on the emission factors. Besides, there is some interaction between parameters. There are significant interactions between the Reynolds number (Factor A) and wind velocity (Factor C) on CO2 emission factor. In order to interpret the results of experiments, a plot of the average responses (pollutants emission factors) at each test combination is illustrated in Fig. 2. a. and b. for CO2. From these results, it is obvious that wind velocity has the greatest impact on CO2 emission factor variation, while the superheated steam-air flow rate has the least effect. The conclusion is that flames imposed to wind have less efficiency than those burned in the absence of wind. This result is unexpected. Because, based on some researches, wind blowing can reduce the actual air to fuel ratio in comparison to stochiometric air to fuel ratio [15]. Under these conditions, combustion efficiencies can be quite low. Thus, it seems that the air concentration near the larger flare is considerably lower than that of smaller flames. The important fact obtained from the results is that in the pilot flare, when flame is imposed to wind flows, the air concentration increases near the flame zone. Wind velocity has the greatest effect on variation of CO emission factor too. CO emission increased with increasing wind velocity. It is an expected result, since an increase in wind
64
speed can[15]. As anotherthere is nemission fnumber, inbecause ofCO2 produpreviouslyincreased wReynolds effect on Cwith otherCO2, supesignificant factor. Rsuperheategreatest imthat in temperaturTherefore, will not esuperheateflame, the NOx emiss Table 5. Poll
M
A- Reyno
B- Steam- A
C- Wind
A
A
B
R-Sq
Adj. R
E
n lead to i
r result, it canot a signifactor of COn high Ref better mixuction increa, the combuwith good mnumber v
CO emissior parameterrheated ste influence
Results shed steam-aimpact on NO
the smallre does
the amouexceed a ceed steam-a
more the sion are redu
lutants EmissiPollutant
Model
olds Number
Air Flow Rate
d Velocity
AB
AC
BC
quared
-Squared
Effect of Vario
incomplete
an be seen tficant influO2 at the loeynolds numxing of fuel ases. Thus, ustion efficimixing on flvariation haon factor inrs. Howeveream-air flow
on the Chow that ir flow ra
Ox emissionl flames,
not exceunt of NOx
ertain valueir is injecflame temp
uced.
ion Factor F a
DF F-
36
3 2
3
3 4
9
9
9
ous Paramete
I
combustio
that althouguence on thow Reynoldmber (5000with air, thas describeiency can blame zone. as the lean comparisor, unlike thw rate has CO emissio
dischargate had thn factor. Not
the flameed 700°Cx productioe. The morcted to thperature an
and P- valuesCO2
- Value P-
61.88 <
208.96 <
63.83 <
404.05 <
1.68 0
18.66 <
1.58 0
0.9880
0.9721
ers on Emissio
Iranian Jour
on
gh he ds 0) he ed be st
on he
a on ge he te
me C. on re he nd
Figufactorate
based on Des
- Value F-
0.0001 3
0.0001 3
0.0001 1
0.0001 39
0.1418
0.0001 3
0.1712 2
on Factors of
rnal of Chem
ure 2. The effor (lb/MMBtu(b) the effect
ign Expert ANCO
- Value P-
365.40 <
33.26 <
196.17 <
957.23 <
1.43 0
39.24 <
25.38 <
0.9872
0.9802
Gas Flares
mical Engine
(a)
(b) fect of paramu) (a) the effof Wind Velo
NOVA.
- Value F
0.0001
0.0001
0.0001
0.0001
0.2261
0.0001
0.0001
eering, Vol.
meters on CO2
fect of Steamocity.
NOx
F- Value P
25.63 <
70.57 <
186.29 <
9.84
7.37 <
1.44
4.80
0.9716
0.9337
11, No. 3
2 Emission m-Air flow
P- Value
< 0.0001
< 0.0001
< 0.0001
0.0001
< 0.0001
0.2195
0.0007
Kahforoushan, Bezaatpour, Fatehifar
Iranian Journal of Chemical Engineering, Vol. 11, No. 3 65
4. Conclusions Estimation parametric emission factors using direct measurements of pollutants could be the most accurate method for setting gas flares emission factors. In this work, in order to estimate emission factors as accurately as possible, variables including flame Reynolds, superheat steam-air flow rate and wind speed were considered based on pilot gas flare emission test. These variables strongly influence the efficiency of the combustion process in actual flares. The measurements of gaseous Emission factors of this work showed that there are differences between measured and published emission factors. Thus, according to the results of this investigation, neither of the general emission factors is fully applicable for estimation of pollutants in gas flares. This work showed that emission factors of gas flares strongly depend on both operating conditions and ambient characteristics. The statistical analysis of emission factors indicated that the CO2 and CO emission factors are significantly influenced by wind flow and NOx emission factor is influenced by superheat steam-air flow rate. These parameters can be important in the control of gas pollutants and in the design of flares with high combustion efficiency.
References [1] Talebi, A., Fatehifar, E., Alizadeh, R. and
Kahforoushan, D., "Estimation and evaluation of new CO, CO2 and NOx emission factors for gas flares using pilot scale flare", Energy Sources, Part A Recovery, Utilization, and Environmental Effects., 36, 719 (2014).
[2] U.S. EPA, Flare Head Design and Gas Composition, Air and Energy Engineering
Research Laboratory, Research Triangle Park, North Carolina, USA, (1985). [Available at: www.EPA.gov.
[3] Ramaswami, A., Milford, J. B., and Small, M. J., Integrated environmental modeling: pollutant transport and risk in the environment, John Wiley & Sons, New York, USA, p. 688 (2005).
[4] American Petroleum Institute (API), Compendium of Greenhouse Gas Emissions Estimation Methodologies for the Oil and Gas Industry, Texas, USA, (2004). [Available at: www.api.org/.../ 2009_GHG_COMPENDIUM]
[5] Pohl, J. H. and Soelberg, N. R., Evaluation of Efficiency of Industrial Flares: Flare Head Design and Gas Composition,” EPA Report No., EPA/600/286/080 p. 140 (1986). [Available at: nepis.epa.gov]
[6] Kostiuk, L.W. and Thomas, G.P., Characterization of Gases and Liquids Flared at Battery Sites in the Western Canadian Sedimentary Basin, Technical Report, University of Alberta, Edmonton, Canada, p. 95 (2004).
[7] McDaniel, M. Flare efficiency study, US. Environmental Protection Agency report: EPA-600/2-83/052, Texas, USA, (1983). [Available at: www.EPA.gov.]
[8] Strosher, M. T., "Characterization of Emissions from Diffusion Flare Systems", J. Air Waste Manag. Assoc., 50 (10), 1723 (2000).
[9] Blackwood, T. R., "An evaluation of flare combustion efficiency using open-path Fourier Transform infrared technology", J. Air Waste Manag. Assoc., 50 (10), 1714 (2000).
[10] Lazic, Z. R., Design of Experiments in Chemical Engineering: A Practical Guide, WILEY-VCH Co., Weinheim, Germany, p. 610 (2004).
[11] U.S. EPA, Quality assurance handbook for air pollution measurement systems, Vol. III., Stationary source-specific methods, Interim edition, EPA-600/R-94/038c,
Effect of Various Parameters on Emission Factors of Gas Flares
66 Iranian Journal of Chemical Engineering, Vol. 11, No. 3
Research Triangle Park, North Carolina, USA, (1994). [Available at: www.EPA.gov]
[12] Montgomery, D.C., Design and Analysis of Experiments, 4th Ed., Wiley, New York, USA, p. 752 (1997).
[13] Kahforoushan, D. and Fatehifar, E., "Development and evaluation of emission factors for gas turbines (multi-pollutant) in oil and gas processing plants", Energy Sources, Part A Recovery, Utilization, and Environmental Effects, 33 (4), 275 (2011).
[14] U.S. EPA, AP-42, Compilation of Air Pollutant Emission Factors, 5th ed., Vol. I, Research Triangle Park, North Carolina, USA, (2000). [Available at: www.EPA.gov]
[15] Leahey, D.M., Preston, K., and Strosher, M, "Theoretical and Observational Assessments of Flare Efficiencies", J. Air Waste Manag. Assoc., 51 (12), 1610 (2001).